Embed Size (px)
DESCRIPTION
This documents presents the new features available in the CFD meteodyn WT in version 4.5. Improvements in terms of performance and available input datafiles are presented as well as new tool like overlapping or smoothing algorithm.
Citation preview
New features in Meteodyn WT 4.5
March 2013
Release information • New input formats for topography data
• Improvement of the input data process
• New overlapping tool
• New smoothing tool
• Improvement in the Statistical graphics tools
Release information • New input formats for topography data
• Improvement of the input data process
• New overlapping tool
• New smoothing tool
• Improvement in the Statistical graphics tools
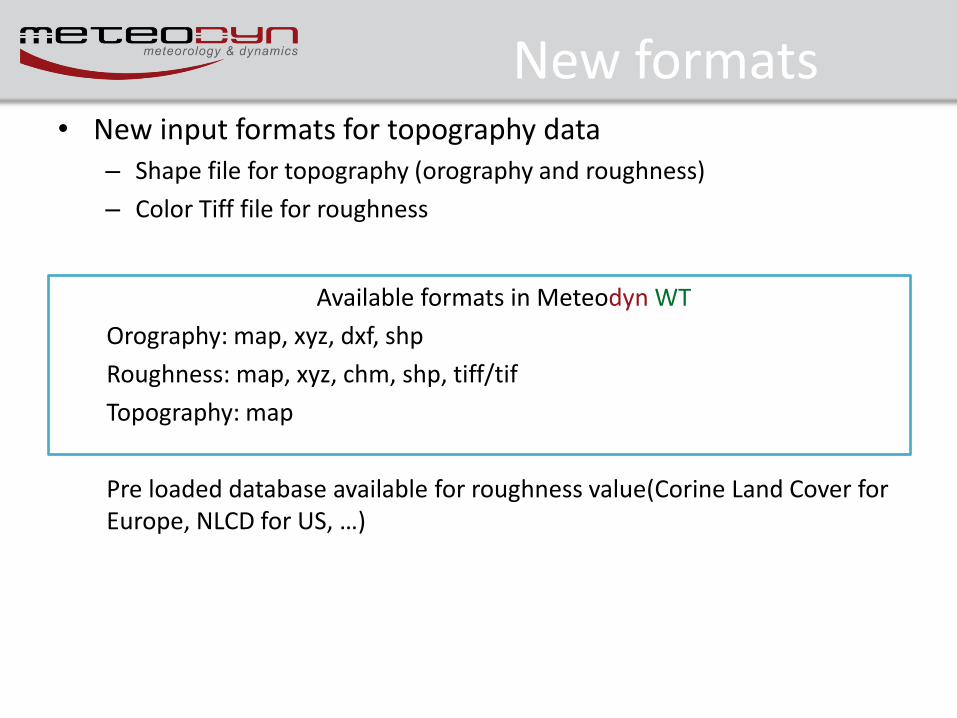
New formats • New input formats for topography data
– Shape file for topography (orography and roughness)
– Color Tiff file for roughness
Available formats in Meteodyn WT
Orography: map, xyz, dxf, shp
Roughness: map, xyz, chm, shp, tiff/tif
Topography: map
Pre loaded database available for roughness value(Corine Land Cover for Europe, NLCD for US, …)
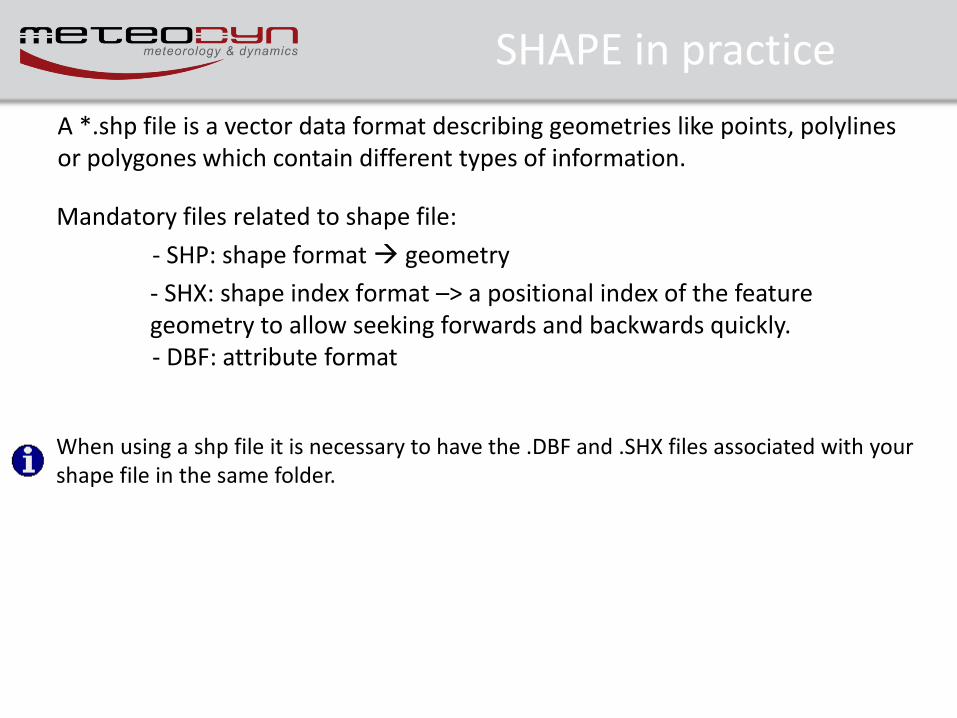
SHAPE in practice
A *.shp file is a vector data format describing geometries like points, polylines or polygones which contain different types of information.
Mandatory files related to shape file:
- SHP: shape format geometry
- SHX: shape index format –> a positional index of the feature geometry to allow seeking forwards and backwards quickly. - DBF: attribute format
When using a shp file it is necessary to have the .DBF and .SHX files associated with your shape file in the same folder.
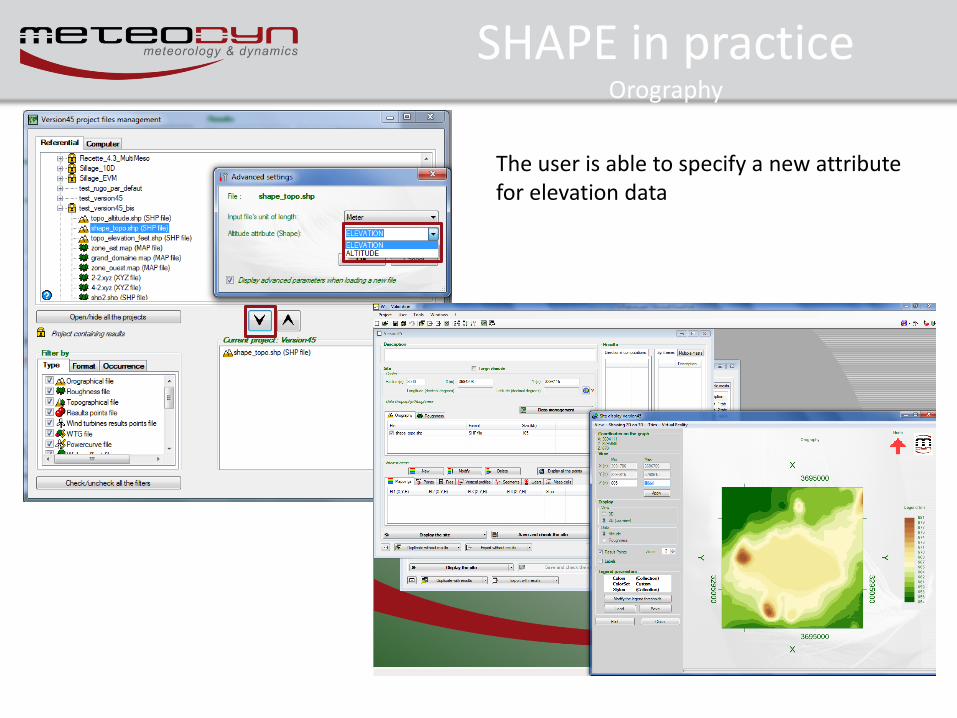
SHAPE in practice Orography
The user is able to specify a new attribute for elevation data
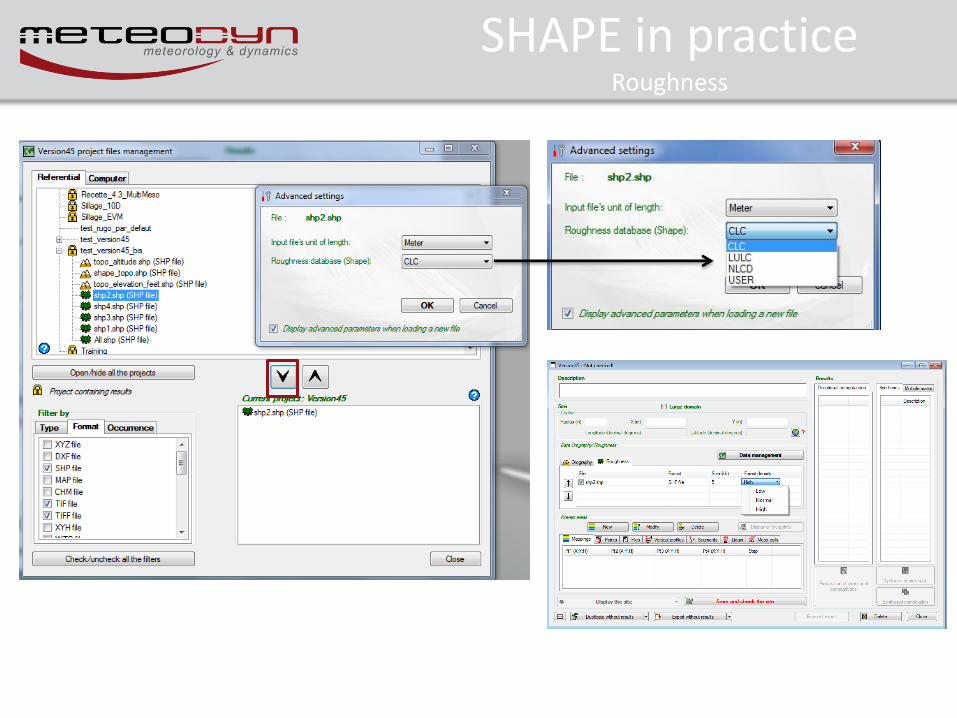
SHAPE in practice Roughness
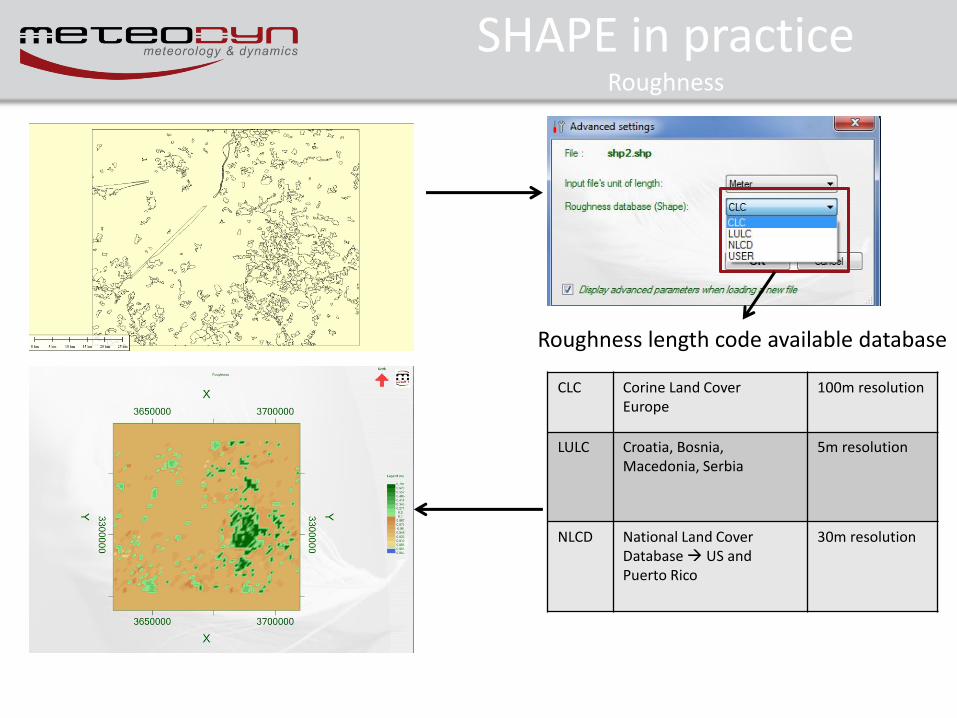
Roughness length code available database
CLC Corine Land Cover Europe
100m resolution
LULC Croatia, Bosnia, Macedonia, Serbia
5m resolution
NLCD National Land Cover Database US and Puerto Rico
30m resolution
SHAPE in practice Roughness
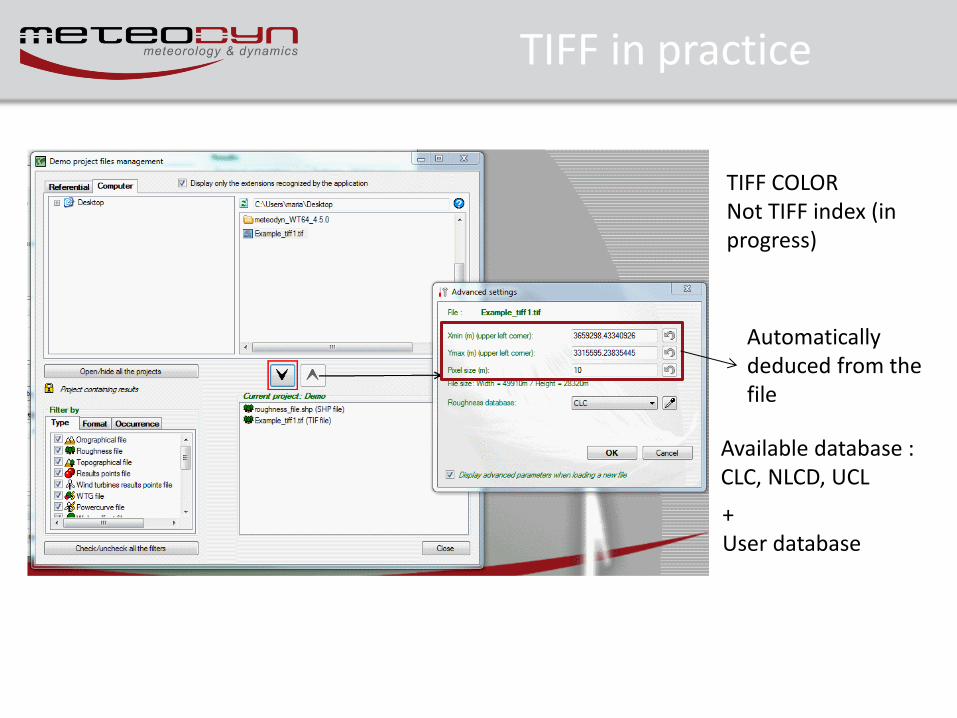
TIFF in practice
Automatically deduced from the file
Available database : CLC, NLCD, UCL
+ User database
TIFF COLOR Not TIFF index (in progress)
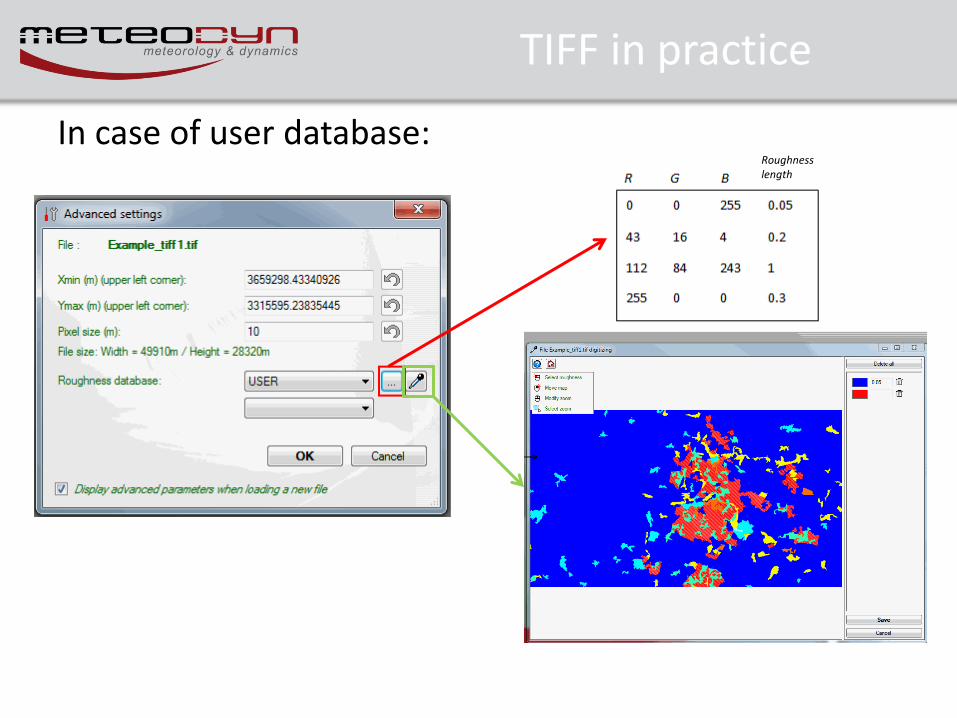
TIFF in practice
In case of user database:
Roughness length
New formats: in practice
In progress:
Global roughness database with a resolution of around 300 meters
Generated by ESA(European Spatial Agency)
Release information • New input formats for topography data
• Improvement of the input data process
• New overlapping tool
• New smoothing tool
• Improvement in the Statistical graphics tools
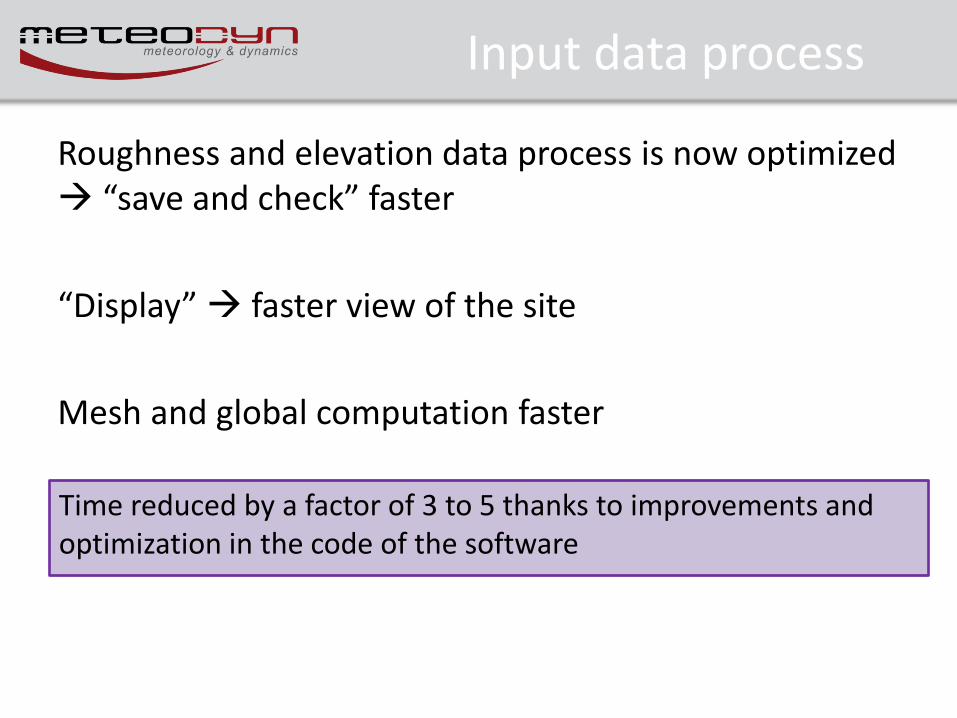
Input data process
Roughness and elevation data process is now optimized “save and check” faster
“Display” faster view of the site
Mesh and global computation faster
Time reduced by a factor of 3 to 5 thanks to improvements and optimization in the code of the software
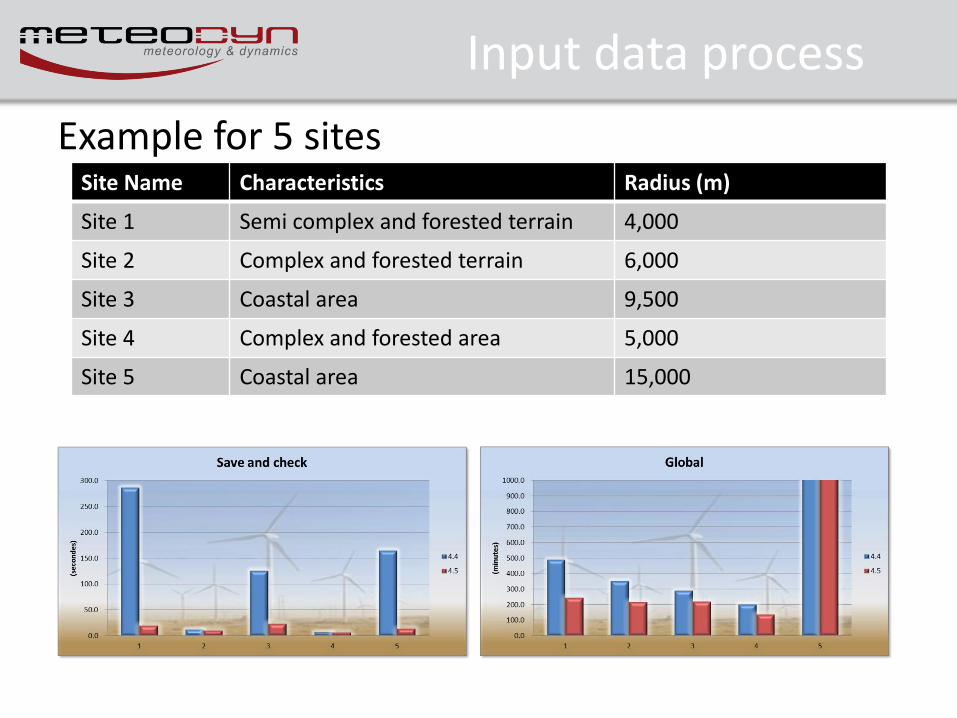
Example for 5 sites
Input data process
Site Name Characteristics Radius (m)
Site 1 Semi complex and forested terrain 4,000
Site 2 Complex and forested terrain 6,000
Site 3 Coastal area 9,500
Site 4 Complex and forested area 5,000
Site 5 Coastal area 15,000
Release information • New input formats for topography data
• Improvement of the input data process
• New overlapping tool
• New smoothing tool
• Improvement in the Statistical graphics tools
Overlapping tool
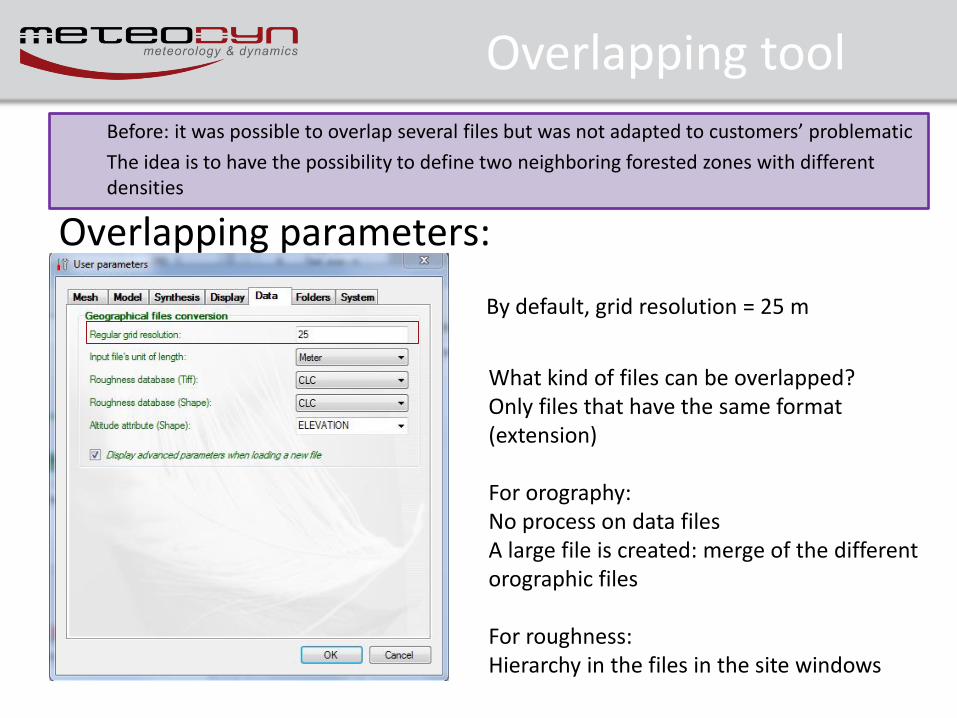
Overlapping parameters:
By default, grid resolution = 25 m
What kind of files can be overlapped? Only files that have the same format (extension) For orography: No process on data files A large file is created: merge of the different orographic files For roughness: Hierarchy in the files in the site windows
Before: it was possible to overlap several files but was not adapted to customers’ problematic
The idea is to have the possibility to define two neighboring forested zones with different densities
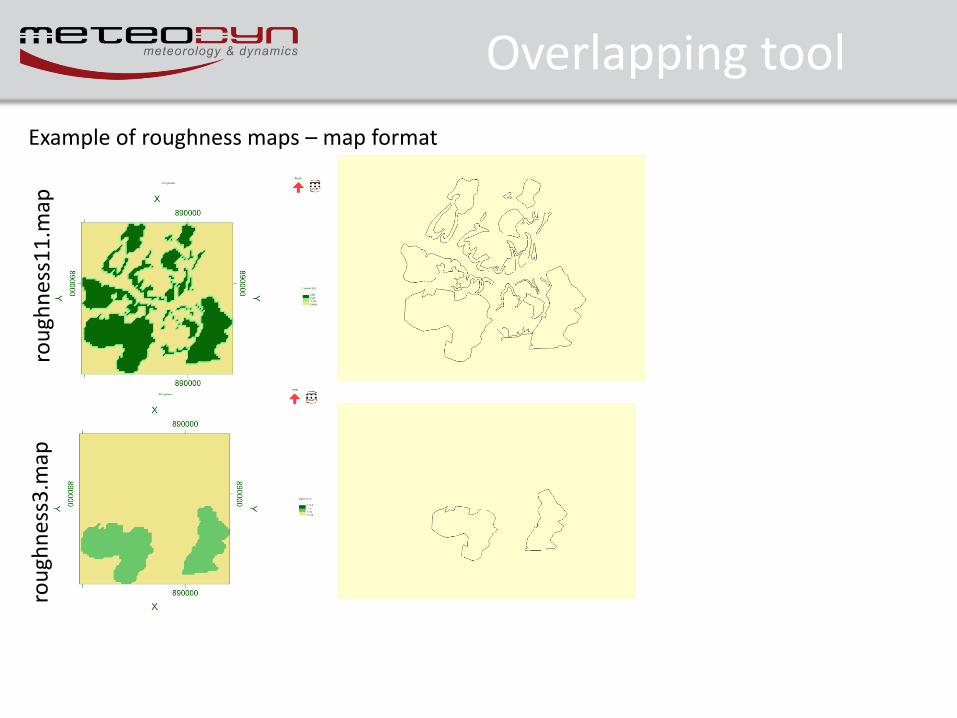
Overlapping tool
Example of roughness maps – map format
rou
ghn
ess1
1.m
ap
rou
ghn
ess3
.map
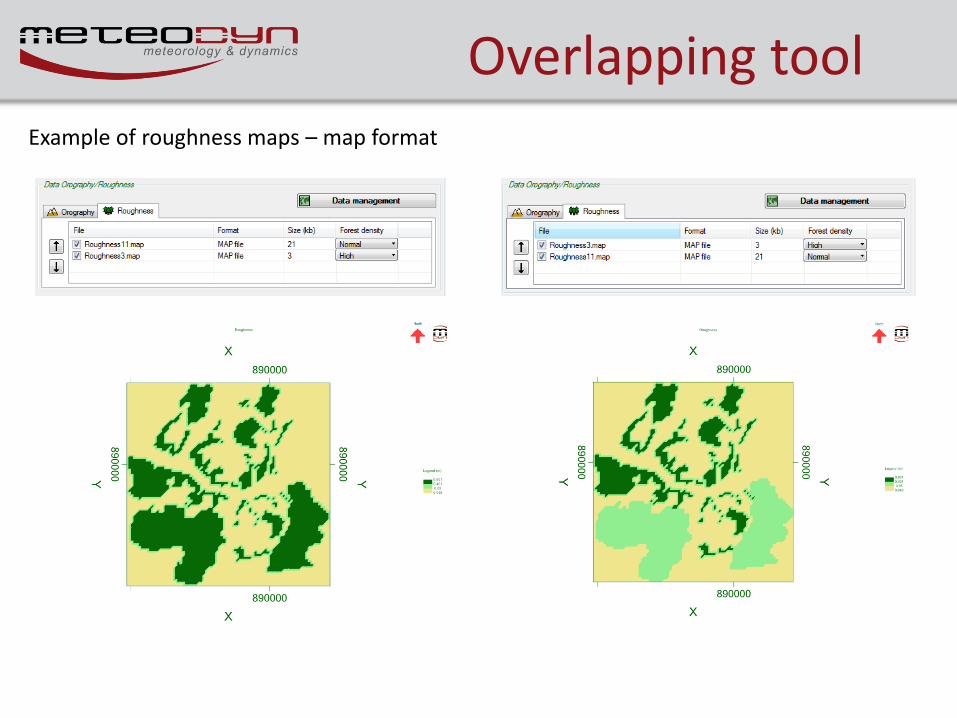
Overlapping tool Example of roughness maps – map format
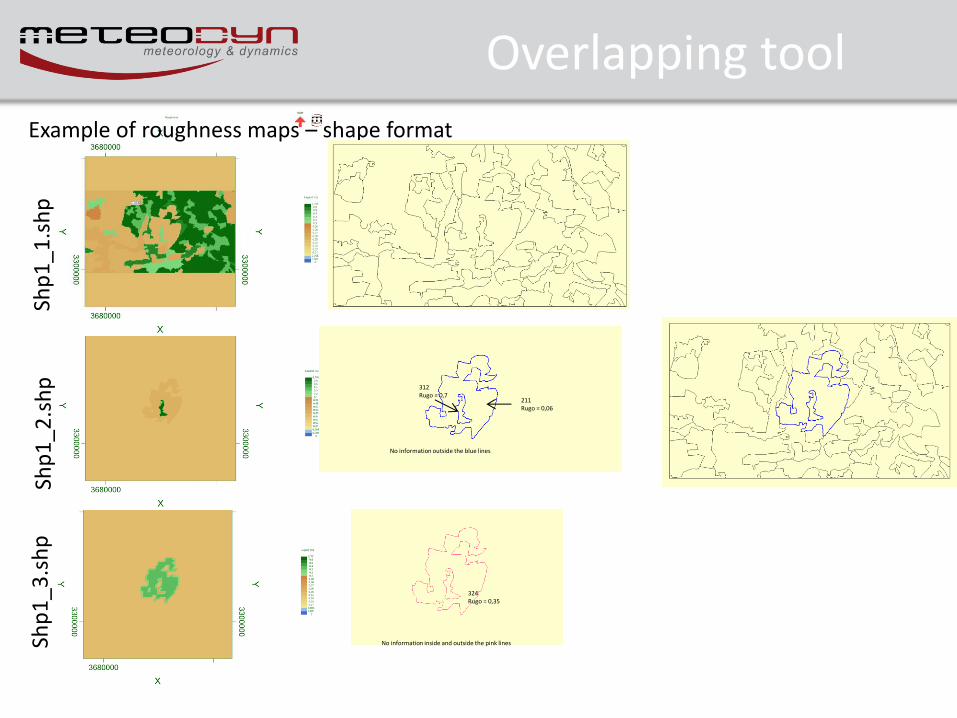
Overlapping tool
Example of roughness maps – shape format
Shp
1_1
.sh
p
Shp
1_2
.sh
p
Shp
1_3
.sh
p
324 Rugo = 0,35
No information inside and outside the pink lines
312 Rugo = 0,7
211 Rugo = 0,06
No information outside the blue lines
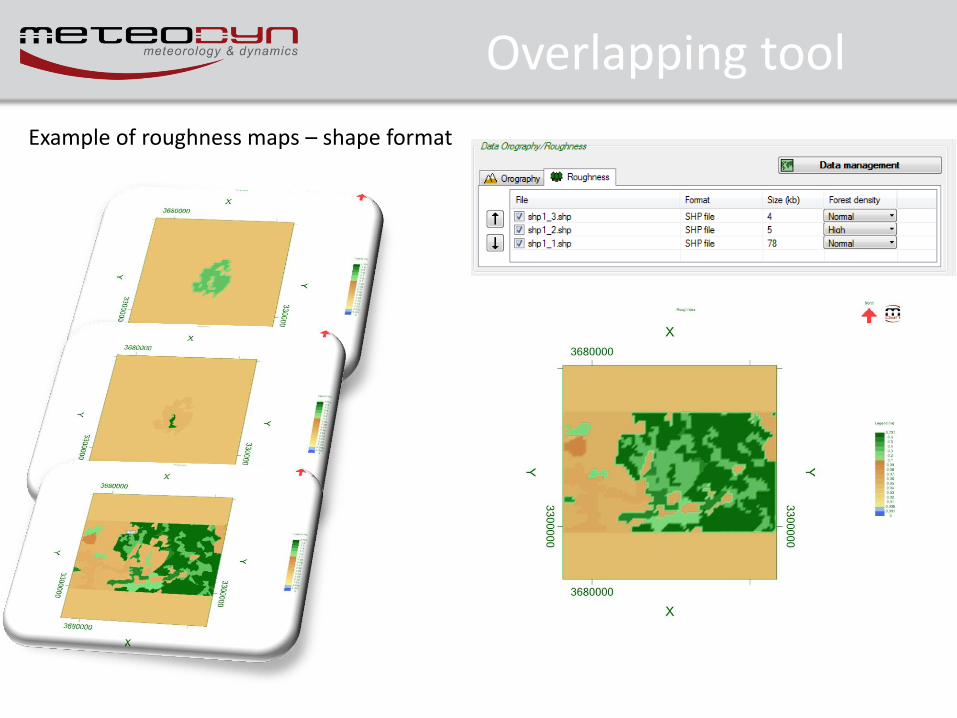
Overlapping tool
Example of roughness maps – shape format
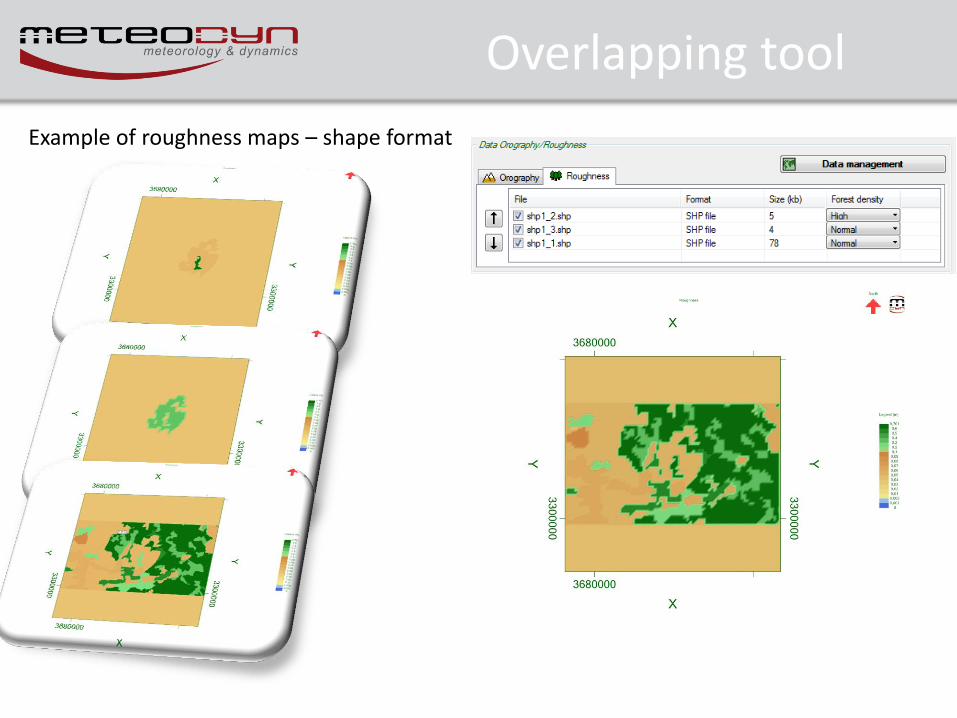
Example of roughness maps – shape format
Overlapping tool

Release information • New input formats for topography data
• Improvement of the input data process
• New overlapping tool
• New smoothing tool
• Improvement in the Statistical graphics tools
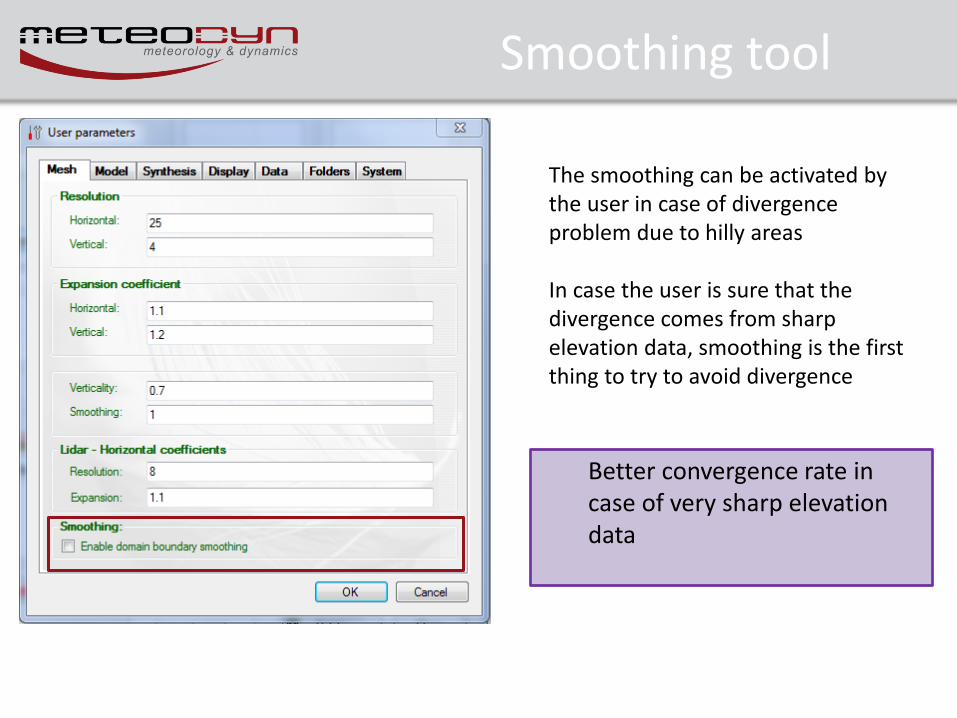
Smoothing tool
The smoothing can be activated by the user in case of divergence problem due to hilly areas In case the user is sure that the divergence comes from sharp elevation data, smoothing is the first thing to try to avoid divergence
Better convergence rate in case of very sharp elevation data
Smoothing tool
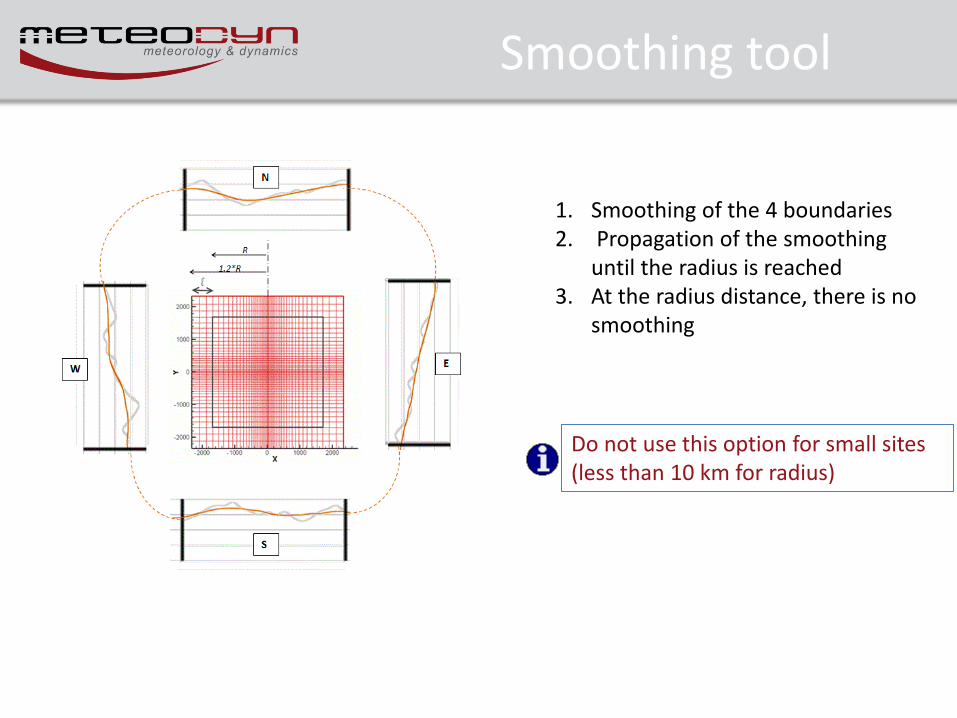
1. Smoothing of the 4 boundaries 2. Propagation of the smoothing
until the radius is reached 3. At the radius distance, there is no
smoothing
Do not use this option for small sites (less than 10 km for radius)
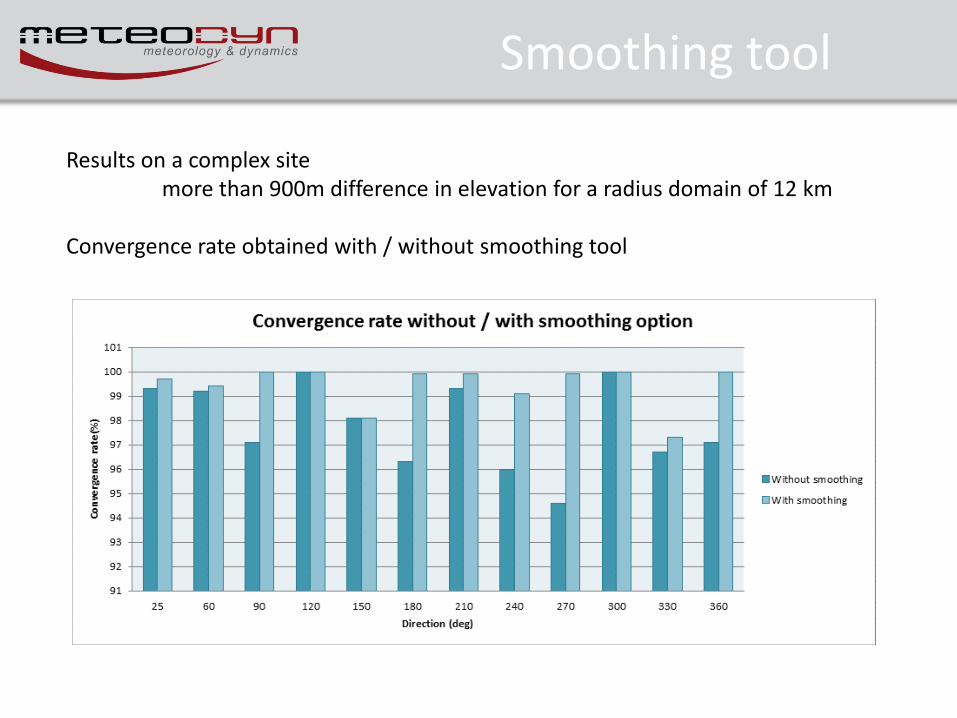
Smoothing tool
Results on a complex site more than 900m difference in elevation for a radius domain of 12 km Convergence rate obtained with / without smoothing tool
Release information • New input formats for topography data
• Improvement of the input data process
• New overlapping tool
• New smoothing tool
• Improvement in the Statistical graphics tools
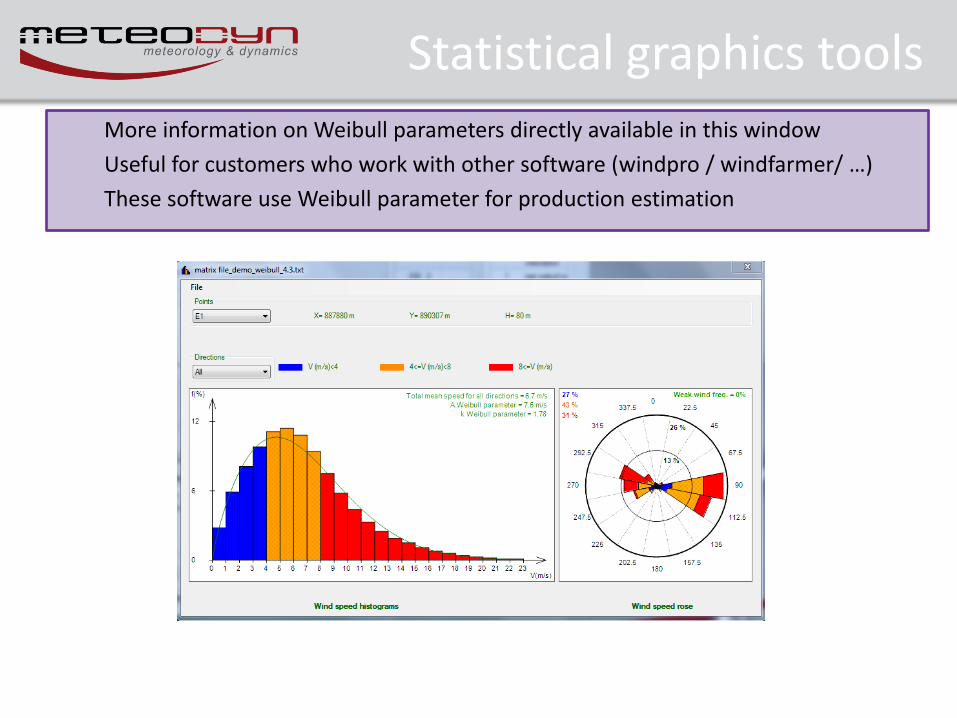
Statistical graphics tools More information on Weibull parameters directly available in this window
Useful for customers who work with other software (windpro / windfarmer/ …)
These software use Weibull parameter for production estimation
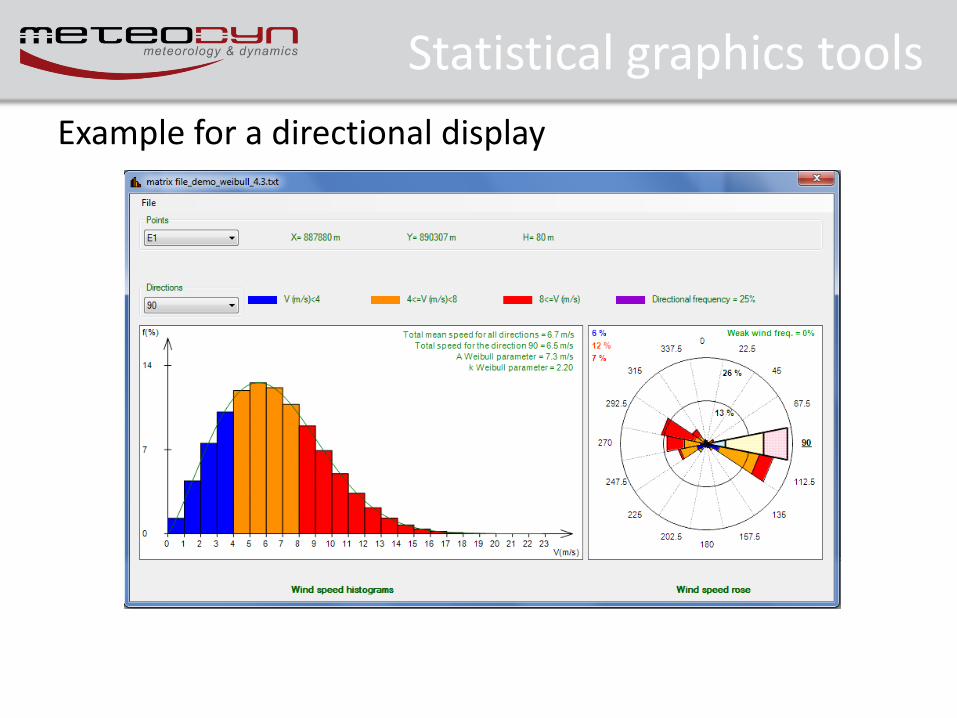
Statistical graphics tools Example for a directional display