Embed Size (px)
Citation preview
1
New evidence for the reawakening of Teide volcano 1
J. Gottsmann1,2, L. Wooller3, J. Martí1, J. Fernández4, A. G. Camacho4, P. J. Gonzalez4,5, A. 2
Garcia6, H. Rymer3 3 1 Institute of Earth Sciences “Jaume Almera”, CSIC, Lluís Solé Sabarís s/n, Barcelona 08028, Spain 4
2 Department of Earth Sciences, University of Bristol, Wills Memorial Building, Queens Road, Bristol BS8 1RJ, United Kingdom 5 3 Department of Earth Sciences, The Open University, Walton Hall, Milton Keynes, MK7 6AA, United Kingdom 6
4 Institute of Astronomy and Geodesy (CSIC-UCM), Ciudad Universitaria, Pza. de Ciencias, 3, 28040 Madrid, Spain. 7 5 Environmental Research Division, ITER, Pol. Ind. Granadilla s/n, San Isidro, 38611 Tenerife, Canary Islands, Spain. 8
6Department of Volcanology , Museo Nacional de Ciencias Naturales, CSIC, C/ José Gutiérrez Abascal, 2, 28006 Madrid, Spain 9 10 Abstract 11 12 Geophysical signals accompanying the reactivation of a volcano after a period of quiescence 13
must be evaluated as potential precursors to impending eruption. Here we report on the 14
reactivation of the central volcanic complex of Tenerife, Spain, in spring 2004 and present 15
gravity change maps constructed by time-lapse microgravity measurements taken between May 16
2004 and July 2005. The gravity changes indicate that the recent reactivation after almost a 17
century of inactivity was accompanied by a sub-surface mass addition, yet we did not detect 18
widespread surface deformation. We find that the causative source was evolving in space and 19
time and infer fluid migration at depth as the most likely cause for mass increase. Our results 20
demonstrate that, even in the absence of previous baseline data and ground deformation, 21
microgravity measurements early in developing crises provide crucial insight into the dynamic 22
changes beneath a volcano. 23
2
Introduction 24 25 Anomalous geophysical signals at dormant volcanoes, or those undergoing a period of 26
quiescence, need to be evaluated as potential precursors to reawakening and possible eruption 27
[White, 1996]. There are several recent examples of volcanic re-activation after long repose 28
intervals culminating in explosive eruption [Nakada and Fuji, 1993; Robertson et al., 2000], but 29
non-eruptive behaviour is equally documented [De Natale et al., 1991; Newhall and Dzurisin, 30
1988]. The dilemma scientists are confronted with is how to assess future behaviour and to 31
forecast the likelihood of an eruption at a reawakening volcano, when critical geophysical data 32
from previous activity is missing due to long repose periods. In Spring 2004, almost a century 33
after the last eruption on the island, a significant increase in the number of seismic events located 34
inland on the volcanic island of Tenerife (Fig. 1) marked the reawakening of the central volcanic 35
complex (CVC), the third-highest volcanic complex on Earth rising almost 7000 m from the 36
surrounding seafloor [García et al., 2006]. The increase in onshore seismicity, including five felt 37
earthquakes, coincided with both an increase in diffuse emission of carbon dioxide along a zone 38
known as the Santiago Rift [Pérez et al., 2005] and increased fumarolic activity at the summit of 39
the 3718 m high Teide volcano [García et al., 2006]. 40
41
Integrated geodetic network on Tenerife 42
As a reaction to the developing crises, we installed the first joint ground 43
deformation/microgravity network on the island in early May 2004, two weeks after the start of 44
increased seismicity. The network consists of 14 benchmarks, which were positioned to provide 45
coverage of a rather large area (> 500 km2) of the CVC, including the Pico Viejo-Pico Teide 46
complex (PV—PT), the Las Cañadas caldera (LCC) as well as the Santiago Rift (SR) (Figs. 1 and 47
3
2). The network was designed to meet rapid response requirements, i.e. the network can be fully 48
occupied to a precision of less than 0.01 mGals of individual gravity readings and less than 0.04 49
m in positioning errors within 6 working days despite the frequently rugged terrain. The first 50
reoccupation of the network was performed in July 2004, followed by campaigns in April 2005 51
and July 2005. Benchmark locations and cumulative ground deformation and gravity changes 52
between May 2004 and July 2005 are given in Tables 1-4 in the supporting online material. All 53
results are given with respect to a reference located south of the LCC (benchmark LAJA). Within 54
the average precision of benchmark elevation measurements (± 0.03 m), using two dual-55
frequency GPS receivers during each campaign, we did not observe widespread ground 56
deformation. However, between May 2004 and July 2005, four benchmarks, two located in the 57
eastern sector of the LCC (MAJU and RAJA), one marking the northern-most end of the network 58
and also the lowest elevation (766 m; CLV1) and finally a benchmark located on an isolated rock 59
spur on the western LCC rim (UCAN, supporting online material) did show ground uplift above 60
measurement precision. Residual gravity changes (corrected for the theoretical Free-Air effect), 61
observed during the May-July 2004, May 2004-April 2005 and May 2004-July 2005 periods are 62
listed in the supporting online material and shown in Figure 2. 63
64
Results 65
The observed gravity changes do not fit a simple symmetrical pattern as observed, for example, 66
during caldera unrest at the Campi Flegrei [Gottsmann et al., 2003] or at Long Valley [Battaglia 67
et al., 2003]. The spatial distribution of gravity changes across the area under investigation is 68
asymmetrical. The smallest gravity changes were observed in the central and eastern depression 69
of the LCC, where cumulative changes over the 14-month period where only slightly higher than 70
4
the precision level (± 0.015 mGal on average; 1 mGal= 10µm/s2). A marked positive gravity 71
anomaly, with a maximum amplitude of around 0.04 mGal, developed in the North-West of the 72
covered area between May and July 2004, while a negative anomaly was found to the east, 73
centered on station MIRA. The gravity increase noted between the first two campaigns 74
(benchmarks C774 and CLV1) was followed by a decrease sometime between July 2004 and 75
April 2005. During the same period, a N-S trending positive anomaly appears north-west of the 76
PV-PT summit area between, reaching the western part of the LCC (Figs. 2a-b). In addition, 77
gravity increased significantly along the northern slopes of Pico Teide, including benchmarks 78
TORR and FUEN located close to the La Orotava valley between July 2004 and April 2005, 79
adding to the impression of a spatio-temporal evolution of the causative source. It is interesting to 80
note that on 5 December 2004 a new fissure with fumarole emission appeared in the Orotava 81
valley [www.iter.es]. A gas plume emanating from the summit fumaroles of Pico Teide was 82
particularly noticeable during October 2004 [García et al., 2006], between surveys 2 and 3. In 83
summary, significant gravity changes occurred mainly across the northern flanks of the PV-PT 84
and along a ca. 6 km wide zone along the western side of the volcanic complex into the 85
westernmost parts of the LCC between May 2004 and July 2005 (Fig. 2c). During the same time, 86
a marked gravity decrease was recorded at the intersection of the Orotava Valley (OV) and the 87
LCC (Fig. 2c). 88
Except for two benchmarks (MAJU and RAJA) where observed gravity changes can be explained 89
by free-air effects (gravity changes due to elevation changes), mass/density changes in the sub-90
surface appear to cause the major part of the perturbation of the gravity field. 91
92
The effect of water table fluctuations 93
5
Data from two drill holes, located in the eastern half of the LCC (Fig. 2d), provide information on 94
water table fluctuations during the period of interest. A drop of ca. 5 cm/month between surveys 95
1 and 4 was recorded in one drill hole located close to benchmarks 3RDB and MAJU, which is 96
similar to the average monthly drop in water level due anthropogenic extraction over the past 3 97
years [Farrujia et al., 2004]. Water levels decreased by 22 cm/month on average between 98
February 2000 and January 2004 in a drill hole located close to benchmark MIRA. The gravity 99
decrease of 0.025 mGal recorded between May 2004 and July 2005 at benchmark MIRA, located 100
at the intersection of the Las Cañadas caldera and the Orotava valley, can be explained by a net 101
water table decrease (δh) of 3 m, consistent with this earlier trend, assuming a permeable rock 102
void space (φ) of 20 % and a water density (ρ) of 1000kg/m3 (∆gw=2πGρφδh) [Battaglia et al., 103
2003]. Following the same rationale, gravity changes at 3RDB and MAJU are corrected by -104
0.008 mGal to account for the recorded water table fall in the nearby borehole. Hence, any 105
gravity change observed within the central and eastern parts of the LCC (3RDB, MAJU, RAJA, 106
MIRA) can be fully attributed to changes in (shallow) groundwater levels and we treat the net 107
mass change as zero for this area in the computation of overall mass changes in the following 108
sections (Fig. 2d). 109
Outside the LCC, comprehensive monitoring data on groundwater level is lacking and correction 110
for groundwater level variations is difficult. Groundwater is collected and extracted along several 111
hundred (sub)horizontal tunnels (galerias) protruding into the upper slopes of the CVC [Marrero 112
et al., 2005]. Since 1925, a decrease of several hundred meters in the groundwater level has been 113
noted for the area covered by the northern and western slopes of the CVC 114
[http://www.aguastenerife.org/]. We therefore consider it very unlikely that the gravity increase 115
6
noted in the north and west of the CVC is related to an increase in the groundwater table, and 116
hence infer deeper processes to be the most probable cause of gravity change in this region. 117
118
Interpretation 119
The coincidence of earthquake epicenter concentration (a mixture of volcano-tectonic events and 120
regional earthquakes with pure volcanic events such as tremors and long-period signals) in the 121
area of gravity increase over the same time period (Fig. 2d), suggests that both signals are related 122
to the same or linked phenomena. Unfortunately, precise data on earthquake hypocentres are not 123
available, but a semi-qualitative analysis suggests a depth of several kilometres [R. Ortiz, 124
personal communication]. The spatial coverage of the benchmarks does not allow the wavelength 125
of the May 04 – July 05 gravity anomaly to be assessed precisely. In particular, the lower limit of 126
the wavelength along the northern slopes of the PV-PT complex cannot be unambiguously 127
retrieved on the basis of the available data. The maximum wavelength of the gravity anomaly is 128
on the order of 17 km if defined by both observed and interpolated (kriging) data (Fig. 2d) on the 129
northern slopes of the PV-PT complex, which implies a maximum source depth of between 2.5 to 130
5.2 km below the surface, assuming simple axisymmetrical source geometries [Telford et al., 131
1990]. This would place the source to within the depth of the shallow magma reservoirs beneath 132
the PV-PT complex believed to host chemically evolved magma [Ablay et al., 1998]. However, 133
since the positive anomaly is only defined by 4 benchmarks (CLV1, C774, CRUC and TORR) its 134
actual wavelength could be smaller than 17 km and the source depth could be shallower than 135
inferred above. Furthermore, ambiguities remain on the actual amplitude of the anomaly, which 136
is defined only by data observed at CRUC. 137
7
The continuation of the positive anomaly in the western part of the LCC (Fig. 2c) shows a shorter 138
wavelength indicating a shallow (few km deep) source. 139
Due to the spatial separation of benchmarks an assessment of sub-surface mass addition is greatly 140
biased on the selection of the area affected by gravity increases. We define a maximum area by a 141
kriging-based interpolation of the gravity changes between May 2004 and July 2005 in the 142
northern and western parts of the CVC. A Gaussian Quadrature integration over this area gives a 143
mass addition of 1.1*1011 kg, with lower and upper 95% confidence bounds of 8.4*109 kg and 144
2.0*1011 kg, respectively. These values should be regarded as maximum values. 145
In theory, subsurface volume changes derived from ground deformation data can be correlated to 146
sub-surface mass changes from gravity data to infer the density of the causative source. However, 147
in the absence of significant surface deformation, the source density cannot be determined 148
directly and the nature of the source remains ambiguous. However, three scenarios are worth 149
considering when assessing causative processes for the observed gravity increase: i) arrival of 150
new magma at depth, ii) migration of hydrothermal fluids and iii) a hybrid of both. 151
Volcanic eruptions of the CVC over the past few centuries were dominantly fed by basic and 152
intermediate magmas in the form of fissure eruptions along the Santiago Rift [Ablay and Marti, 153
2000], implying shallow dyke emplacement along this NW-SE trending extension zone. The 154
observed gravity increase between May 2004 and April 2005 (Fig. 2) appears to denote a zone at 155
a 45° angle to the strike of the rift. The wavelength of the anomaly in the western and central 156
parts of the LCC (Fig. 2d) is not consistent with shallow dyke emplacement to perhaps within a 157
few tens or hundred meters depth. There is also no other direct geophysical or geochemical 158
evidence in support of magma emplacement in the form of a shallow dyke over the 14 month 159
observation time. However, dyke emplacement at greater depth (a few km below the surface) into 160
8
the Santiago Rift (with partial contribution to the gravity increases at benchmarks CLAV1, C774 161
and CRUC), perhaps recharging an existing reservoir, cannot be unambiguously excluded for the 162
period May-July 2004, coinciding with the peak in the number of earthquakes recorded by the 163
National Geographic Institute [http://www.ign.es]. Dykes along the Santiago Rift are on average 164
less than 1 m wide. Ground deformation caused by an individual dyke of this size a few km 165
below the surface would be below the precision of our GPS measurements. Thus, a magma 166
injection into a conjugated fault system, perhaps at some angle to the Santiago Rift, cannot be 167
unambiguously ruled out as the trigger for the reawakening of the volcanic complex in May 168
2004. There is, however, little evidence to support the idea that the mass increase observed 169
during campaigns 2 and 3 is caused solely by magma movement. 170
An alternative explanation for the observed gravity increase is fluid migration through the CVC. 171
Volcano-tectonic events detected in the seismic record [García et al., 2006, Tárraga et al., 2006] 172
may have triggered the release and upward migration of hydrothermal fluids from a deep magma 173
reservoir. Alternatively, fluid migration may have resulted from (a) the perturbation of an 174
existing deep hydrothermal reservoir and resultant upward movement of fluids due to magma 175
injection or (b) from pressurising seawater saturated rocks. 176
Migration of hydrothermal fluids through a permeable medium causes little surface deformation, 177
but the filling of pore space increases the bulk density of the material resulting in a gravity 178
increase at the ground surface. To explore this scenario, and as a first order approximation, we 179
performed a inversion of the gravity change recorded between May 2004 and July 2005 along the 180
northern and western slopes of the PV-PT complex for a source represented by a N-S striking 181
infinite cylindrical horizontal body [Telford et al., 1990]. The approximation of an infinite body 182
is valid as long as the radius of the cylinder is far smaller than its length. The model results 183
9
depend linearly on density change but non-linearly on both the radius and depth of the body. 184
Using a global optimization iterative method [Sen and Stoffa, 1995] with various initial values for 185
depth and radius, we find convergence of the inversion results at a depth of 1990±120 m below 186
the surface using residual gravity data from all benchmarks. While depth is insensitive to the 187
assumed source density change, the radius scales to the inverse of density. Assuming a volume 188
fraction of 30% which is fully permeable, filling this void space with (hydrothermal) fluids of 189
density 1000 kg/m3 would produce a bulk density increase of 0.3 kg/m3. The resultant source 190
radius is around 80±20 m. Although the fit to the data is within errors very good (Fig. 3), we find 191
that the positive anomaly in the eastern part of the LCC cannot be satisfyingly modelled. For this 192
area, we conclude on either a local effect or, more likely, an error in the GPS measurements 193
during the installation of benchmark RAJA, since the reported gravity increase results from the 194
free-air effect of the 7±4 cm inflation detected over the 14 months period. Ignoring the 195
potentially erroneous GPS measurement, the gravity residual for RAJA matches those of 196
neighbouring benchmarks MAJU and 3RDB. Combining all available geophysical information, 197
we conclude that migration of hydrothermal fluids along a permeable N-S striking zone is the 198
most likely cause of the observed perturbation of the gravity field. A conceptual model of mass 199
migration covering the 14-month observation period is shown in Fig. 4. 200
201
Conclusions 202
While magma recharge at depth into the north-western rift zone of Tenerife is likely to have 203
triggered the reawakening of the CVC, the cause of the 14 month perturbation of the gravity field 204
is most probably not related to magma flow. A more likely scenario is the migration of fluids 205
inside the complex triggering the observed gravity changes. 206
10
We demonstrate that time-lapse microgravity monitoring of active volcanoes can provide vital 207
insights into their sub-surface dynamics, particularly where structural complexities and 208
heterogeneous mechanical properties of the subsurface do not obey a simple linearly elastic 209
relationship of stress generation and resultant ground deformation [Dvorak and Dzurisin, 1997]. 210
Arrival of a small batch of magma at depth and the release and upward migration of hot fluids 211
may be a common trigger of reactivation after long repose periods and may be quantifiable by 212
perturbations in the gravity field but may not be accompanied by ground deformation. 213
Quantification of sub-surface mass/density changes must be regarded as essential for the 214
detection of potential pre-eruptive signals at reawakening volcanoes before ground deformation 215
or other geophysical signals become quantifiable [Rymer, 1994]. 216
11
Acknowledgments 217
This research is part of the TEGETEIDE project funded by the Spanish Ministry of Education 218
and Science (MEC) under contract CGL2003-21643-E. JG also acknowledges support from a 219
"Ramon y Cajal" grant by the MEC and a Royal Society University Fellowship. LW 220
acknowledges the support of an Open University Research Development Fund fellowship. JF, 221
AGC and PJG also acknowledge support from EU projects ALERTA (MAC/2.3/C56) of the 222
INTERREG III B Program and from Spanish MEC projects REN2002-12406-E/RIES and 223
GEOMOD (CGL2005-05500-C02). The authors thank I. Farrujia for granting access to water 224
table data on Tenerife and N. Perez for providing GPS data. 225
226
12
References: 227
Ablay, G., and P. Kearey, Gravity constraints on the structure and volcanic evolution of Tenerife, 228
Canary Islands, Journal of Geophysical Research, 105, 5783-5796, 2000. 229
Ablay, G.J., M.R. Carrol, M.R. Palmer, J. Marti, and R.S.J. Sparks, Basanite-Phonolite Lineages 230
of the Teide Pico Viejo Volcanic Complex; Tenerife, Canary Islands, Journal of 231
Petrology, 39 (5), 905-936, 1998. 232
Ablay, G.J., and J. Marti, Stratigraphy, structure, and volcanic evolution of the Pico Teide-Pico 233
Viejo Formation, Tenerife, Canary Islands, Journal of Volcanology and Geothermal 234
Research, 103 (1-4), 175-208, 2000. 235
Battaglia, M., P. Segall, and C. Roberts, The mechanics of unrest at Long Valley caldera, 236
California. 2. Constraining the nature of the source using geodetic and micro-gravity data, 237
Journal of Volcanology and Geothermal Research, 127 (3-4), 219-245, 2003. 238
De Natale, G., F. Pingue, P. Allarde, and A. Zollo, Geophysical and geochemical modelling of 239
the 1982-1984 unrest phenomena at Campi Flegrei caldera (Southern Italy), Journal of 240
Volcanology and Geothermal Research, 48, 199-222, 1991. 241
Dvorak, J.J., and D. Dzurisin, Volcano Geodesy: the search for magma reservoirs and the 242
formation of eruptive vents, Reviews in Geophysics, 35 (3), 343-384, 1997. 243
Farrujia, I., J.L. Velasco, J. Fernandez, and M.C. Martin, Evolución del nivel freático en la mitad 244
oriental del acuífero de Las Cañadas del Teide. Cuantificación de parámetros 245
hidrogeológicos, in VIII Simposio de Hidrogeología de la Asociación Española de 246
Hidrogeólogos, Zaragoza, 2004. 247
13
García, A., J. Vila, R. Ortiz, R. Macia, R. Sleeman, J.M. Marrero, N. Sánchez, M. Tárraga, and 248
A.M. Correig, Monitoring the reawakening of Canary Islands’ Teide Volcano, Eos, 249
Transactions, American Geophysical Union, 87 (6), 2006. 250
Gottsmann, J., G. Berrino, H. Rymer, and G. Williams-Jones, Hazard assessment during caldera 251
unrest at the Campi Flegrei, Italy: a contribution from gravity-height gradients, Earth and 252
Planetary Science Letters, 211 (3-4), 295-309, 2003. 253
http://www.aguastenerife.org/. 254
http://www.ign.es. 255
http:// www.iter.es. 256
Marrero, R., P. Salazar, P.A. Hernández, N.M. Pérez, and D. López, Hydrogeochemical 257
monitoring for volcanic surveillance at Tenerife, Canary Islands, Geophysical Research 258
Abstracts, EGU05-A-09928, 2005. 259
Nakada, S., and T. Fujii, Preliminary report on the activity at Unzen Volcano (Japan), November 260
1990 - November 1991: Dacite lava domes and pyroclastic flows, Journal of Volcanology 261
and Geothermal Research, 54, 319-333, 1993. 262
Newhall, C.G., and D. Dzurisin, Historical unrest at large calderas of the world, 1108 pp., U. S. 263
Geological Survey, Reston, VA, United States, 1988. 264
Pérez , N.M., G. Melían, I. Galindo, E. Padrón, P.A. Hernández, D. Nolasco, P. Salazar, V. 265
Pérez, C. Coello, R. Marrero, Y. González, González, and P.J. Barrancos, Premonitory 266
geochemical and geophysical signatures of volcanic unrest at Tenerife, Canary Islands, 267
Geophysical Research Abstracts, EGU05-A-09993, 2005. 268
Robertson, R.E.A., W.P. Aspinall, R.A. Herd, G.E. Norton, R.S.J. Sparks, and S.R. Young, The 269
1995-1998 eruption of the Soufriere Hills volcano, Montserrat, WI, Philosophical 270
14
Transactions - Royal Society of London, Physical Sciences and Engineering, 358 (1770), 271
1619-1637, 2000. 272
Rymer, H., Microgravity change as a precursor to volcanic activity, Journal of Volcanology and 273
Geothermal Research, 61, 311-328, 1994. 274
Sato, H., T. Fugii, and S. Nakada, Crumbling of dacite dome lava and generation of pyroclastic 275
flows at Unzen volcano, Nature, 360 (6405), 664-666, 1992. 276
Sen, M.K., and P.L. Stoffa, Global Optimization Methods in Geophysical Inversion, 294 pp., 277
Elsevier, 1995. 278
Tárraga, M., R. Carniel, R. Ortiz, J.M. Marrero, and A. García, On the predictability of volcano-279
tectonic events by low frequency seismic noise analysis at Teide-Pico Viejo volcanic 280
complex, Canary Islands., Natural Hazards and Earth System Sciences, in press, 2006. 281
Telford, W.M., L.P. Geldart, and R.E. Sheriff, Applied Geophysics, University Press, Cambridge, 282
1990. 283
White, R.A., Precursory deep long-period earthquakes at ount Pinatubo: Spatio-temporal link to a 284
basaltic trigger, in Fire and Mud: Eruptions and Lahars of Mount Pinatubo, Philippines, 285
edited by R.S. Punongbayan, pp. 307-326, University of Washington Press, Seattle, 1996. 286
287

15
Figure captions: 288
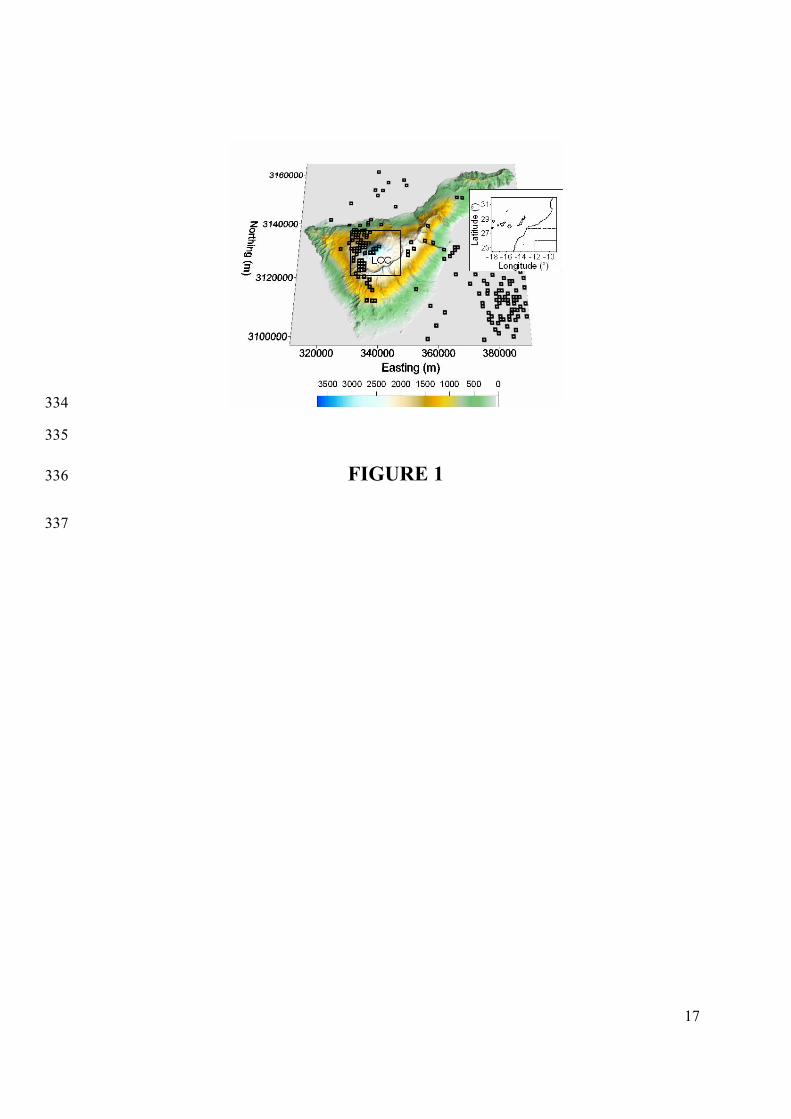
Figure 1: 289
Perspective view of Tenerife island located in the Canarian Archipelago off the coast of North-290
West Africa (inset), using a colour-coded digital elevation model (DEM; elevation in meters). 291
Highest point is Teide volcano (3718 m a.s.l.) located at 28.27°N and 16.60°W. Black dots 292
indicate epicentres of seismic events recorded between May 2004 and July 2005 by the National 293
Geographic Institute [http://www.ign.es]. Black rectangle identifies the area covered by the joint 294
GPS/gravity network. LCC indicates the location of the Las Cañadas caldera. 295
296
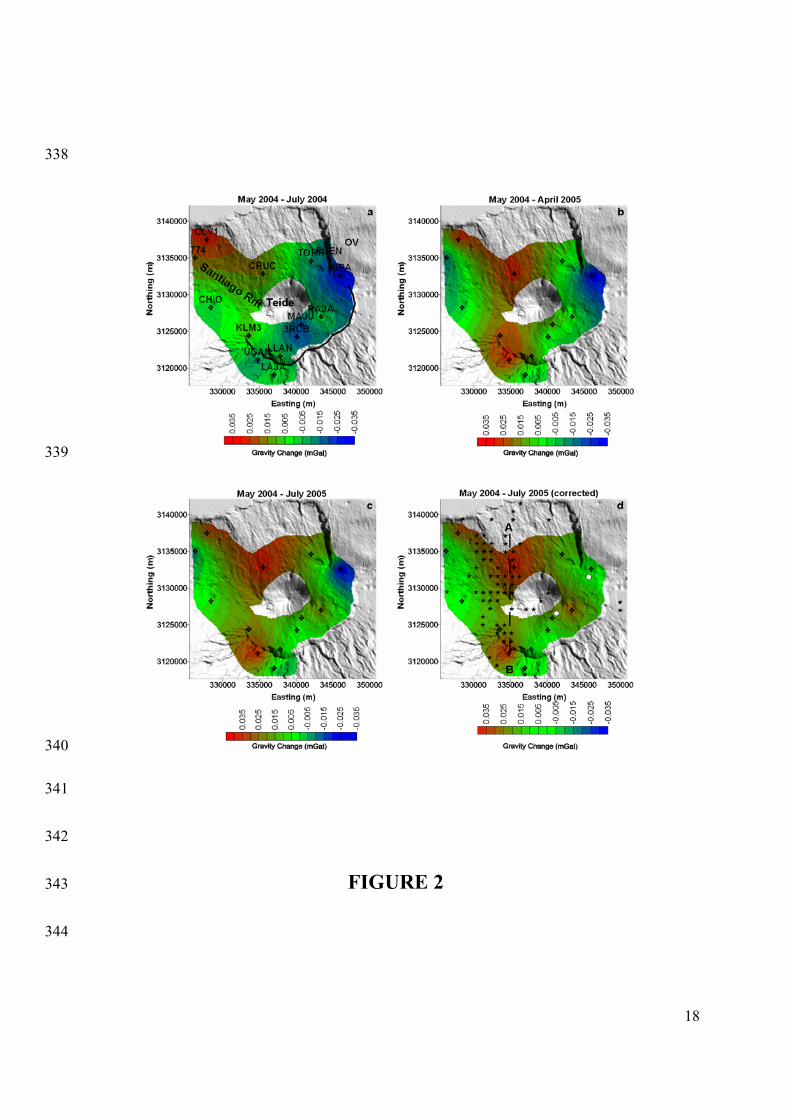
Figure 2: 297
Residual gravity changes between (a) May and July 2004; (b) May 2004 and April 2005; (c) May 298
2004 and July 2005. (d) is the same as (c), but corrected for the effect of water table changes. 299
Gravity changes are draped over a DEM of the central volcanic complex (CVC) of Tenerife. 300
Black line in (a) delineates head wall of the Las Cañadas caldera (LCC). Benchmark locations 301
(crosses) and identification are shown as well as the prominent topographic features of the 302
Santiago Rift, Teide volcano and the Orotava Valley (OV). Uncertainty in gravity changes are on 303
average ±0.015 mGal (1 mGal= 10µm/s2). In (c) the area to the east of the CVC, where a gravity 304
decrease was detected, coincides with the intersection of the Las Cañadas caldera with the 305
collapse scar of the Orotava valley. This zone represents a major hydrological outlet of the 306
caldera. In (d) stars represent epicentres of seismic events recorded between May 2004 and July 307
2005. Both gravity increase and seismicity appear to be spatially and temporally correlated. Line 308
A-B represents datum for profile shown in Fig. 4. 309
310
Figure 3: 311

16
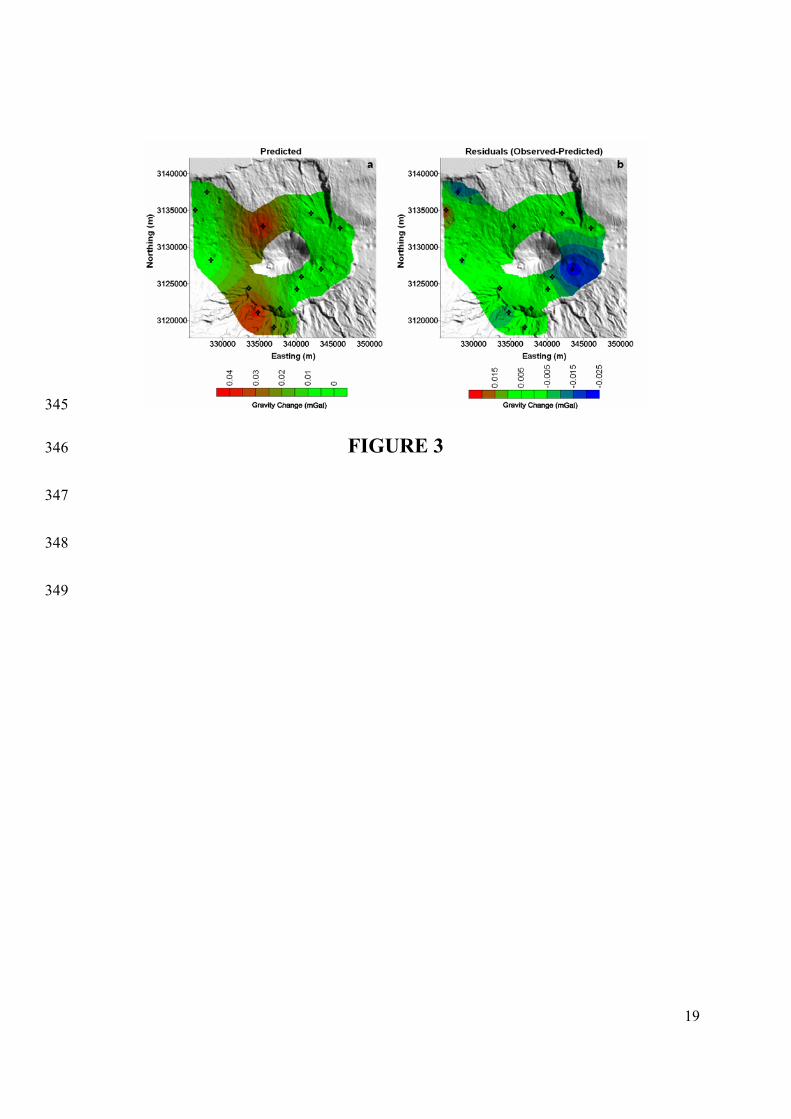
312 Predicted (a) and residuals between observed and predicted gravity changes (mGal) (b) for the 313
period May 2004 to July 2005. Predicted values are derived from inversion for an infinite 314
horizontal cylinder as an approximation of the zone undergoing a mass/density increase at the 315
northern and western slopes of the PV-PT complex. Observed gravity changes were corrected for 316
the effect of water table fluctuations in the central and eastern part of the LCC prior to inversion. 317
Red colours indicate that the model is predicting higher gravity changes than observed, blue 318
colours indicate the opposite. Green colours indicate match between predictions and 319
observations. 320
321
Figure 4: 322
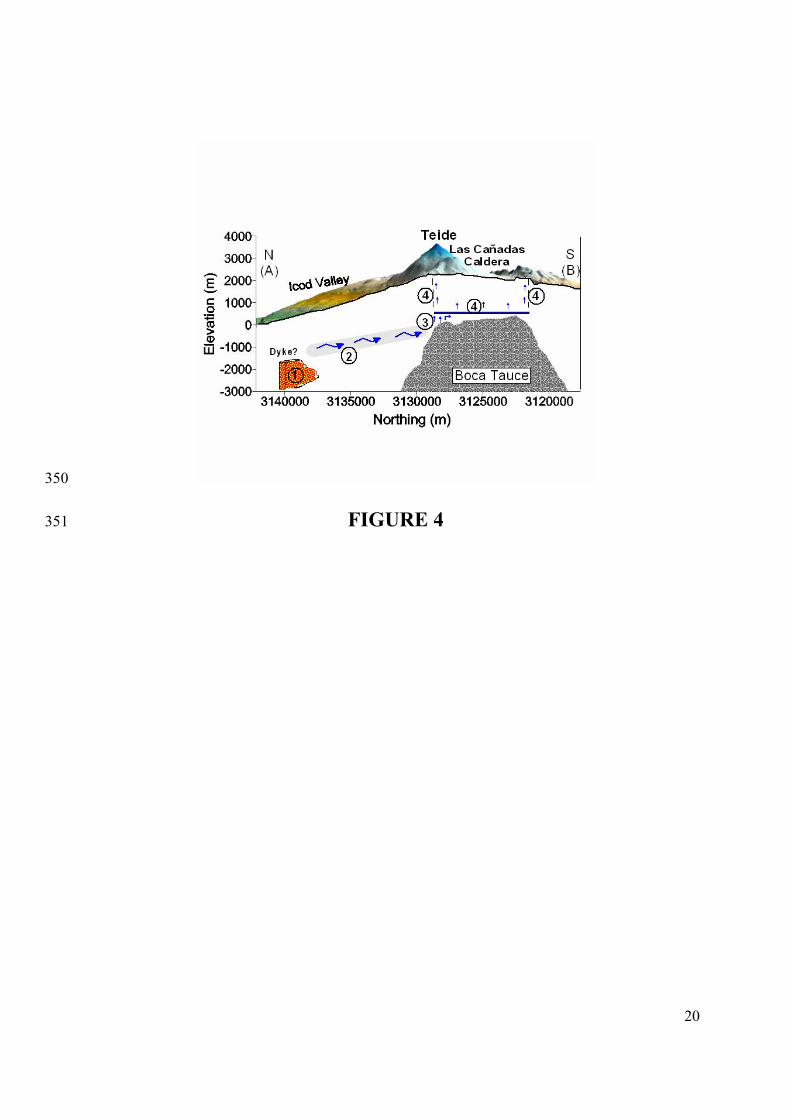
Cross-section through the CVC along the profile A-B shown in Figure 2d, including a conceptual 323
model of events between May 2004 and July 2005. (1) Likely injection of magma during peak of 324
onshore seismic activity two weeks before installation of network (May 2004). (2) Release of 325
fluids or perturbation of existing hydrothermal system causing migration of fluids from NW to 326
SE (May - July 2004; Fig. 2a) and later (July 2004-April 2005 and further into July 2005) along a 327
N-S striking zone (Figs. 2b-d). (3) Upward migration of fluids along the upper surface of the high 328
density/low permeability Boca Tauce magmatic body situated beneath the western caldera [Ablay 329
and Kearey, 2000]. (4) Fluid migration into an overlying aquifer, located at a depth greater than 330
900 m beneath the LCC floor and thought to feed the PT summit fumaroles [Araña et al., 2000], 331
can explain the increased fumarolic activity of Teide in 2004. The western caldera boundary fault 332
may act as a pathway for fluids to shallower depth. 333
17
334
335
FIGURE 1 336
337
18
338
339
340
341
342
FIGURE 2 343
344
19
345
FIGURE 3 346
347
348
349
20
350
FIGURE 4 351