Embed Size (px)
Citation preview
New Design approach for a highly loaded Counter-RotatingMi xed-Flow Pump in Cavitation Conditions
S. Tosin - J. Friedrichs
Institute of Jet Propulsionand Turbomachinery,
Technische Universitat Braunschweig38108 Braunschweig, Germany
Email: [email protected]
A. Dreiss
Flowserve CorporationHamburg, Germany
ABSTRACTThe ongoing research on counter-rotating blade rows in single stage machines has shownpromising results on improvement of efficiency and pressure ratios in high specific speed im-pellers, with conventional applications such as naval propulsion etc, axial pump and fan. Thefocus of the design presented below has been the development of a compact design with highpower density and improved cavitation performance. The new design offers a downsizing op-portunity with its two impellers: a mixed-flow front rotor (FR) and the radial rear rotor (RR),instead of a stationary bladed diffuser. With this set the off-design working range can be ex-tended, reaching a high adaptability at different flow conditions. An improvement on cavita-tion’s performance can be obtained also moving the load from the FR to the RR. In this paperthe first prototype is numerically and experimentally analyzed. Head drop and cavitation incep-tion curves besides the characteristic curves are highlighted. Design improvements have finallypermitted to develop two new versions of the FR, which have been numerically investigated. Thefirst one is expected to provide improved cavitation performance, while the second one higherpower density. Finally the sensitivity of the system to the speed ratio has been experimentallyinvestigated. The CFD results show good agreement with the tests within the uncertainty of theexperimental measurements.
KEY WORDSCavitation, Counter-Rotating, Power Density, Compact, Centrifugal Pump, Mixed-Flow
INTRODUCTIONA new pump design concept based on counter-rotating impellers has been analyzed in this pa-
per. The aim of this research is to investigate the possibility to downsize the machine and achievea compact unit with a broad working range by introducing an additional counter-rotating radial im-peller downstream of a mixed-flow runner. This paper follows the previous study (Tosin, 2014 [9]),highlighting the performance analysis done on the first prototype calledRoDiff1 and giving a briefintroduction on the following prototypes. The design model developed in house and widely pre-sented within the mentioned paper has been improved by adding more design features and options,which have permited the authors to getRoDiff2 design. Moreover the second prototype has beendesigned to improve the cavitation performance focused on the inception cavitation. A third oneRoDiff3, which reaches a higher power density, is also introduced to show importance of the loaddistribution between front and rear rotor. The definition of the power density used in the presentstudy is:ρP = P
π·ρimpD24·Z0,4
4·2
where the shaft power in counter-rotating system consists of the addition
1
Proceedings of
11th European Conference on Turbomachinery Fluid dynamics & Thermodynamics
ETC11, March 23-27, 2015, Madrid, Spain
OPEN ACCESS
Downloaded from www.euroturbo.eu Copyright © by the Authors
of both shaft powers. Various designs by the counter-rotating principle are available in literature;many authors have investigated this innovative layout applied to axial-flow machines. Literaturesurvey introduced some interesting publications on this concept. Notably Kanemoto et al. (2004[4]) presents axial flow pump with counter-rotating impellers driven by a single electric motor withcounter-rotating rotors. The study of Momosaki et al. (2010[5]) highlights performance of an axialarrangement with a Front Rotor and Rear Rotor investigating theflow field with CFD analysis. Theresults of Shigemitsu (2007 [7]) show some benefits on statichead rise in comparison with the con-ventional rotor-stator configuration without causing losses in terms of total efficiency. Looking intothe recent publication, two interesting works could be found about this topic. From the Universityof Kyushu an experimental investigation of the blade row interactions in counter-rotating axial flowpump have been carried out (Cao et al., 2014 [2]). The work shows the results of pressure pulsationmeasurements in different location within the bladed channel, producing a model for the predictionof the fluctuation modes, which was tested for two rotationalspeed combinations. The paper of Wandet al. (2014 [10] from Dynfluid Laboratory ParisTech) presents a design parameter sensitivity anal-ysis based on experimental investigation in a counter-rotating axial flow fan. The interaction of therotors and the determination of the most important design parameters have been the objectives of theauthors. Both papers have given the basis for the improvements of the existing version of the designtool internally developed, that was presented in the previous publication. The actual version of thedesign software is able to design in single rotor layout, conventional mixed-flow and radial-flow im-pellers. Once the counter-rotating layout is set, it can design simultaneously both counter-rotatingimpellers, in this case the axial and radial extension, the speeds, the head rise and many other param-eters for each rotor are freely set from the user. The presentstudy uses the same simulation setup that
FR Front Rotor
RR Rear Rotor
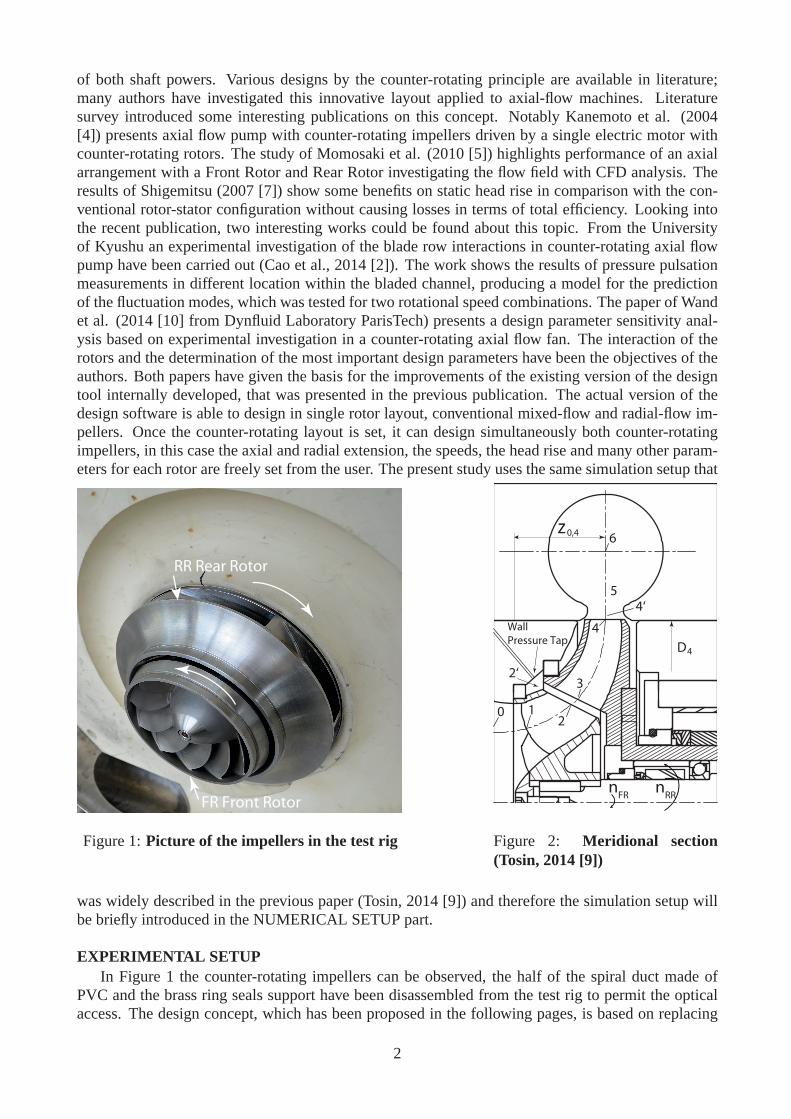
Figure 1:Picture of the impellers in the test rig
2‘
0 12
6
54‘
4
3
Wall
Pressure Tap
nFR
nRR
Z 0,4Z
D4
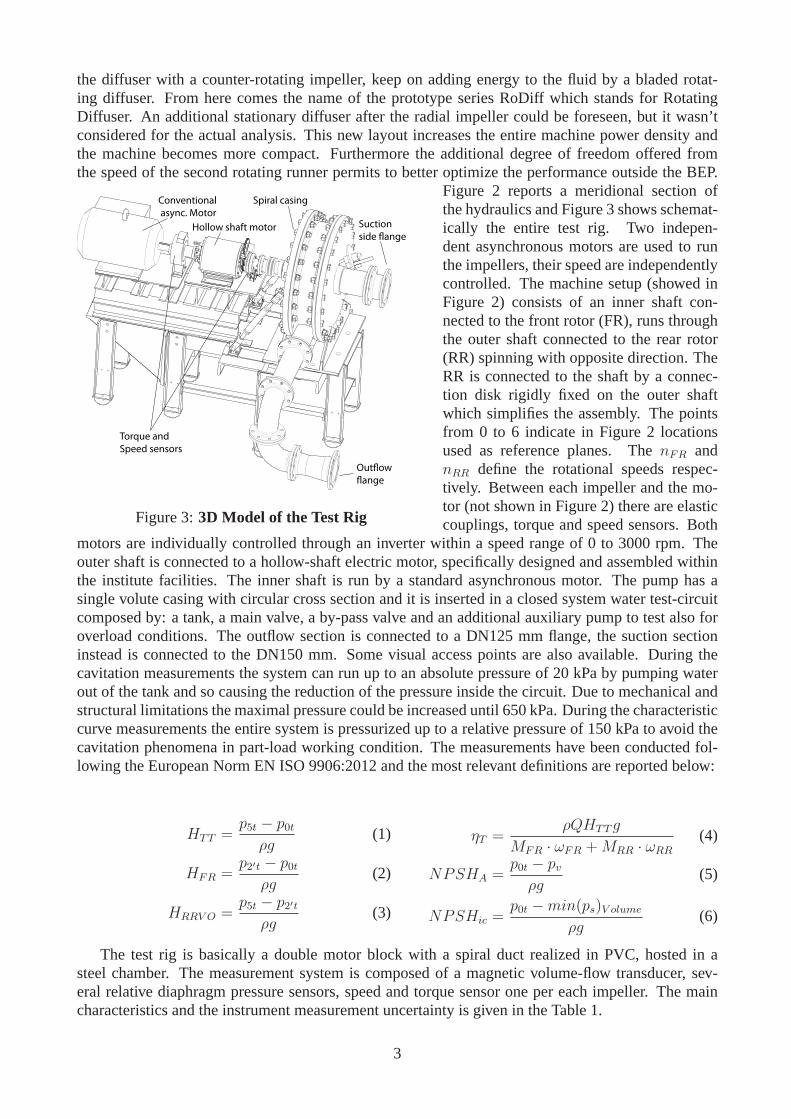
Figure 2: Meridional section(Tosin, 2014 [9])
was widely described in the previous paper (Tosin, 2014 [9])and therefore the simulation setup willbe briefly introduced in the NUMERICAL SETUP part.
EXPERIMENTAL SETUPIn Figure 1 the counter-rotating impellers can be observed,the half of the spiral duct made of
PVC and the brass ring seals support have been disassembled from the test rig to permit the opticalaccess. The design concept, which has been proposed in the following pages, is based on replacing
2
the diffuser with a counter-rotating impeller, keep on adding energy to the fluid by a bladed rotat-ing diffuser. From here comes the name of the prototype series RoDiff which stands for RotatingDiffuser. An additional stationary diffuser after the radial impeller could be foreseen, but it wasn’tconsidered for the actual analysis. This new layout increases the entire machine power density andthe machine becomes more compact. Furthermore the additional degree of freedom offered fromthe speed of the second rotating runner permits to better optimize the performance outside the BEP.
Conventional
async. Motor
Hollow shaft motor
Torque and
Speed sensors
Out!ow
!ange
Suction
side !ange
Spiral casing
Figure 3:3D Model of the Test Rig
Figure 2 reports a meridional section ofthe hydraulics and Figure 3 shows schemat-ically the entire test rig. Two indepen-dent asynchronous motors are used to runthe impellers, their speed are independentlycontrolled. The machine setup (showed inFigure 2) consists of an inner shaft con-nected to the front rotor (FR), runs throughthe outer shaft connected to the rear rotor(RR) spinning with opposite direction. TheRR is connected to the shaft by a connec-tion disk rigidly fixed on the outer shaftwhich simplifies the assembly. The pointsfrom 0 to 6 indicate in Figure 2 locationsused as reference planes. ThenFR andnRR define the rotational speeds respec-tively. Between each impeller and the mo-tor (not shown in Figure 2) there are elasticcouplings, torque and speed sensors. Both
motors are individually controlled through an inverter within a speed range of 0 to 3000 rpm. Theouter shaft is connected to a hollow-shaft electric motor, specifically designed and assembled withinthe institute facilities. The inner shaft is run by a standard asynchronous motor. The pump has asingle volute casing with circular cross section and it is inserted in a closed system water test-circuitcomposed by: a tank, a main valve, a by-pass valve and an additional auxiliary pump to test also foroverload conditions. The outflow section is connected to a DN125 mm flange, the suction sectioninstead is connected to the DN150 mm. Some visual access points are also available. During thecavitation measurements the system can run up to an absolutepressure of 20 kPa by pumping waterout of the tank and so causing the reduction of the pressure inside the circuit. Due to mechanical andstructural limitations the maximal pressure could be increased until 650 kPa. During the characteristiccurve measurements the entire system is pressurized up to a relative pressure of 150 kPa to avoid thecavitation phenomena in part-load working condition. The measurements have been conducted fol-lowing the European Norm EN ISO 9906:2012 and the most relevant definitions are reported below:
HTT =p5t − p0t
ρg(1)
HFR =p2′t − p0t
ρg(2)
HRRV O =p5t − p2′t
ρg(3)
ηT =ρQHTTg
MFR · ωFR +MRR · ωRR
(4)
NPSHA =p0t − pv
ρg(5)
NPSHic =p0t −min(ps)V olume
ρg(6)
The test rig is basically a double motor block with a spiral duct realized in PVC, hosted in asteel chamber. The measurement system is composed of a magnetic volume-flow transducer, sev-eral relative diaphragm pressure sensors, speed and torquesensor one per each impeller. The maincharacteristics and the instrument measurement uncertainty is given in the Table 1.
3
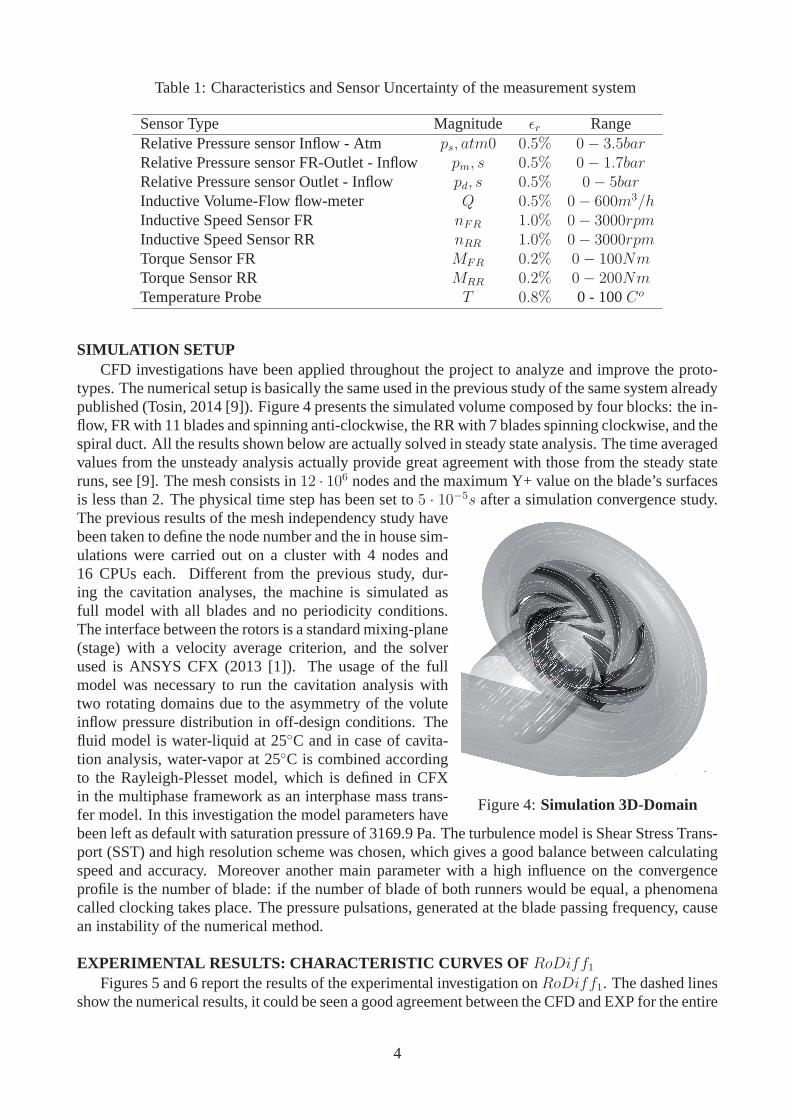
Table 1: Characteristics and Sensor Uncertainty of the measurement system
Sensor Type Magnitude ǫr RangeRelative Pressure sensor Inflow - Atm ps, atm0 0.5% 0− 3.5barRelative Pressure sensor FR-Outlet - Inflow pm, s 0.5% 0− 1.7barRelative Pressure sensor Outlet - Inflow pd, s 0.5% 0− 5barInductive Volume-Flow flow-meter Q 0.5% 0− 600m3/hInductive Speed Sensor FR nFR 1.0% 0− 3000rpmInductive Speed Sensor RR nRR 1.0% 0− 3000rpmTorque Sensor FR MFR 0.2% 0− 100NmTorque Sensor RR MRR 0.2% 0− 200NmTemperature Probe T 0.8% 0 - 100Co
SIMULATION SETUPCFD investigations have been applied throughout the projectto analyze and improve the proto-
types. The numerical setup is basically the same used in the previous study of the same system alreadypublished (Tosin, 2014 [9]). Figure 4 presents the simulated volume composed by four blocks: the in-flow, FR with 11 blades and spinning anti-clockwise, the RR with 7 blades spinning clockwise, and thespiral duct. All the results shown below are actually solvedin steady state analysis. The time averagedvalues from the unsteady analysis actually provide great agreement with those from the steady stateruns, see [9]. The mesh consists in12 · 106 nodes and the maximum Y+ value on the blade’s surfacesis less than 2. The physical time step has been set to5 · 10−5s after a simulation convergence study.
Figure 4:Simulation 3D-Domain
The previous results of the mesh independency study havebeen taken to define the node number and the in house sim-ulations were carried out on a cluster with 4 nodes and16 CPUs each. Different from the previous study, dur-ing the cavitation analyses, the machine is simulated asfull model with all blades and no periodicity conditions.The interface between the rotors is a standard mixing-plane(stage) with a velocity average criterion, and the solverused is ANSYS CFX (2013 [1]). The usage of the fullmodel was necessary to run the cavitation analysis withtwo rotating domains due to the asymmetry of the voluteinflow pressure distribution in off-design conditions. Thefluid model is water-liquid at 25◦C and in case of cavita-tion analysis, water-vapor at 25◦C is combined accordingto the Rayleigh-Plesset model, which is defined in CFXin the multiphase framework as an interphase mass trans-fer model. In this investigation the model parameters havebeen left as default with saturation pressure of 3169.9 Pa. The turbulence model is Shear Stress Trans-port (SST) and high resolution scheme was chosen, which gives a good balance between calculatingspeed and accuracy. Moreover another main parameter with a high influence on the convergenceprofile is the number of blade: if the number of blade of both runners would be equal, a phenomenacalled clocking takes place. The pressure pulsations, generated at the blade passing frequency, causean instability of the numerical method.
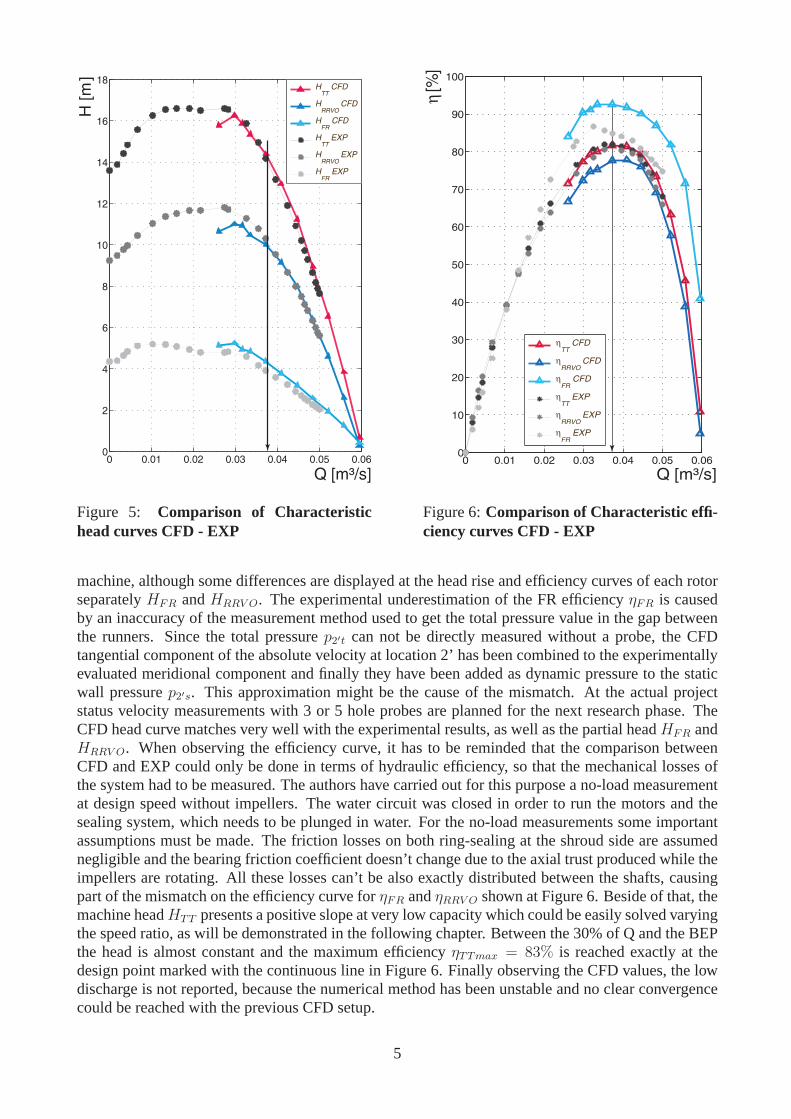
EXPERIMENTAL RESULTS: CHARACTERISTIC CURVES OF RoDiff1Figures 5 and 6 report the results of the experimental investigation onRoDiff1. The dashed lines
show the numerical results, it could be seen a good agreementbetween the CFD and EXP for the entire
4
0 0.01 0.02 0.03 0.04 0.05 0.060
2
4
6
8
10
12
14
16
18
Q [m³/s]
H [m
]
HTT
CFD
HRRVO
CFD
HFR
CFD
HTT
EXP
HRRVO
EXP
HFR
EXP
Figure 5: Comparison of Characteristichead curves CFD - EXP
0 0.01 0.02 0.03 0.04 0.05 0.060
10
20
30
40
50
60
70
80
90
100
Q [m³/s]
[%
]
TT
CFD
RRVO
CFD
FR
CFD
TT
EXP
RRVO
EXP
FR
EXP
Figure 6:Comparison of Characteristic effi-ciency curves CFD - EXP
machine, although some differences are displayed at the head rise and efficiency curves of each rotorseparatelyHFR andHRRV O. The experimental underestimation of the FR efficiencyηFR is causedby an inaccuracy of the measurement method used to get the total pressure value in the gap betweenthe runners. Since the total pressurep2′t can not be directly measured without a probe, the CFDtangential component of the absolute velocity at location 2’ has been combined to the experimentallyevaluated meridional component and finally they have been added as dynamic pressure to the staticwall pressurep2′s. This approximation might be the cause of the mismatch. At the actual projectstatus velocity measurements with 3 or 5 hole probes are planned for the next research phase. TheCFD head curve matches very well with the experimental results, as well as the partial headHFR andHRRV O. When observing the efficiency curve, it has to be reminded that the comparison betweenCFD and EXP could only be done in terms of hydraulic efficiency,so that the mechanical losses ofthe system had to be measured. The authors have carried out for this purpose a no-load measurementat design speed without impellers. The water circuit was closed in order to run the motors and thesealing system, which needs to be plunged in water. For the no-load measurements some importantassumptions must be made. The friction losses on both ring-sealing at the shroud side are assumednegligible and the bearing friction coefficient doesn’t change due to the axial trust produced while theimpellers are rotating. All these losses can’t be also exactly distributed between the shafts, causingpart of the mismatch on the efficiency curve forηFR andηRRV O shown at Figure 6. Beside of that, themachine headHTT presents a positive slope at very low capacity which could beeasily solved varyingthe speed ratio, as will be demonstrated in the following chapter. Between the 30% of Q and the BEPthe head is almost constant and the maximum efficiencyηTTmax = 83% is reached exactly at thedesign point marked with the continuous line in Figure 6. Finally observing the CFD values, the lowdischarge is not reported, because the numerical method hasbeen unstable and no clear convergencecould be reached with the previous CFD setup.
5
RE-DESIGN OF THE FRONT ROTOR
0 0.2 0.4 0.6 0.8 10
5
10
15
20
Meridian Coordinate (a )
Hub, M
iddle
,T
ip
0 0.2 0.4 0.6 0.8 10.2
0.4
0.6
0.8
1
b
Meridian Coordinate (a )
(m)
Hub, M
iddle
,T
ip
0 0.2 0.4 0.6 0.8 12
2.5
3
3.5
4 Cm’
Meridian Coordinate (a )
’
Hub, M
iddle
,T
ip
0 0.2 0.4 0.6 0.8 10
5
10
15 Wu
Meridian Coordinate (a )
Hub, M
iddle
,T
ip
0 0.2 0.4 0.6 0.8 10.85
0.9
0.95
1
Meridian Coordinate (a )
Hub, M
iddle
,T
ip
0 0.2 0.4 0.6 0.8 10
2
4
6
8 Cu
Meridian Coordinate (a)
Hub, M
iddle
,T
ip
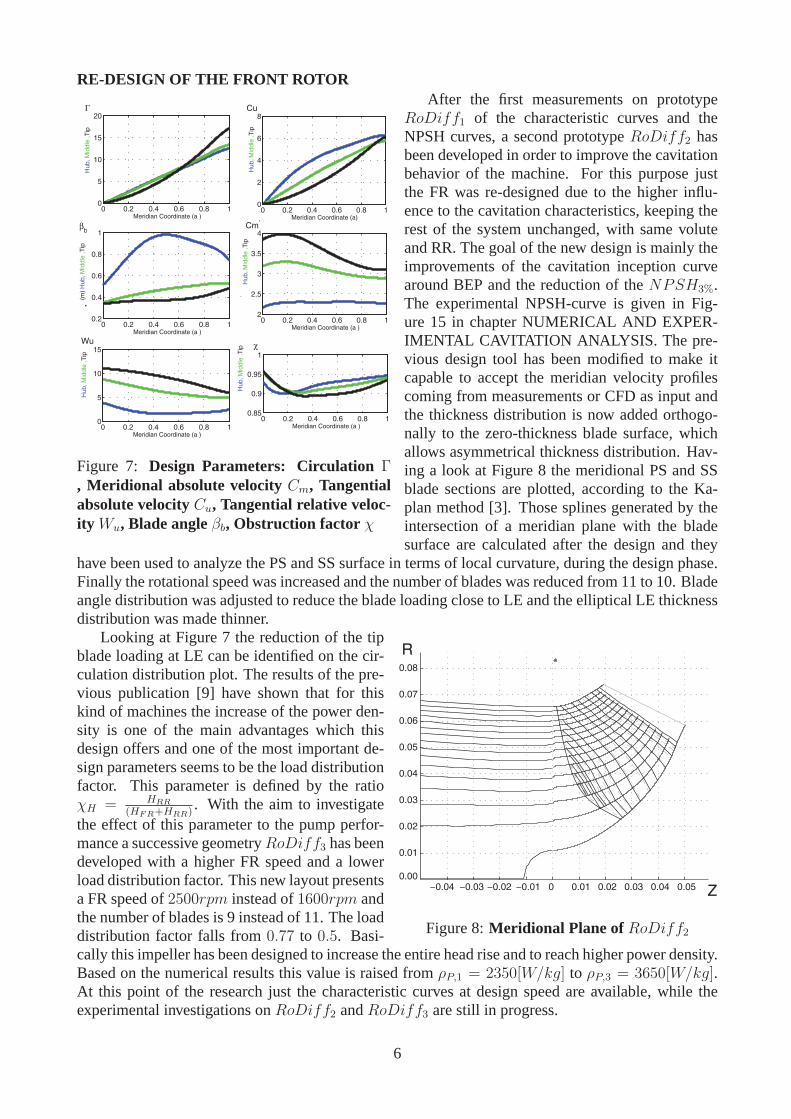
Figure 7: Design Parameters: Circulation Γ, Meridional absolute velocity Cm, Tangentialabsolute velocityCu, Tangential relative veloc-ity Wu, Blade angleβb, Obstruction factor χ
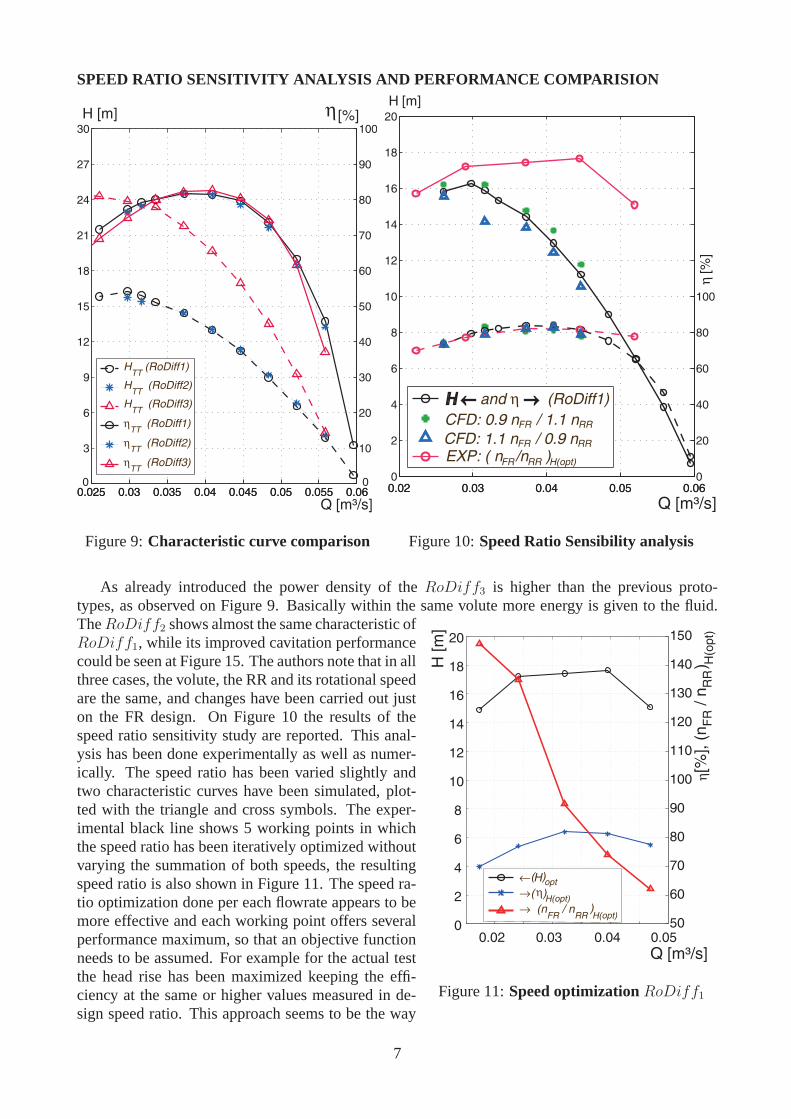
After the first measurements on prototypeRoDiff1 of the characteristic curves and theNPSH curves, a second prototypeRoDiff2 hasbeen developed in order to improve the cavitationbehavior of the machine. For this purpose justthe FR was re-designed due to the higher influ-ence to the cavitation characteristics, keeping therest of the system unchanged, with same voluteand RR. The goal of the new design is mainly theimprovements of the cavitation inception curvearound BEP and the reduction of theNPSH3%.The experimental NPSH-curve is given in Fig-ure 15 in chapter NUMERICAL AND EXPER-IMENTAL CAVITATION ANALYSIS. The pre-vious design tool has been modified to make itcapable to accept the meridian velocity profilescoming from measurements or CFD as input andthe thickness distribution is now added orthogo-nally to the zero-thickness blade surface, whichallows asymmetrical thickness distribution. Hav-ing a look at Figure 8 the meridional PS and SSblade sections are plotted, according to the Ka-plan method [3]. Those splines generated by theintersection of a meridian plane with the bladesurface are calculated after the design and they
have been used to analyze the PS and SS surface in terms of local curvature, during the design phase.Finally the rotational speed was increased and the number ofblades was reduced from 11 to 10. Bladeangle distribution was adjusted to reduce the blade loadingclose to LE and the elliptical LE thicknessdistribution was made thinner.
−0.04 −0.03 −0.02 −0.01 0 0.01 0.02 0.03 0.04 0.05
0.01
0.02
0.03
0.04
0.05
0.06
0.07
0.08
Z
R
0.00
Figure 8:Meridional Plane of RoDiff2
Looking at Figure 7 the reduction of the tipblade loading at LE can be identified on the cir-culation distribution plot. The results of the pre-vious publication [9] have shown that for thiskind of machines the increase of the power den-sity is one of the main advantages which thisdesign offers and one of the most important de-sign parameters seems to be the load distributionfactor. This parameter is defined by the ratioχH = HRR
(HFR+HRR). With the aim to investigate
the effect of this parameter to the pump perfor-mance a successive geometryRoDiff3 has beendeveloped with a higher FR speed and a lowerload distribution factor. This new layout presentsa FR speed of2500rpm instead of1600rpm andthe number of blades is 9 instead of 11. The loaddistribution factor falls from0.77 to 0.5. Basi-cally this impeller has been designed to increase the entirehead rise and to reach higher power density.Based on the numerical results this value is raised fromρP,1 = 2350[W/kg] to ρP,3 = 3650[W/kg].At this point of the research just the characteristic curvesat design speed are available, while theexperimental investigations onRoDiff2 andRoDiff3 are still in progress.
6
SPEED RATIO SENSITIVITY ANALYSIS AND PERFORMANCE COMPARISION
0.025 0.03 0.035 0.04 0.045 0.05 0.055 0.060
3
6
9
12
15
18
21
24
27
30
0.025 0.03 0.035 0.04 0.045 0.05 0.055 0.060
10
20
30
40
50
60
70
80
90
100
HTT
(RoDiff1)
HTT
(RoDiff2)
HTT
(RoDiff3)
TT
(RoDiff1)
TT
(RoDiff2)
TT
(RoDiff3)
H [m]
Q [m³/s]
[%]
Figure 9:Characteristic curve comparison
0.02 0.03 0.04 0.05 0.060
2
4
6
8
10
12
14
16
18
20
H [m]
Q [m³/s]
0.02 0.03 0.04 0.05 0.060
20
40
60
80
100
[%
]
H and (RoDiff1)
EXP: ( n /n )
FR RR
CFD: 1.1 n / 0.9 nFR
FR RR H(opt)
RR
CFD: 0.9 n / 1.1 n
Figure 10:Speed Ratio Sensibility analysis
As already introduced the power density of theRoDiff3 is higher than the previous proto-types, as observed on Figure 9. Basically within the same volute more energy is given to the fluid.
0
2
4
6
8
10
12
14
16
18
20
H [m
]
Q [m³/s]
0.02 0.03 0.04 0.0550
60
70
80
90
100
110
120
130
140
150
[%
], (
nF
R / n
RR
) H
(op
t)
H
(n
(
FR / n
RR)
)
( )
H(opt)
opt
H(opt)
Figure 11:Speed optimizationRoDiff1
TheRoDiff2 shows almost the same characteristic ofRoDiff1, while its improved cavitation performancecould be seen at Figure 15. The authors note that in allthree cases, the volute, the RR and its rotational speedare the same, and changes have been carried out juston the FR design. On Figure 10 the results of thespeed ratio sensitivity study are reported. This anal-ysis has been done experimentally as well as numer-ically. The speed ratio has been varied slightly andtwo characteristic curves have been simulated, plot-ted with the triangle and cross symbols. The exper-imental black line shows 5 working points in whichthe speed ratio has been iteratively optimized withoutvarying the summation of both speeds, the resultingspeed ratio is also shown in Figure 11. The speed ra-tio optimization done per each flowrate appears to bemore effective and each working point offers severalperformance maximum, so that an objective functionneeds to be assumed. For example for the actual testthe head rise has been maximized keeping the effi-ciency at the same or higher values measured in de-sign speed ratio. This approach seems to be the way
7
to realize a wide working range with almost constant head rise, as mentioned above. The optimizedspeed ratio values are also reported in Table 2.
Table 2: Speed ratio optimization test results
Q nFR nRR ηTT HTT nFR + nRRnFR
nRR
[m3/s] [rpm] [rpm] [−] [m] [rpm] [−]0.0223 1680 1140 0.699 14.90 2820 1.47370.0290 1620 1200 0.771 17.22 2820 1.35000.0371 1320 1440 0.820 17.42 2760 0.91670.0445 1200 1620 0.813 17.66 2820 0.74070.0519 1080 1740 0.775 15.07 2820 0.6207
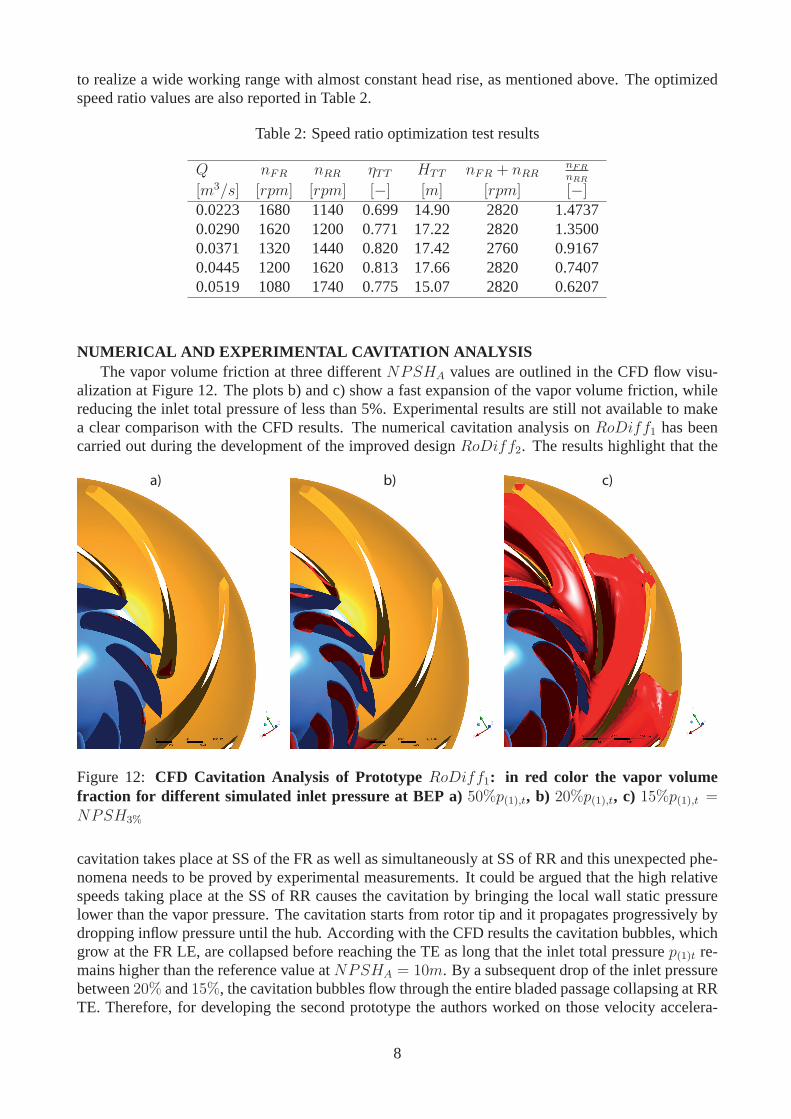
NUMERICAL AND EXPERIMENTAL CAVITATION ANALYSISThe vapor volume friction at three differentNPSHA values are outlined in the CFD flow visu-
alization at Figure 12. The plots b) and c) show a fast expansion of the vapor volume friction, whilereducing the inlet total pressure of less than 5%. Experimental results are still not available to makea clear comparison with the CFD results. The numerical cavitation analysis onRoDiff1 has beencarried out during the development of the improved designRoDiff2. The results highlight that the
a) b) c)
Figure 12: CFD Cavitation Analysis of Prototype RoDiff1: in red color the vapor volumefraction for different simulated inlet pressure at BEP a) 50%p(1),t, b) 20%p(1),t, c) 15%p(1),t =NPSH3%
cavitation takes place at SS of the FR as well as simultaneously at SS of RR and this unexpected phe-nomena needs to be proved by experimental measurements. It could be argued that the high relativespeeds taking place at the SS of RR causes the cavitation by bringing the local wall static pressurelower than the vapor pressure. The cavitation starts from rotor tip and it propagates progressively bydropping inflow pressure until the hub. According with the CFDresults the cavitation bubbles, whichgrow at the FR LE, are collapsed before reaching the TE as longthat the inlet total pressurep(1)t re-mains higher than the reference value atNPSHA = 10m. By a subsequent drop of the inlet pressurebetween20% and15%, the cavitation bubbles flow through the entire bladed passage collapsing at RRTE. Therefore, for developing the second prototype the authors worked on those velocity accelera-
8
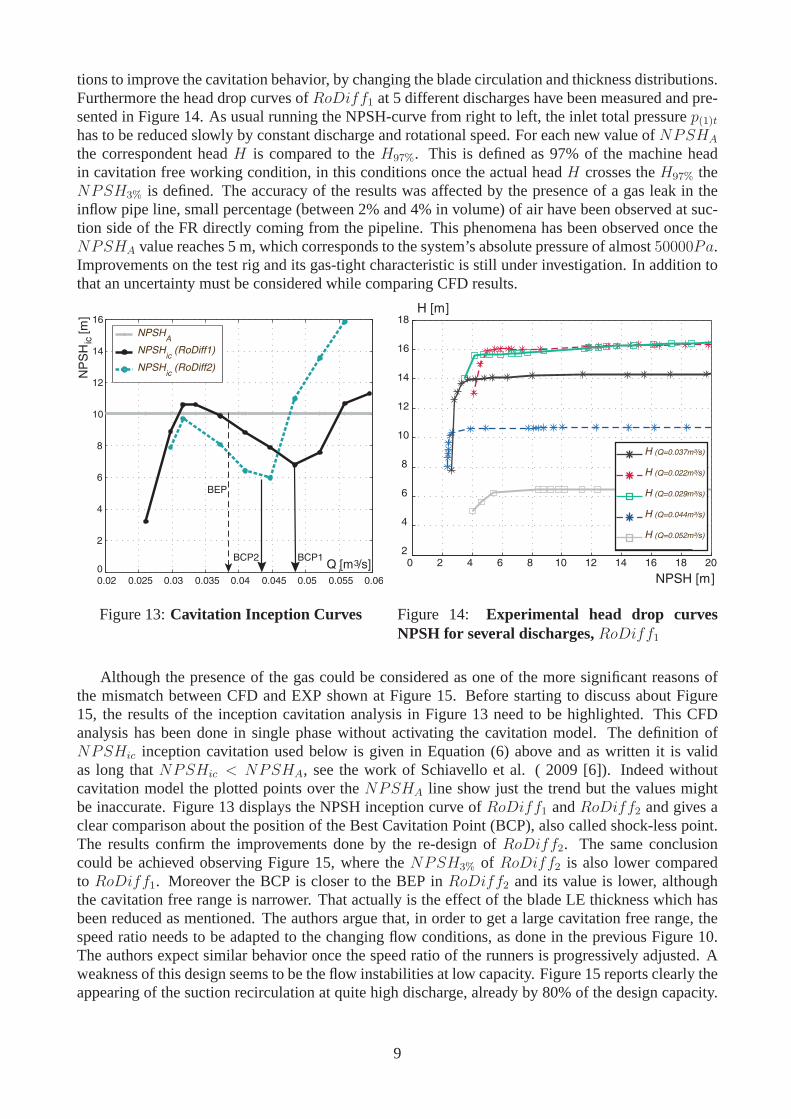
tions to improve the cavitation behavior, by changing the blade circulation and thickness distributions.Furthermore the head drop curves ofRoDiff1 at 5 different discharges have been measured and pre-sented in Figure 14. As usual running the NPSH-curve from right to left, the inlet total pressurep(1)thas to be reduced slowly by constant discharge and rotational speed. For each new value ofNPSHA
the correspondent headH is compared to theH97%. This is defined as 97% of the machine headin cavitation free working condition, in this conditions once the actual headH crosses theH97% theNPSH3% is defined. The accuracy of the results was affected by the presence of a gas leak in theinflow pipe line, small percentage (between 2% and 4% in volume) of air have been observed at suc-tion side of the FR directly coming from the pipeline. This phenomena has been observed once theNPSHA value reaches 5 m, which corresponds to the system’s absolute pressure of almost50000Pa.Improvements on the test rig and its gas-tight characteristic is still under investigation. In addition tothat an uncertainty must be considered while comparing CFD results.
0.02 0.025 0.03 0.035 0.04 0.045 0.05 0.055 0.06
0
2
4
6
8
10
12
14
16
Q [m3/s]
NP
SH
[m
]
NPSHA
NPSHic
(RoDiff1)
NPSHic
ic
(RoDiff2)
BEP
BCP2 BCP1
Figure 13:Cavitation Inception Curves
0 2 4 6 8 10 12 14 16 18 202
4
6
8
10
12
14
16
18
NPSH [m]
H [m]
H (Q=0.037m³/s)
H (Q=0.022m³/s)
H (Q=0.029m³/s)
H (Q=0.044m³/s)
H (Q=0.052m³/s)
Figure 14: Experimental head drop curvesNPSH for several discharges,RoDiff1
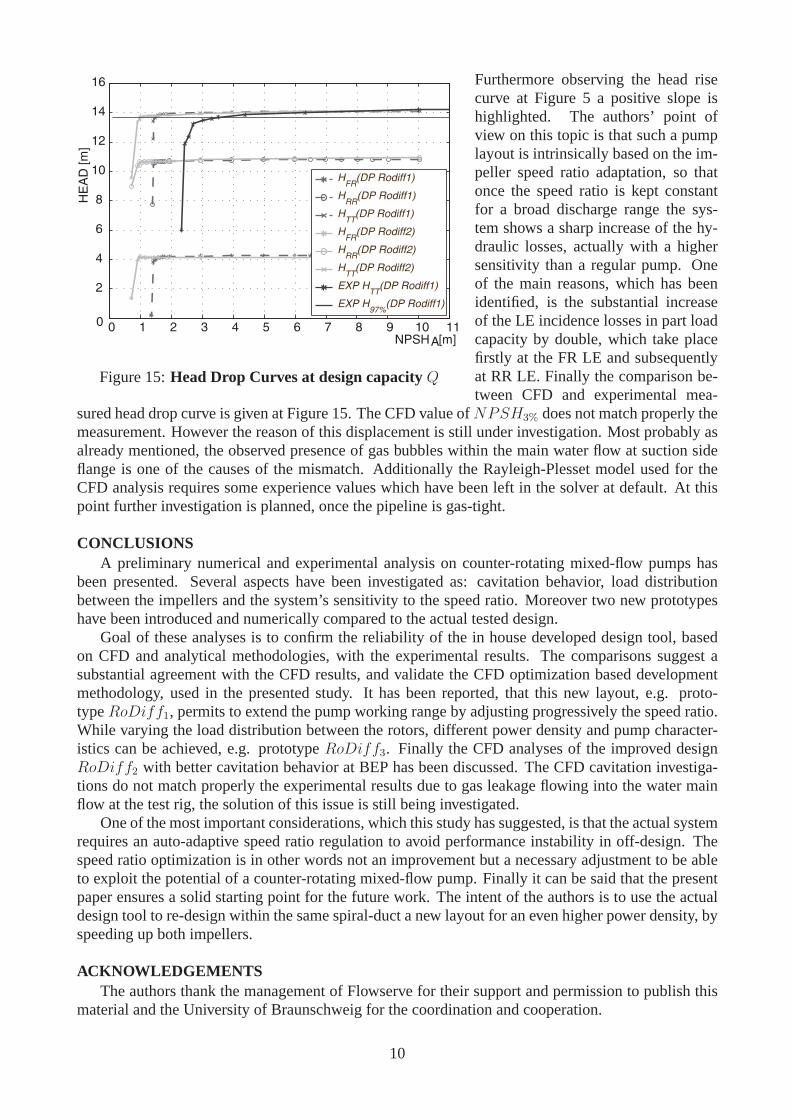
Although the presence of the gas could be considered as one ofthe more significant reasons ofthe mismatch between CFD and EXP shown at Figure 15. Before starting to discuss about Figure15, the results of the inception cavitation analysis in Figure 13 need to be highlighted. This CFDanalysis has been done in single phase without activating the cavitation model. The definition ofNPSHic inception cavitation used below is given in Equation (6) above and as written it is validas long thatNPSHic < NPSHA, see the work of Schiavello et al. ( 2009 [6]). Indeed withoutcavitation model the plotted points over theNPSHA line show just the trend but the values mightbe inaccurate. Figure 13 displays the NPSH inception curve of RoDiff1 andRoDiff2 and gives aclear comparison about the position of the Best Cavitation Point (BCP), also called shock-less point.The results confirm the improvements done by the re-design ofRoDiff2. The same conclusioncould be achieved observing Figure 15, where theNPSH3% of RoDiff2 is also lower comparedto RoDiff1. Moreover the BCP is closer to the BEP inRoDiff2 and its value is lower, althoughthe cavitation free range is narrower. That actually is the effect of the blade LE thickness which hasbeen reduced as mentioned. The authors argue that, in order to get a large cavitation free range, thespeed ratio needs to be adapted to the changing flow conditions, as done in the previous Figure 10.The authors expect similar behavior once the speed ratio of the runners is progressively adjusted. Aweakness of this design seems to be the flow instabilities at low capacity. Figure 15 reports clearly theappearing of the suction recirculation at quite high discharge, already by 80% of the design capacity.
9
0 1 2 3 4 5 6 7 8 9 10 110
2
4
6
8
10
12
14
16
NPSHA [m]
HE
AD
[m
]
HFR
(DP Rodiff1)
HRR
(DP Rodiff1)
HTT
(DP Rodiff1)
HFR
(DP Rodiff2)
HRR
(DP Rodiff2)
HTT
(DP Rodiff2)
EXP HTT
(DP Rodiff1)
EXP H97%
(DP Rodiff1)
Figure 15:Head Drop Curves at design capacityQ
Furthermore observing the head risecurve at Figure 5 a positive slope ishighlighted. The authors’ point ofview on this topic is that such a pumplayout is intrinsically based on the im-peller speed ratio adaptation, so thatonce the speed ratio is kept constantfor a broad discharge range the sys-tem shows a sharp increase of the hy-draulic losses, actually with a highersensitivity than a regular pump. Oneof the main reasons, which has beenidentified, is the substantial increaseof the LE incidence losses in part loadcapacity by double, which take placefirstly at the FR LE and subsequentlyat RR LE. Finally the comparison be-tween CFD and experimental mea-
sured head drop curve is given at Figure 15. The CFD value ofNPSH3% does not match properly themeasurement. However the reason of this displacement is still under investigation. Most probably asalready mentioned, the observed presence of gas bubbles within the main water flow at suction sideflange is one of the causes of the mismatch. Additionally the Rayleigh-Plesset model used for theCFD analysis requires some experience values which have beenleft in the solver at default. At thispoint further investigation is planned, once the pipeline is gas-tight.
CONCLUSIONSA preliminary numerical and experimental analysis on counter-rotating mixed-flow pumps has
been presented. Several aspects have been investigated as:cavitation behavior, load distributionbetween the impellers and the system’s sensitivity to the speed ratio. Moreover two new prototypeshave been introduced and numerically compared to the actualtested design.
Goal of these analyses is to confirm the reliability of the in house developed design tool, basedon CFD and analytical methodologies, with the experimental results. The comparisons suggest asubstantial agreement with the CFD results, and validate theCFD optimization based developmentmethodology, used in the presented study. It has been reported, that this new layout, e.g. proto-typeRoDiff1, permits to extend the pump working range by adjusting progressively the speed ratio.While varying the load distribution between the rotors, different power density and pump character-istics can be achieved, e.g. prototypeRoDiff3. Finally the CFD analyses of the improved designRoDiff2 with better cavitation behavior at BEP has been discussed. The CFD cavitation investiga-tions do not match properly the experimental results due to gas leakage flowing into the water mainflow at the test rig, the solution of this issue is still being investigated.
One of the most important considerations, which this study has suggested, is that the actual systemrequires an auto-adaptive speed ratio regulation to avoid performance instability in off-design. Thespeed ratio optimization is in other words not an improvement but a necessary adjustment to be ableto exploit the potential of a counter-rotating mixed-flow pump. Finally it can be said that the presentpaper ensures a solid starting point for the future work. Theintent of the authors is to use the actualdesign tool to re-design within the same spiral-duct a new layout for an even higher power density, byspeeding up both impellers.
ACKNOWLEDGEMENTSThe authors thank the management of Flowserve for their support and permission to publish this
material and the University of Braunschweig for the coordination and cooperation.
10
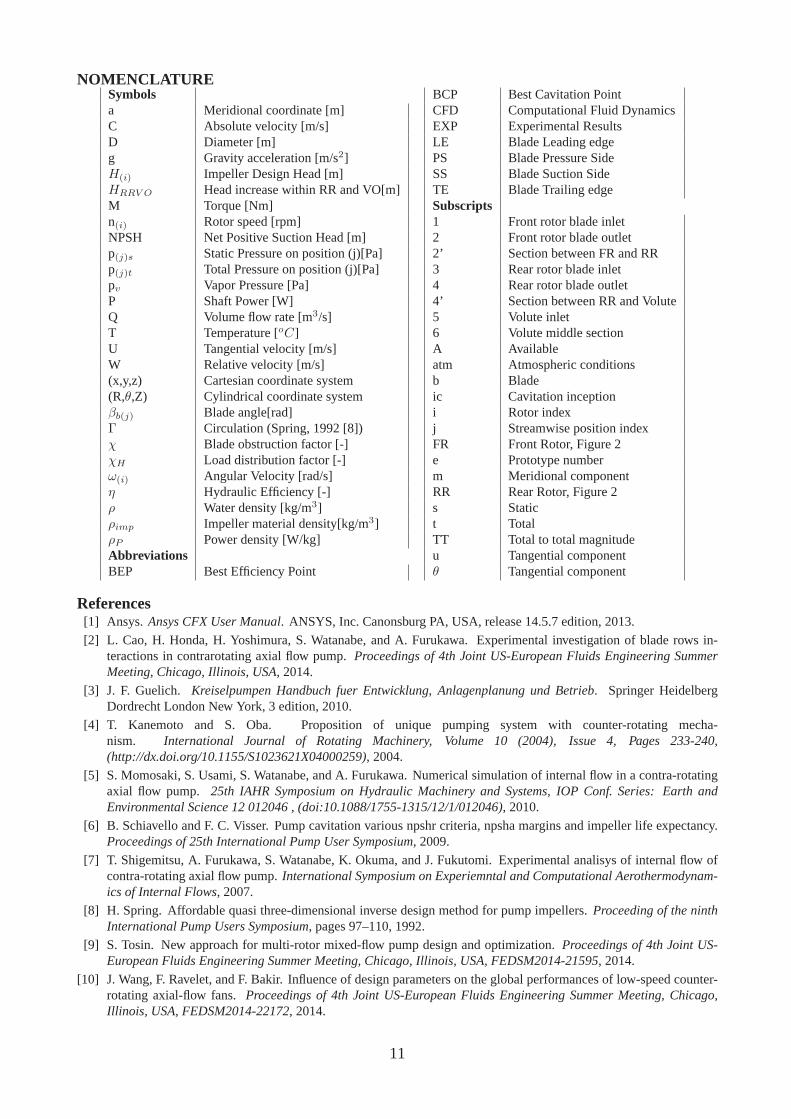
NOMENCLATURESymbolsa Meridional coordinate [m]C Absolute velocity [m/s]D Diameter [m]g Gravity acceleration [m/s2]H(i) Impeller Design Head [m]HRRV O Head increase within RR and VO[m]M Torque [Nm]n(i) Rotor speed [rpm]NPSH Net Positive Suction Head [m]p(j)s Static Pressure on position (j)[Pa]p(j)t Total Pressure on position (j)[Pa]pv Vapor Pressure [Pa]P Shaft Power [W]Q Volume flow rate [m3/s]T Temperature [oC]U Tangential velocity [m/s]W Relative velocity [m/s](x,y,z) Cartesian coordinate system(R,θ,Z) Cylindrical coordinate systemβb(j) Blade angle[rad]Γ Circulation (Spring, 1992 [8])χ Blade obstruction factor [-]χH Load distribution factor [-]ω(i) Angular Velocity [rad/s]η Hydraulic Efficiency [-]ρ Water density [kg/m3]ρimp Impeller material density[kg/m3]ρP Power density [W/kg]AbbreviationsBEP Best Efficiency Point
BCP Best Cavitation PointCFD Computational Fluid DynamicsEXP Experimental ResultsLE Blade Leading edgePS Blade Pressure SideSS Blade Suction SideTE Blade Trailing edgeSubscripts1 Front rotor blade inlet2 Front rotor blade outlet2’ Section between FR and RR3 Rear rotor blade inlet4 Rear rotor blade outlet4’ Section between RR and Volute5 Volute inlet6 Volute middle sectionA Availableatm Atmospheric conditionsb Bladeic Cavitation inceptioni Rotor indexj Streamwise position indexFR Front Rotor, Figure 2e Prototype numberm Meridional componentRR Rear Rotor, Figure 2s Statict TotalTT Total to total magnitudeu Tangential componentθ Tangential component
References[1] Ansys. Ansys CFX User Manual. ANSYS, Inc. Canonsburg PA, USA, release 14.5.7 edition, 2013.
[2] L. Cao, H. Honda, H. Yoshimura, S. Watanabe, and A. Furukawa. Experimental investigation of blade rows in-teractions in contrarotating axial flow pump.Proceedings of 4th Joint US-European Fluids Engineering SummerMeeting, Chicago, Illinois, USA, 2014.
[3] J. F. Guelich. Kreiselpumpen Handbuch fuer Entwicklung, Anlagenplanung und Betrieb. Springer HeidelbergDordrecht London New York, 3 edition, 2010.
[4] T. Kanemoto and S. Oba. Proposition of unique pumping system with counter-rotating mecha-nism. International Journal of Rotating Machinery, Volume 10 (2004), Issue 4, Pages 233-240,(http://dx.doi.org/10.1155/S1023621X04000259), 2004.
[5] S. Momosaki, S. Usami, S. Watanabe, and A. Furukawa. Numerical simulation of internal flow in a contra-rotatingaxial flow pump. 25th IAHR Symposium on Hydraulic Machinery and Systems, IOP Conf. Series: Earth andEnvironmental Science 12 012046 , (doi:10.1088/1755-1315/12/1/012046), 2010.
[6] B. Schiavello and F. C. Visser. Pump cavitation various npshr criteria, npsha margins and impeller life expectancy.Proceedings of 25th International Pump User Symposium, 2009.
[7] T. Shigemitsu, A. Furukawa, S. Watanabe, K. Okuma, and J.Fukutomi. Experimental analisys of internal flow ofcontra-rotating axial flow pump.International Symposium on Experiemntal and Computational Aerothermodynam-ics of Internal Flows, 2007.
[8] H. Spring. Affordable quasi three-dimensional inversedesign method for pump impellers.Proceeding of the ninthInternational Pump Users Symposium, pages 97–110, 1992.
[9] S. Tosin. New approach for multi-rotor mixed-flow pump design and optimization.Proceedings of 4th Joint US-European Fluids Engineering Summer Meeting, Chicago, Illinois, USA, FEDSM2014-21595, 2014.
[10] J. Wang, F. Ravelet, and F. Bakir. Influence of design parameters on the global performances of low-speed counter-rotating axial-flow fans.Proceedings of 4th Joint US-European Fluids Engineering Summer Meeting, Chicago,Illinois, USA, FEDSM2014-22172, 2014.
11