Embed Size (px)
Citation preview
Jake Bernstein
New Concepts in Short Term Timing http://www.trade-futures.com
© 2013 by Jake Bernstein
www.trade-futures.com [email protected]
800-678-5253 * 831-430-0600
The best time frames for short-term trading
How to TIME PRECISE market entry with small
trader sentiment
The INSIDE bar and OUTSIDE bar patterns with
timing
Short-Term Bernstein Trend Indicator
Clear examples and exact rules
Step-by-step walk through of each pattern
Best markets for short-term application of the
patterns
Time of Day Pattern
Overview, Goals and Concepts
The goals and considerations
- Examine potentially new timing tools
- Understand what they do
- Do they have “face validity”?
- Do they work better? Example (2 slides)
- What does “work better” mean?
- Considerations: your limits
- Time frame and profits: Example (2 slides)
- Who is your competition?
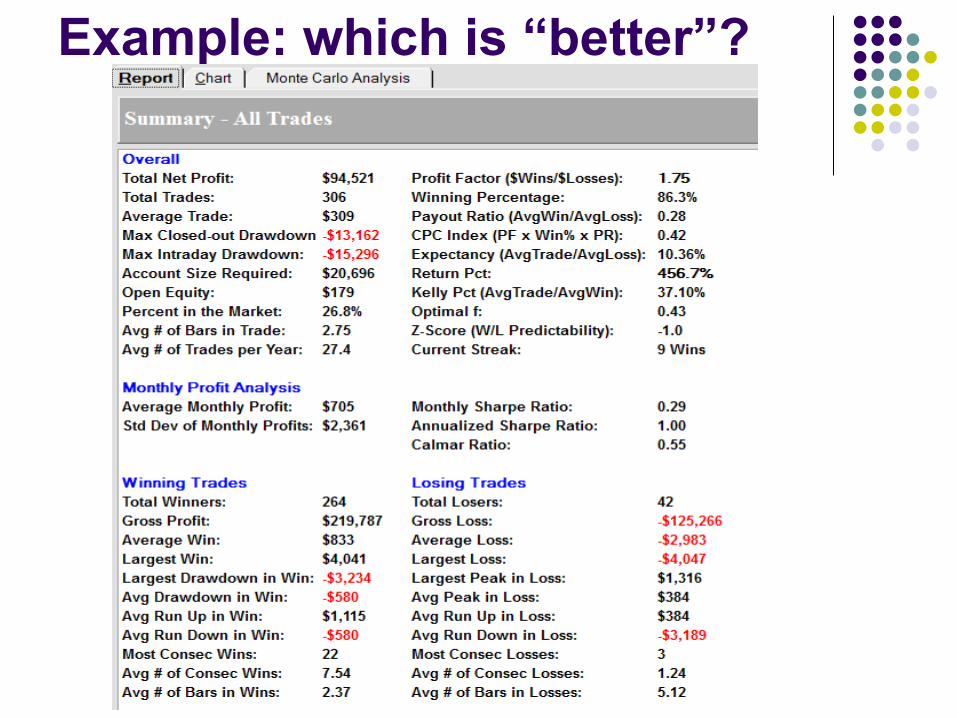
Example: which is “better”?
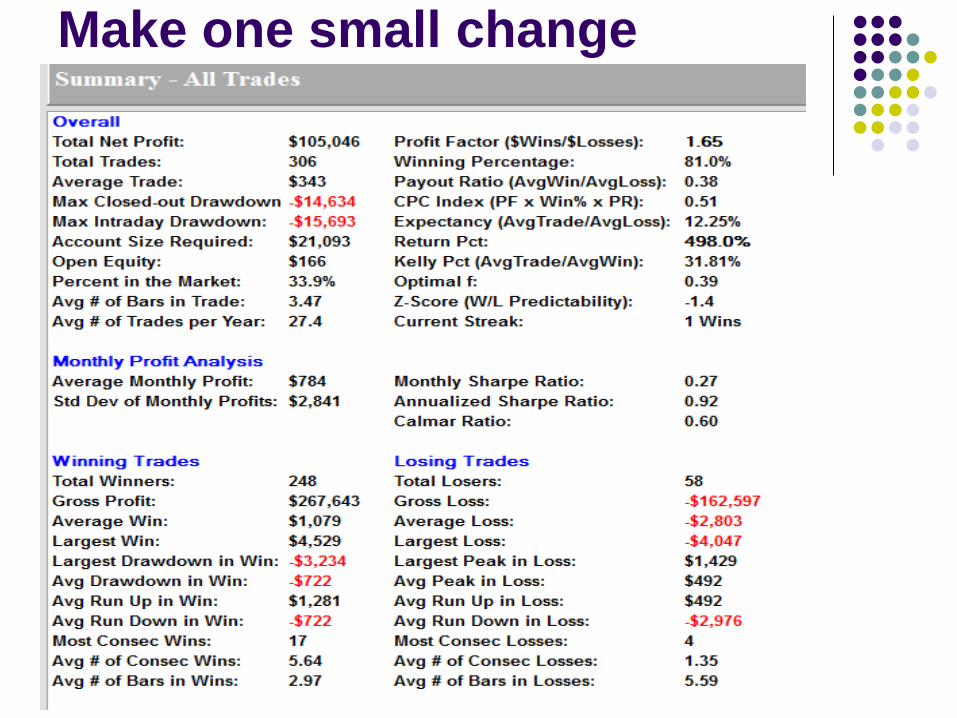
Make one small change
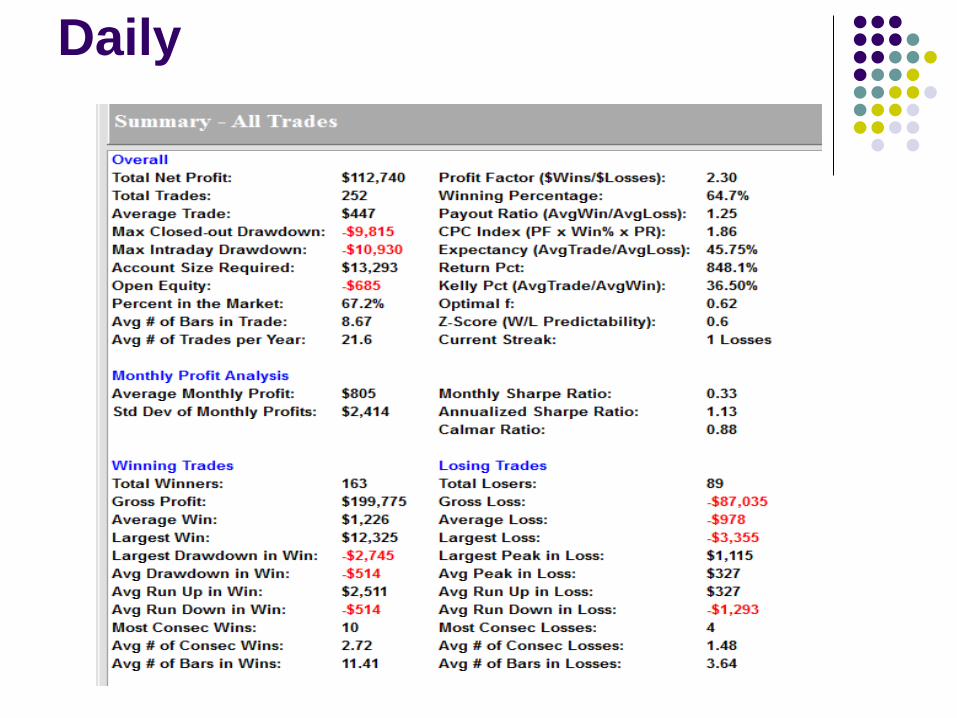
Daily
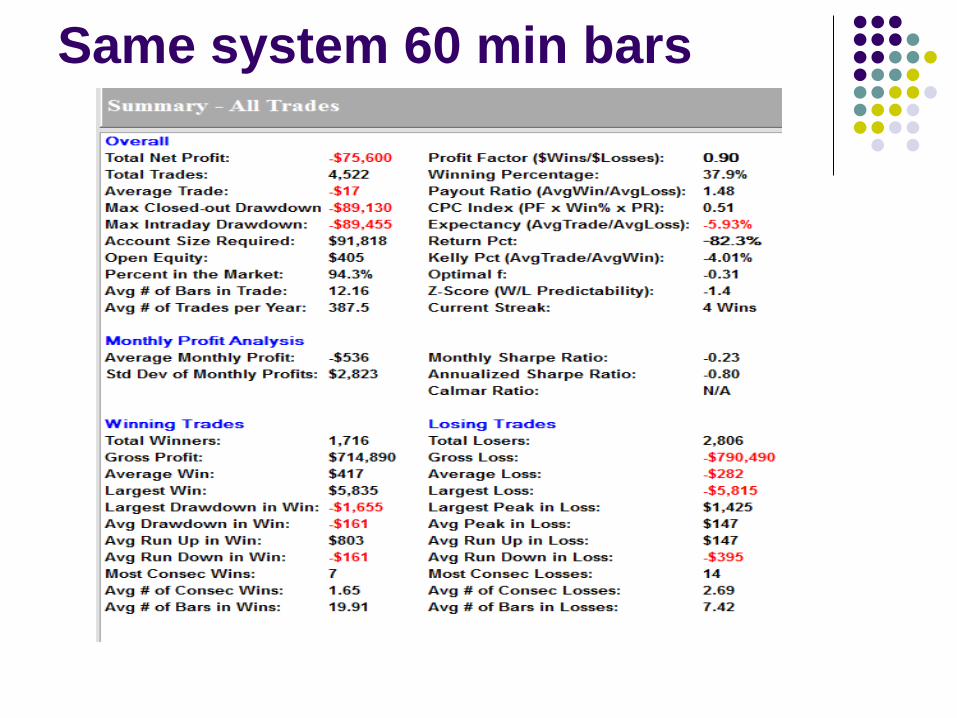
Same system 60 min bars
Types of indicators
Trend following
Breakout and volatility breakout
Price patterns
Chart patterns
HFT Algorithmic (new category – why)?
Seasonal
Myth and magic
Astrology / planetary
Fundamentals
Fundamentals + timing
Inside information legal and otherwise
Some of my timing tools and comments
Gap Trades
MA Channel 8 hi 8 low WAD / 57 MA
MOM DIV 28 MACD DIV 9,18
30 MBO S&P*
8 OC
Time frames
Exits by end of day
Risk – reward analysis
Multiple positions and profit maximizing
Order placement procedures
What I will cover today
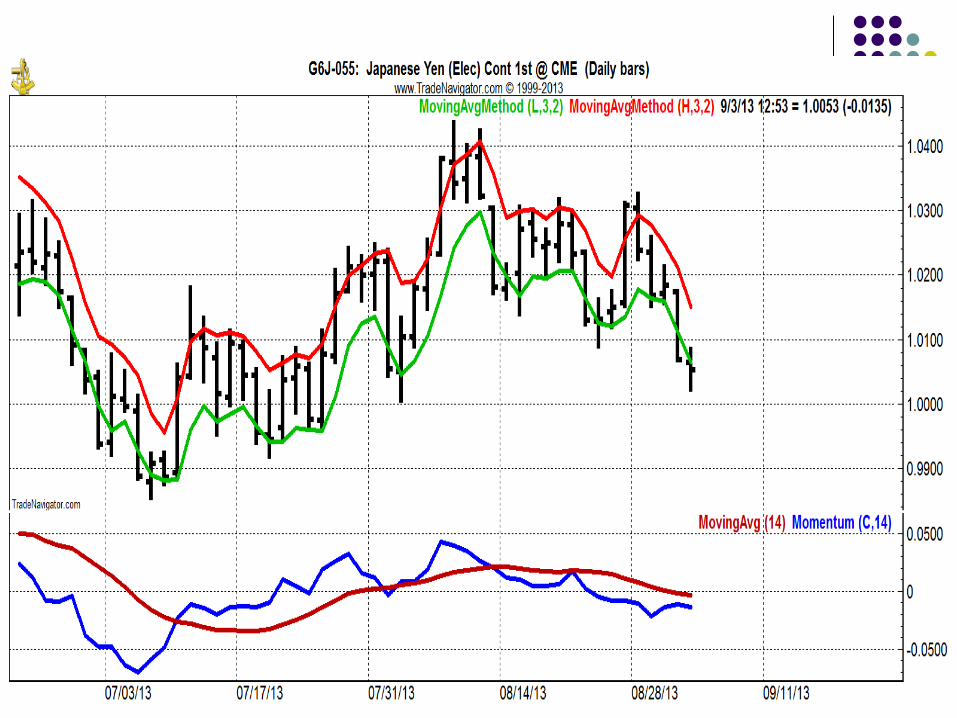
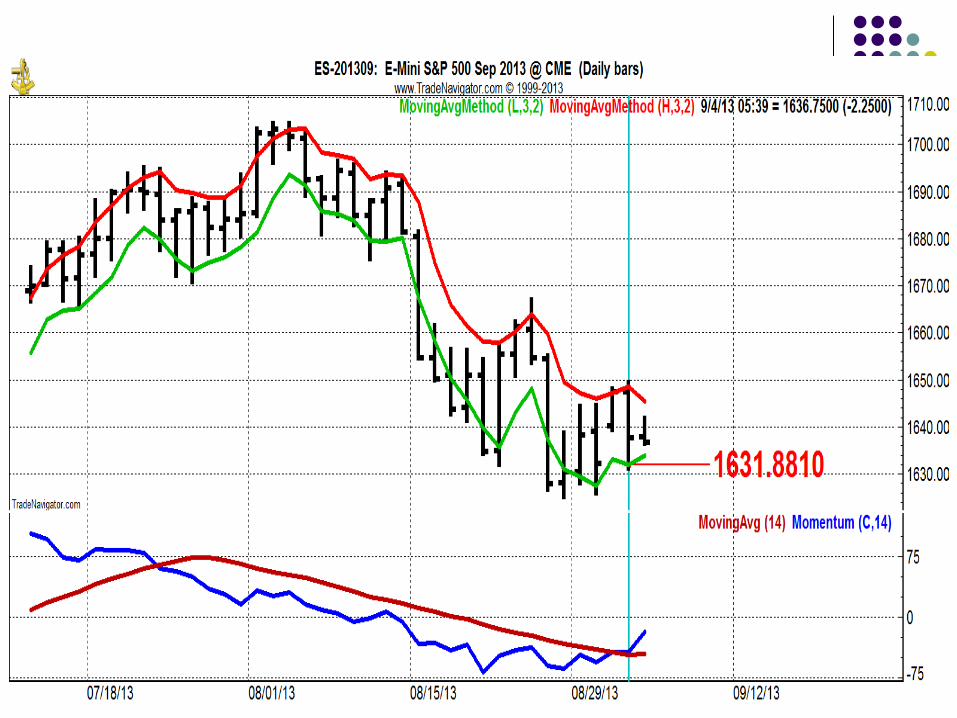
1) Short term 3/3 + ema swing trade
2) Sentiment divergence
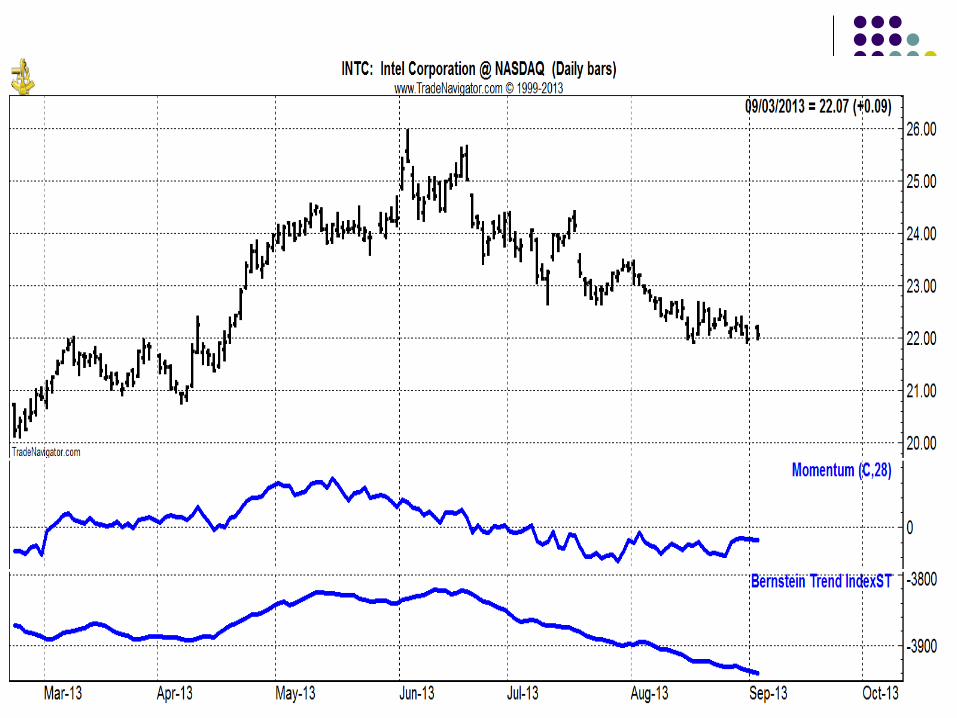
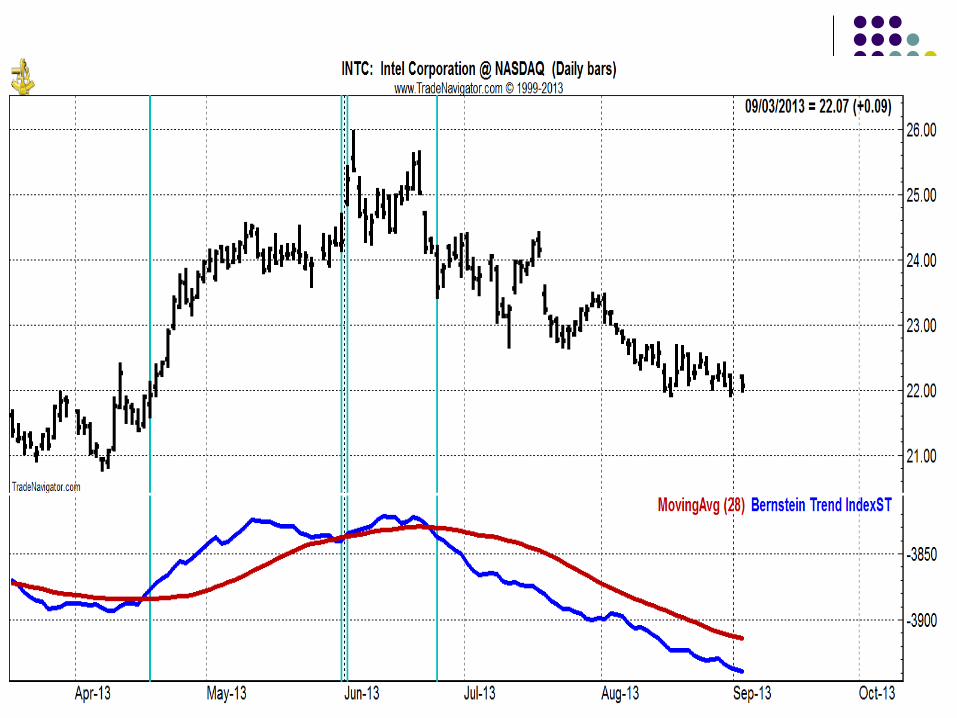
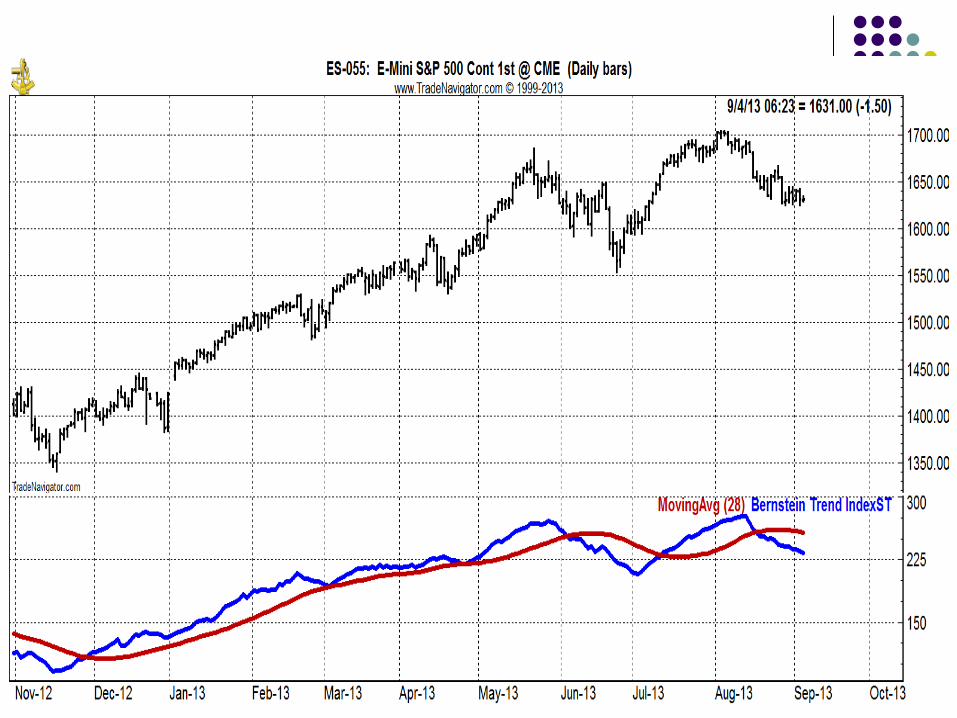
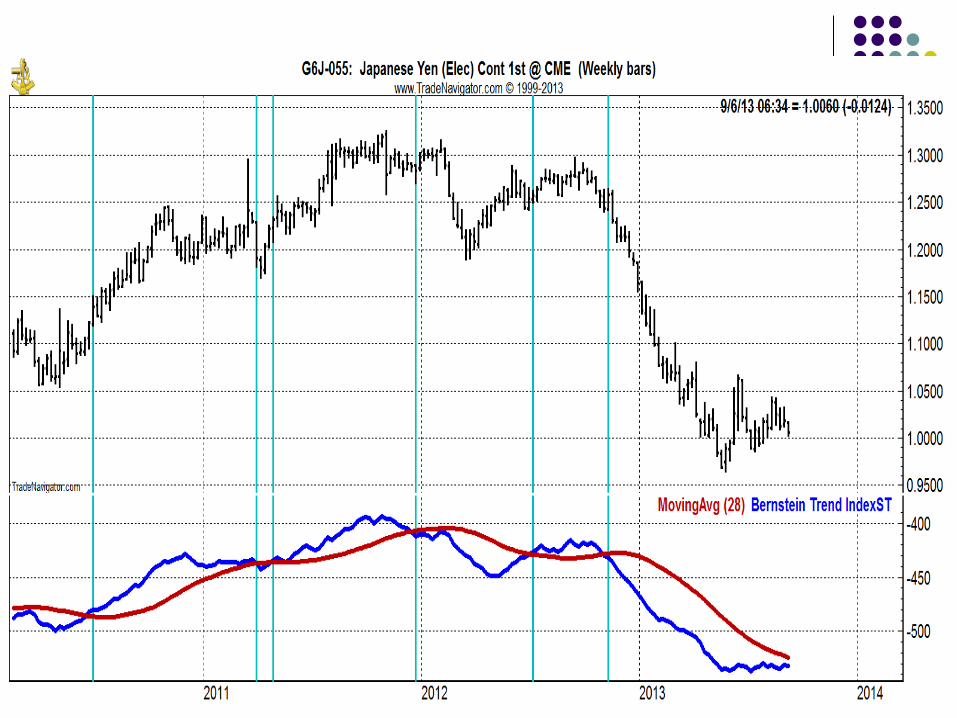
3) Multiple pattern index (BTI)
4) Time of day pattern S&P
* Several things I will cover today are still
preliminary and need more work and testing -
where this is not the case I will so indicate
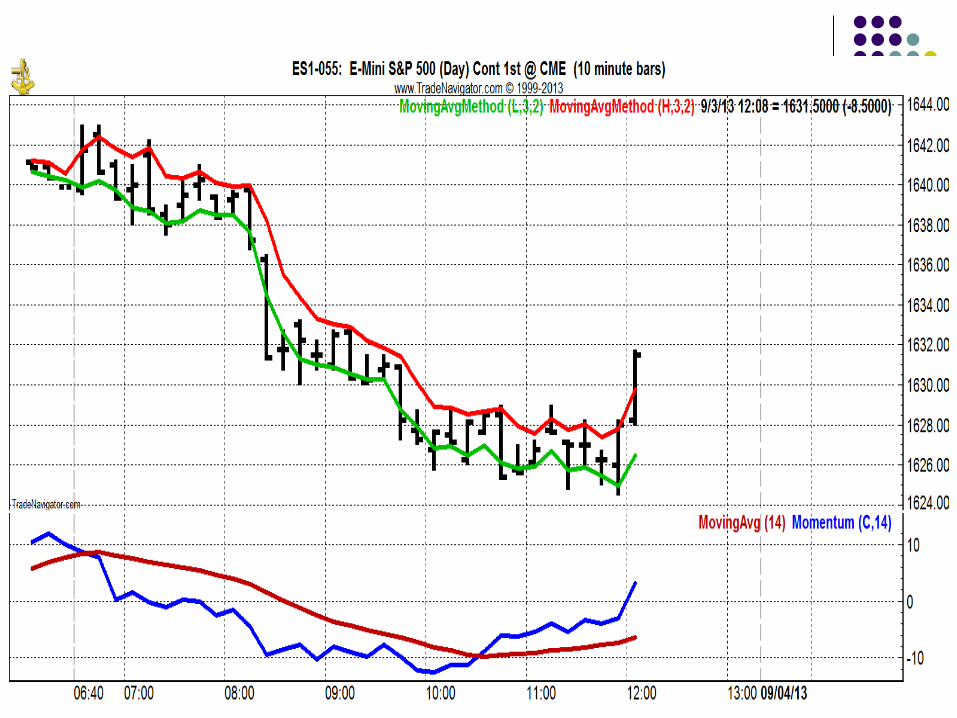
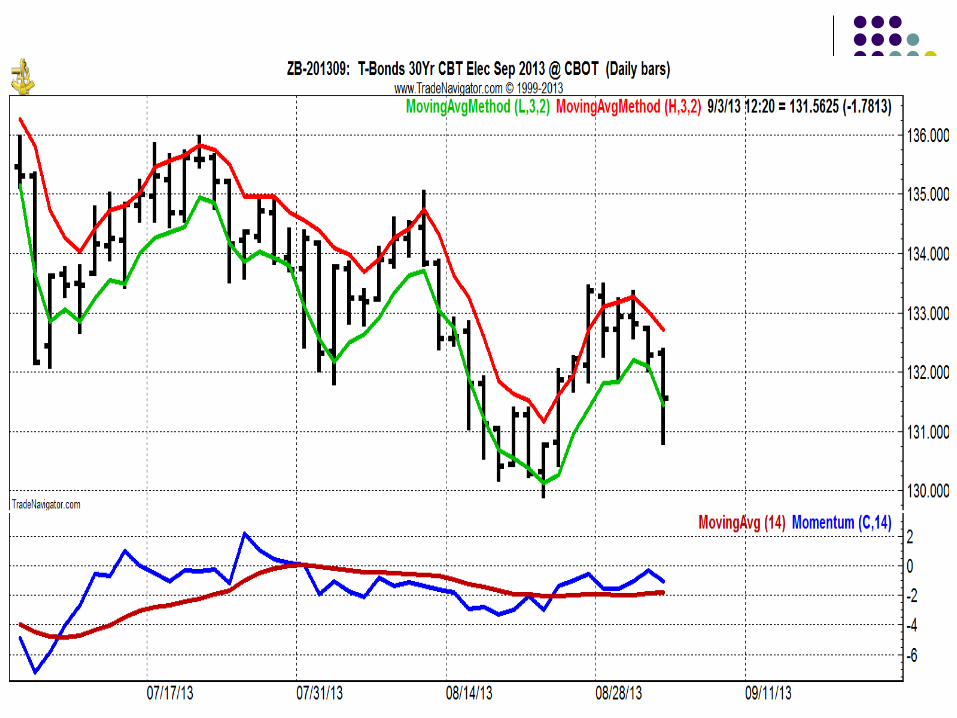
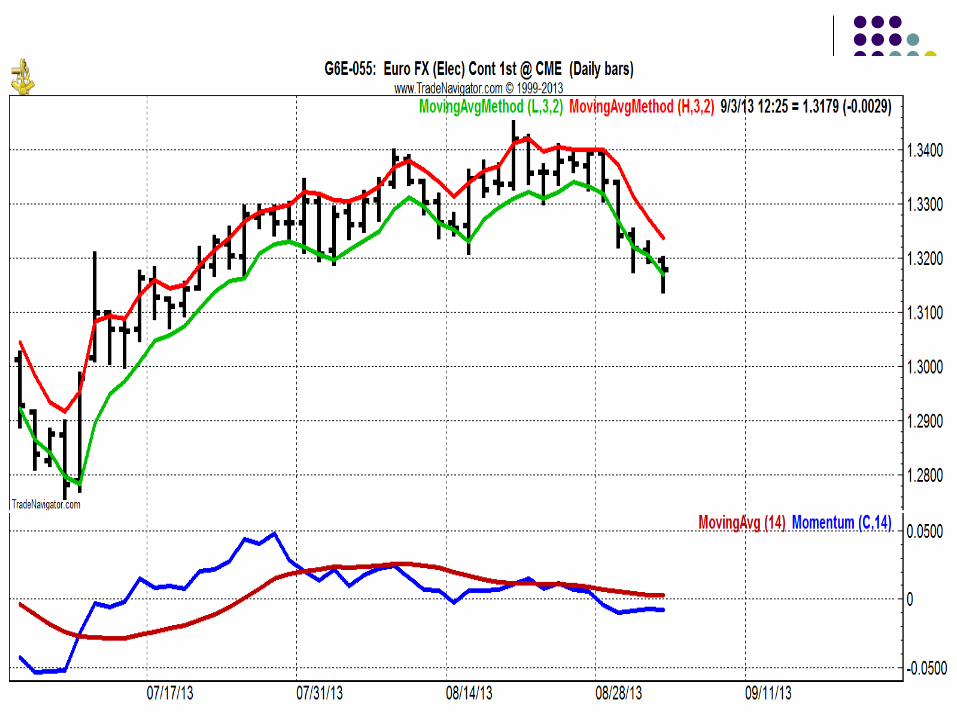
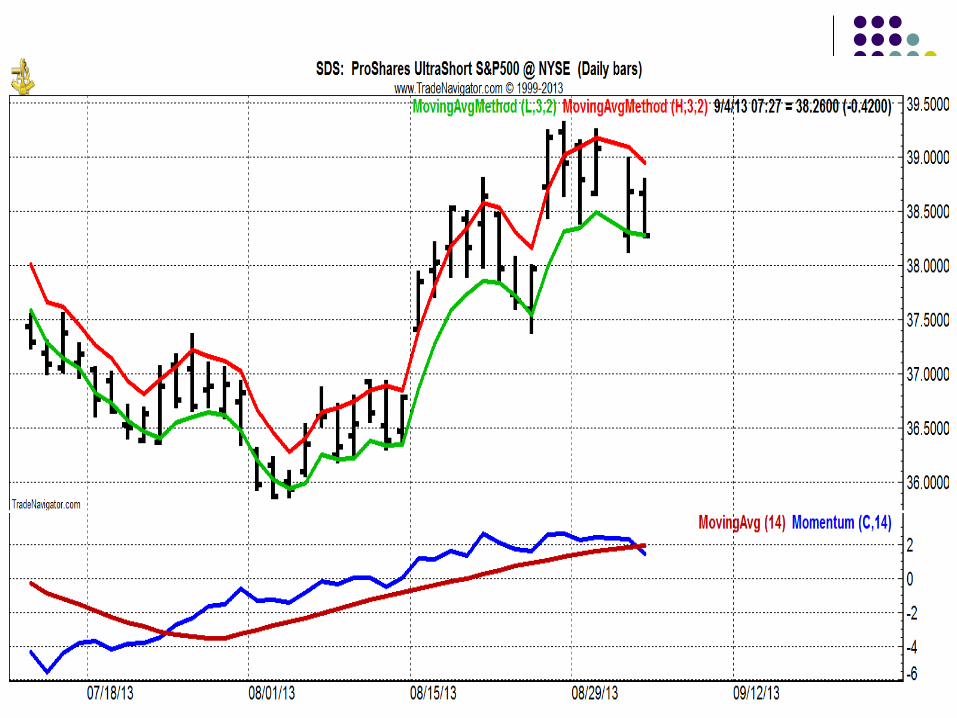
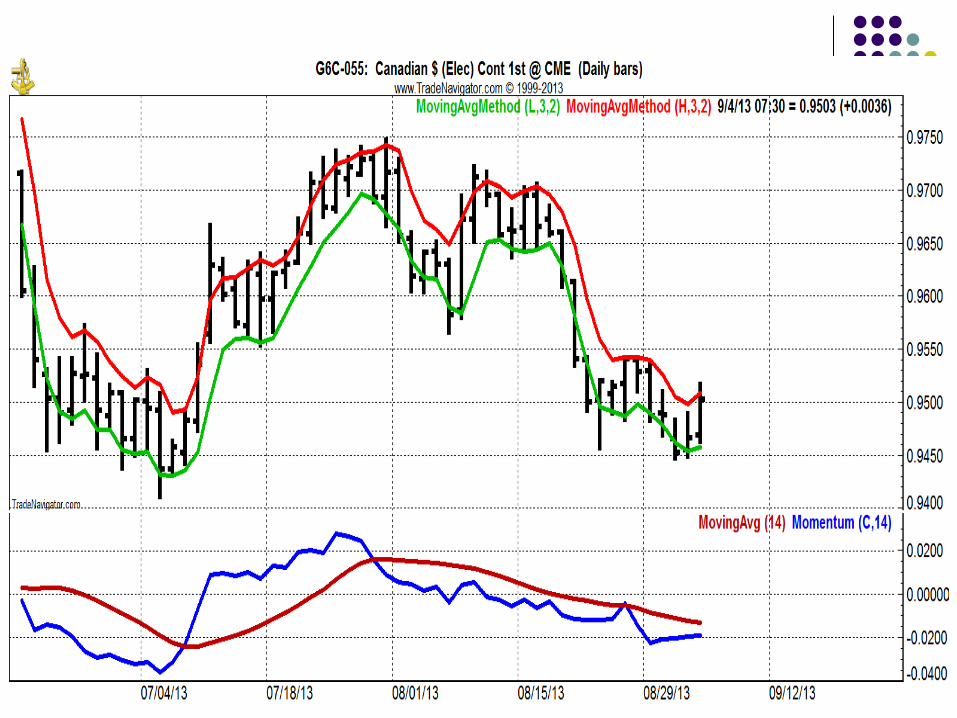
EMA Channel + trend
• Follows STF model
• Very short term (1-5 time units)
• Best markets ES, CL, GC, Currency ZB
• MAC channel XMA 3 low 3 high entry
• Trend signal MOM 14 / MA 14
• Maximizing strategies
• Time frames
• Examples
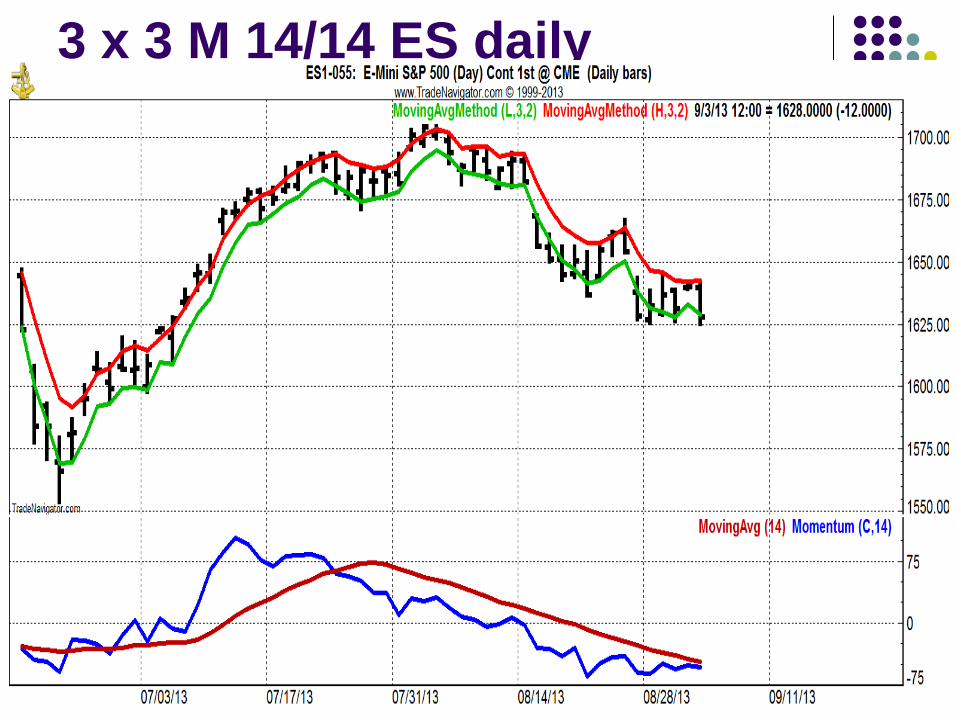
3 x 3 M 14/14 ES daily
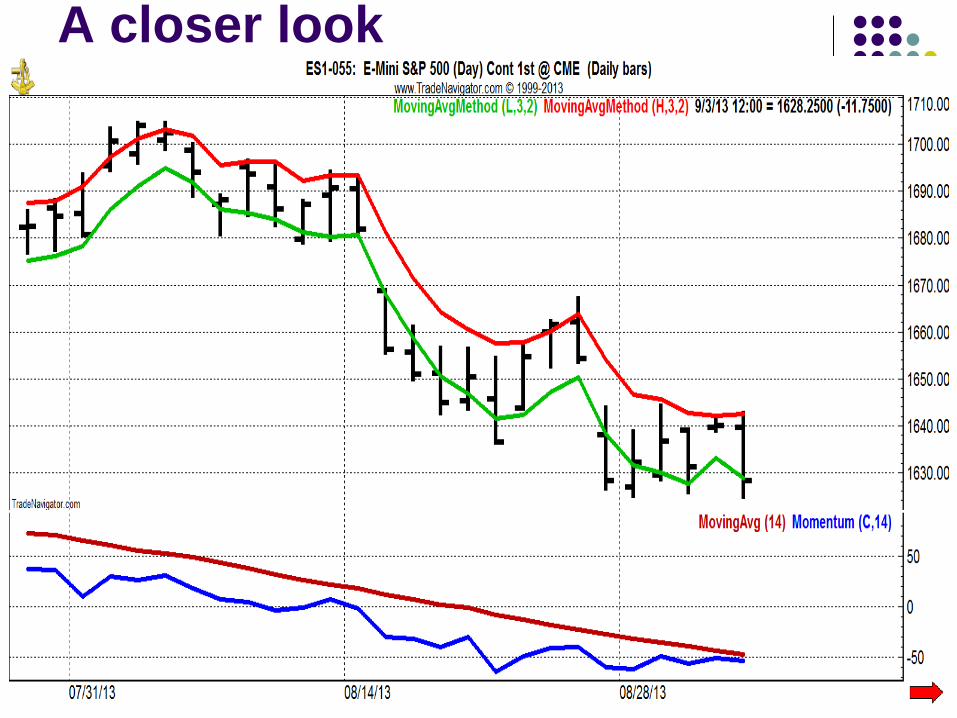
A closer look
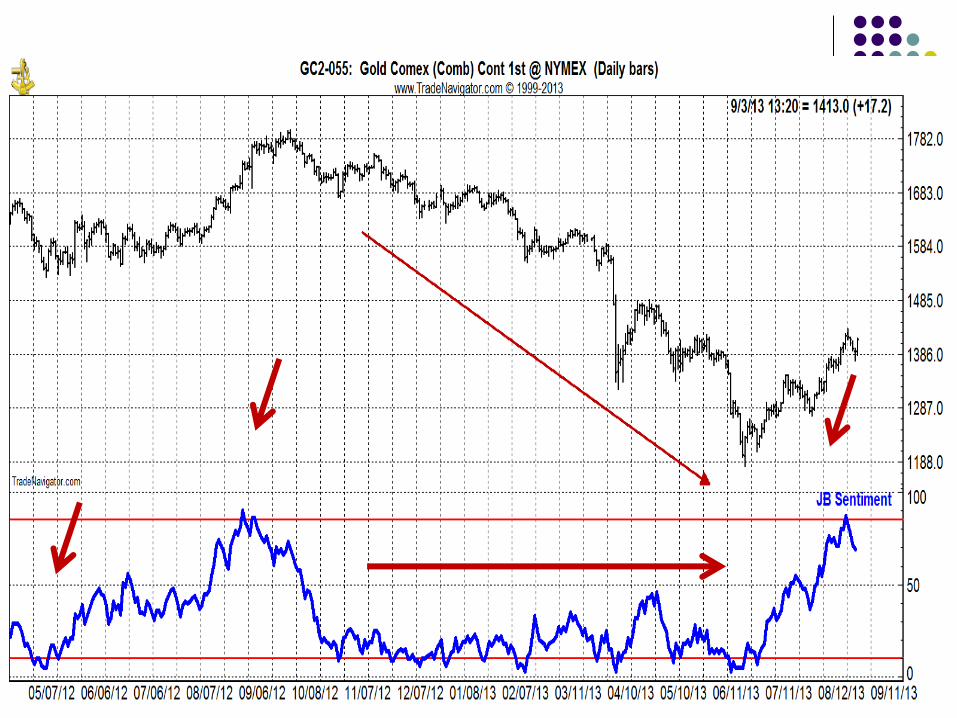
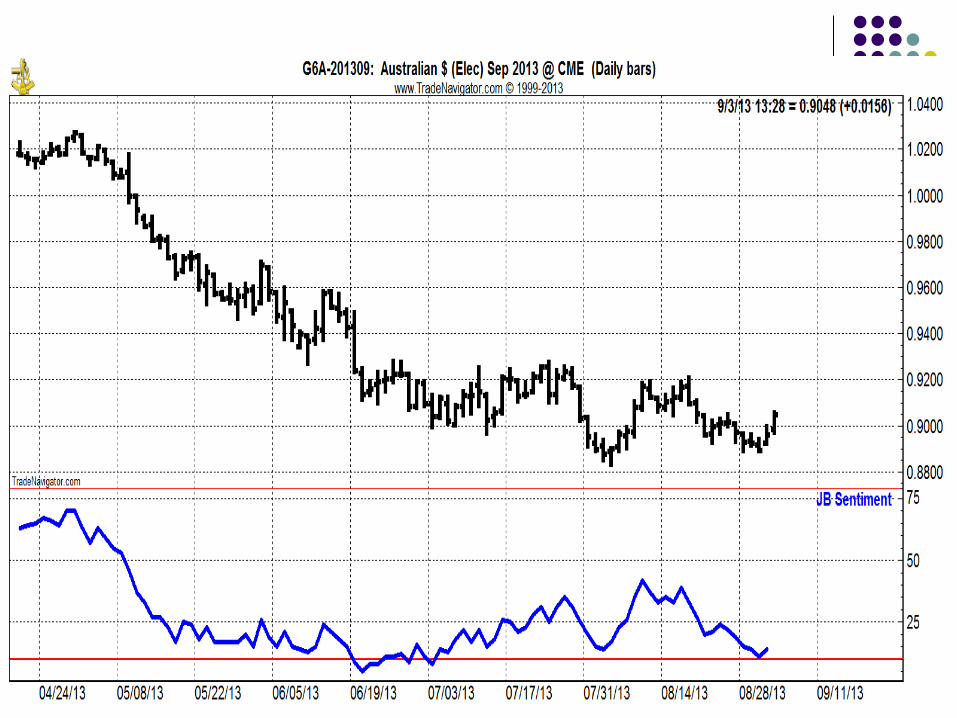
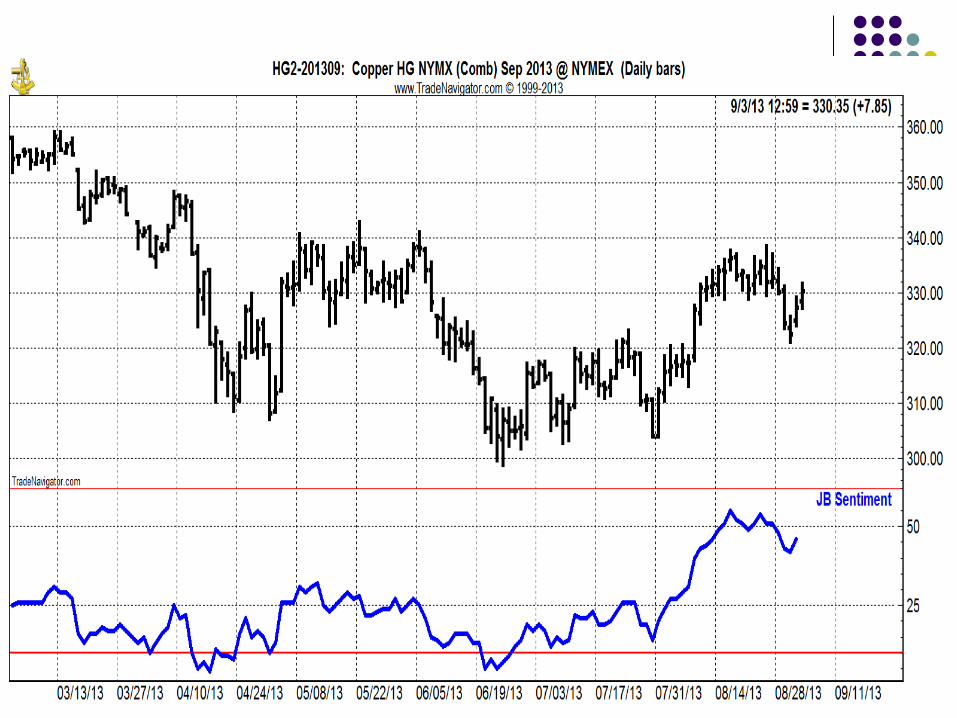
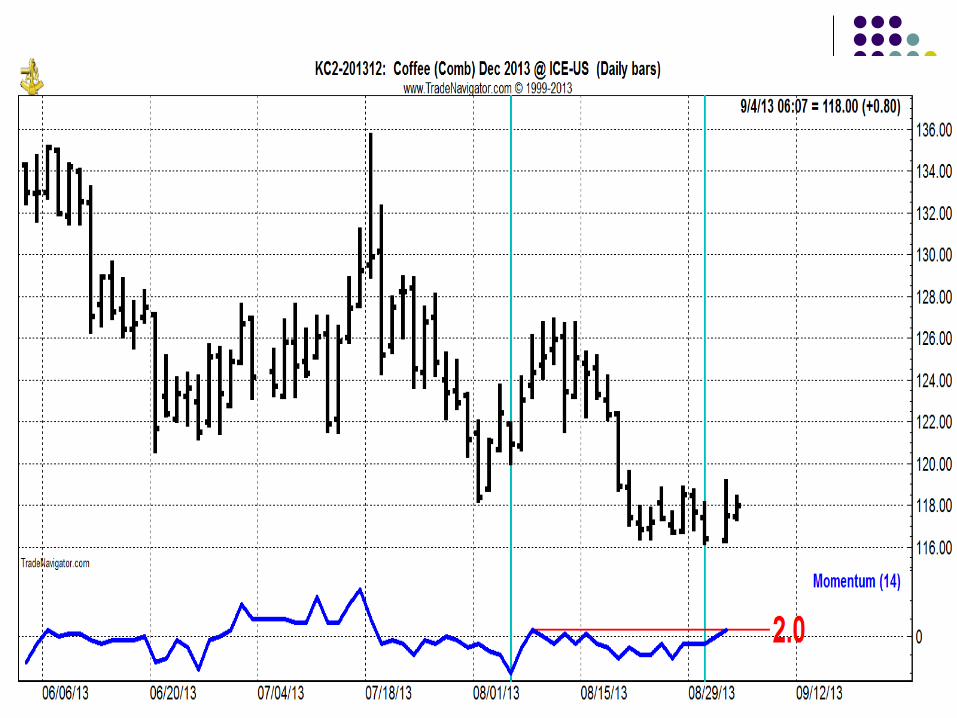
Sentiment Divergence
Momentum divergence reviewed
WHY divergence is valid
What divergence tells us
Is there another way?
Market sentiment overview (slide)
DSI (slide)
What sentiment divergence means
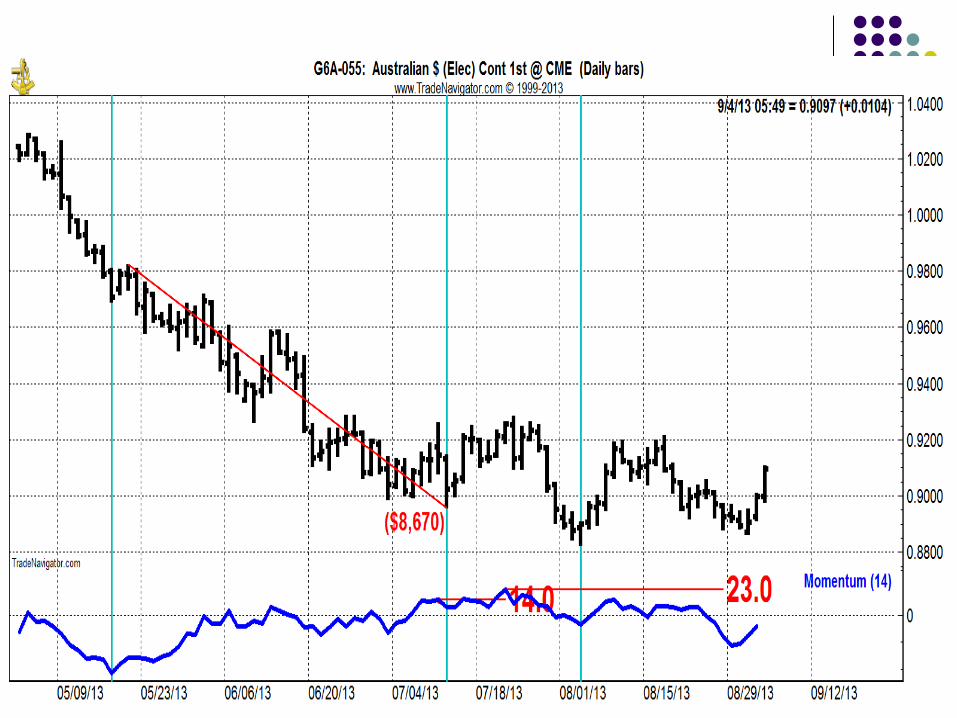
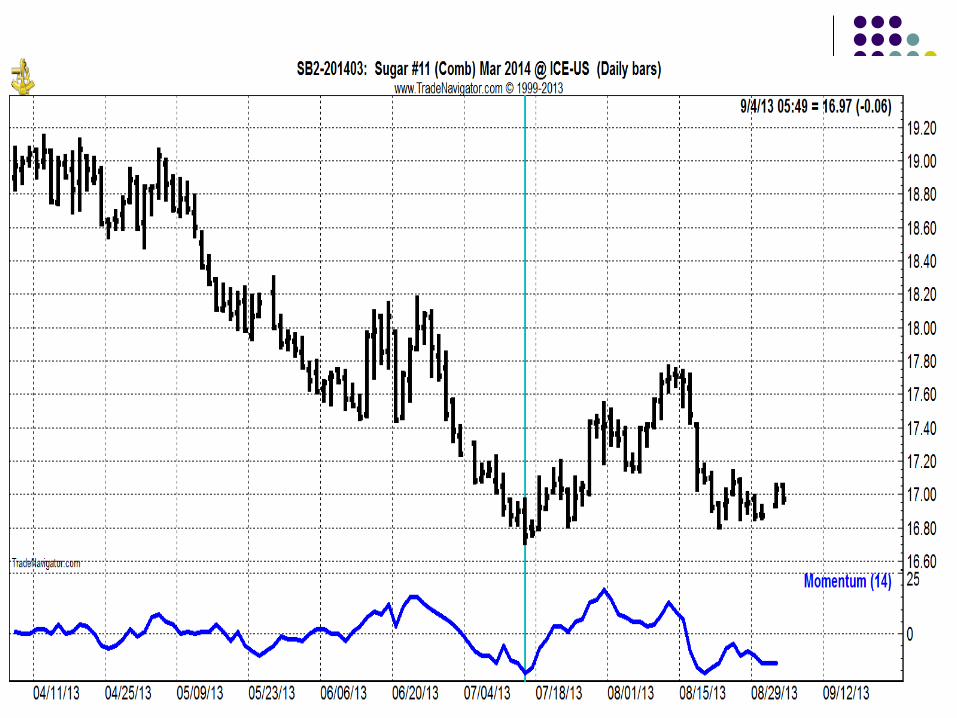
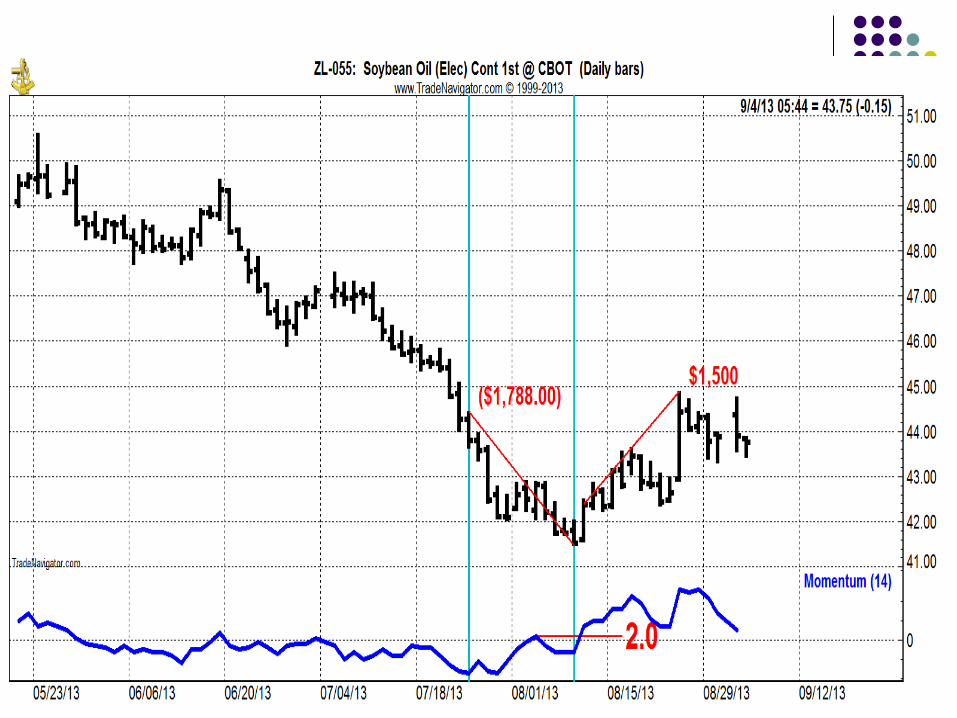
Momentum of sentiment: why
Examples
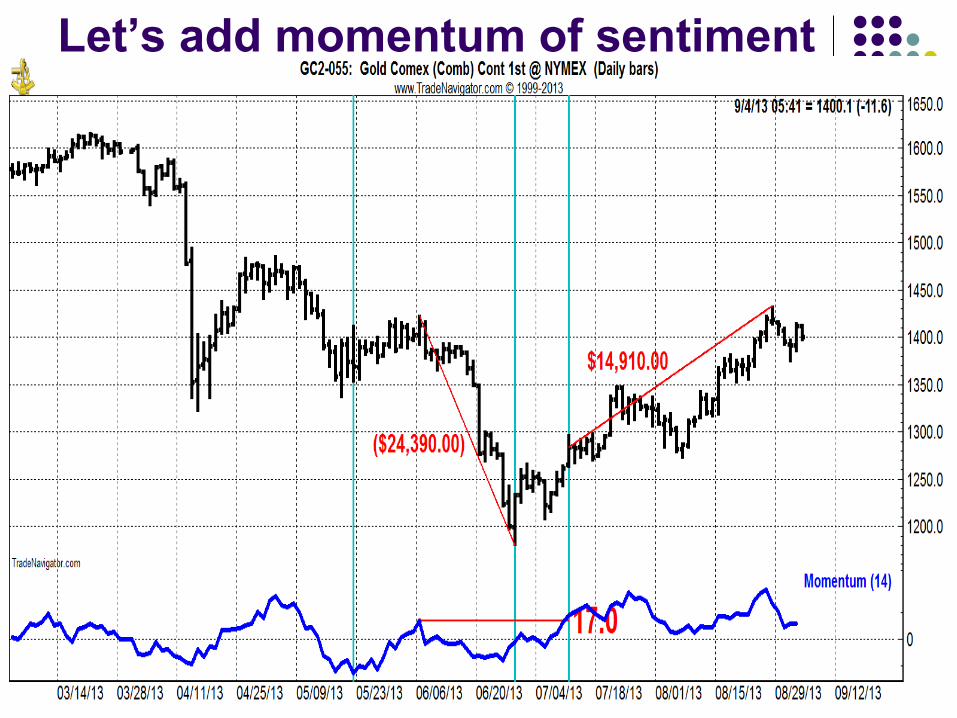
Let’s add momentum of sentiment
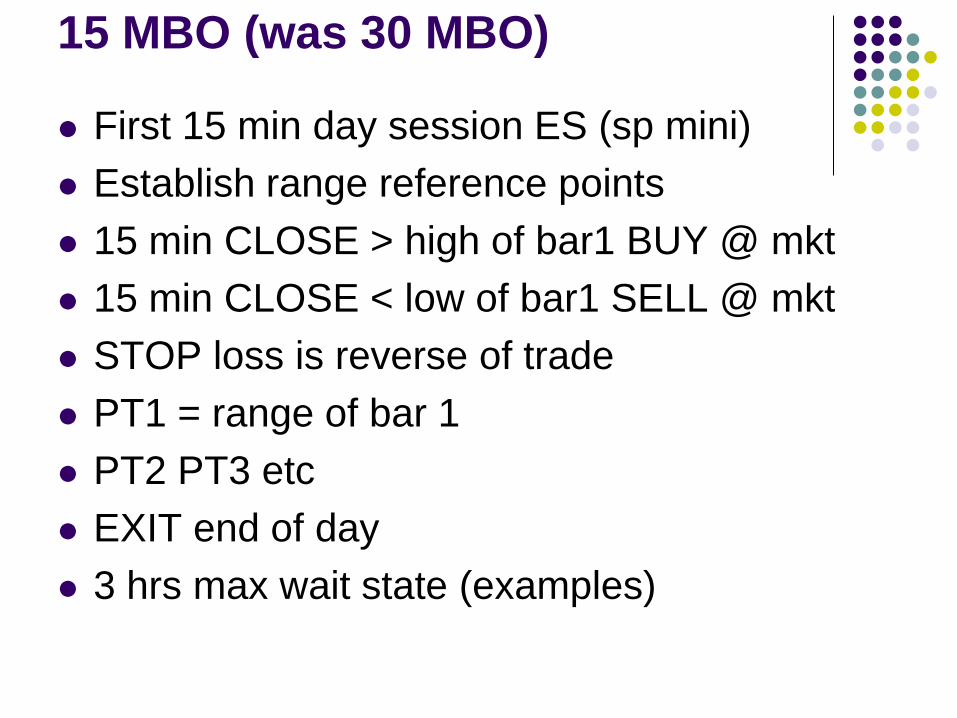
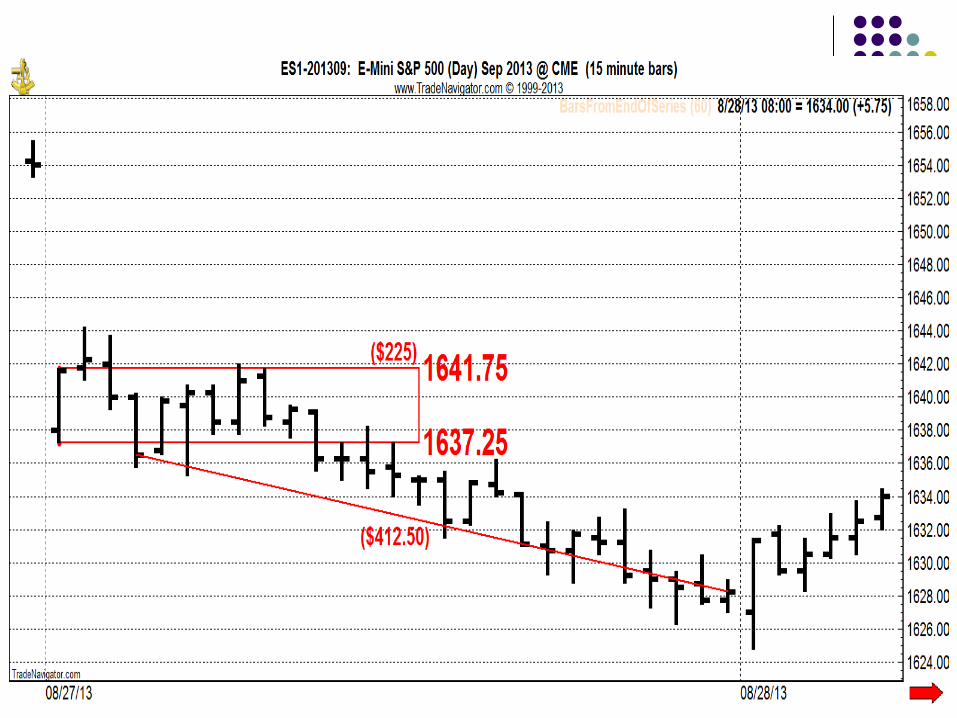
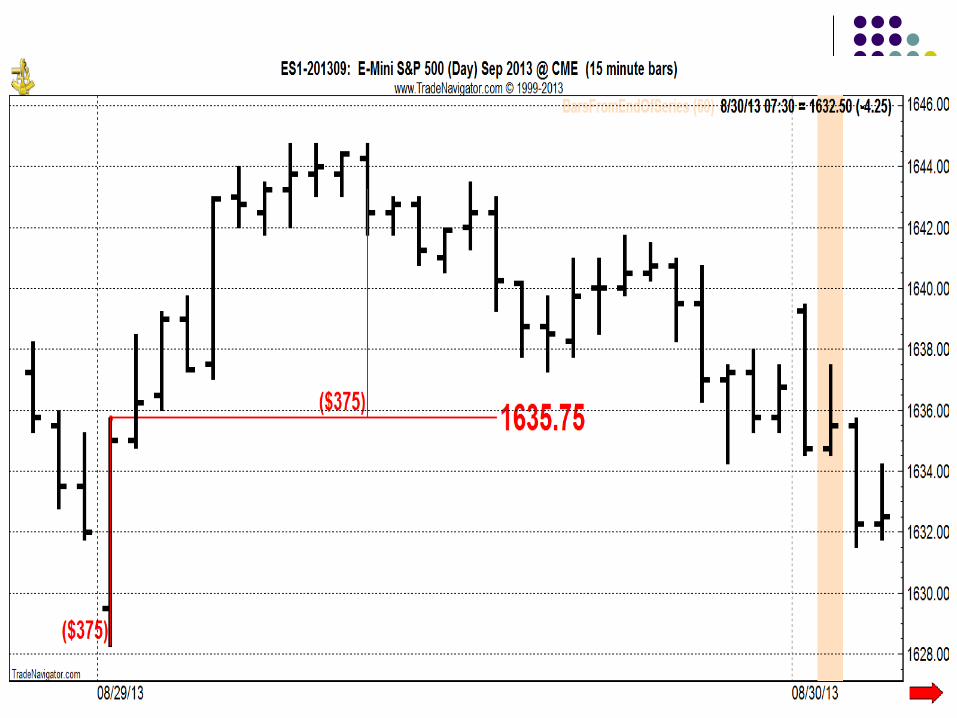
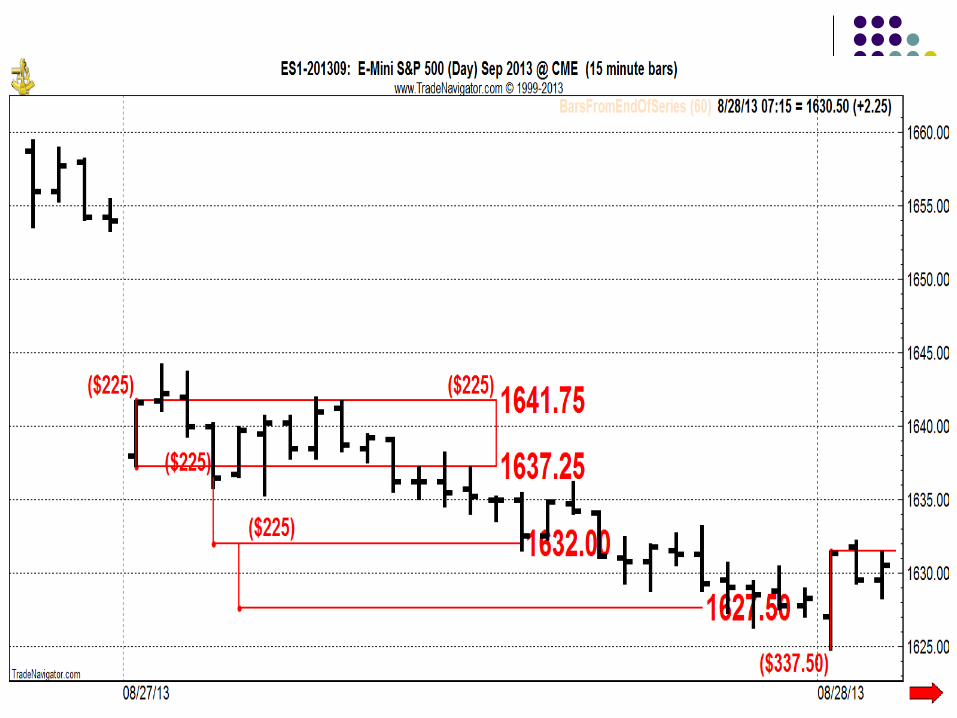
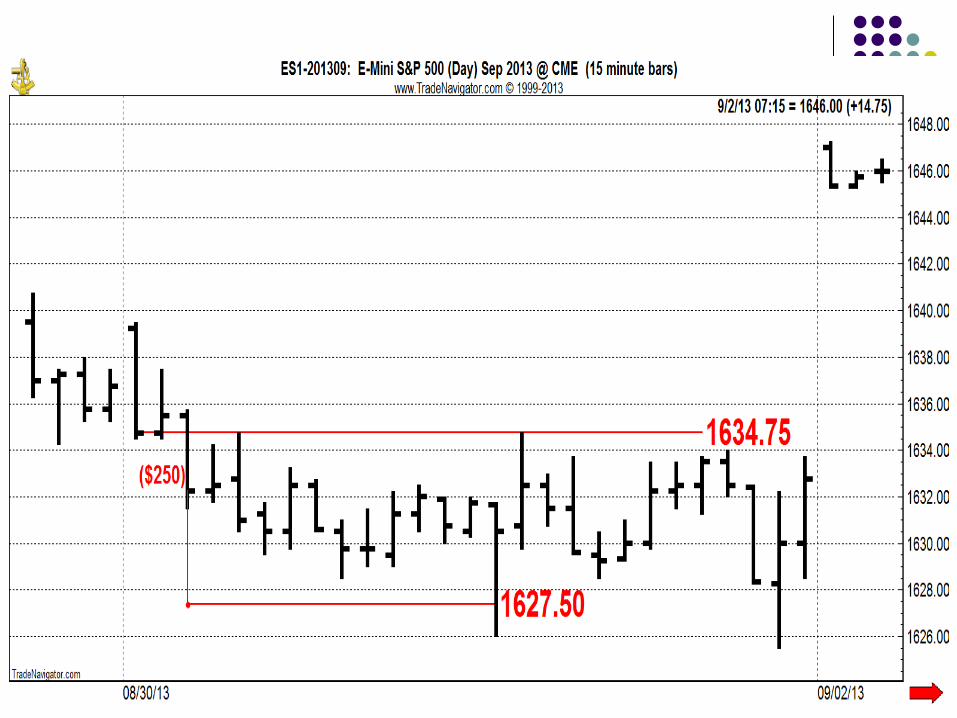
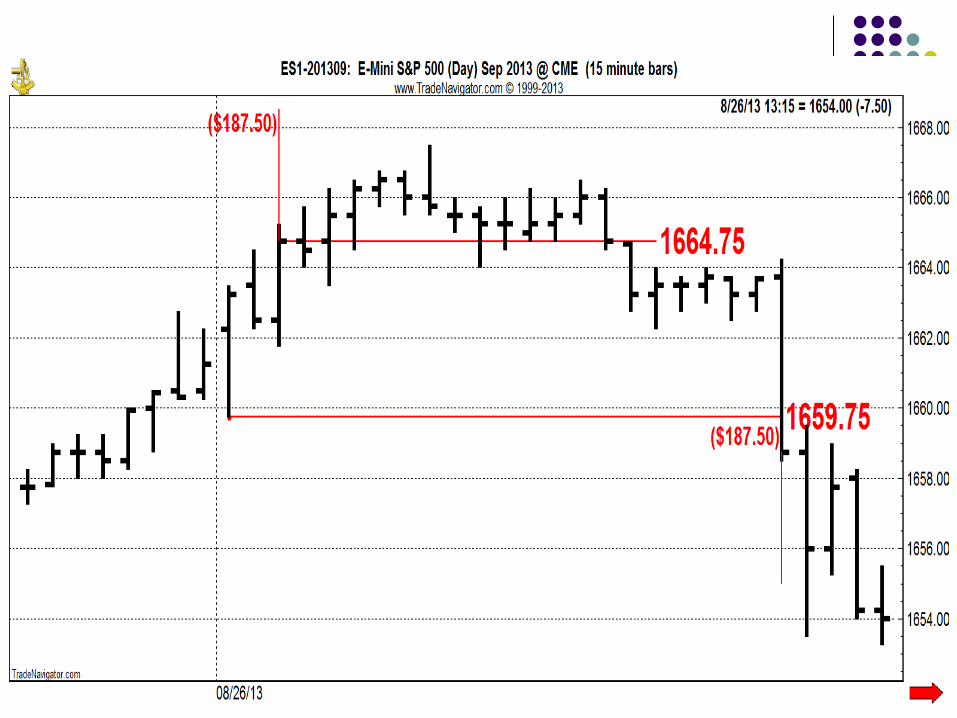
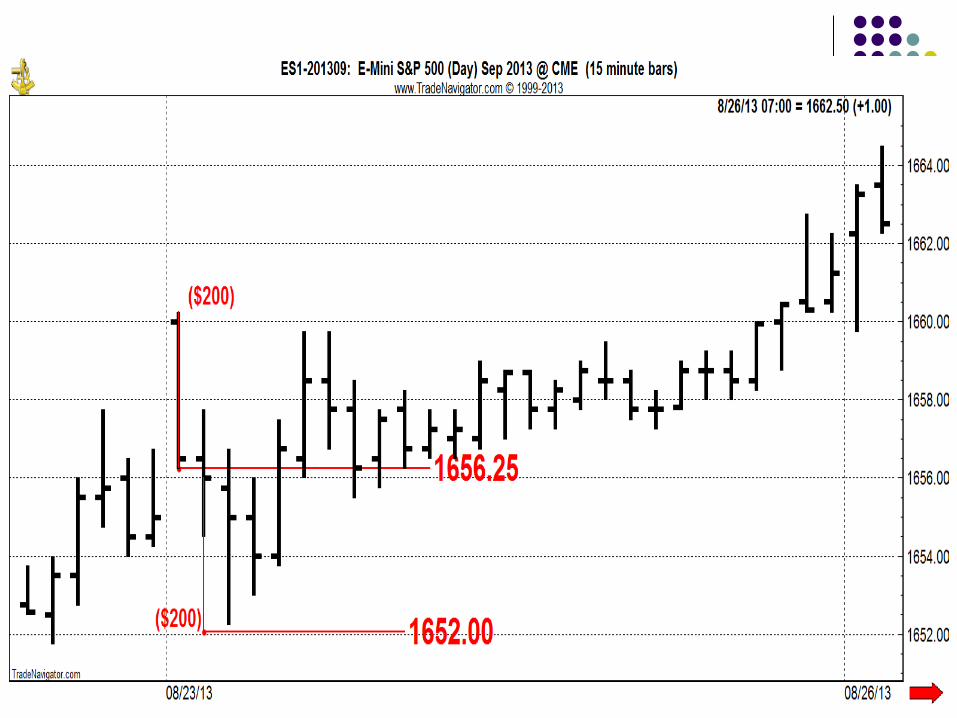
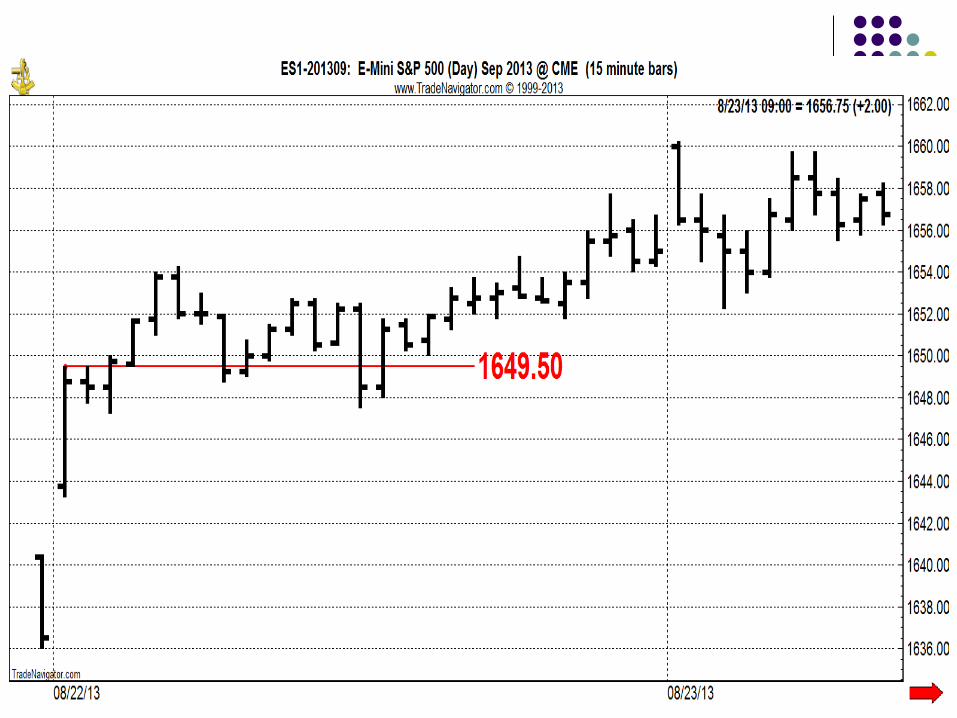
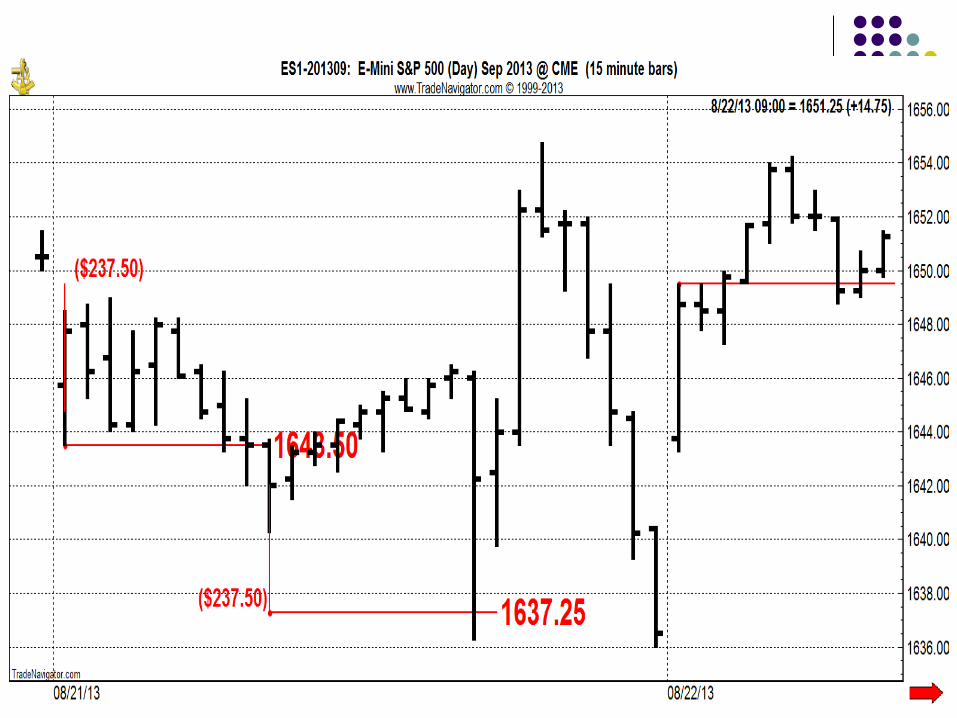
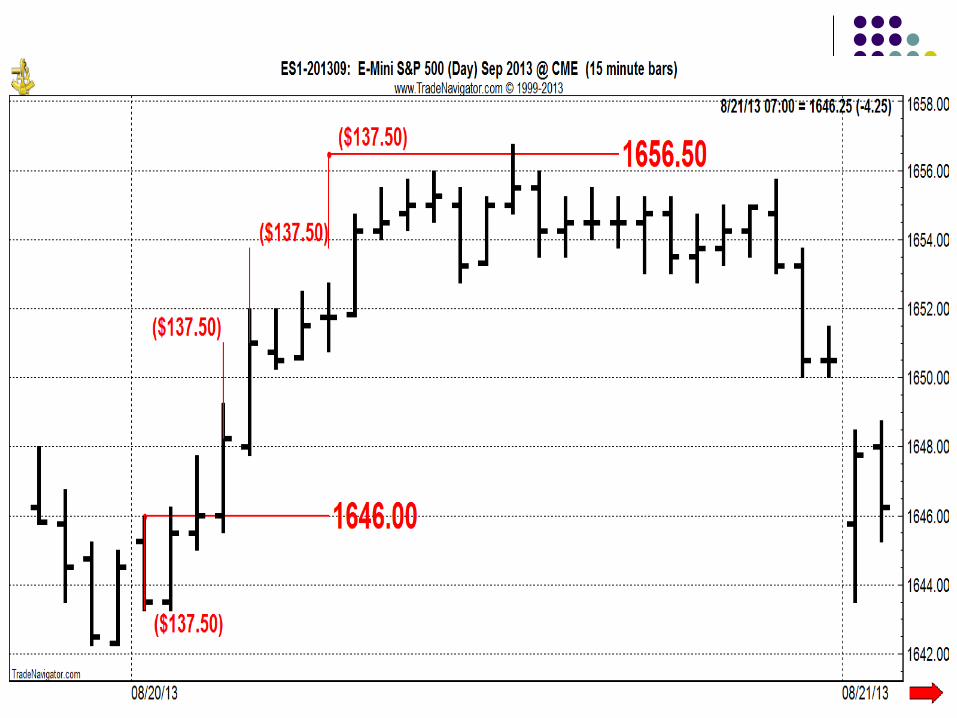
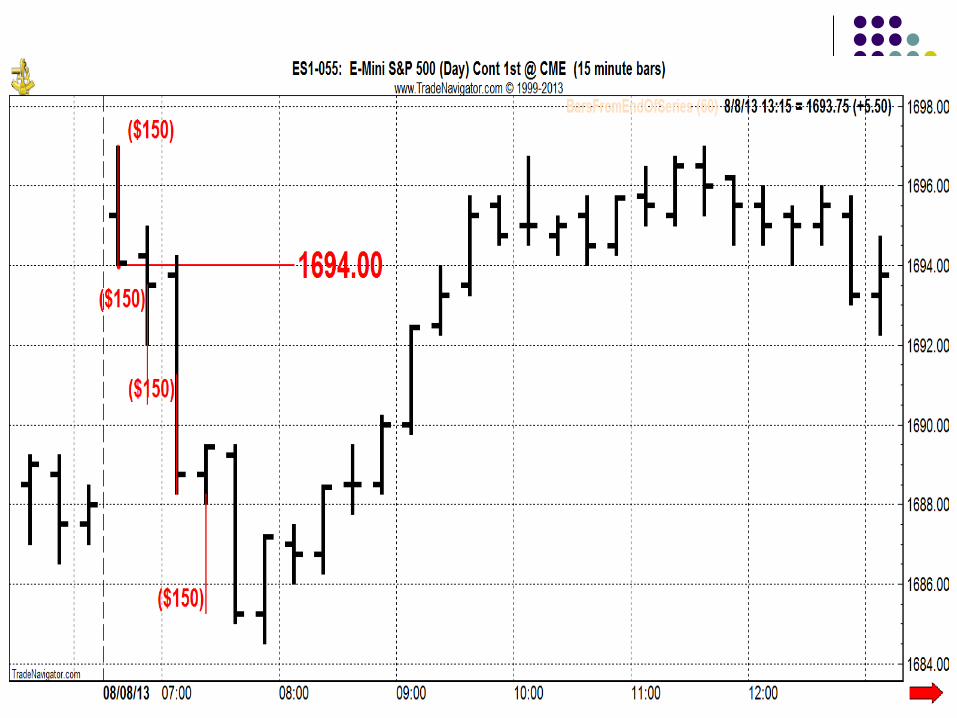
15 MBO (was 30 MBO)
First 15 min day session ES (sp mini)
Establish range reference points
15 min CLOSE > high of bar1 BUY @ mkt
15 min CLOSE < low of bar1 SELL @ mkt
STOP loss is reverse of trade
PT1 = range of bar 1
PT2 PT3 etc
EXIT end of day
3 hrs max wait state (examples)
I was wrong – it was
only 58 days
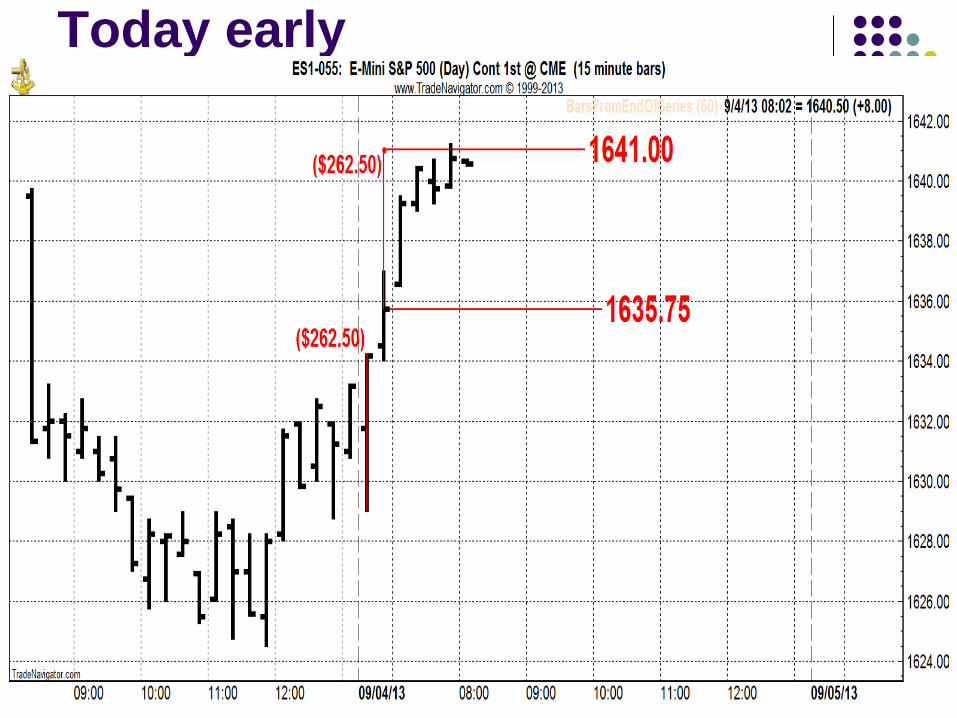
Today early
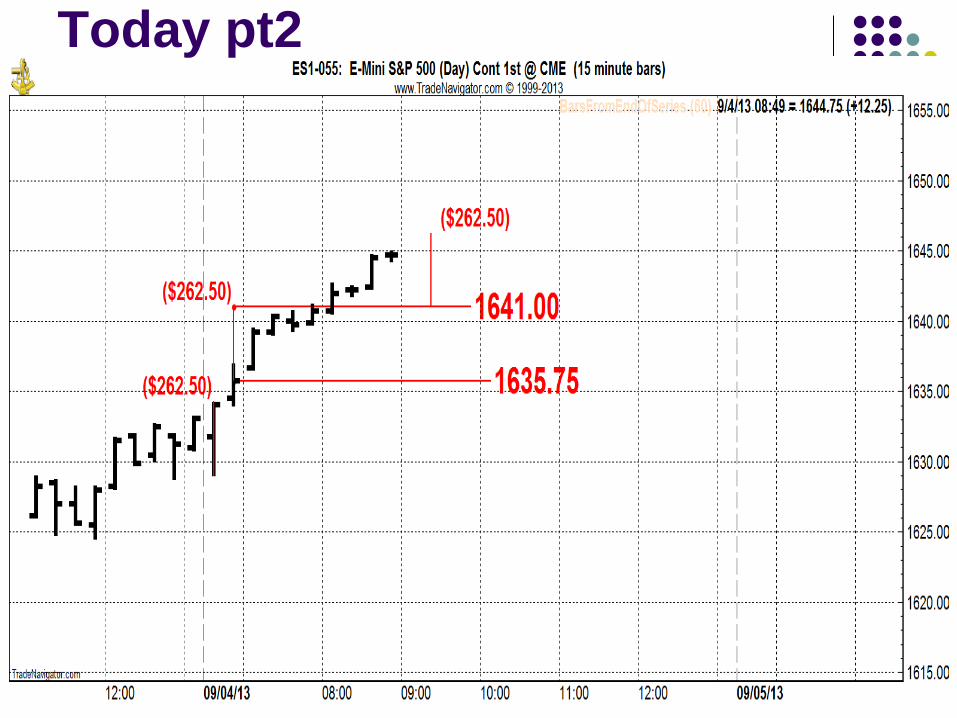
Today pt2
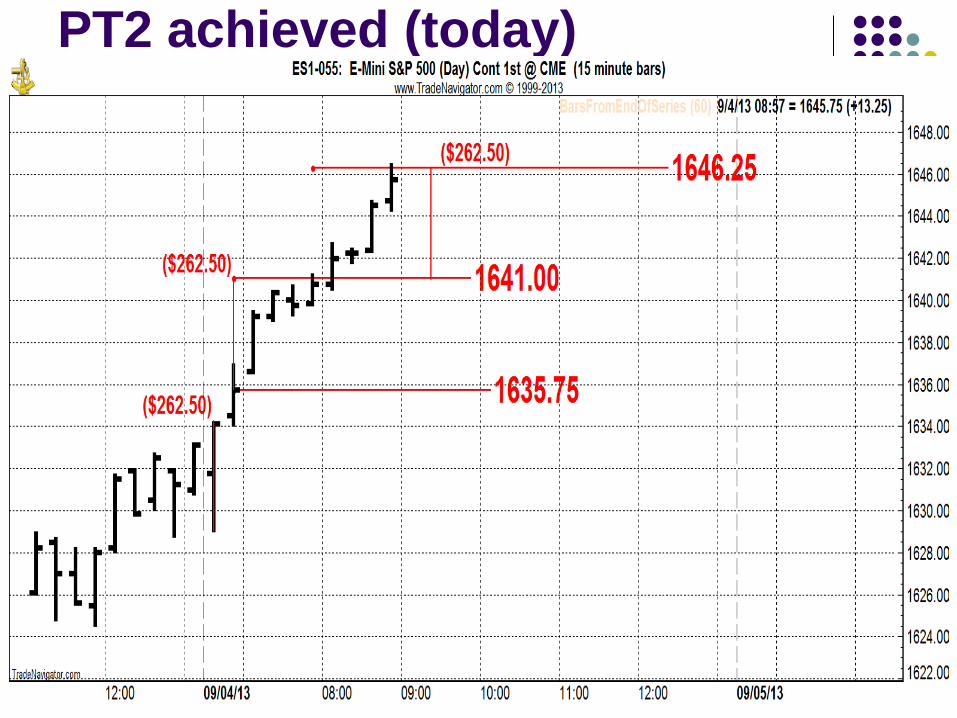
PT2 achieved (today)
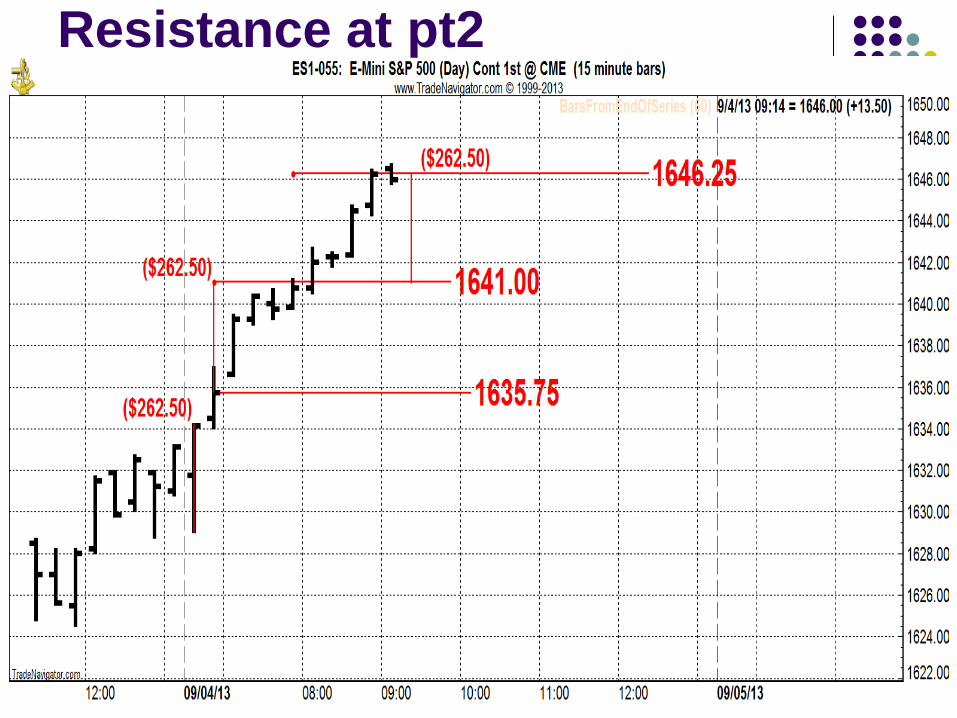
Resistance at pt2
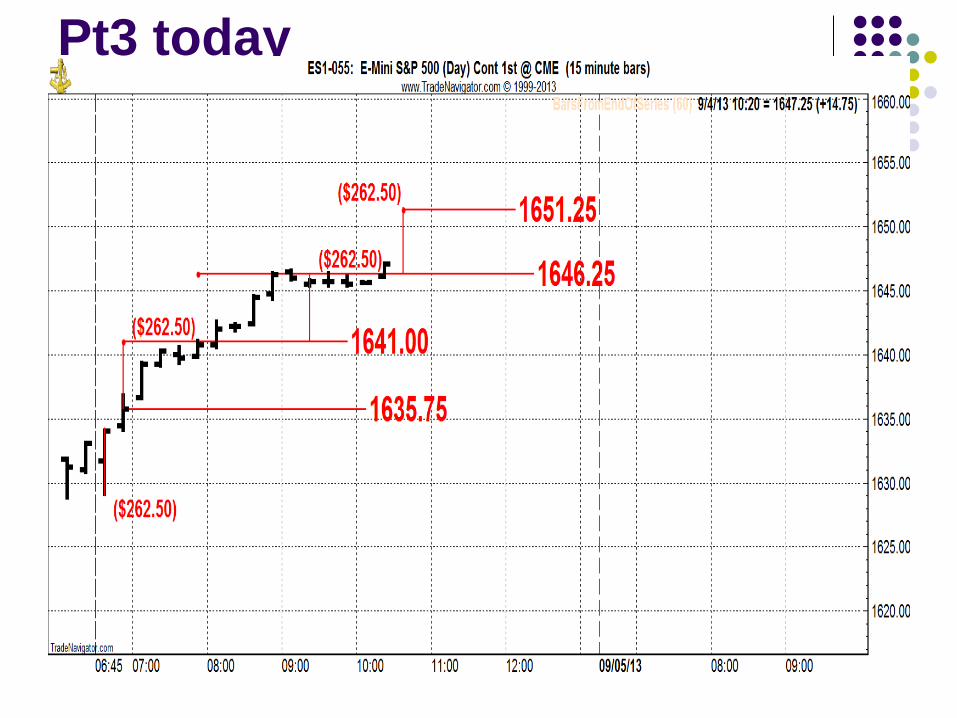
Pt3 today
Indexing: what is it?
Why Index?
Remove spurious moves
Smooth data
Remove random moves
Example
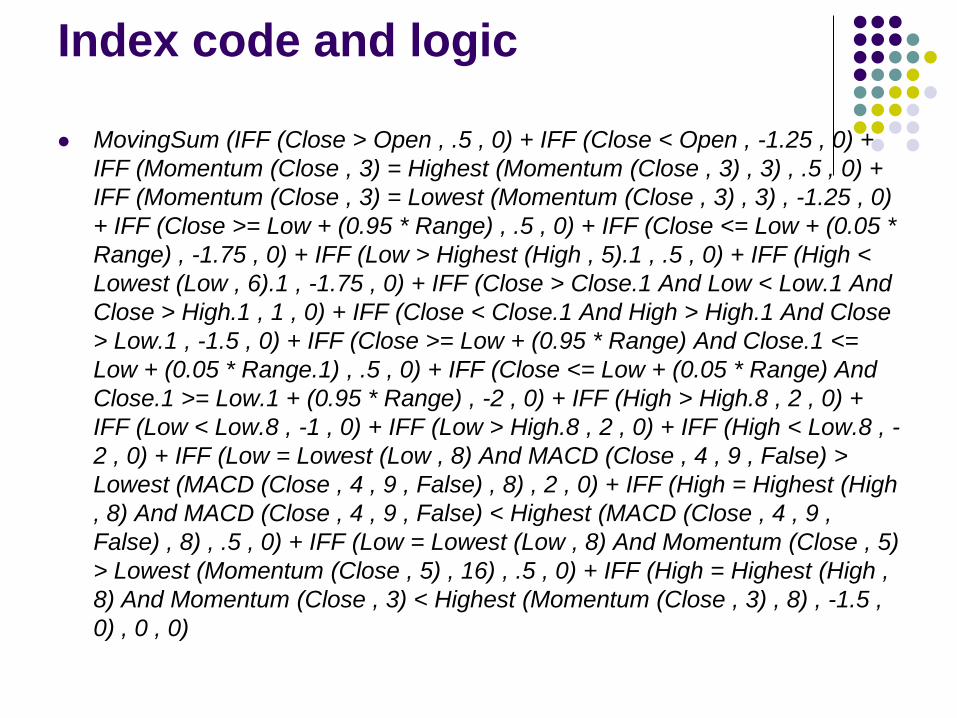
Index code and logic
MovingSum (IFF (Close > Open , .5 , 0) + IFF (Close < Open , -1.25 , 0) +
IFF (Momentum (Close , 3) = Highest (Momentum (Close , 3) , 3) , .5 , 0) +
IFF (Momentum (Close , 3) = Lowest (Momentum (Close , 3) , 3) , -1.25 , 0)
+ IFF (Close >= Low + (0.95 * Range) , .5 , 0) + IFF (Close <= Low + (0.05 *
Range) , -1.75 , 0) + IFF (Low > Highest (High , 5).1 , .5 , 0) + IFF (High <
Lowest (Low , 6).1 , -1.75 , 0) + IFF (Close > Close.1 And Low < Low.1 And
Close > High.1 , 1 , 0) + IFF (Close < Close.1 And High > High.1 And Close
> Low.1 , -1.5 , 0) + IFF (Close >= Low + (0.95 * Range) And Close.1 <=
Low + (0.05 * Range.1) , .5 , 0) + IFF (Close <= Low + (0.05 * Range) And
Close.1 >= Low.1 + (0.95 * Range) , -2 , 0) + IFF (High > High.8 , 2 , 0) +
IFF (Low < Low.8 , -1 , 0) + IFF (Low > High.8 , 2 , 0) + IFF (High < Low.8 , -
2 , 0) + IFF (Low = Lowest (Low , 8) And MACD (Close , 4 , 9 , False) >
Lowest (MACD (Close , 4 , 9 , False) , 8) , 2 , 0) + IFF (High = Highest (High
, 8) And MACD (Close , 4 , 9 , False) < Highest (MACD (Close , 4 , 9 ,
False) , 8) , .5 , 0) + IFF (Low = Lowest (Low , 8) And Momentum (Close , 5)
> Lowest (Momentum (Close , 5) , 16) , .5 , 0) + IFF (High = Highest (High ,
8) And Momentum (Close , 3) < Highest (Momentum (Close , 3) , 8) , -1.5 ,
0) , 0 , 0)
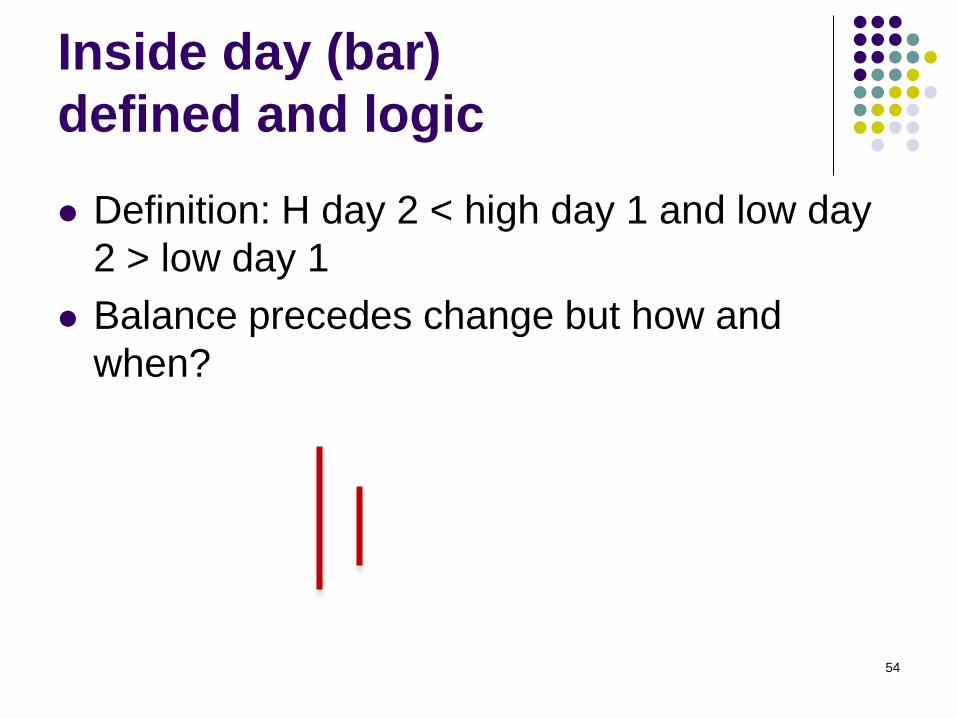
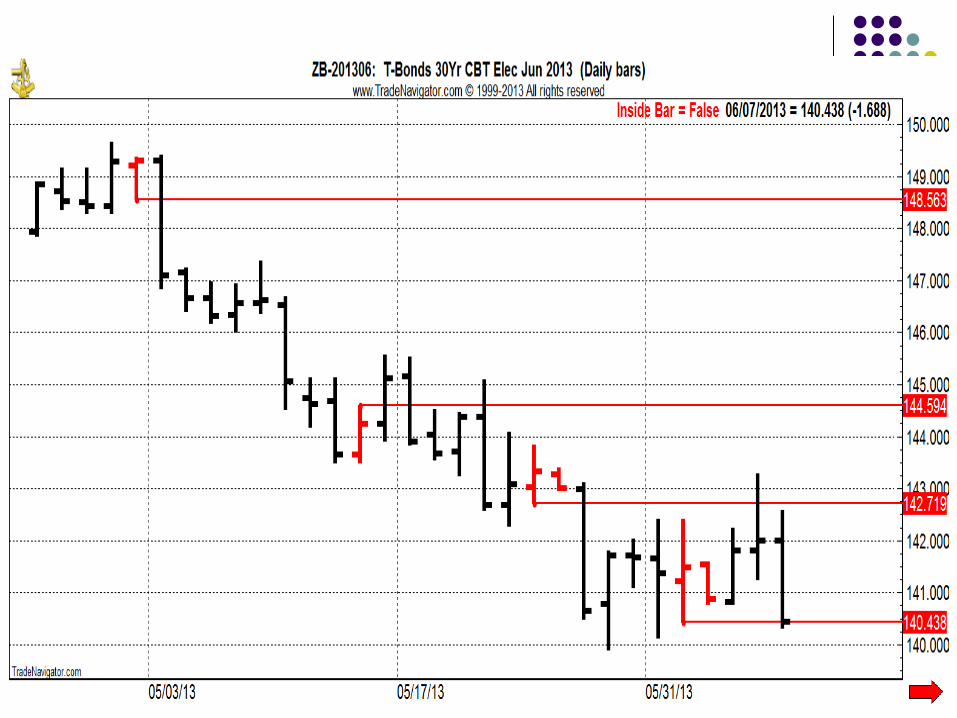
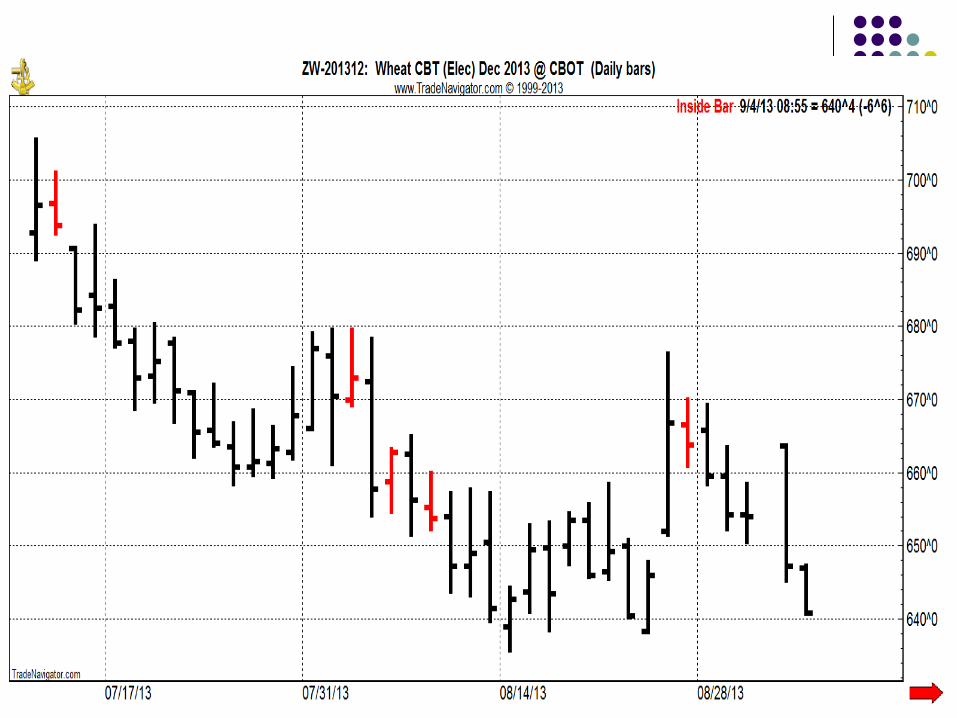
Inside day (bar)
defined and logic
Definition: H day 2 < high day 1 and low day
2 > low day 1
Balance precedes change but how and
when?
54
55
56
57
58
59
60
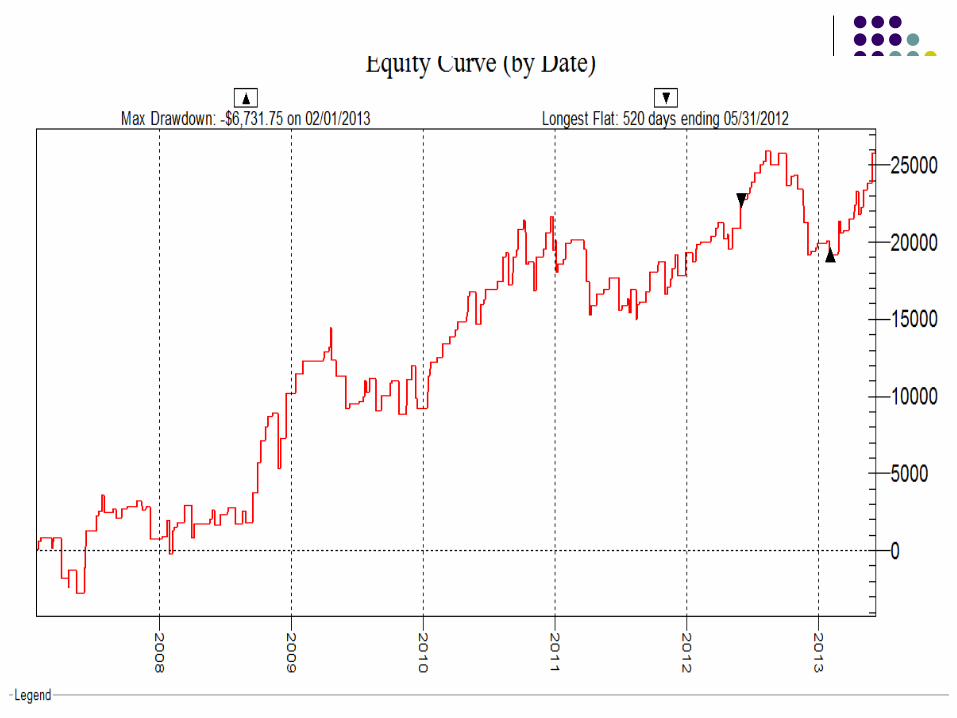
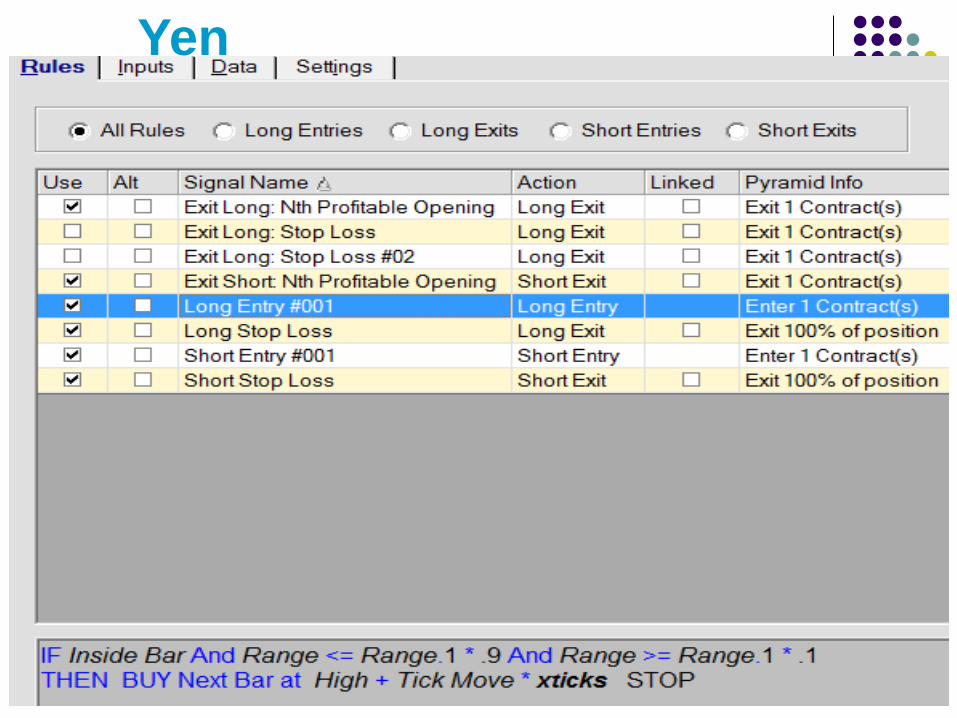
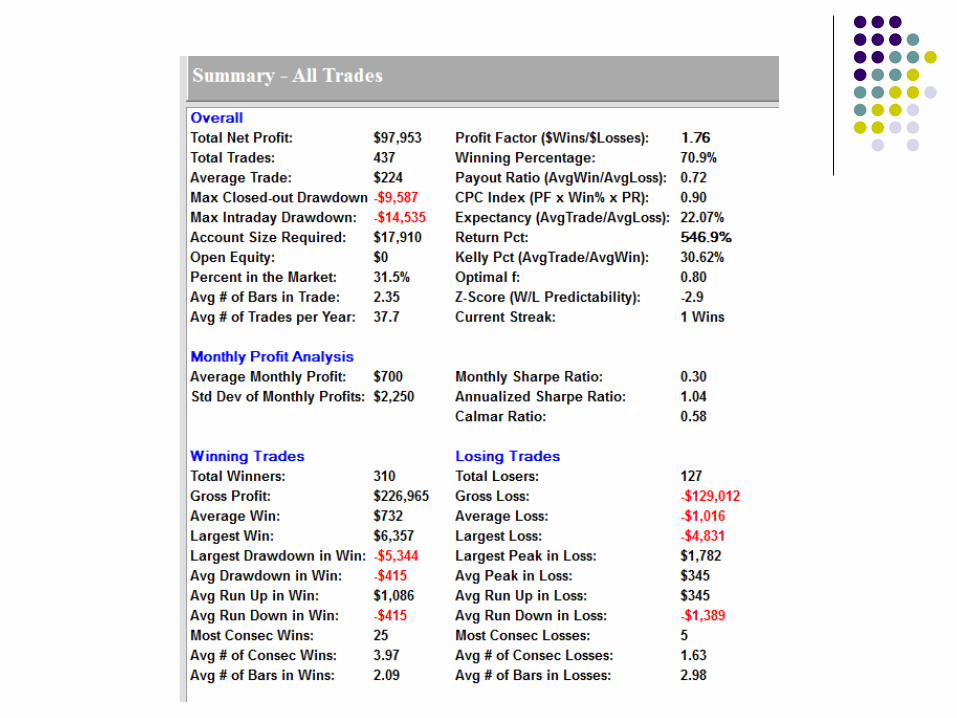
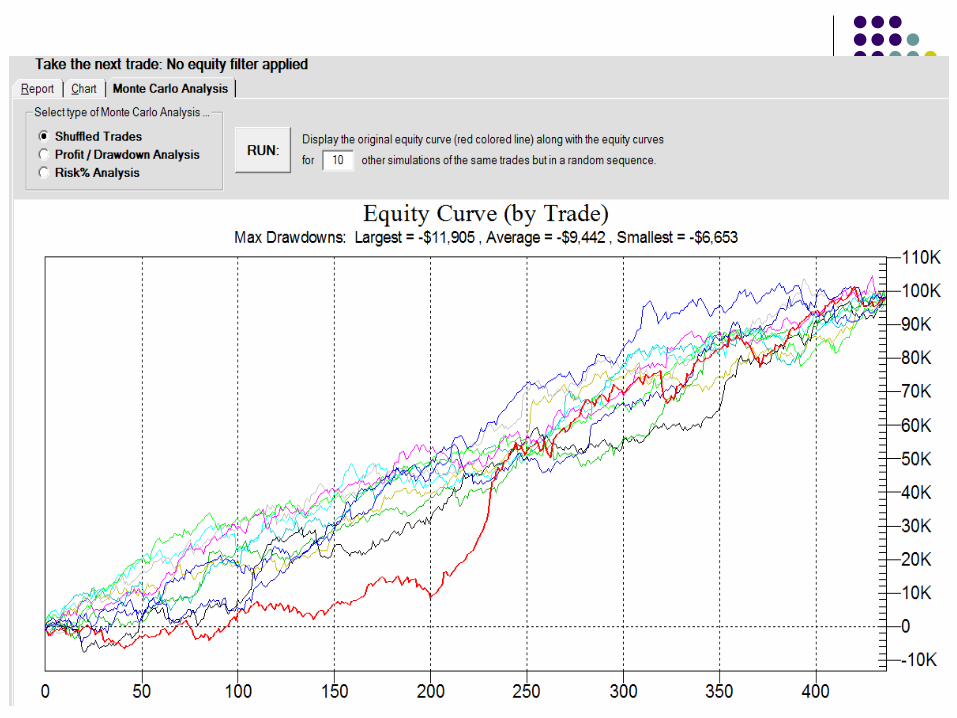
Yen
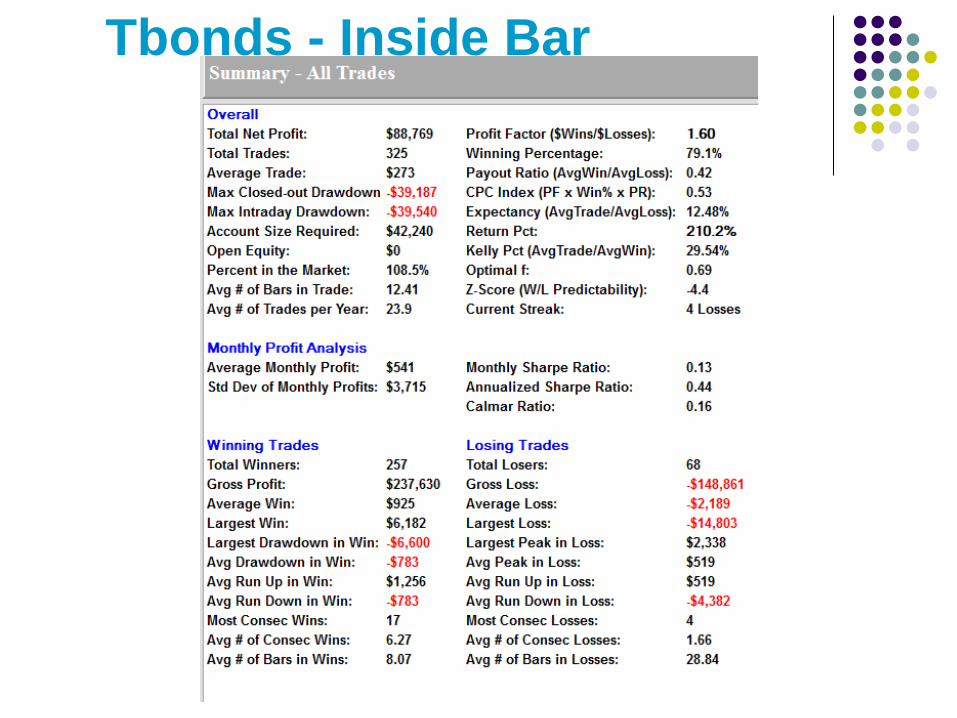
Tbonds - Inside Bar
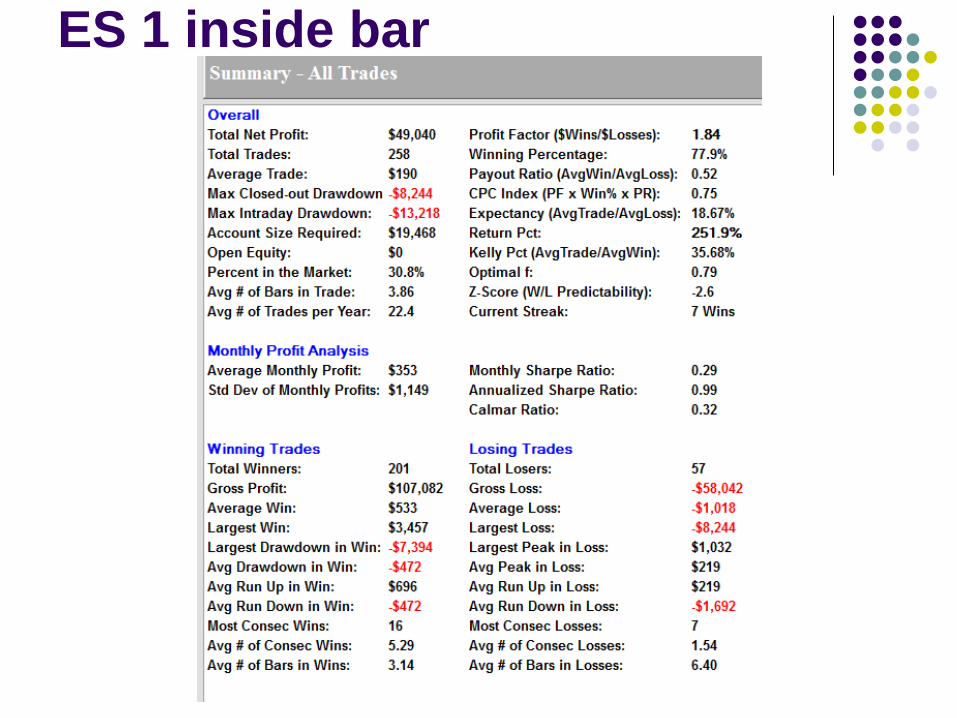
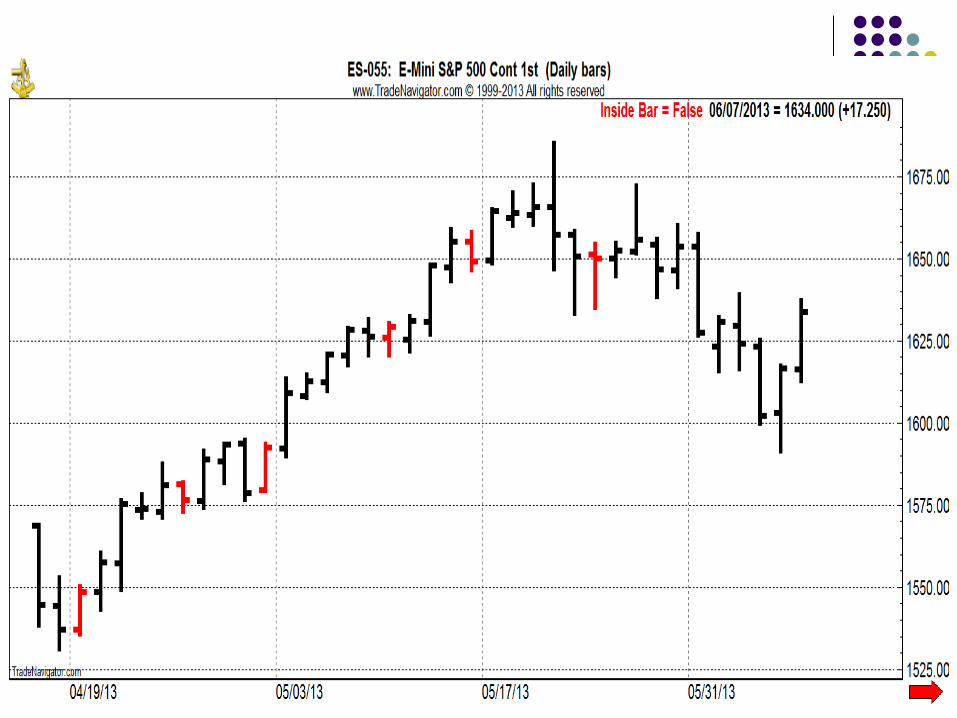
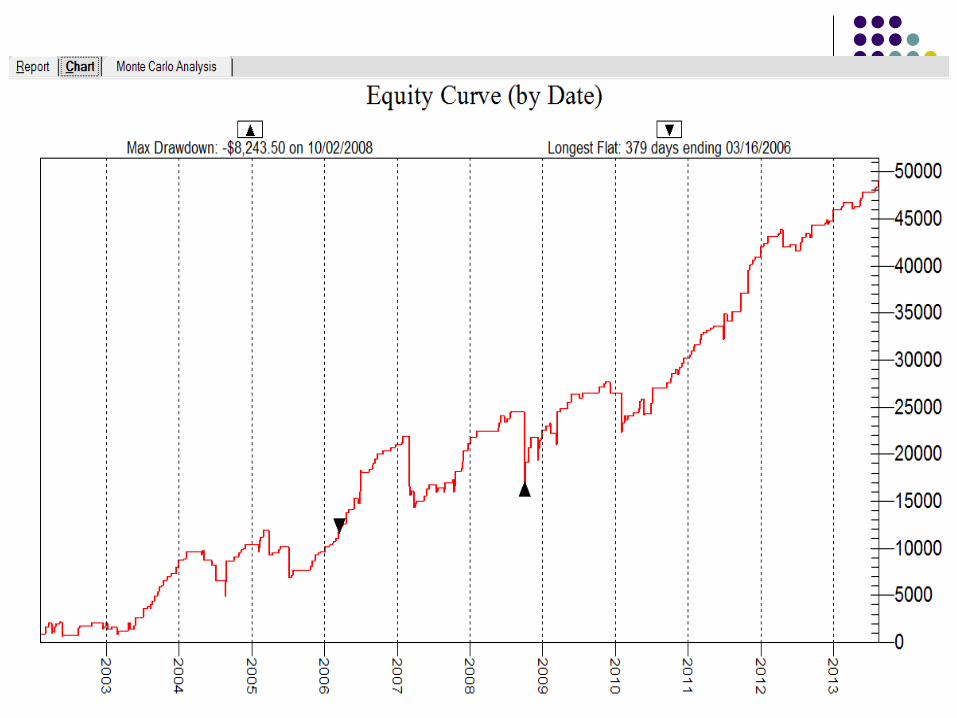
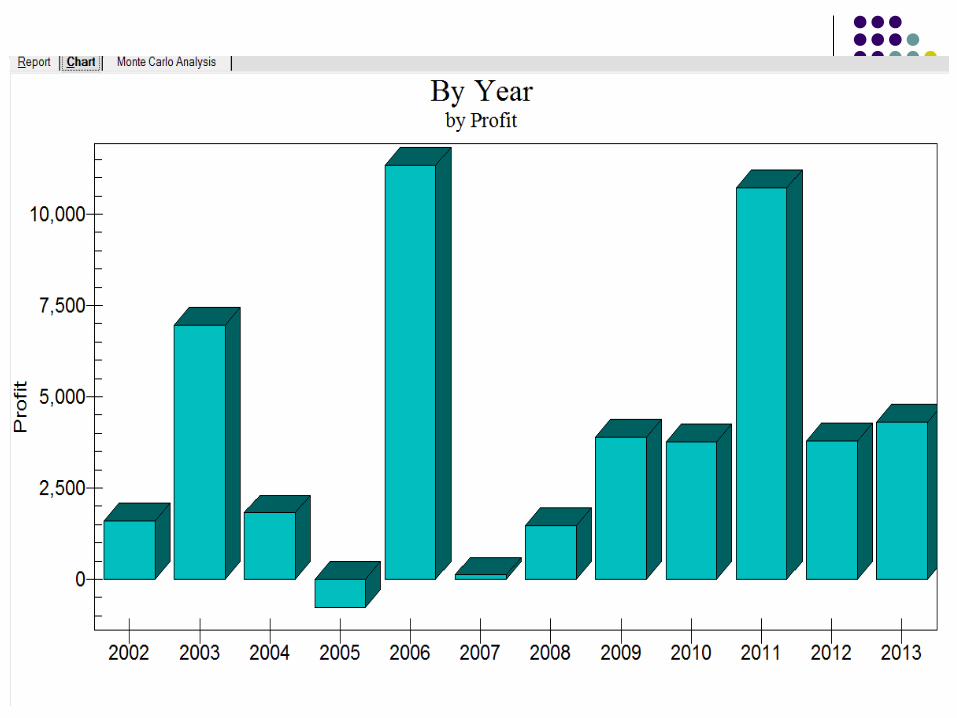
ES 1 inside bar
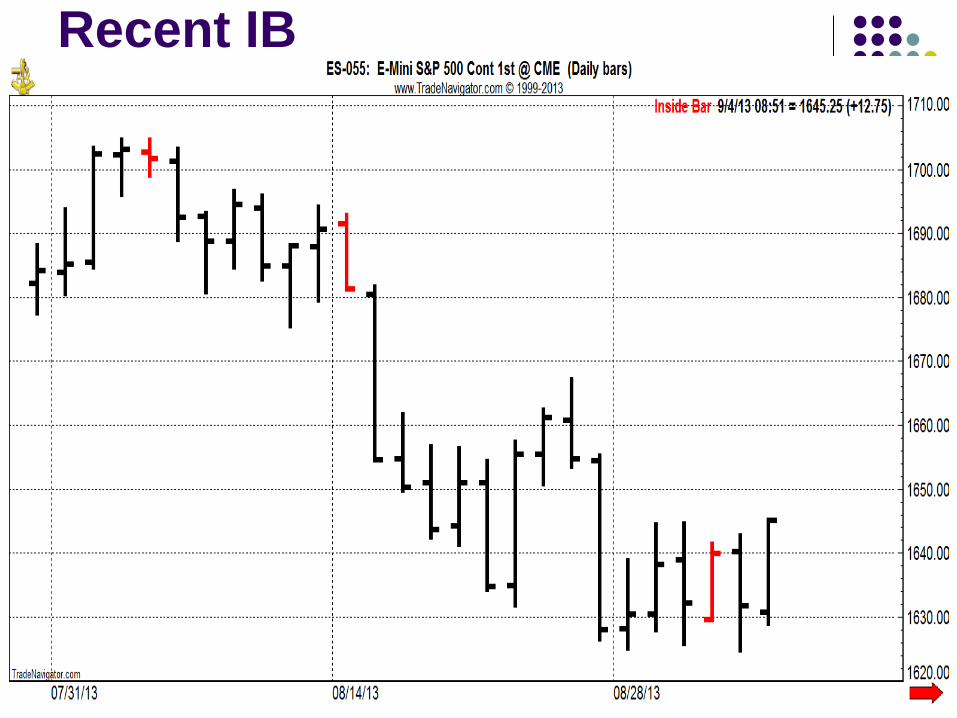
Recent IB
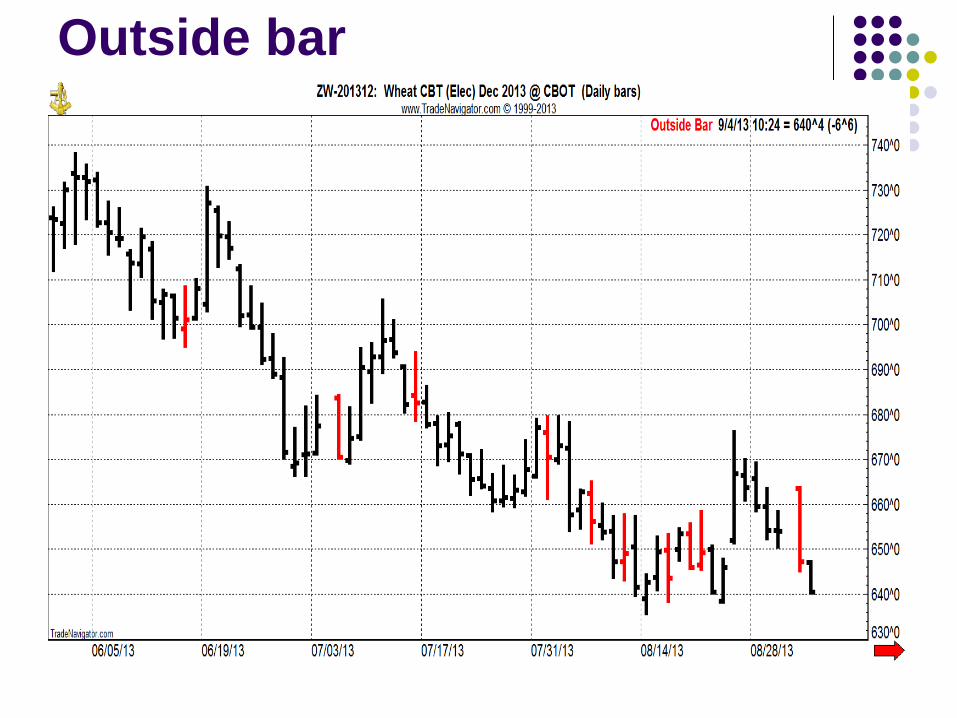
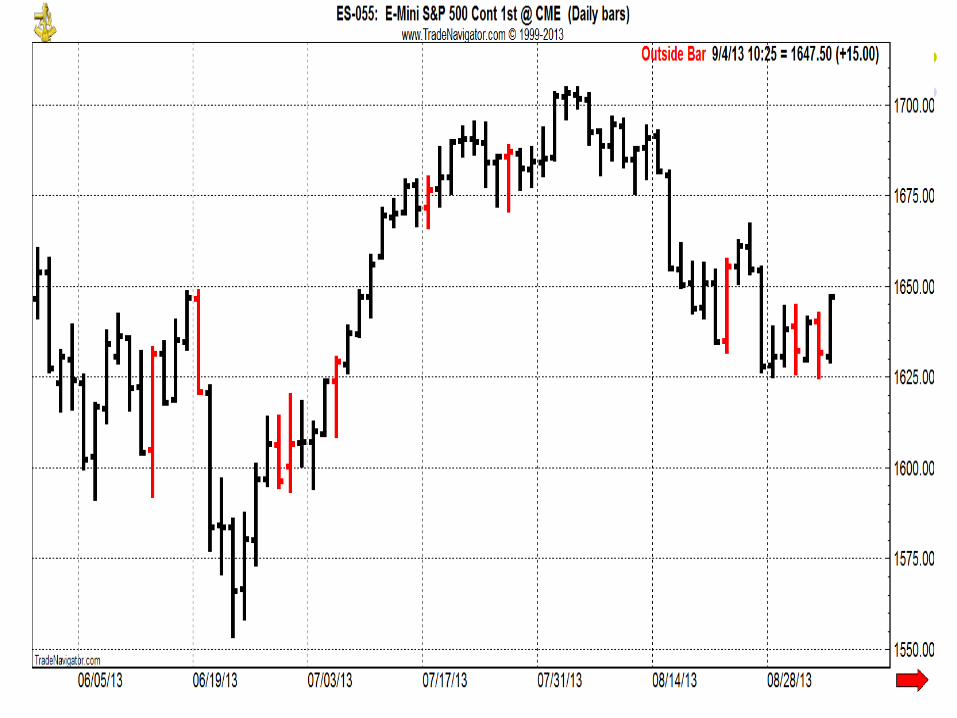
Outside bar
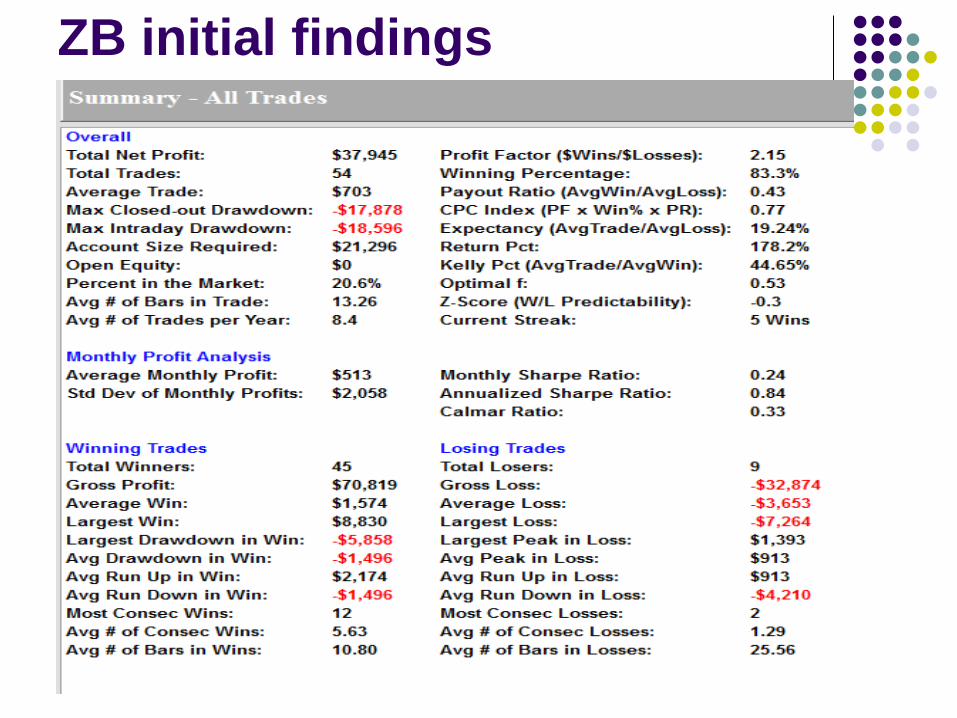
ZB initial findings
Mentoring appointment interview http://www.comtrade1.com/letter/
I can be reached at 800-678-5253 or 831-430-0600
Email me if you have questions:
Best of trading
Jake Bernstein
© 2013 by Jake Bernstein
www.trade-futures.com 800-678-5253 * 831-430-0600