Embed Size (px)
DESCRIPTION
New Century High School Initiative Progress Report July 2007. More New Century High School students face economic, social, and academic challenges than their citywide counterparts. NCHS serve a higher percentage of students below grade level than high schools citywide. - PowerPoint PPT Presentation
Citation preview

New Century High School Initiative Progress Report
July 2007

More New Century High School students face economic, social, and academic challenges than their citywide counterparts.
Citywide Free Lunch: 51%
NCHS Free Lunch: 69%
Citywide % Black or Hispanic: 67.7%
NCHS % Black or Hispanic: 91%
Initiative-Wide Poverty Status
Initiative-Wide Ethnicity ELA and Math Score Averages*
% Level 1 + 2 Students
NCHS serve a higher percentage of students below grade level than
high schools citywide.
*Based on April 2006 data
Asian, 3%Native American, 0.4%
White, 3% No Data, 3%
Hispanic, 48%
Black, 43%
No Data, 14%
Full Price Lunch, 9%
Reduced Price Lunch,
8%Free Lunch,
69%
Demographic numbers for 30,861 active students
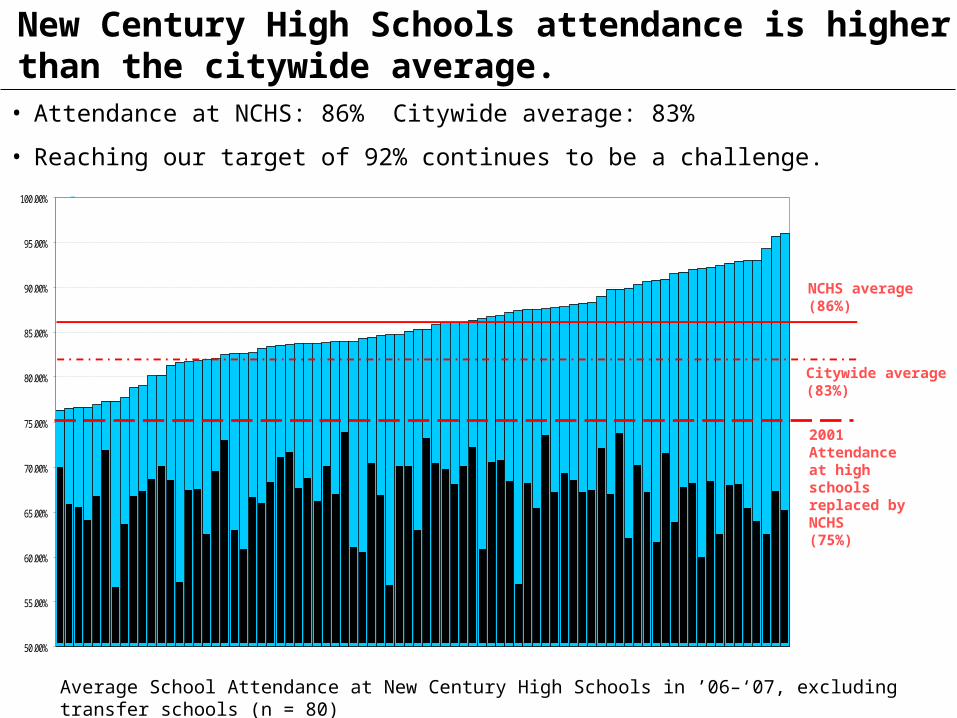
• Attendance at NCHS: 86% Citywide average: 83%
• Reaching our target of 92% continues to be a challenge.
Average School Attendance at New Century High Schools in ’06–‘07, excluding transfer schools (n = 80)
NCHS average (86%)
Citywide average(83%)
2001 Attendanceat high schools replaced by NCHS(75%)
New Century High Schools attendance is higher than the citywide average.
50.00%
55.00%
60.00%
65.00%
70.00%
75.00%
80.00%
85.00%
90.00%
95.00%
100.00%
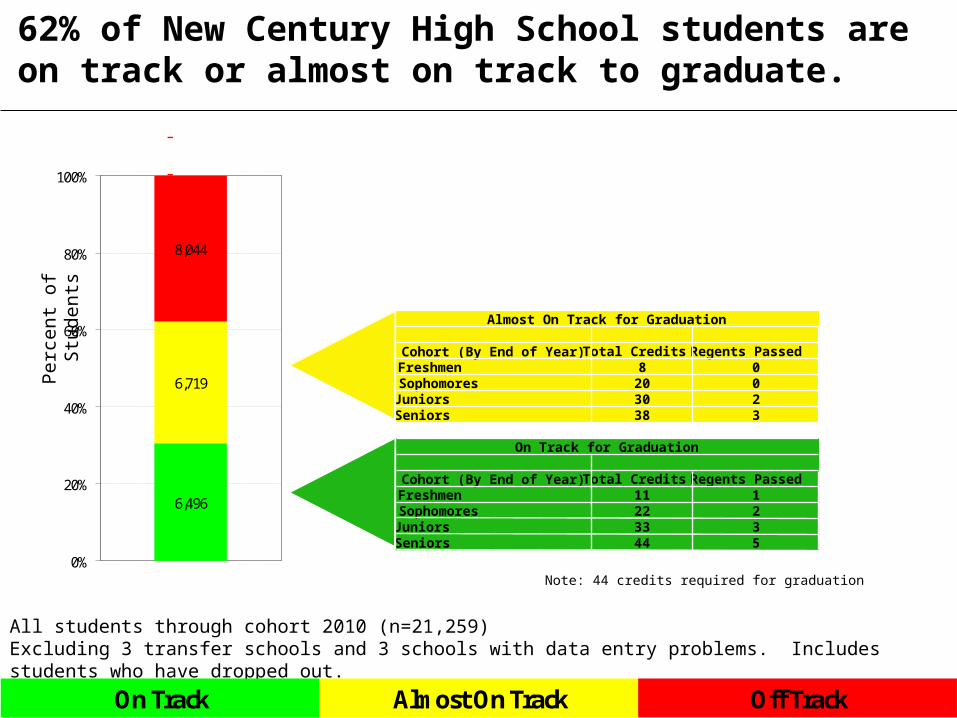
6,496
6,719
8,044
0%
20%
40%
60%
80%
100%
Cohort (By End of Year) Total Credits Regents PassedFreshmen 8 0Sophomores 20 0Juniors 30 2Seniors 38 3
Cohort (By End of Year) Total Credits Regents PassedFreshmen 11 1Sophomores 22 2Juniors 33 3Seniors 44 5
On Track for Graduation
Almost On Track for Graduation
62% of New Century High School students are on track or almost on track to graduate.
Perc
en
t of
Stu
den
ts
Note: 44 credits required for graduation
All students through cohort 2010 (n=21,259) Excluding 3 transfer schools and 3 schools with data entry problems. Includes students who have dropped out.
On Track Almost On Track Off Track

20%32%
47%
70%
45%32%
16%
35% 37% 37%30%
0%
10%
20%
30%
40%
50%
60%
70%
80%
90%
100%
Cohort 20107,452 students
Cohort 20096,857 students
Cohort 20085,924 students
Cohort 20073,047 students
The needs of each cohort require differentiated strategies.
• NVPS will focus on helping students remain on track from the freshman year forward.
Students on Track by CohortExcludes transfer schools (3), schools with data problems (3), and students in a cohort of less than 20 students within their school. Graduation numbers are preliminary; 2007 numbers do not yet include August graduates.
Have Not Yet Graduated
Graduated
On Track Almost On Track Off Track

Progress Toward Graduation, Cohort 2008
Bron
x G
uild
Wes
t Bro
nx A
cade
my
Man
hatt
an T
heat
er L
abU
A H
isto
ry a
nd C
itize
nshi
pU
A M
edia
Stu
dies
Bron
x Pe
rfor
man
ce &
Sta
gecr
aftH
S fo
r T&
PH
igh
Scho
ol fo
r Civ
il Ri
ghts
FDN
YSC
RLG
loba
l Ent
erpr
ise
Scho
ol fo
r Hum
an R
ight
sBr
onx
Law
and
Fin
ance
Mor
ris A
cade
my
Bron
x W
riting
and
Com
mun
icati
on A
rts
Dis
cove
ry H
igh
Scho
olEa
st B
ronx
Aca
dem
yBr
onx
Lead
ersh
ip A
cade
my
Gat
eway
Sch
ool
Acad
emy
of U
rban
Pla
nnin
gBr
onx
Thea
ter
Pabl
o N
erud
a Ac
adem
yBr
onx
Inte
rnati
onal
Bron
x Vi
sual
Art
sRe
nais
sanc
eEa
gle
Acad
emy
Peac
e an
d D
iver
sity
Will
iam
sbur
g Ar
chite
ctur
e an
d D
esig
nU
A D
esig
n an
d Co
nstr
uctio
nBS
SJBE
TABr
onx
Hea
lth C
aree
rsM
illen
nium
Art
Aca
dem
yN
ew E
xplo
rers
New
Yor
k H
arbo
rH
S fo
r You
th a
nd C
omm
unity
Dev
elop
men
tH
S fo
r Glo
bal C
itize
nshi
pH
SCA
Bron
x H
ealth
Sci
ence
sH
S fo
r Hos
pita
lity
Man
agem
ent
Scho
ol fo
r Exc
elle
nce
CSSJ
WAT
CHH
igh
Scho
ol fo
r Ser
vice
and
Lea
rnin
gIA
BSPe
lham
Pre
pCI
MS
Scho
ol fo
r Dem
ocra
cyFo
od a
nd F
inan
ceCe
lia C
ruz
Mott
Hav
en V
illag
e Pr
epW
illia
msb
urg
Prep
Hig
h Sc
hool
for P
ublic
Ser
vice
BASE
Man
hatt
an B
ridge
sBr
onx
Acad
emy
of L
etter
sAs
tor C
olle
giat
e Ac
adem
yPA
THS
BSM
TH
S of
Com
pute
rs a
nd T
echn
olog
yM
arbl
e H
ill S
choo
lU
A La
w a
nd Ju
stice
All C
ity L
eade
rshi
pBr
onx
Aero
spac
e Ac
adem
yM
arie
Cur
ieAc
adem
y fo
r Car
eers
in S
port
sM
illen
nium
0.0%
10.0%
20.0%
30.0%
40.0%
50.0%
60.0%
70.0%
80.0%
90.0%
100.0%
The percentage of our 2008 students on + almost on track is higher than the citywide graduation rate at 84% of our schools.
69 schools have a graduating class of Cohort 2008 students (2 excluded for data problems)Bars represent on track + almost on track students combined
Cohort size includes discharged students; these students are considered as off track
NCHS goal (80%)
Citywide Rate (50%)
Off Track (11) Almost On Track (49) On Track (7)

The percentage of our 2009 students on + almost on track is higher than the citywide graduation rate at 84% of our schools.
70 schools have a graduating class of Cohort 2009 students (2 excluded for data problems)Bars represent on track + almost on track students combined
Cohort size includes discharged students; these students are considered as off track
NCHS goal (80%)
Citywide Rate (50%)
Progress Toward Graduation, Cohort 2009
Bron
x Gu
ildW
est B
ronx
Aca
dem
yLe
ader
ship
Insti
tute
SCRL
Peac
e an
d Di
vers
ityAc
adem
y of
Urb
an P
lann
ing
Pabl
o N
erud
a Ac
adem
yBr
onx
Writi
ng a
nd C
omm
unica
tion
Arts
UA
Med
ia S
tudi
esW
illiam
sbur
g Ar
chite
ctur
e an
d De
sign
Gate
way
Sch
ool
CSSJ
HS fo
r T&
PBr
onx
Lead
ersh
ip A
cade
my
Man
hatt
an T
heat
er La
bBr
onx
Perf
orm
ance
& S
tage
craft
CIM
SFa
cing
Hist
ory
Scho
olW
ATCH
HS fo
r You
th a
nd C
omm
unity
Dev
elop
men
tEa
gle
Acad
emy
Scho
ol fo
r Exc
elle
nce
Scho
ol fo
r Hum
an R
ight
sHS
AII
Disc
over
y Hi
gh S
choo
lHi
gh S
choo
l for
Civ
il Rig
hts
HS fo
r Glo
bal C
itize
nshi
pBr
onx
Heal
th C
aree
rsEa
st B
ronx
Aca
dem
yRe
naiss
ance
UA
Hist
ory
and
Citiz
ensh
ipBS
SJIA
BSM
orris
Aca
dem
yU
A De
sign
and
Cons
truc
tion
Pelh
am P
rep
High
Sch
ool f
or S
ervi
ce a
nd Le
arni
ngHS
for H
ospi
talit
y M
anag
emen
tN
ew Y
ork
Harb
or S
choo
lFD
NY
HSCA
Man
hatt
an B
ridge
sM
ott H
aven
Villa
ge P
rep
Scho
ol fo
r Dem
ocra
cyBr
onx
Heal
th S
cienc
esAs
tor C
olle
giat
e Ac
adem
yBr
onx
Thea
ter
Glob
al E
nter
prise
Bron
x In
tern
ation
alBr
onx
Law
and
Fin
ance
BETA
Willi
amsb
urg
Prep
BASE
Bron
x Vi
sual
Art
sN
ew E
xplo
rers
PATH
SM
illenn
ium
Art
Aca
dem
yAl
l City
Lead
ersh
ipCe
lia C
ruz
Bron
x Ae
rosp
ace
Acad
emy
Bron
x Ac
adem
y of
Lett
ers
BSM
TM
arbl
e Hi
ll Sch
ool
HS o
f Com
pute
rs a
nd T
echn
olog
yFo
od a
nd F
inan
ceM
arie
Cur
ieU
A La
w a
nd Ju
stice
High
Sch
ool f
or P
ublic
Ser
vice
Acad
emy
for C
aree
rs in
Spo
rts
Mille
nniu
m
0.0%
10.0%
20.0%
30.0%
40.0%
50.0%
60.0%
70.0%
80.0%
90.0%
100.0%
Off Track (11) Almost On Track (51) On Track (8)

852
176
1,143
2,802
951
2,171
0%
10%
20%
30%
40%
50%
60%
70%
80%
90%
100%
To reach our goal of 80%, all of our almost on track students and 986 out of 2,171 off-track and discharged students will need to graduate.
Why are these students off-track?
Perc
en
t of
Coh
ort
2008
Stu
den
ts
n=5,924 Transfer schools and two schools with data problems excluded
This will require intensive analysis of Regents and credit accumulation.
On Track Almost On Track Off Track Behind in Credits and Regents Behind in Regents Only Behind in Credits Only
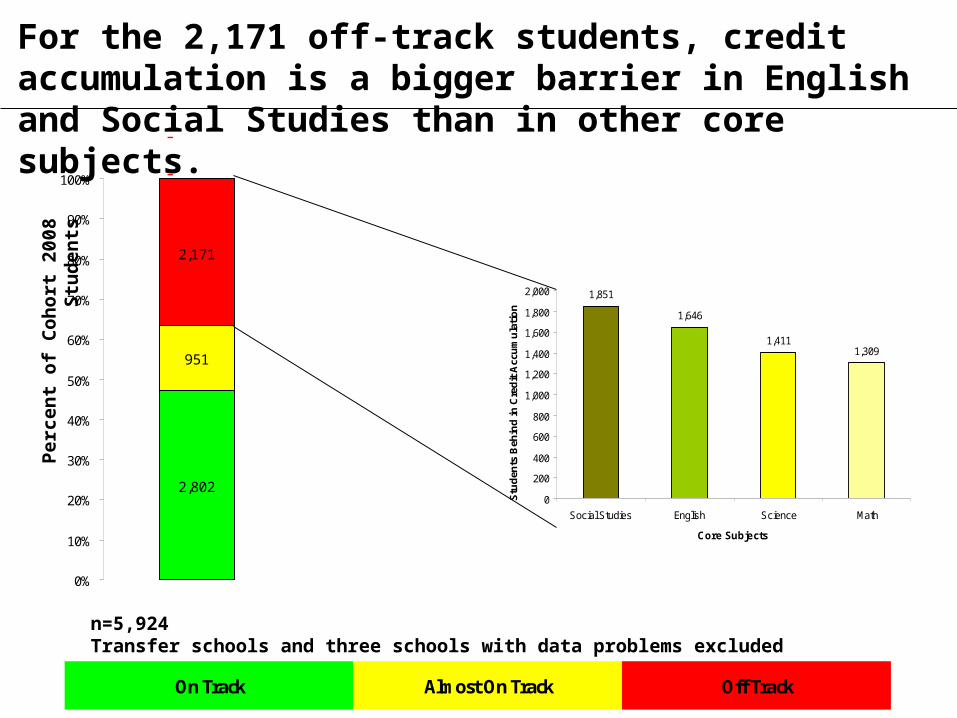
1,851
1,646
1,4111,309
0
200
400
600
800
1,000
1,200
1,400
1,600
1,800
2,000
Social Studies English Science Math
Core Subjects
Stu
den
ts B
ehin
d in
Cre
dit
Acc
um
ula
tio
n
2,802
951
2,171
0%
10%
20%
30%
40%
50%
60%
70%
80%
90%
100%
For the 2,171 off-track students, credit accumulation is a bigger barrier in English and Social Studies than in other core subjects.
Perc
en
t of
Coh
ort
2008
Stu
den
ts
n=5,924 Transfer schools and three schools with data problems excluded
On Track Almost On Track Off Track
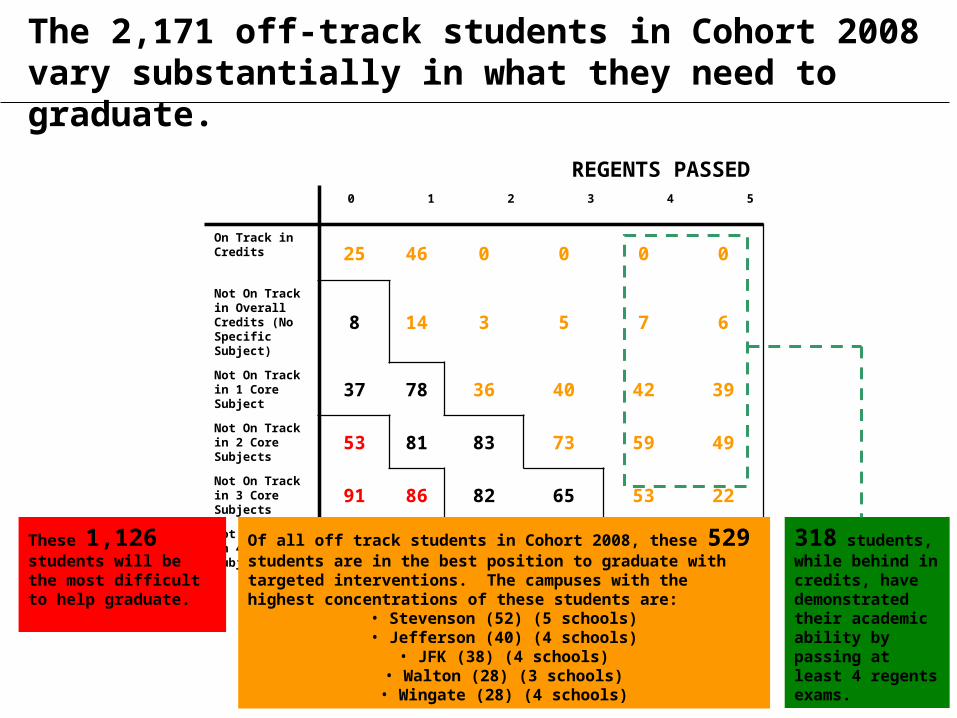
REGENTS PASSED0 1 2 3 4 5
On Track in Credits 25 46 0 0 0 0
Not On Track in Overall Credits (No Specific Subject)
8 14 3 5 7 6
Not On Track in 1 Core Subject 37 78 36 40 42 39
Not On Track in 2 Core Subjects 53 81 83 73 59 49
Not On Track in 3 Core Subjects 91 86 82 65 53 22
Not On Track in 4 Core Subjects 589 211 96 51 31 10
The 2,171 off-track students in Cohort 2008 vary substantially in what they need to graduate.
318 students, while behind in credits, have demonstrated their academic ability by passing at least 4 regents exams.
These 1,126 students will be the most difficult to help graduate.
Of all off track students in Cohort 2008, these 529 students are in the best position to graduate with targeted interventions. The campuses with the highest concentrations of these students are:
• Stevenson (52) (5 schools)• Jefferson (40) (4 schools)
• JFK (38) (4 schools)• Walton (28) (3 schools)
• Wingate (28) (4 schools)

0
500
1000
1500
2000
2500
3000
3500
4000
Students are meeting some but not all Regents requirements.
After three years of high school, over one third of students still need to pass the ELA, Global Studies, and US History Regents each
Num
ber
of
Stu
dents
n= 5,924
Math Science Global ELA US History
Not Taken 0 - 54 55 - 64 65 - 100
Note: ELA and Math scores at 75 or above are hatched in blue to indicate readiness for introductory courses at CUNY
21%18%
61%
28%
16%
55%
37%
17%
45%
36%
12%
52%
42%
13%
45%