Embed Size (px)
Citation preview

New approaches for accounting for confounding factors when analysing collision data to predict collision hotspots and evaluate road safety schemes
Dr. Neil Thorpe and Dr. Lee Fawcett; Paulo Humanes, PTV Group
School of Engineering and School of Mathematics, Statistics and Physics, Newcastle University (UNEW); UK
Presentation to the 6th IRTAD Conference ‘Better Road Safety Data for Better Safety Outcomes’
10th-12th October, 2017 Marrakech, Morocco
Contents1. Confounding factors:◦ What are they?◦ Why should we account for them?◦ How can we account for them?
2. Overview of the methodology developed◦ Data from multiple time-periods◦ Global and site-specific trends◦ Variance-inflation factor◦ Bayesian posterior predictive distribution; model validation
3. Application in available software programs◦ RAPTOR (UNEW)◦ VISUM Safety (PTV)
4. Benefits of the Approach◦ Scheme Evaluation◦ Hotspot prediction
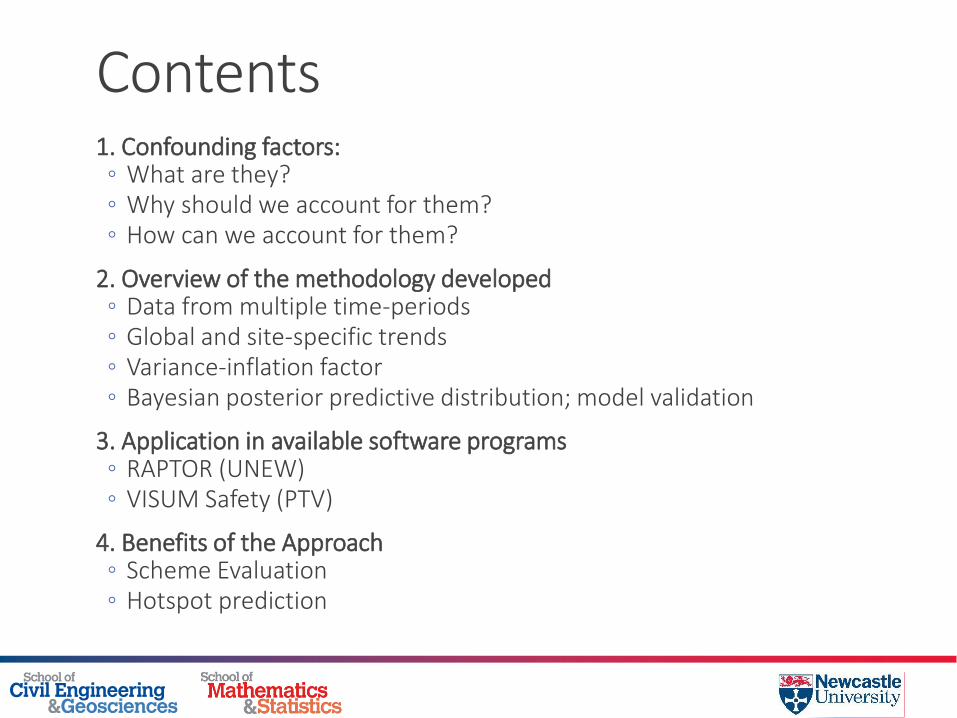
…but prone to confounding factors (e.g. regression-to-mean; trend)
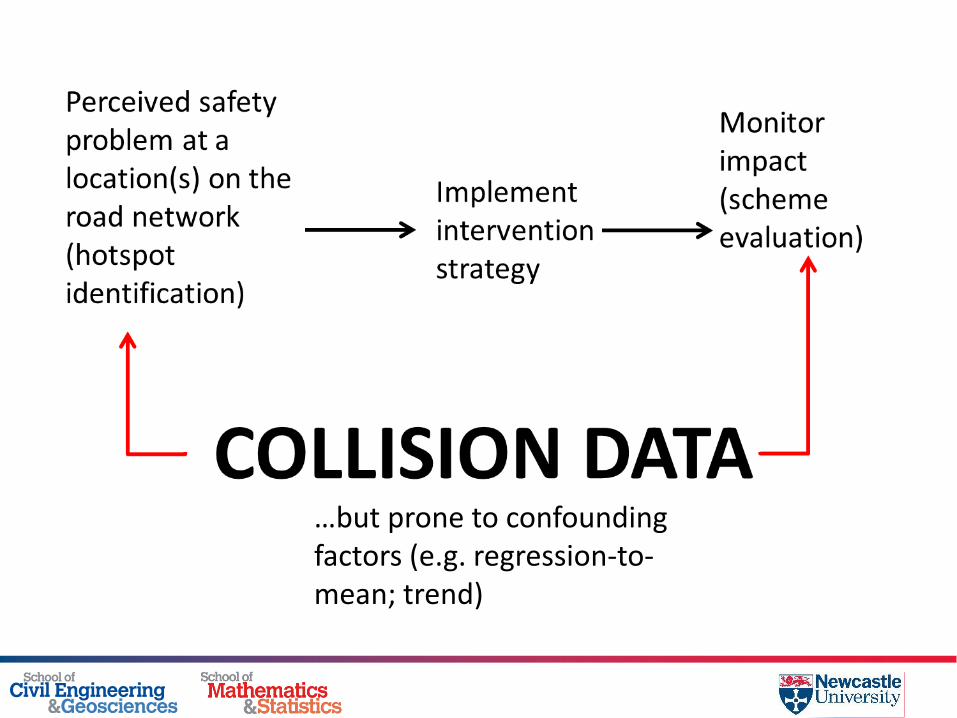
1. Confounding factors“Any factor that may lead to confounding…e.g. to effects that may erroneously be mixed up with the effects of a road safety measure” (Elvik; 2004 p. 1032)
- Regression-to-the mean (the tendency for unusually high or low counts to be followed by values closer to the underlying mean)
- General trends in collisions/casualties (for example due to changes in vehicle safety and driver education)
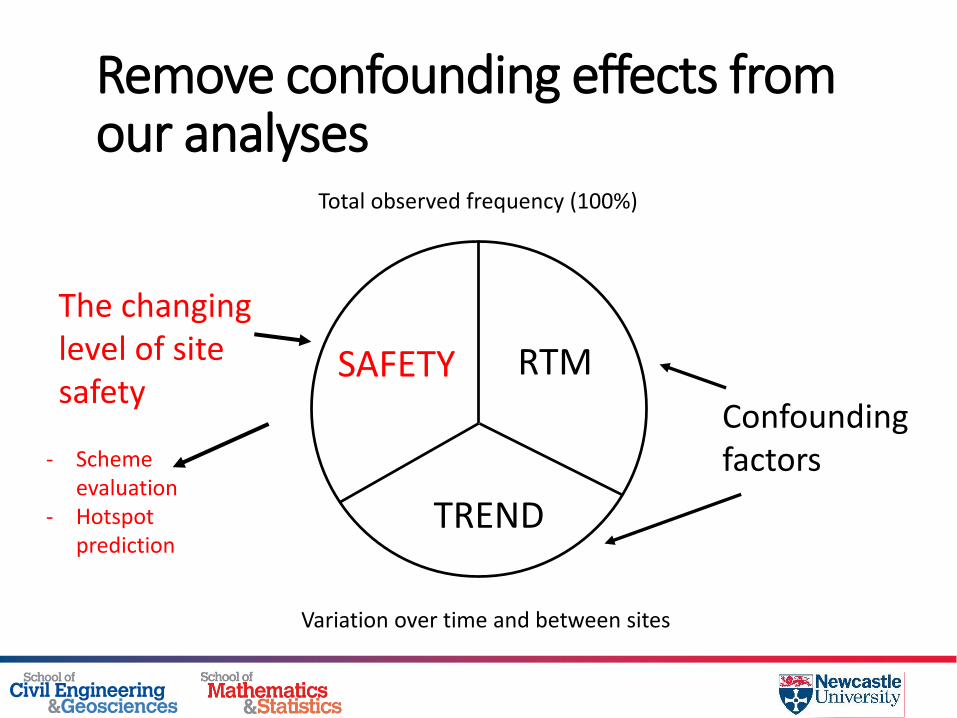
Remove confounding effects from our analyses
RTM
TREND
SAFETY
The changing level of site safety
Confounding factors
Total observed frequency (100%)
Variation over time and between sites
- Scheme evaluation
- Hotspot prediction
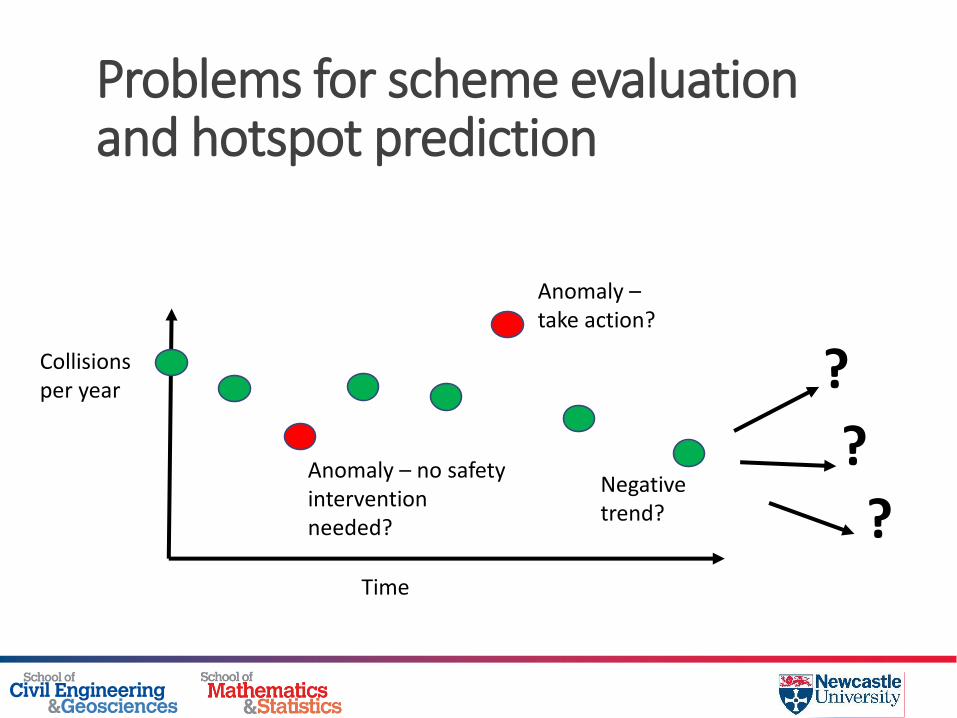
Collisionsper year
Problems for scheme evaluation and hotspot prediction
Time
Negative trend?
Anomaly –take action?
Anomaly – no safety intervention needed?
?
??
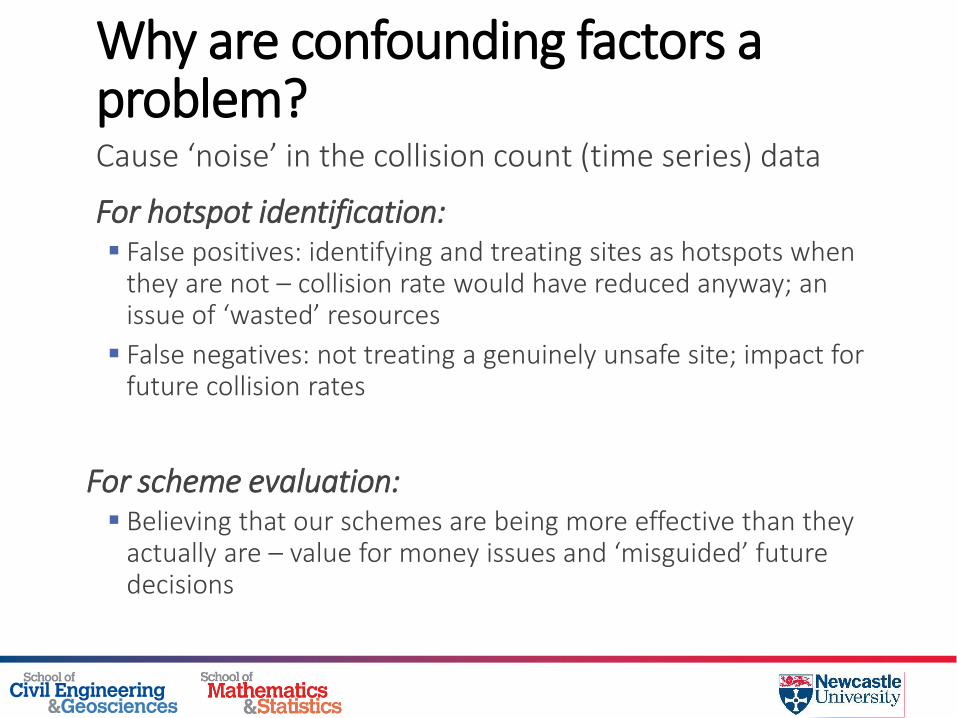
Why are confounding factors aproblem?Cause ‘noise’ in the collision count (time series) data
For hotspot identification: False positives: identifying and treating sites as hotspots when
they are not – collision rate would have reduced anyway; an issue of ‘wasted’ resources
False negatives: not treating a genuinely unsafe site; impact for future collision rates
For scheme evaluation: Believing that our schemes are being more effective than they
actually are – value for money issues and ‘misguided’ future decisions
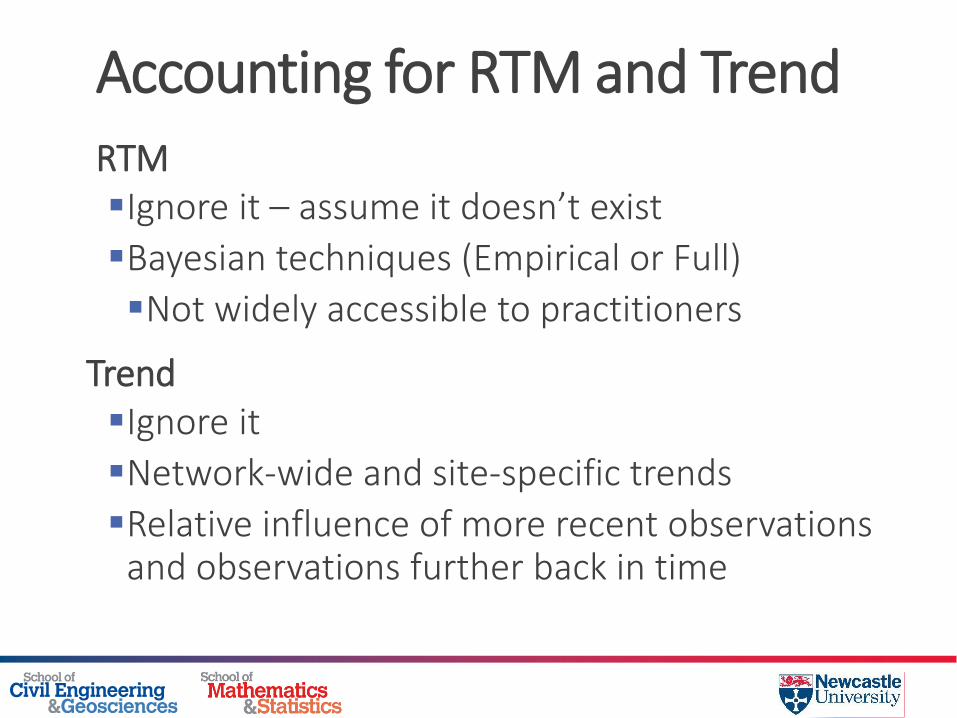
Accounting for RTM and TrendRTMIgnore it – assume it doesn’t exist
Bayesian techniques (Empirical or Full)
Not widely accessible to practitioners
TrendIgnore it
Network-wide and site-specific trends
Relative influence of more recent observations and observations further back in time
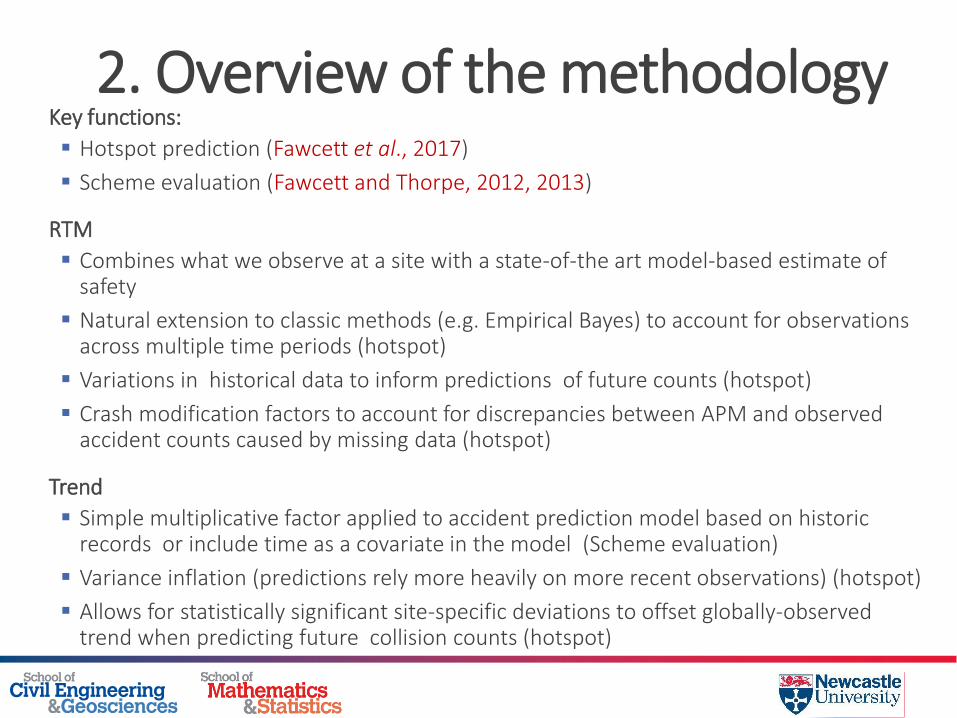
2. Overview of the methodology Key functions:
Hotspot prediction (Fawcett et al., 2017)
Scheme evaluation (Fawcett and Thorpe, 2012, 2013)
RTM
Combines what we observe at a site with a state-of-the art model-based estimate of safety
Natural extension to classic methods (e.g. Empirical Bayes) to account for observations across multiple time periods (hotspot)
Variations in historical data to inform predictions of future counts (hotspot)
Crash modification factors to account for discrepancies between APM and observed accident counts caused by missing data (hotspot)
Trend
Simple multiplicative factor applied to accident prediction model based on historic records or include time as a covariate in the model (Scheme evaluation)
Variance inflation (predictions rely more heavily on more recent observations) (hotspot)
Allows for statistically significant site-specific deviations to offset globally-observed trend when predicting future collision counts (hotspot)

Data requirementsHotspot prediction and scheme evaluation•Dependent variable: Collision/casualty counts
in discrete time periods (e.g. months, quarters or years) for each site• Independent variables: Static site data (e.g.
speed limit; road type; road class, urban/rural); dynamic site data (e.g. flow; average speeds) for each time period
Scheme evaluation only•The same but for a reference pool of sites to
construct the accident prediction model
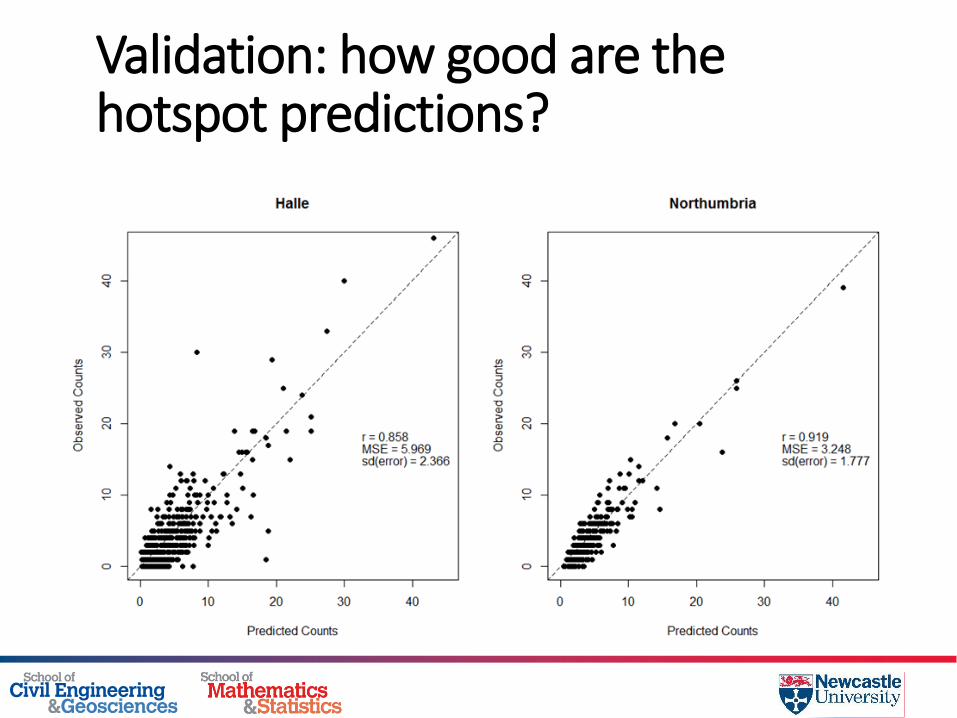
Validation: how good are the hotspot predictions?
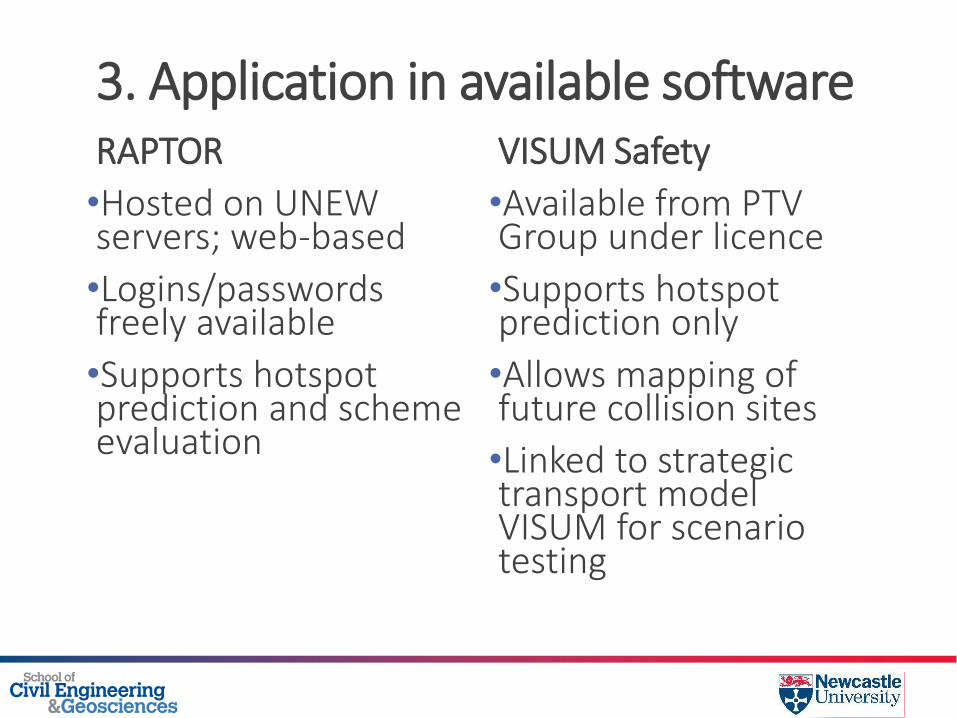
3. Application in available softwareRAPTOR
•Hosted on UNEW servers; web-based
•Logins/passwords freely available
•Supports hotspot prediction and scheme evaluation
VISUM Safety
•Available from PTV Group under licence
•Supports hotspot prediction only
•Allows mapping of future collision sites
•Linked to strategic transport model VISUM for scenario testing
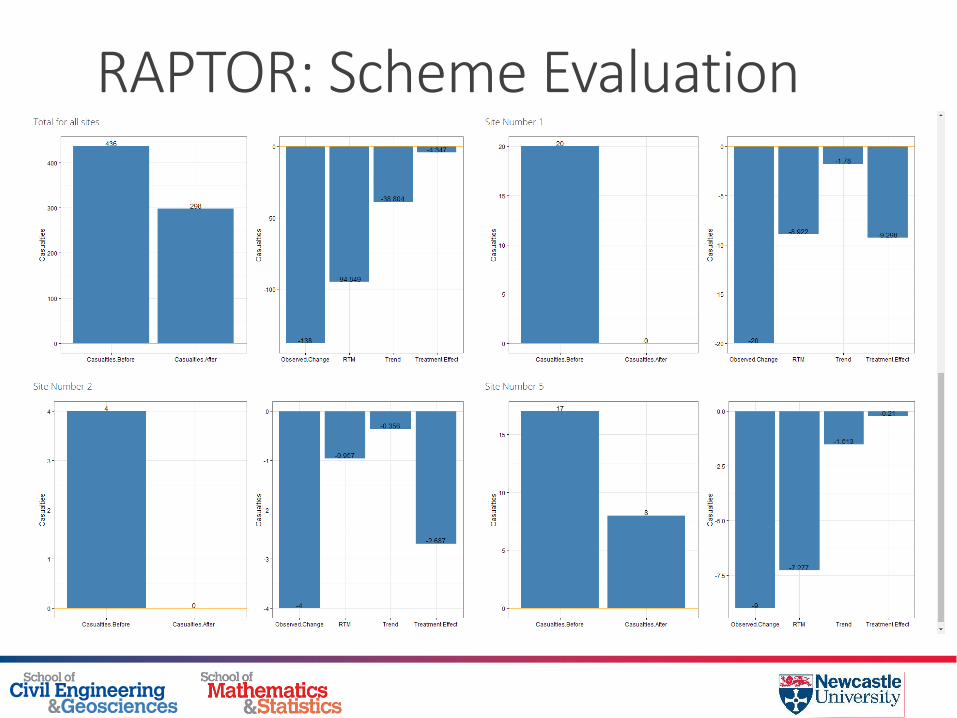
RAPTOR: Scheme Evaluation
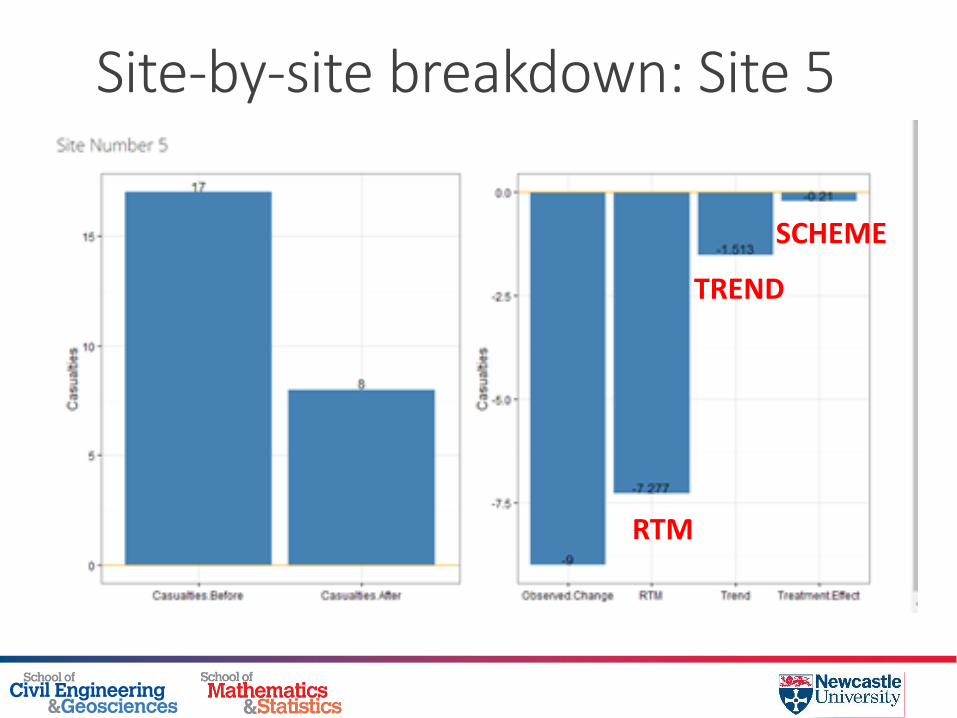
Site-by-site breakdown: Site 5
RTM
TREND
SCHEME
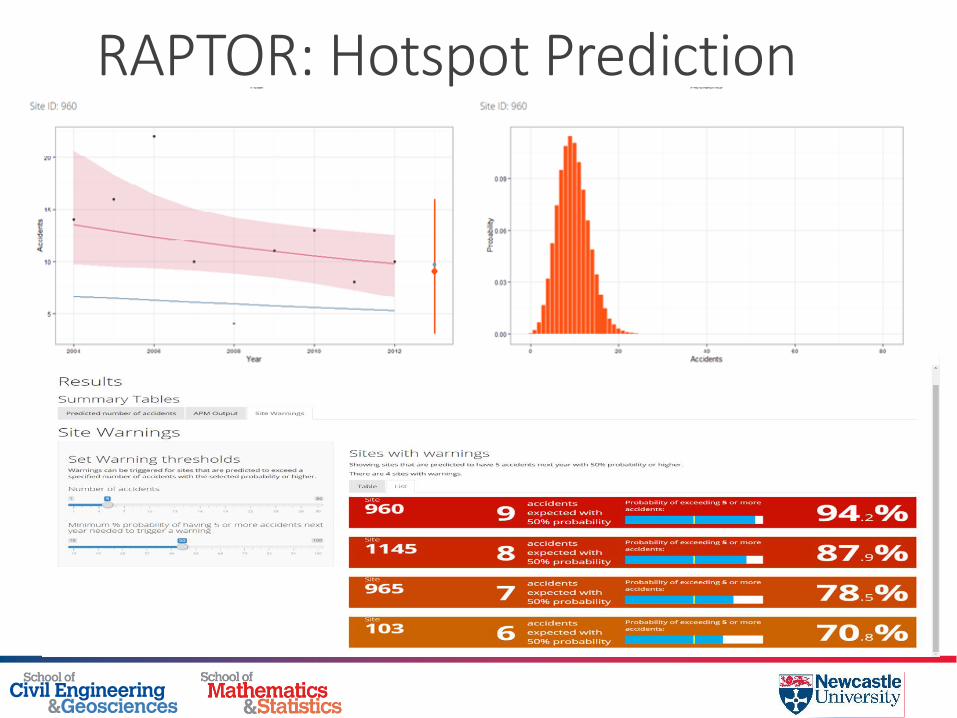
RAPTOR: Hotspot Prediction
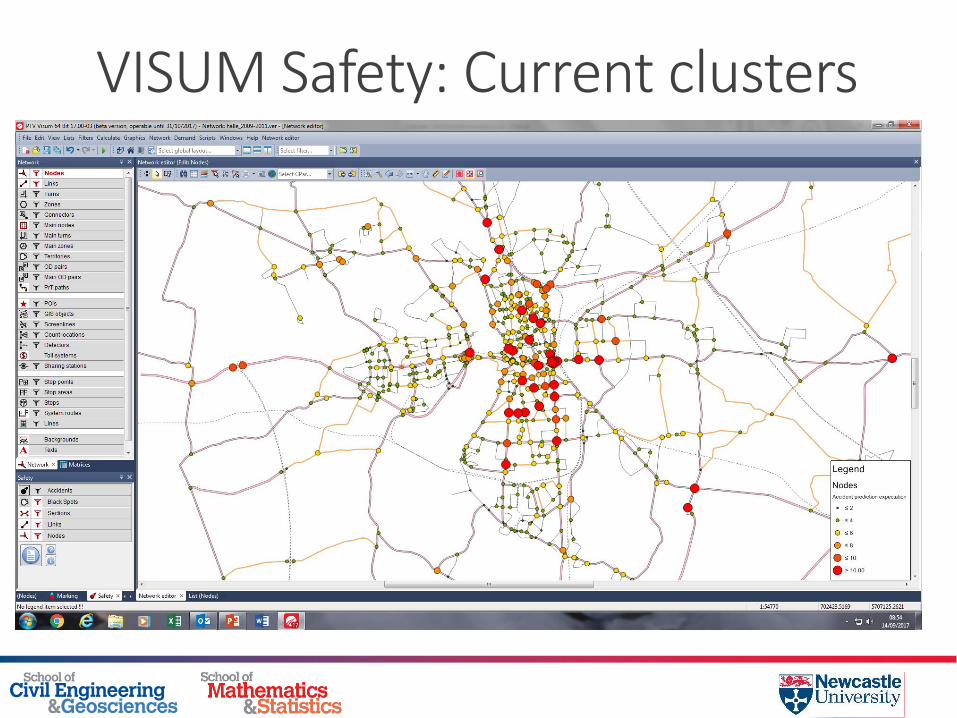
VISUM Safety: Current clusters
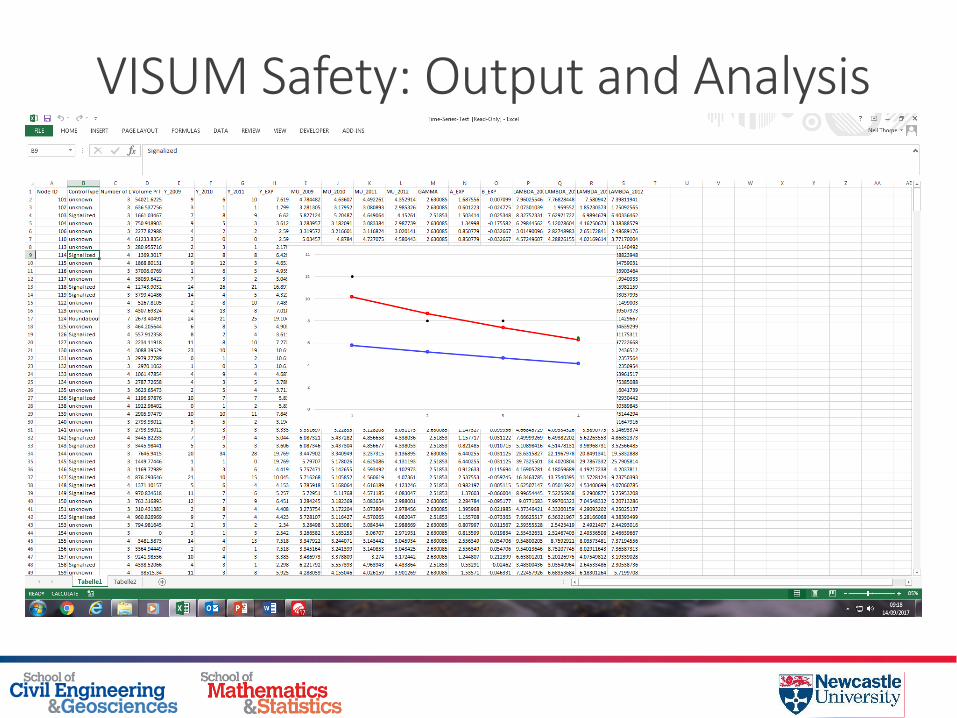
VISUM Safety: Output and Analysis
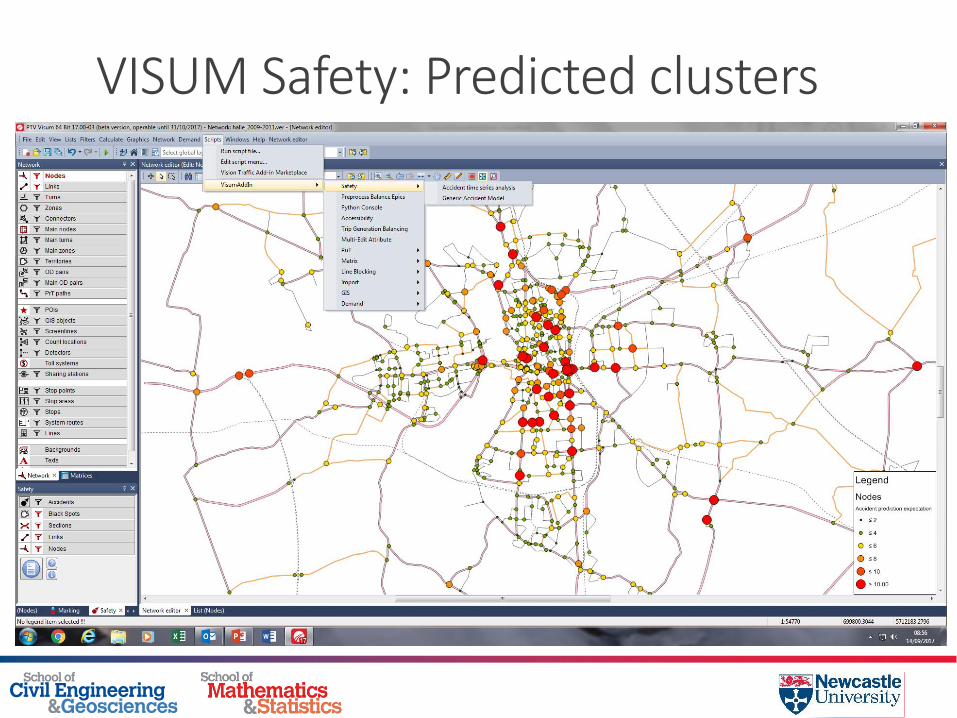
VISUM Safety: Predicted clusters
4. Benefits of the approach
Peer-reviewed approach accessible to road safety practitioners to aid decision-making
Information about ‘true’ effect of road safety interventions on collision/casualty reduction
Predictions of collision/casualty frequency in a future time period: site prioritisation
Evidence-led and proactive approach to road safety investment
ReferencesThorpe N, Fawcett L. (2012) ‘Linking road casualty and clinical data to assess the effectiveness of mobile safety enforcement cameras: a before and after study.’ BMJ Open, 2(6), e001304. http://bmjopen.bmj.com/content/2/6/e001304?ct
Fawcett, L.; Thorpe, N. (2013) Mobile safety cameras: estimating casualty reductions and the demand for secondary healthcare. Journal of Applied Statistics 40(11), 2385-2406 http://www.tandfonline.com/doi/full/10.1080/02664763.2013.817547
Fawcett, L.; Thorpe, N.; Matthews, J.; Kremer, K. (2017) A novel Bayesian hierarchical model for road safety hotspot prediction. Accident Analysis & Prevention, 99, pp.262-271. http://www.sciencedirect.com/science/article/pii/S0001457516304341
RAPTOR logins and further information available from [email protected]