Embed Size (px)
Citation preview
© Copyright 2009 National Council on Compensation Insurance, Inc. All Rights Reserved.© Copyright 2009 National Council on Compensation Insurance, Inc. All Rights Reserved.
Nevada
March 26, 2009
[email protected] 818.707.8374
[email protected] 904.589.9648
[email protected] 201.386.2633
22© Copyright 2009 National Council on Compensation Insurance, Inc. All Rights Reserved.
8:30 Continental Breakfast
9:00 Legislative Update
Workers Compensation System Overview
10:45 Break
Impact of Recessions on Workers Compensation
The Residual Market in Nevada
Implications of the New AMA Guides
11:45 Closing Remarks
Nevada Workers CompensationState Advisory Forum
© Copyright 2009 National Council on Compensation Insurance, Inc. All Rights Reserved.
Legislative Update
© Copyright 2009 National Council on Compensation Insurance, Inc. All Rights Reserved.
Workers Compensation System Overview
55© Copyright 2009 National Council on Compensation Insurance, Inc. All Rights Reserved.
State of the Industry—An Overview
• Total workers compensation premium continues to decline
• Underwriting results continue to be good, although there has been some deterioration
• Frequency continues to decline—at a lower rate
• Medical costs remain above inflation
• Uncertain political fallout from fall elections
• Continued regulatory turnover
66© Copyright 2009 National Council on Compensation Insurance, Inc. All Rights Reserved.
NevadaWorkers Compensation System—
An Overview
• Premium growth continues
• Underwriting results continue to be relatively good
• Frequency continues to decline—at a lower rate
• Significant increase in Accident Year 2007 indemnity and medical claim costs
• High indemnity costs compared to other states
77© Copyright 2009 National Council on Compensation Insurance, Inc. All Rights Reserved.
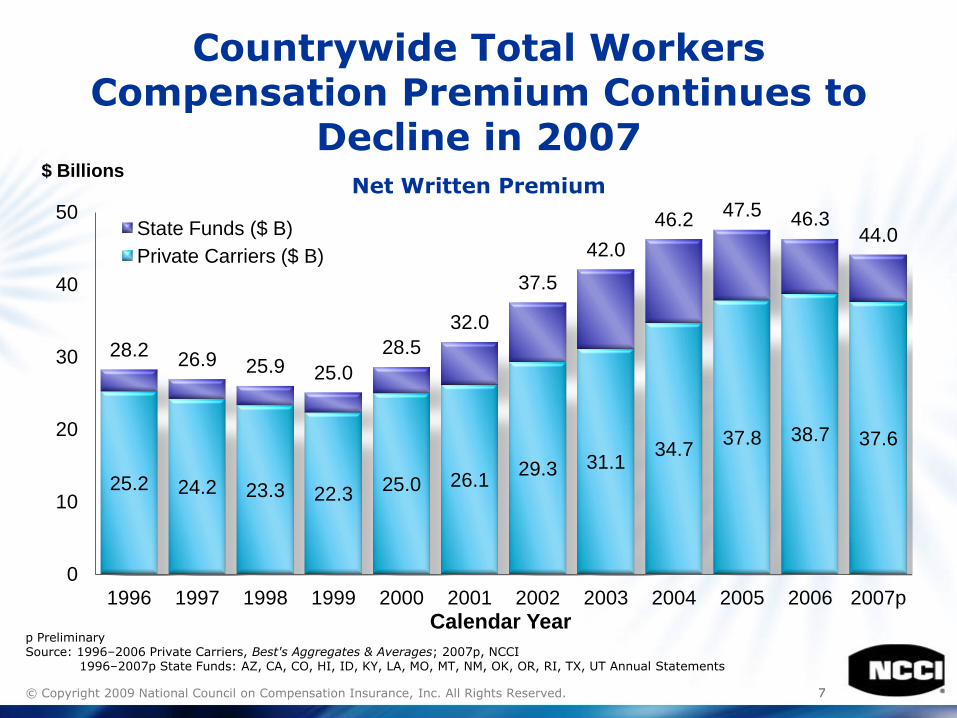
Countrywide Total Workers Compensation Premium Continues to
Decline in 2007Net Written Premium
25.2 24.2 23.3 22.325.0 26.1
29.3 31.134.7
37.8 38.7 37.6
28.226.9 25.9 25.0
28.5
32.0
37.5
42.0
46.247.5 46.3
44.0
0
10
20
30
40
50
1996 1997 1998 1999 2000 2001 2002 2003 2004 2005 2006 2007p
State Funds ($ B)
Private Carriers ($ B)
Calendar Year
$ Billions
p PreliminarySource: 1996–2006 Private Carriers, Best's Aggregates & Averages; 2007p, NCCI
1996–2007p State Funds: AZ, CA, CO, HI, ID, KY, LA, MO, MT, NM, OK, OR, RI, TX, UT Annual Statements
88© Copyright 2009 National Council on Compensation Insurance, Inc. All Rights Reserved.
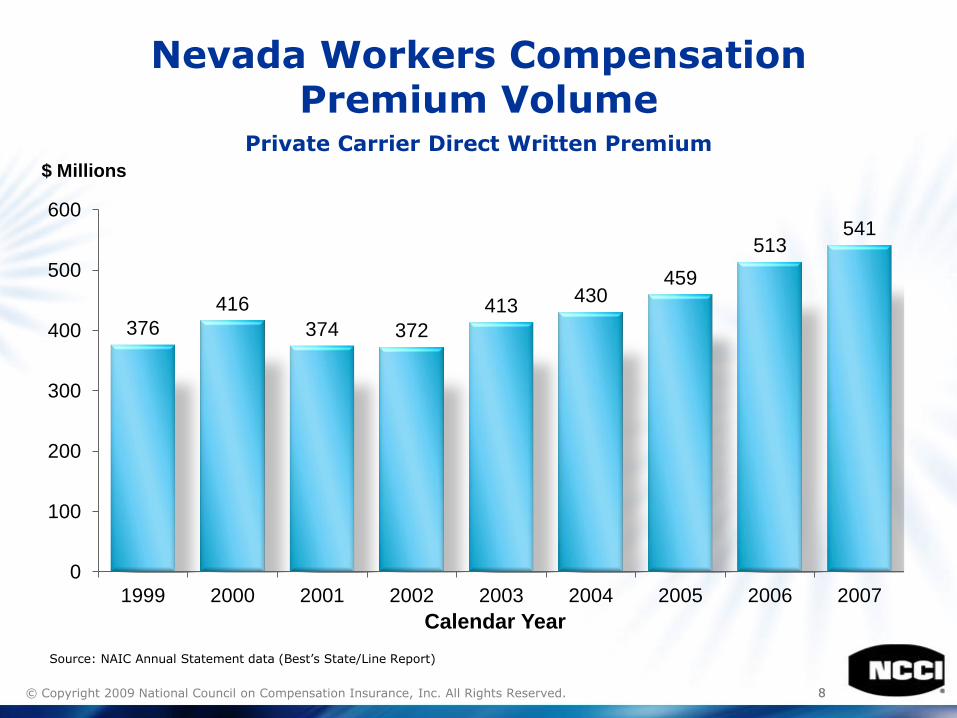
376
416
374 372
413430
459
513541
0
100
200
300
400
500
600
1999 2000 2001 2002 2003 2004 2005 2006 2007
$ Millions
Source: NAIC Annual Statement data (Best’s State/Line Report)
Calendar Year
Nevada Workers CompensationPremium Volume
Private Carrier Direct Written Premium
99© Copyright 2009 National Council on Compensation Insurance, Inc. All Rights Reserved.
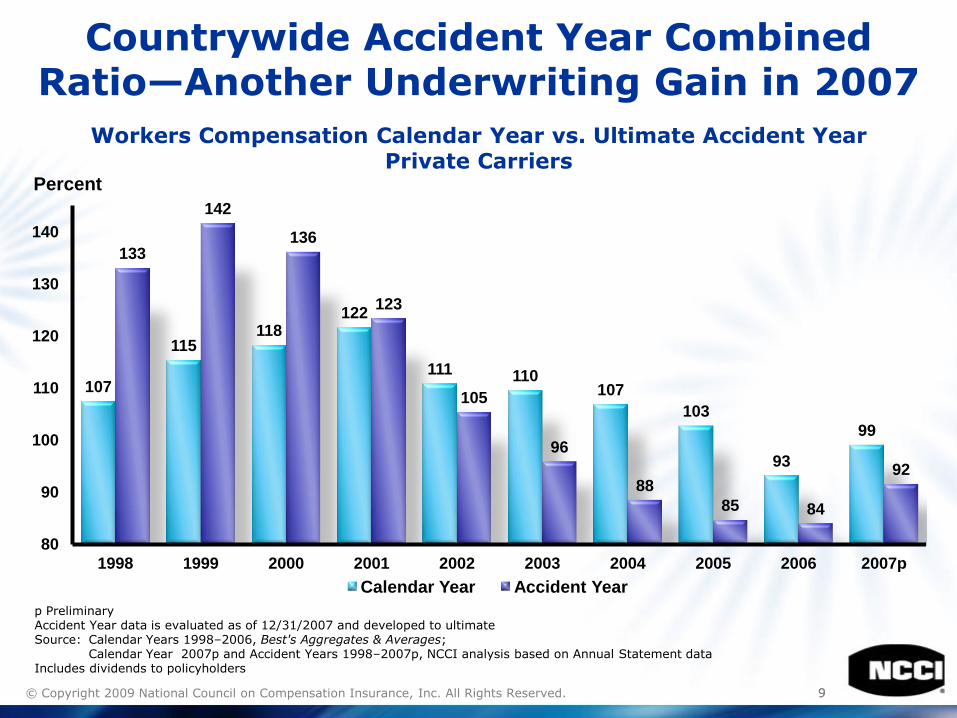
Countrywide Accident Year Combined Ratio—Another Underwriting Gain in 2007
Workers Compensation Calendar Year vs. Ultimate Accident YearPrivate Carriers
Percent
107
115118
122
111 110107
103
93
99
133
142
136
123
105
96
88
85 84
92
80
90
100
110
120
130
140
1998 1999 2000 2001 2002 2003 2004 2005 2006 2007p
Calendar Year Accident Year
p PreliminaryAccident Year data is evaluated as of 12/31/2007 and developed to ultimateSource: Calendar Years 1998–2006, Best's Aggregates & Averages;
Calendar Year 2007p and Accident Years 1998–2007p, NCCI analysis based on Annual Statement dataIncludes dividends to policyholders
1010© Copyright 2009 National Council on Compensation Insurance, Inc. All Rights Reserved.
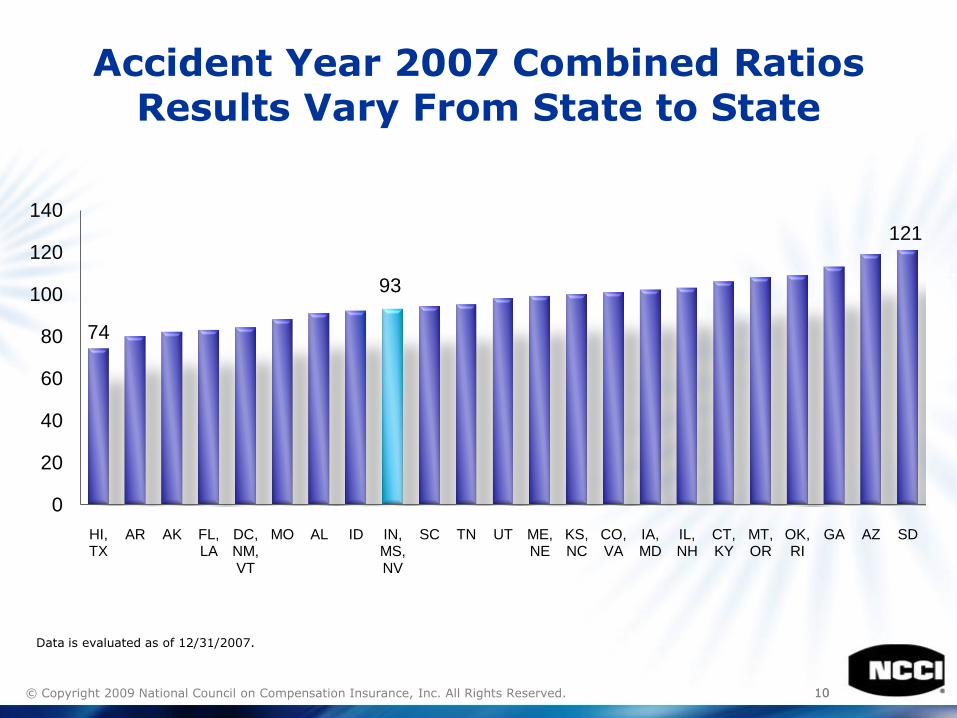
Accident Year 2007 Combined RatiosResults Vary From State to State
74
93
121
0
20
40
60
80
100
120
140
HI, TX
AR AK FL, LA
DC, NM, VT
MO AL ID IN, MS, NV
SC TN UT ME, NE
KS, NC
CO, VA
IA, MD
IL, NH
CT, KY
MT, OR
OK, RI
GA AZ SD
Data is evaluated as of 12/31/2007.
1111© Copyright 2009 National Council on Compensation Insurance, Inc. All Rights Reserved.
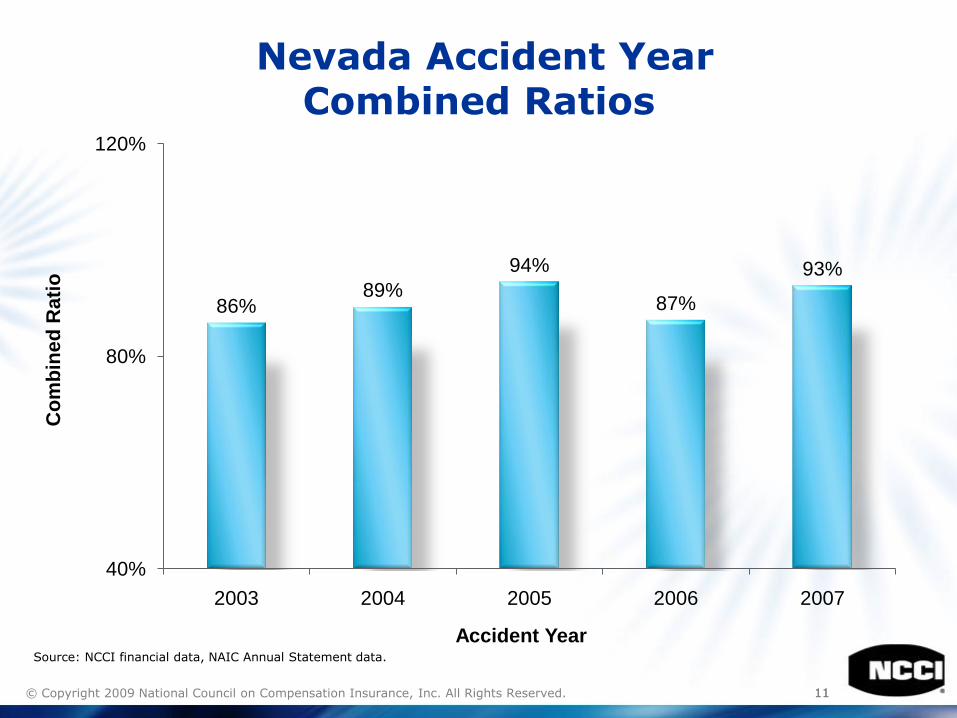
Nevada Accident Year Combined Ratios
86%89%
94%
87%
93%
40%
80%
120%
2003 2004 2005 2006 2007
Co
mb
ine
d R
ati
o
Accident YearSource: NCCI financial data, NAIC Annual Statement data.
1212© Copyright 2009 National Council on Compensation Insurance, Inc. All Rights Reserved.
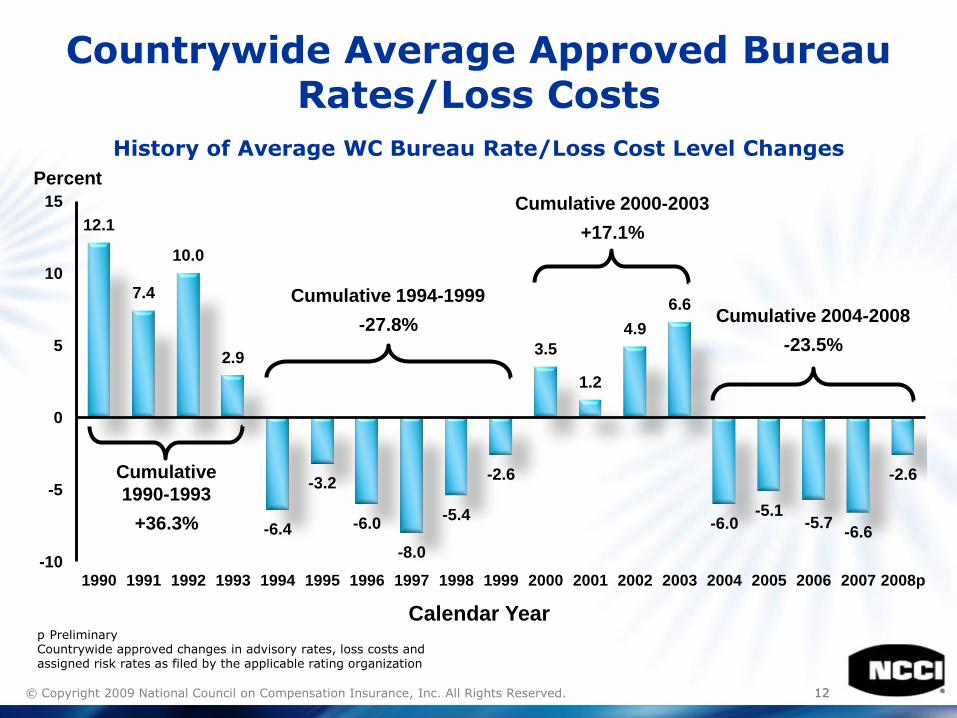
Countrywide Average Approved BureauRates/Loss Costs
History of Average WC Bureau Rate/Loss Cost Level Changes
p PreliminaryCountrywide approved changes in advisory rates, loss costs and assigned risk rates as filed by the applicable rating organization
12.1
7.4
10.0
2.9
-6.4
-3.2
-6.0
-8.0
-5.4
-2.6
3.5
1.2
4.9
6.6
-6.0-5.1
-5.7-6.6
-2.6
-10
-5
0
5
10
15
1990 1991 1992 1993 1994 1995 1996 1997 1998 1999 2000 2001 2002 2003 2004 2005 2006 2007 2008p
Cumulative
1990-1993
+36.3%
Cumulative 1994-1999
-27.8%
Percent
Cumulative 2000-2003
+17.1%
Cumulative 2004-2008
-23.5%
Calendar Year
1313© Copyright 2009 National Council on Compensation Insurance, Inc. All Rights Reserved.
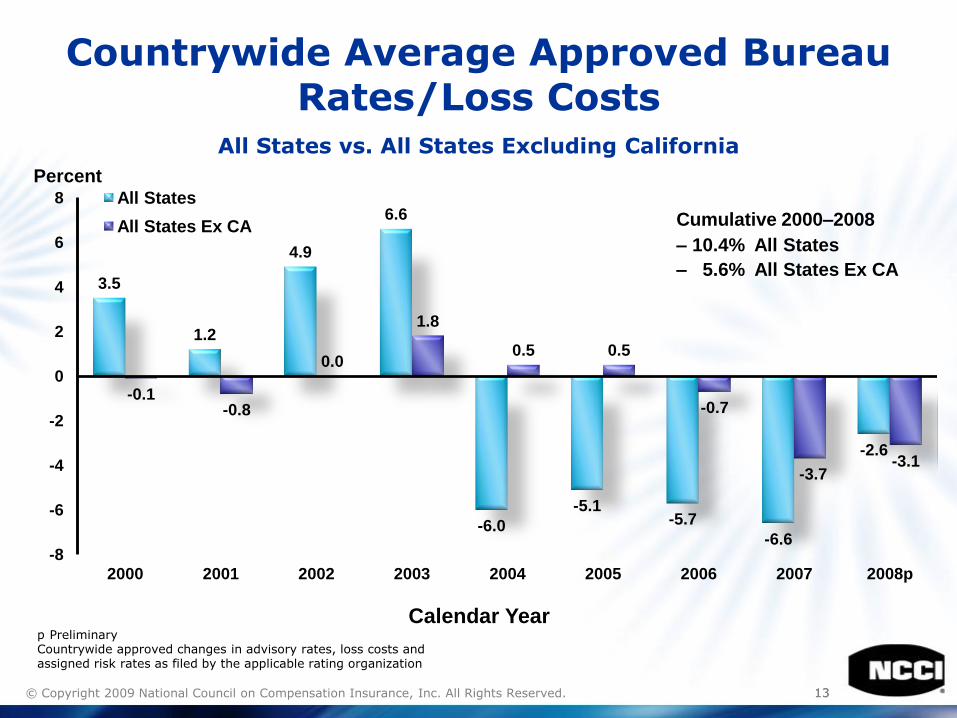
Countrywide Average Approved BureauRates/Loss Costs
All States vs. All States Excluding California
3.5
1.2
4.9
6.6
-6.0
-5.1-5.7
-6.6
-2.6
-0.1-0.8
0.0
1.8
0.5 0.5
-0.7
-3.7-3.1
-8
-6
-4
-2
0
2
4
6
8
2000 2001 2002 2003 2004 2005 2006 2007 2008p
All States
All States Ex CA
Percent
Cumulative 2000–2008
– 10.4% All States
– 5.6% All States Ex CA
Calendar Yearp PreliminaryCountrywide approved changes in advisory rates, loss costs and assigned risk rates as filed by the applicable rating organization
1414© Copyright 2009 National Council on Compensation Insurance, Inc. All Rights Reserved.
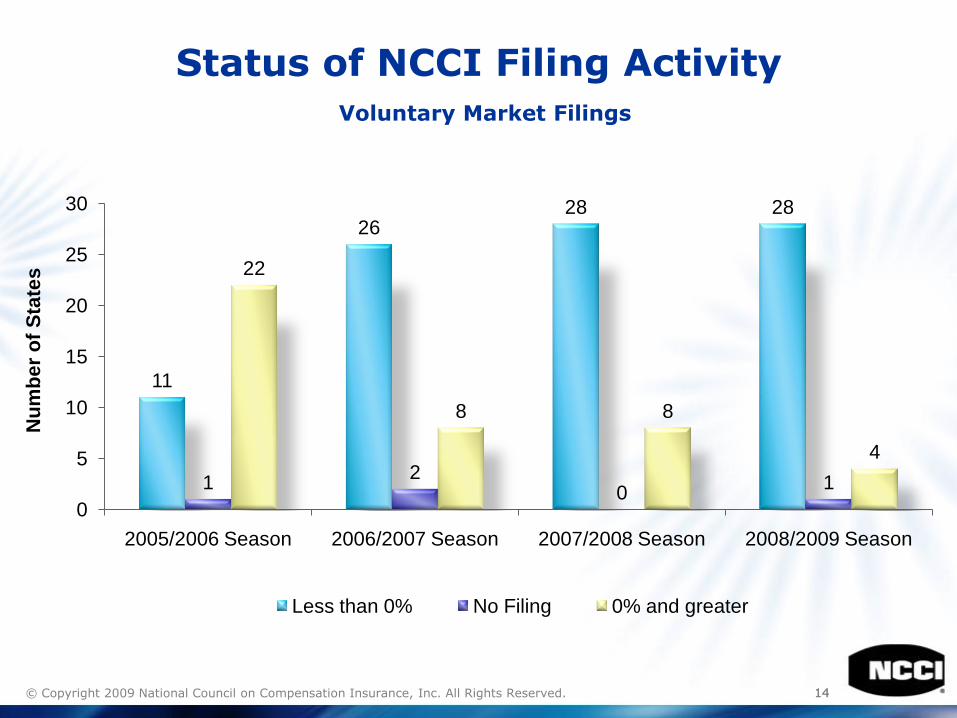
Status of NCCI Filing ActivityVoluntary Market Filings
11
2628 28
12
01
22
8 8
4
0
5
10
15
20
25
30
2005/2006 Season 2006/2007 Season 2007/2008 Season 2008/2009 Season
Nu
mb
er
of
Sta
tes
Less than 0% No Filing 0% and greater
1515© Copyright 2009 National Council on Compensation Insurance, Inc. All Rights Reserved.
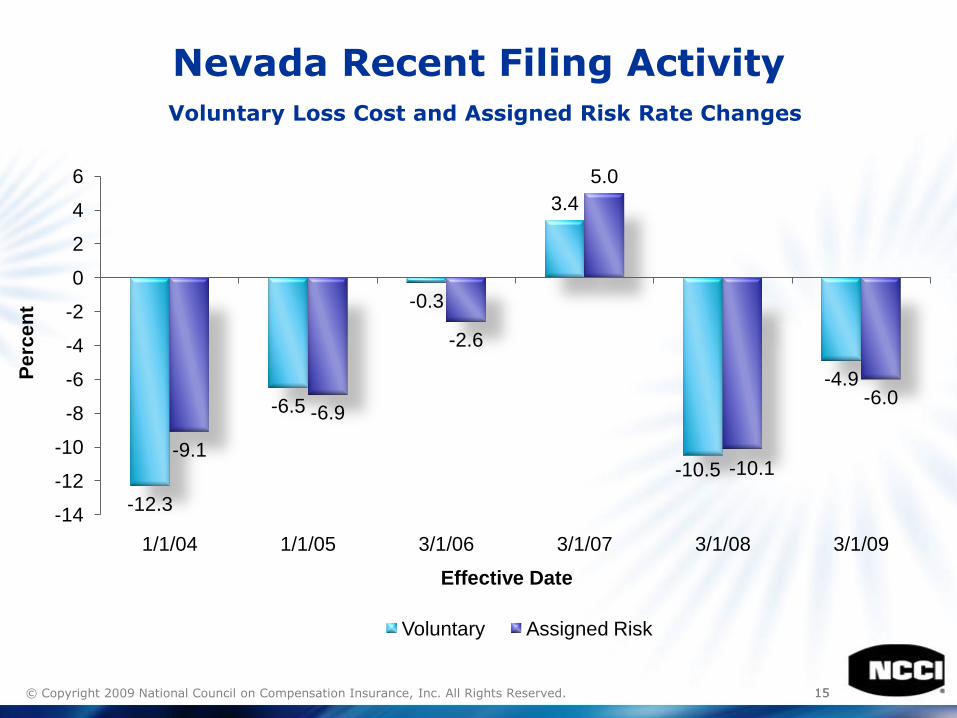
-12.3
-6.5
-0.3
3.4
-10.5
-4.9
-9.1
-6.9
-2.6
5.0
-10.1
-6.0
-14
-12
-10
-8
-6
-4
-2
0
2
4
6
1/1/04 1/1/05 3/1/06 3/1/07 3/1/08 3/1/09
Pe
rce
nt
Effective Date
Voluntary Assigned Risk
Nevada Recent Filing ActivityVoluntary Loss Cost and Assigned Risk Rate Changes
1616© Copyright 2009 National Council on Compensation Insurance, Inc. All Rights Reserved.
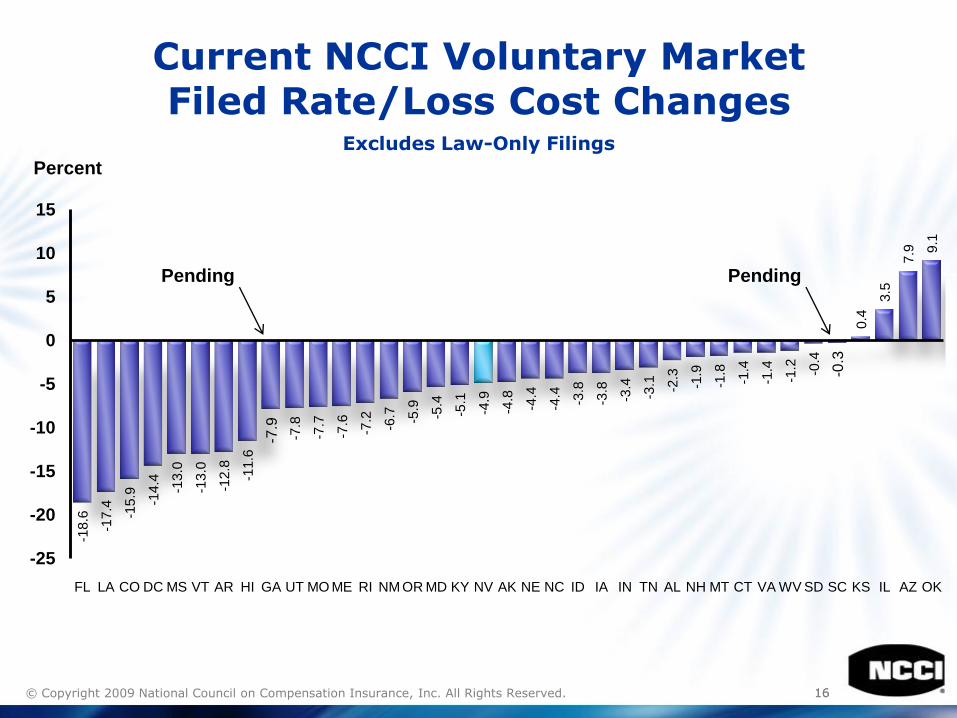
Current NCCI Voluntary MarketFiled Rate/Loss Cost Changes
Excludes Law-Only Filings
-18.6
-17.4
-15.9
-14.4
-13.0
-13.0
-12.8
-11.6
-7.8
-7.7
-7.6
-7.2
-6.7 -5.9
-5.4
-5.1
-4.9
-4.8
-4.4
-4.4
-3.8
-3.8
-3.4
-3.1 -2.3
-1.9
-1.8
-1.4
-1.4
-1.2 -0.4
0.4
3.5
7.9 9
.1
-7.9
-0.3
-25
-20
-15
-10
-5
0
5
10
15
FL LA CO DC MS VT AR HI GA UT MO ME RI NM OR MD KY NV AK NE NC ID IA IN TN AL NH MT CT VA WV SD SC KS IL AZ OK
Percent
Pending Pending
1717© Copyright 2009 National Council on Compensation Insurance, Inc. All Rights Reserved.
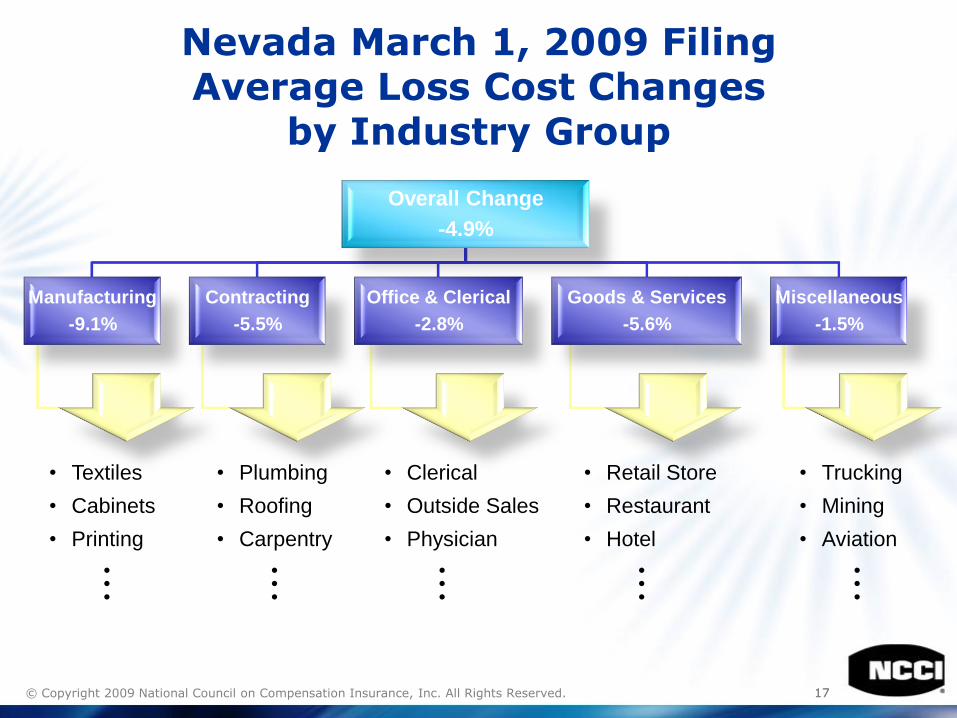
Nevada March 1, 2009 FilingAverage Loss Cost Changes
by Industry Group
Overall Change
-4.9%
Manufacturing
-9.1%
Contracting
-5.5%
Office & Clerical
-2.8%
Goods & Services
-5.6%
Miscellaneous
-1.5%
• Textiles
• Cabinets
• Printing
•••
• Plumbing
• Roofing
• Carpentry
•••
• Clerical
• Outside Sales
• Physician
•••
• Retail Store
• Restaurant
• Hotel
•••
• Trucking
• Mining
• Aviation
•••
1818© Copyright 2009 National Council on Compensation Insurance, Inc. All Rights Reserved.
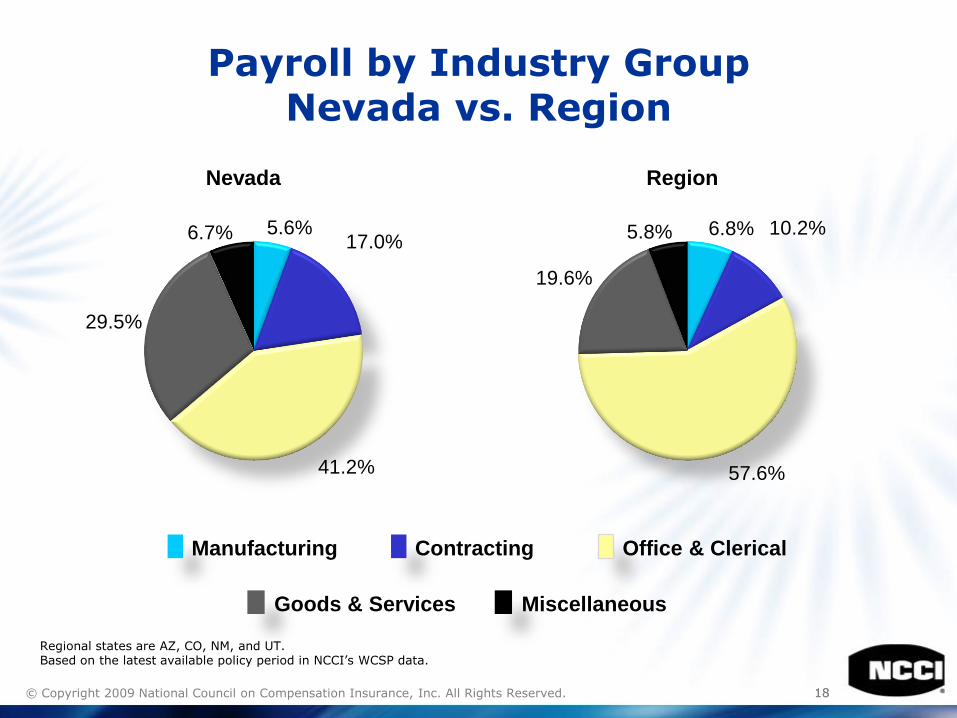
5.6%17.0%
41.2%
29.5%
6.7%
Payroll by Industry GroupNevada vs. Region
6.8% 10.2%
57.6%
19.6%
5.8%
Nevada Region
Manufacturing Contracting Office & Clerical
Goods & Services Miscellaneous
Regional states are AZ, CO, NM, and UT.Based on the latest available policy period in NCCI’s WCSP data.
1919© Copyright 2009 National Council on Compensation Insurance, Inc. All Rights Reserved.
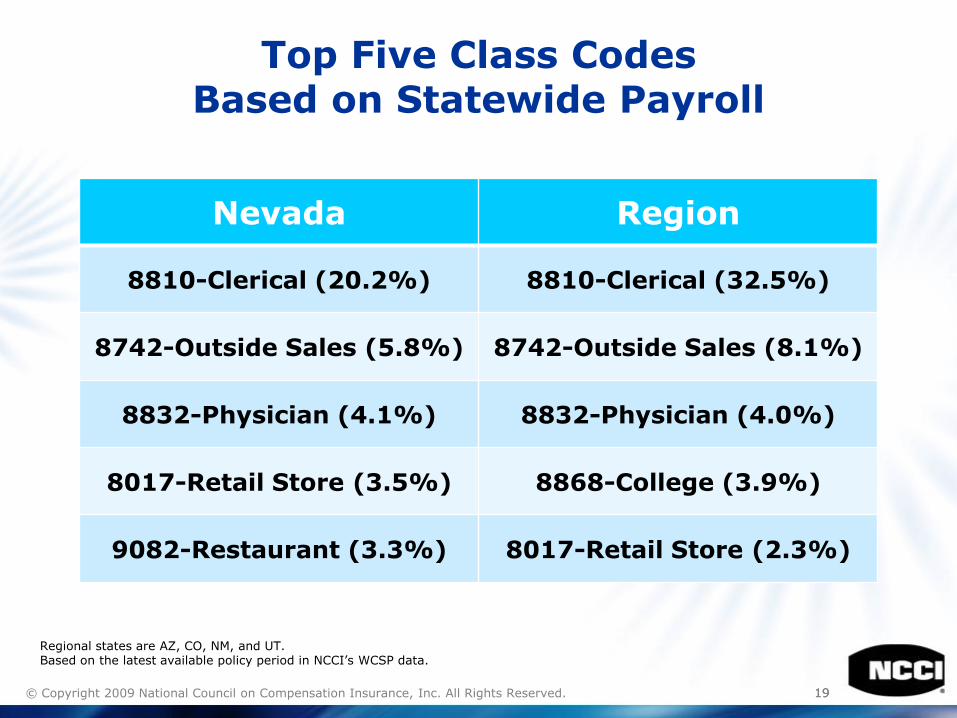
Top Five Class CodesBased on Statewide Payroll
Nevada Region
8810-Clerical (20.2%) 8810-Clerical (32.5%)
8742-Outside Sales (5.8%) 8742-Outside Sales (8.1%)
8832-Physician (4.1%) 8832-Physician (4.0%)
8017-Retail Store (3.5%) 8868-College (3.9%)
9082-Restaurant (3.3%) 8017-Retail Store (2.3%)
Regional states are AZ, CO, NM, and UT.Based on the latest available policy period in NCCI’s WCSP data.
2020© Copyright 2009 National Council on Compensation Insurance, Inc. All Rights Reserved.
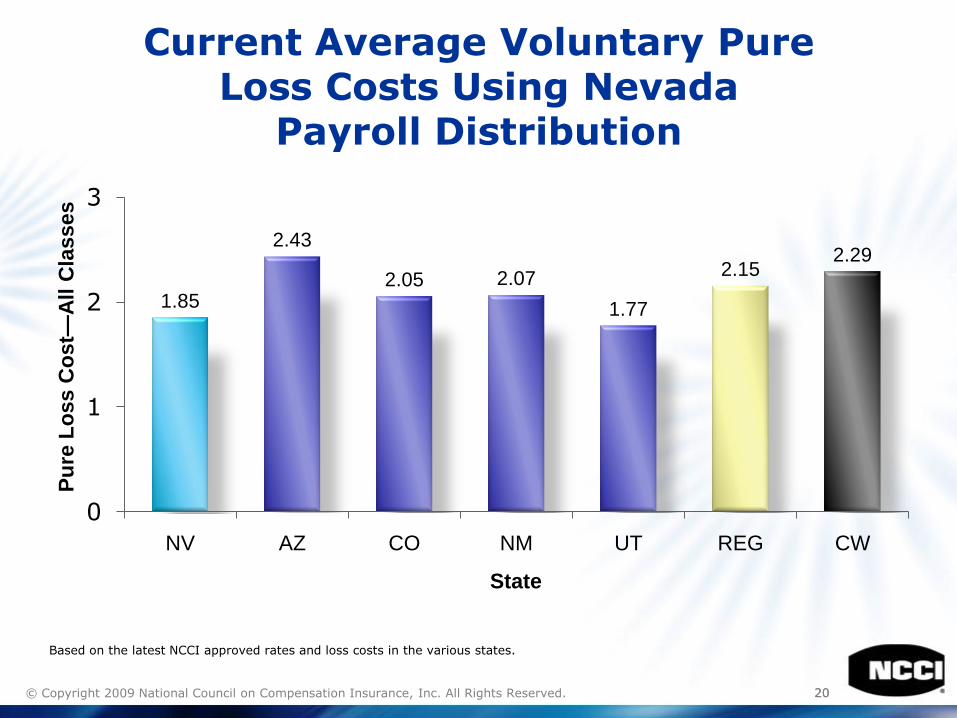
Current Average Voluntary Pure Loss Costs Using Nevada
Payroll Distribution
1.85
2.43
2.05 2.07
1.77
2.152.29
0
1
2
3
NV AZ CO NM UT REG CW
Pu
re L
oss C
ost—
All C
lasses
State
Based on the latest NCCI approved rates and loss costs in the various states.
2121© Copyright 2009 National Council on Compensation Insurance, Inc. All Rights Reserved.
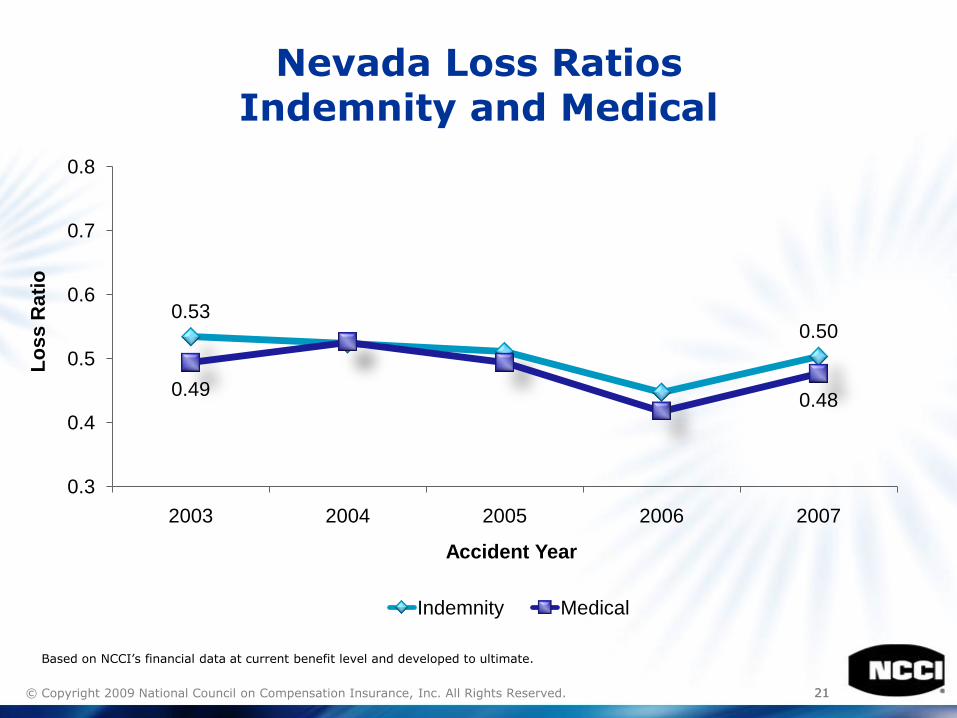
Nevada Loss RatiosIndemnity and Medical
0.530.50
0.490.48
0.3
0.4
0.5
0.6
0.7
0.8
2003 2004 2005 2006 2007
Lo
ss
Rati
o
Accident Year
Indemnity Medical
Based on NCCI’s financial data at current benefit level and developed to ultimate.
© Copyright 2009 National Council on Compensation Insurance, Inc. All Rights Reserved.
Claim Frequency
2323© Copyright 2009 National Council on Compensation Insurance, Inc. All Rights Reserved.
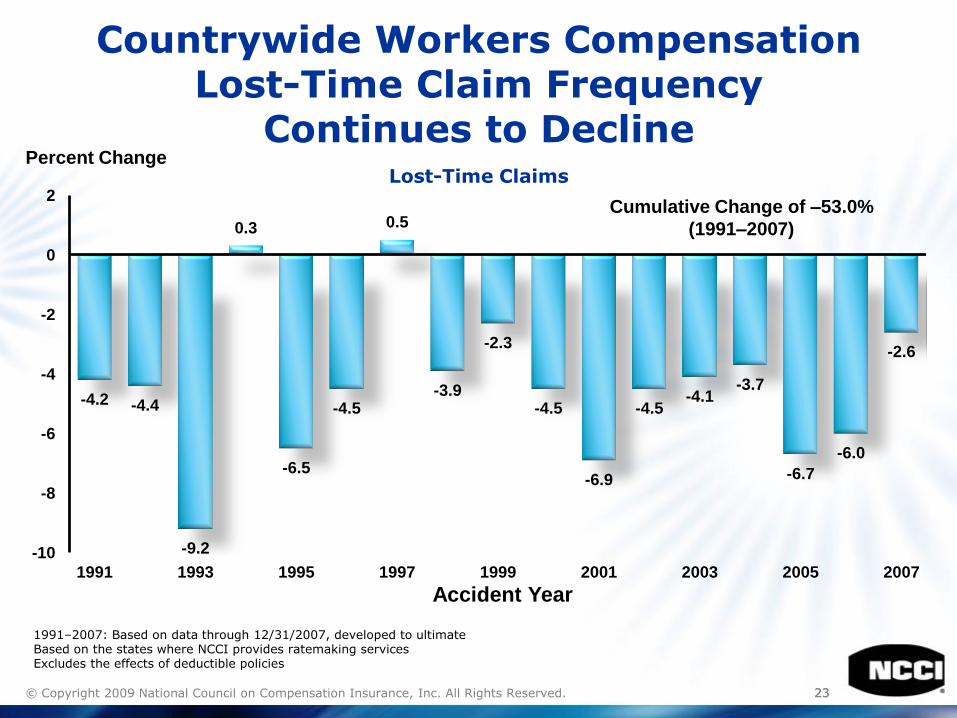
Countrywide Workers Compensation Lost-Time Claim Frequency
Continues to Decline Lost-Time Claims
-4.2 -4.4
-9.2
0.3
-6.5
-4.5
0.5
-3.9
-2.3
-4.5
-6.9
-4.5-4.1
-3.7
-6.7
-6.0
-2.6
-10
-8
-6
-4
-2
0
2
1991 1993 1995 1997 1999 2001 2003 2005 2007
Cumulative Change of –53.0%
(1991–2007)
Percent Change
Accident Year
1991–2007: Based on data through 12/31/2007, developed to ultimateBased on the states where NCCI provides ratemaking servicesExcludes the effects of deductible policies
2424© Copyright 2009 National Council on Compensation Insurance, Inc. All Rights Reserved.
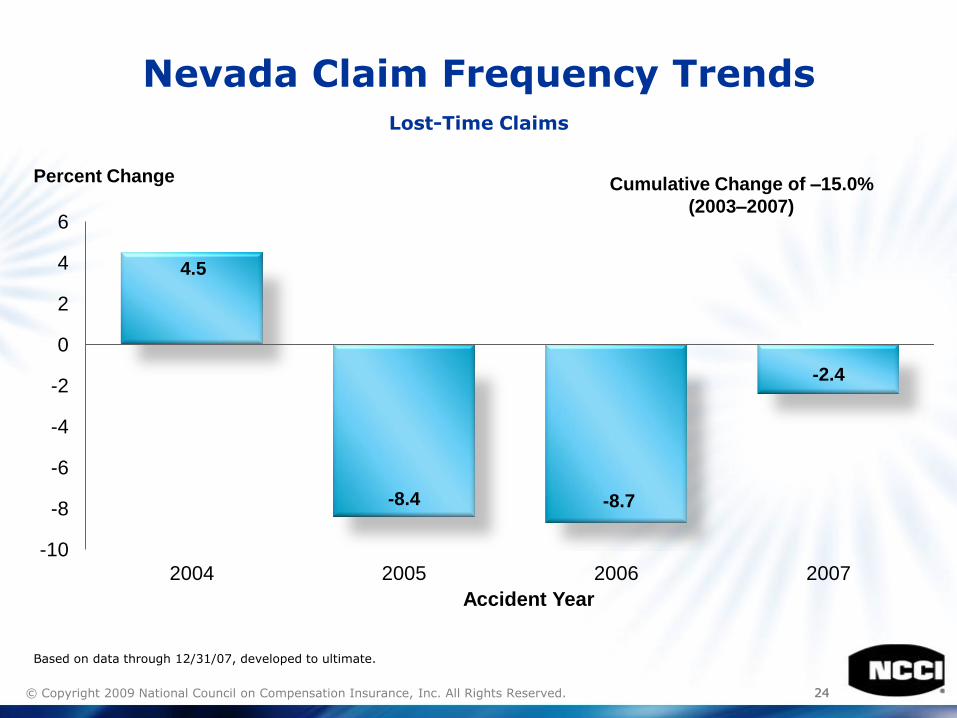
Nevada Claim Frequency TrendsLost-Time Claims
4.5
-8.4 -8.7
-2.4
-10
-8
-6
-4
-2
0
2
4
6
2004 2005 2006 2007
Accident Year
Cumulative Change of –15.0%
(2003–2007)
Percent Change
Based on data through 12/31/07, developed to ultimate.
2525© Copyright 2009 National Council on Compensation Insurance, Inc. All Rights Reserved.
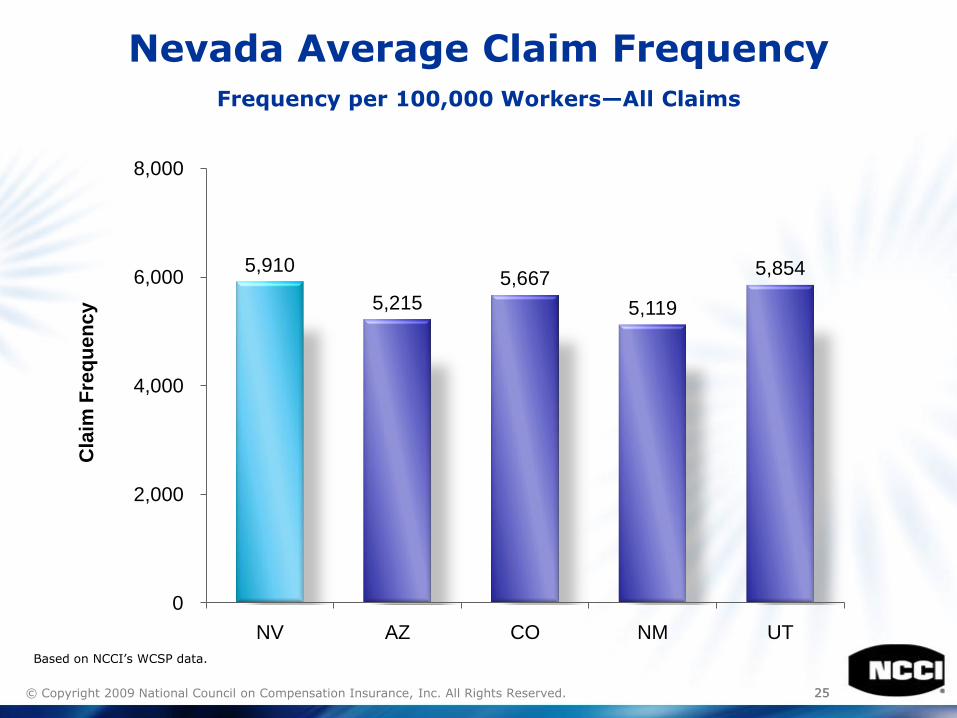
Nevada Average Claim FrequencyFrequency per 100,000 Workers—All Claims
5,910
5,215
5,667
5,119
5,854
0
2,000
4,000
6,000
8,000
NV AZ CO NM UT
Cla
im F
req
ue
nc
y
Based on NCCI’s WCSP data.
2626© Copyright 2009 National Council on Compensation Insurance, Inc. All Rights Reserved.
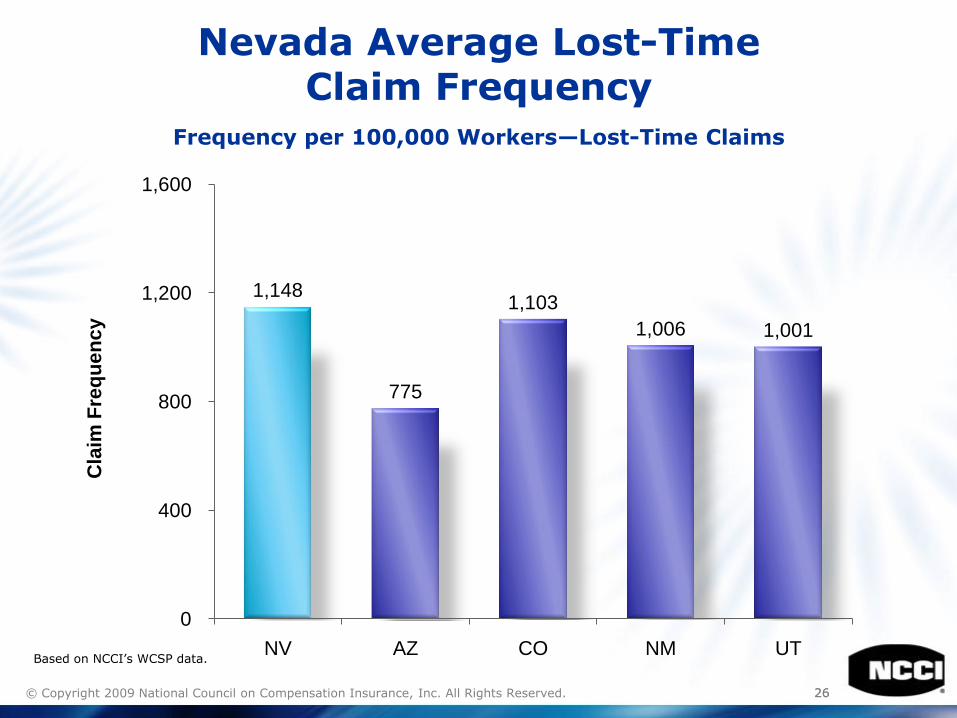
Nevada Average Lost-Time Claim Frequency
Frequency per 100,000 Workers—Lost-Time Claims
1,148
775
1,103
1,006 1,001
0
400
800
1,200
1,600
NV AZ CO NM UT
Cla
im F
req
ue
nc
y
Based on NCCI’s WCSP data.
2727© Copyright 2009 National Council on Compensation Insurance, Inc. All Rights Reserved.
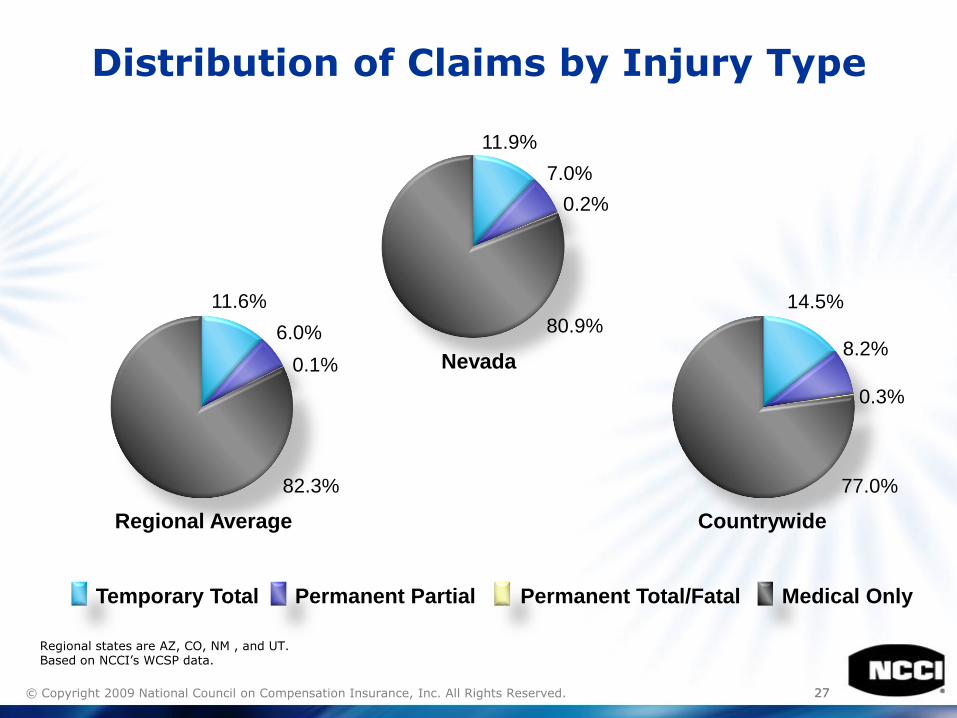
Distribution of Claims by Injury Type
11.9%
7.0%
0.2%
80.9%
11.6%
6.0%
0.1%
82.3%
Nevada
Permanent Partial Permanent Total/Fatal Medical OnlyTemporary Total
14.5%
8.2%
0.3%
77.0%
Regional Average Countrywide
Regional states are AZ, CO, NM , and UT.Based on NCCI’s WCSP data.
© Copyright 2009 National Council on Compensation Insurance, Inc. All Rights Reserved.
Economic Conditions in Nevada—Implications for
Claim Frequency
2929© Copyright 2009 National Council on Compensation Insurance, Inc. All Rights Reserved.
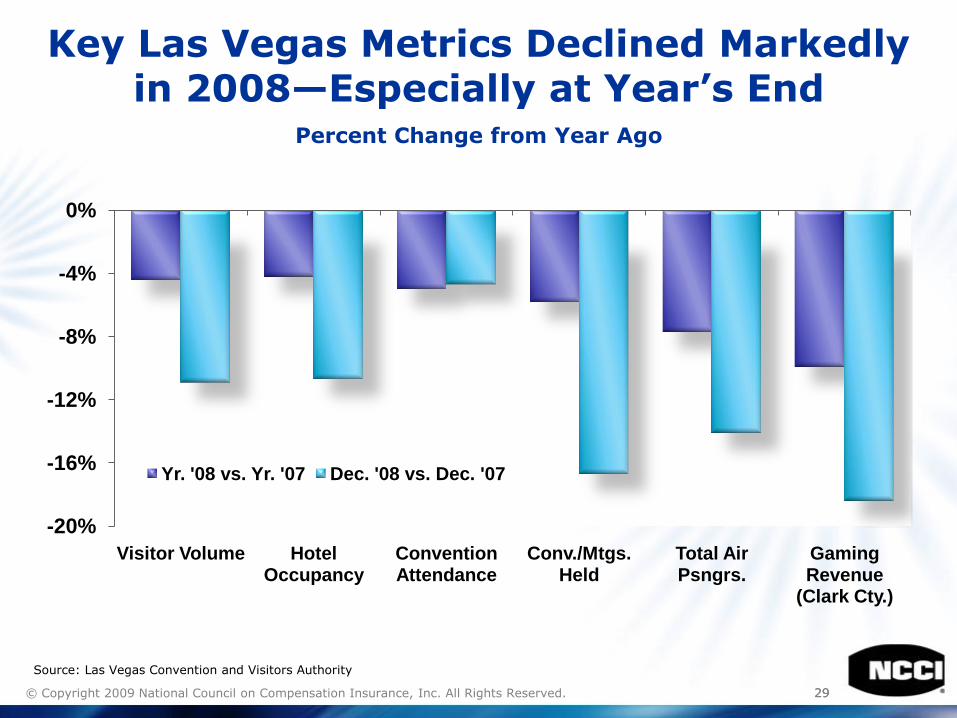
Key Las Vegas Metrics Declined Markedly in 2008—Especially at Year’s End
Percent Change from Year Ago
-20%
-16%
-12%
-8%
-4%
0%
Visitor Volume Hotel Occupancy
Convention Attendance
Conv./Mtgs. Held
Total Air Psngrs.
Gaming Revenue
(Clark Cty.)
Yr. '08 vs. Yr. '07 Dec. '08 vs. Dec. '07
Source: Las Vegas Convention and Visitors Authority
3030© Copyright 2009 National Council on Compensation Insurance, Inc. All Rights Reserved.
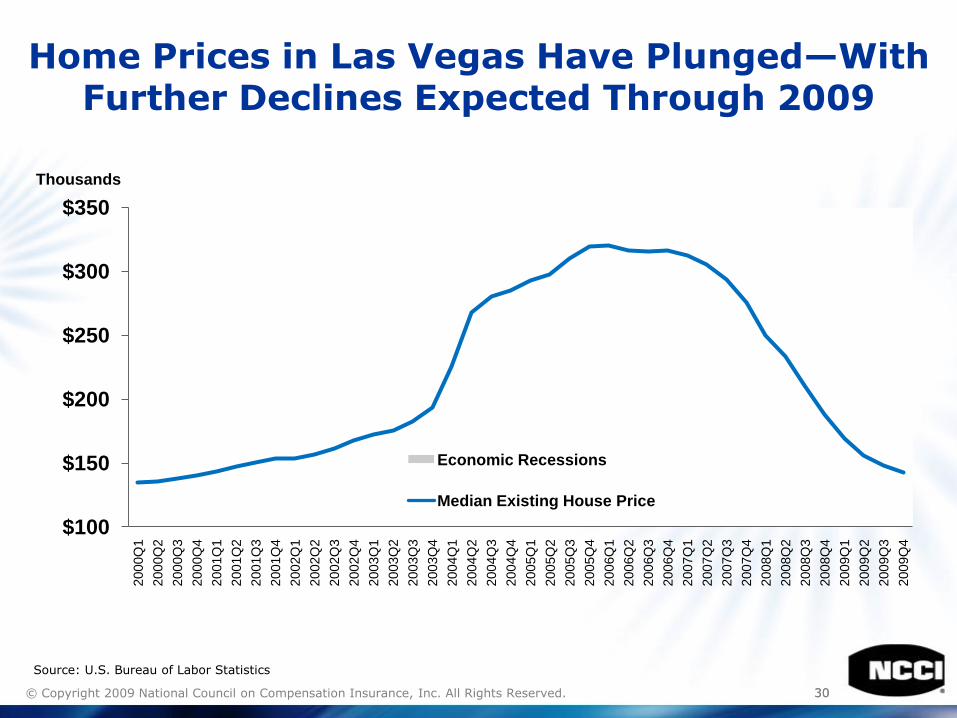
$100
$150
$200
$250
$300
$350
2000Q
1
2000Q
2
2000Q
3
2000Q
4
2001Q
1
2001Q
2
2001Q
3
2001Q
4
2002Q
1
2002Q
2
2002Q
3
2002Q
4
2003Q
1
2003Q
2
2003Q
3
2003Q
4
2004Q
1
2004Q
2
2004Q
3
2004Q
4
2005Q
1
2005Q
2
2005Q
3
2005Q
4
2006Q
1
2006Q
2
2006Q
3
2006Q
4
2007Q
1
2007Q
2
2007Q
3
2007Q
4
2008Q
1
2008Q
2
2008Q
3
2008Q
4
2009Q
1
2009Q
2
2009Q
3
2009Q
4
Thousands
Economic Recessions
Median Existing House Price
Source: U.S. Bureau of Labor Statistics
Home Prices in Las Vegas Have Plunged—With Further Declines Expected Through 2009
3131© Copyright 2009 National Council on Compensation Insurance, Inc. All Rights Reserved.
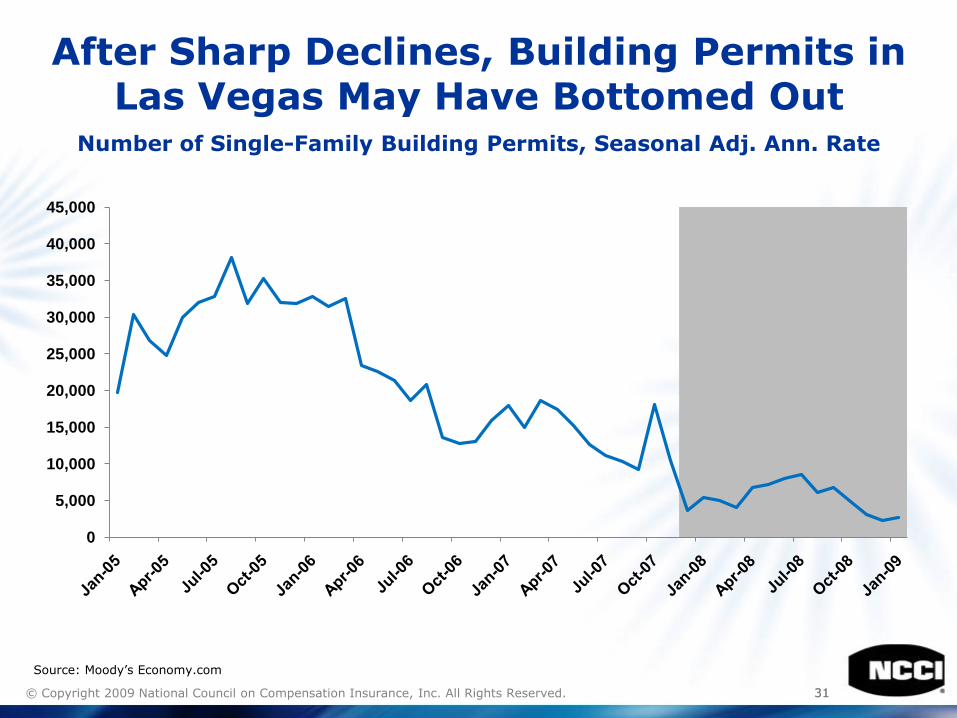
After Sharp Declines, Building Permits in Las Vegas May Have Bottomed Out
Number of Single-Family Building Permits, Seasonal Adj. Ann. Rate
0
5,000
10,000
15,000
20,000
25,000
30,000
35,000
40,000
45,000
Source: Moody’s Economy.com
3232© Copyright 2009 National Council on Compensation Insurance, Inc. All Rights Reserved.
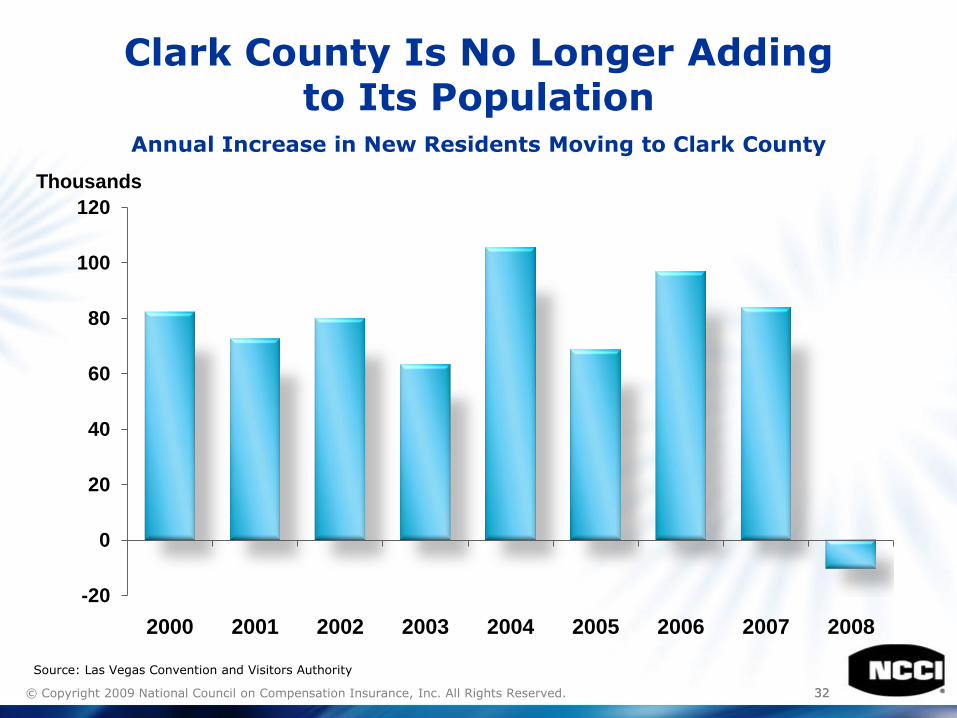
Source: Las Vegas Convention and Visitors Authority
Clark County Is No Longer Addingto Its Population
Annual Increase in New Residents Moving to Clark County
-20
0
20
40
60
80
100
120
2000 2001 2002 2003 2004 2005 2006 2007 2008
Thousands

3333© Copyright 2009 National Council on Compensation Insurance, Inc. All Rights Reserved.
-8%
-4%
0%
4%
8%
12%
16%
'91 '92 '93 '94 '95 '96 '97 '98 '99 '00 '01 '02 '03 '04 '05 '06 '07 '08 '09
Nevada employment data through January 2009.Source: U.S. Bureau of Labor Statistics
Employment in Nevada Has Declined Sharply in this Recession
Private Employment, Percent Change from Year Ago
3434© Copyright 2009 National Council on Compensation Insurance, Inc. All Rights Reserved.
3%
4%
5%
6%
7%
8%
9%
10%
'90 '91 '92 '93 '94 '95 '96 '97 '98 '99 '00 '01 '02 '03 '04 '05 '06 '07 '08 '09
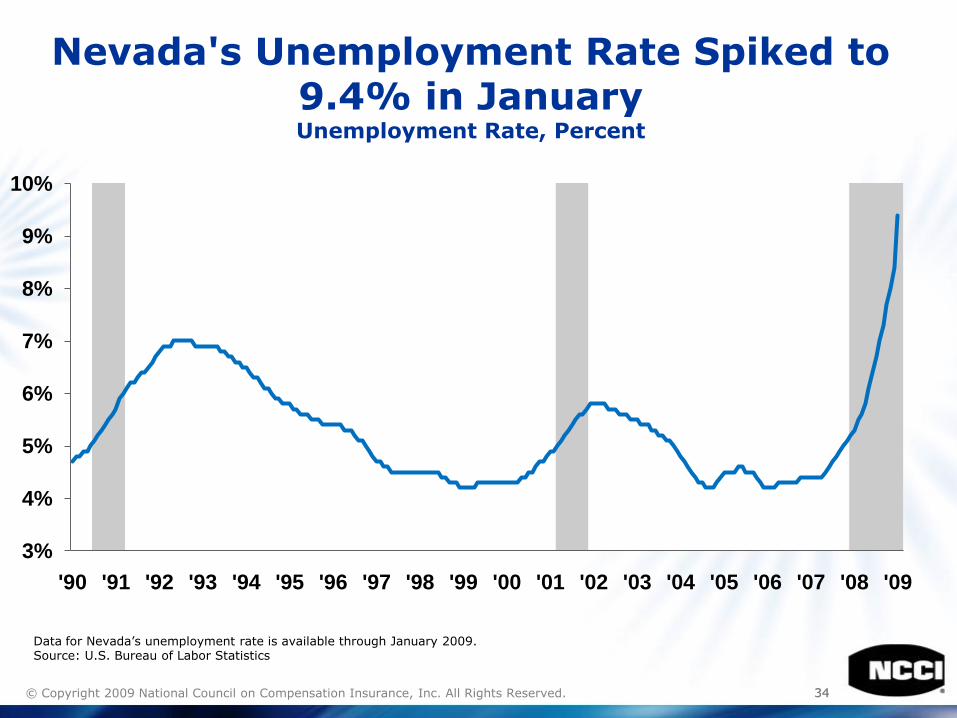
Data for Nevada’s unemployment rate is available through January 2009.Source: U.S. Bureau of Labor Statistics
Nevada's Unemployment Rate Spiked to 9.4% in JanuaryUnemployment Rate, Percent
3535© Copyright 2009 National Council on Compensation Insurance, Inc. All Rights Reserved.
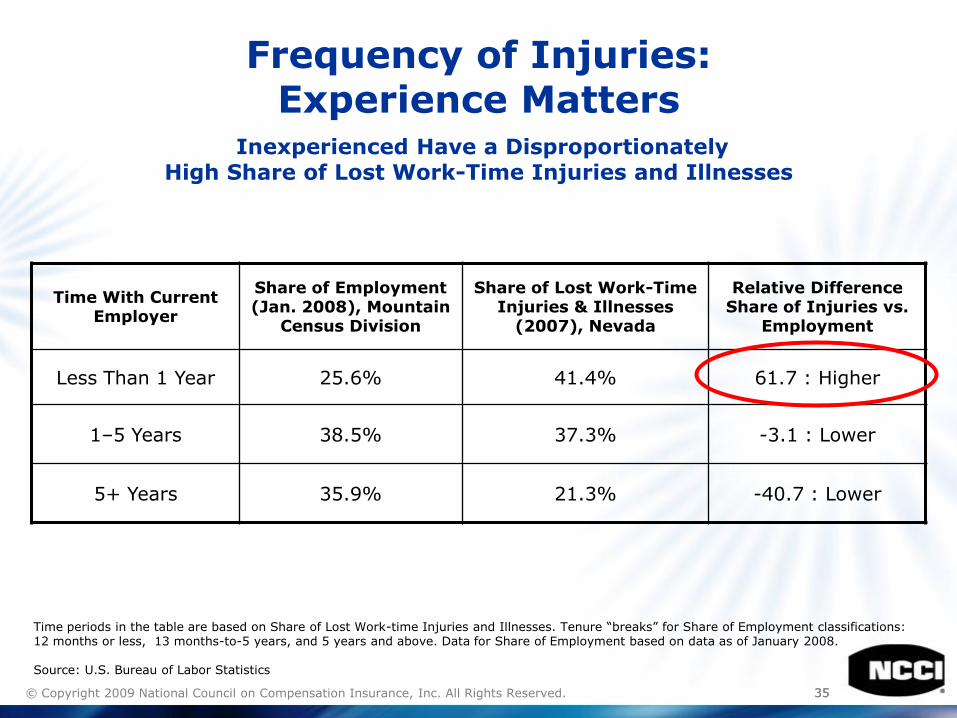
Frequency of Injuries: Experience Matters
Inexperienced Have a Disproportionately High Share of Lost Work-Time Injuries and Illnesses
Time With Current Employer
Share of Employment (Jan. 2008), Mountain
Census Division
Share of Lost Work-Time Injuries & Illnesses
(2007), Nevada
Relative Difference Share of Injuries vs.
Employment
Less Than 1 Year 25.6% 41.4% 61.7 : Higher
1–5 Years 38.5% 37.3% -3.1 : Lower
5+ Years 35.9% 21.3% -40.7 : Lower
Time periods in the table are based on Share of Lost Work-time Injuries and Illnesses. Tenure ―breaks‖ for Share of Employment classifications: 12 months or less, 13 months-to-5 years, and 5 years and above. Data for Share of Employment based on data as of January 2008.
Source: U.S. Bureau of Labor Statistics
© Copyright 2009 National Council on Compensation Insurance, Inc. All Rights Reserved.
Indemnity Claim Costs
3737© Copyright 2009 National Council on Compensation Insurance, Inc. All Rights Reserved.
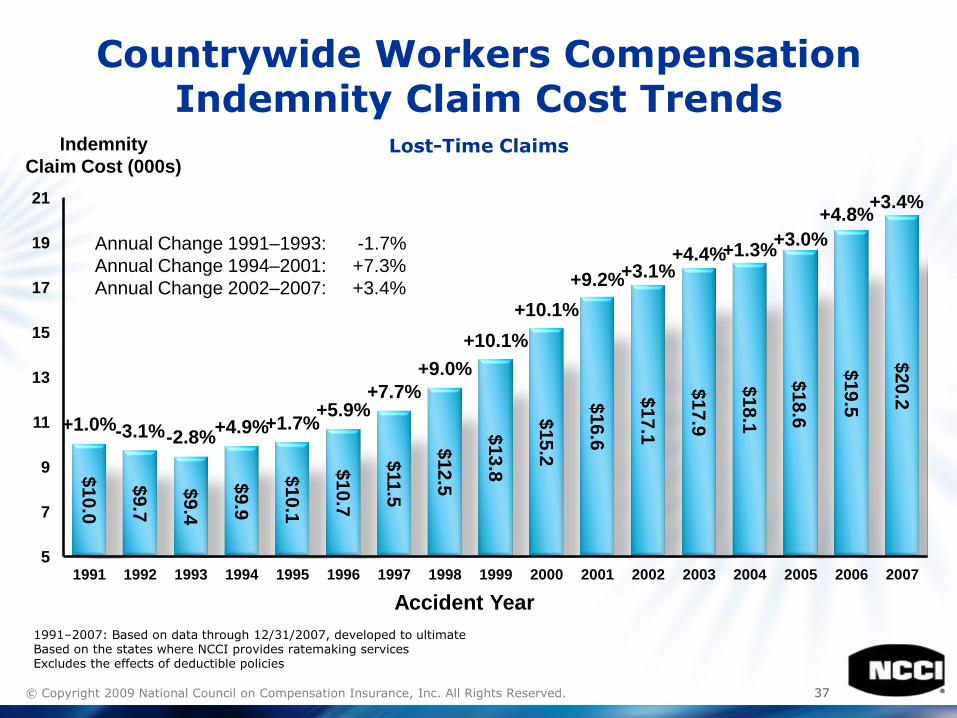
Countrywide Workers Compensation Indemnity Claim Cost Trends
Lost-Time Claims
$10.0
$9.7
$9.4
$9.9
$10.1
$10.7
$11.5
$12.5
$13
.8
$15
.2
$16.6
$17.1
$17.9
$18.1
$18.6
$19.5
$20.2
+1.0%-3.1%-2.8%+4.9%+1.7%
+5.9%+7.7%
+9.0%
+10.1%
+10.1%
+9.2%+3.1%+4.4%+1.3%
+3.0%
+4.8%+3.4%
5
7
9
11
13
15
17
19
21
1991 1992 1993 1994 1995 1996 1997 1998 1999 2000 2001 2002 2003 2004 2005 2006 2007
Indemnity
Claim Cost (000s)
Annual Change 1991–1993: -1.7%
Annual Change 1994–2001: +7.3%
Annual Change 2002–2007: +3.4%
1991–2007: Based on data through 12/31/2007, developed to ultimateBased on the states where NCCI provides ratemaking servicesExcludes the effects of deductible policies
Accident Year
3838© Copyright 2009 National Council on Compensation Insurance, Inc. All Rights Reserved.
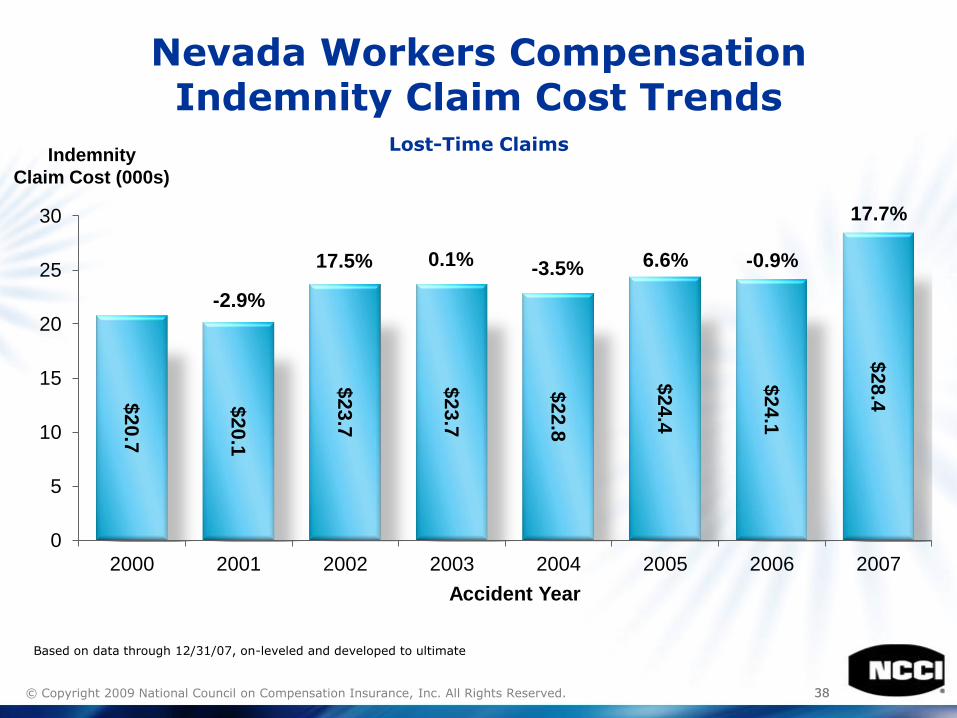
Nevada Workers CompensationIndemnity Claim Cost Trends
Lost-Time ClaimsIndemnity
Claim Cost (000s)
Based on data through 12/31/07, on-leveled and developed to ultimate
$2
0.7
$2
0.1
$2
3.7
$2
3.7
$2
2.8
$2
4.4
$2
4.1
$2
8.4
-2.9%
17.5% 0.1% -3.5% 6.6% -0.9%
17.7%
0
5
10
15
20
25
30
2000 2001 2002 2003 2004 2005 2006 2007
Accident Year
3939© Copyright 2009 National Council on Compensation Insurance, Inc. All Rights Reserved.
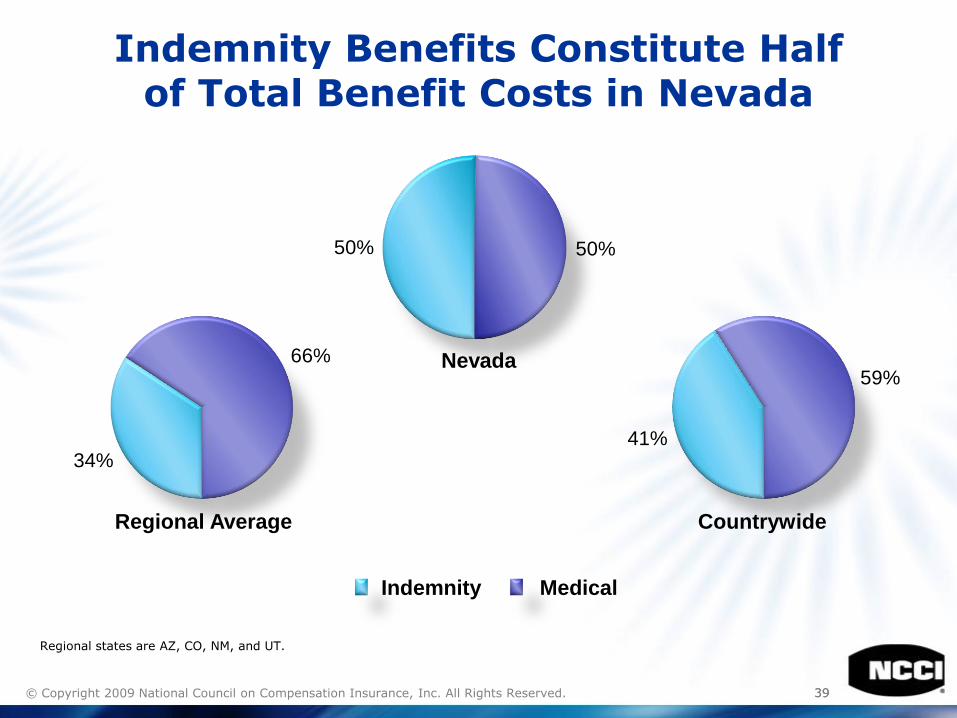
Indemnity Benefits Constitute Halfof Total Benefit Costs in Nevada
50% 50%
Indemnity Medical
34%
66%
41%
59%
Regional Average Countrywide
Nevada
Regional states are AZ, CO, NM, and UT.
4040© Copyright 2009 National Council on Compensation Insurance, Inc. All Rights Reserved.
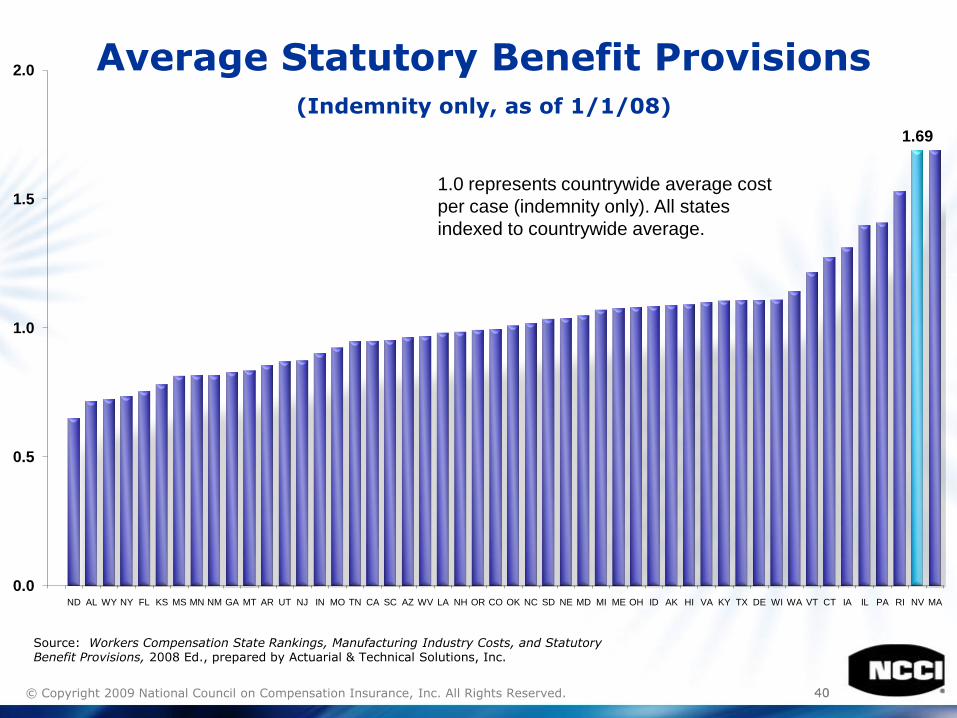
Average Statutory Benefit Provisions(Indemnity only, as of 1/1/08)
1.69
0.0
0.5
1.0
1.5
2.0
ND AL WY NY FL KS MS MN NM GA MT AR UT NJ IN MO TN CA SC AZ WV LA NH OR CO OK NC SD NE MD MI ME OH ID AK HI VA KY TX DE WI WA VT CT IA IL PA RI NV MA
Source: Workers Compensation State Rankings, Manufacturing Industry Costs, and Statutory Benefit Provisions, 2008 Ed., prepared by Actuarial & Technical Solutions, Inc.
1.0 represents countrywide average cost
per case (indemnity only). All states
indexed to countrywide average.
4141© Copyright 2009 National Council on Compensation Insurance, Inc. All Rights Reserved.
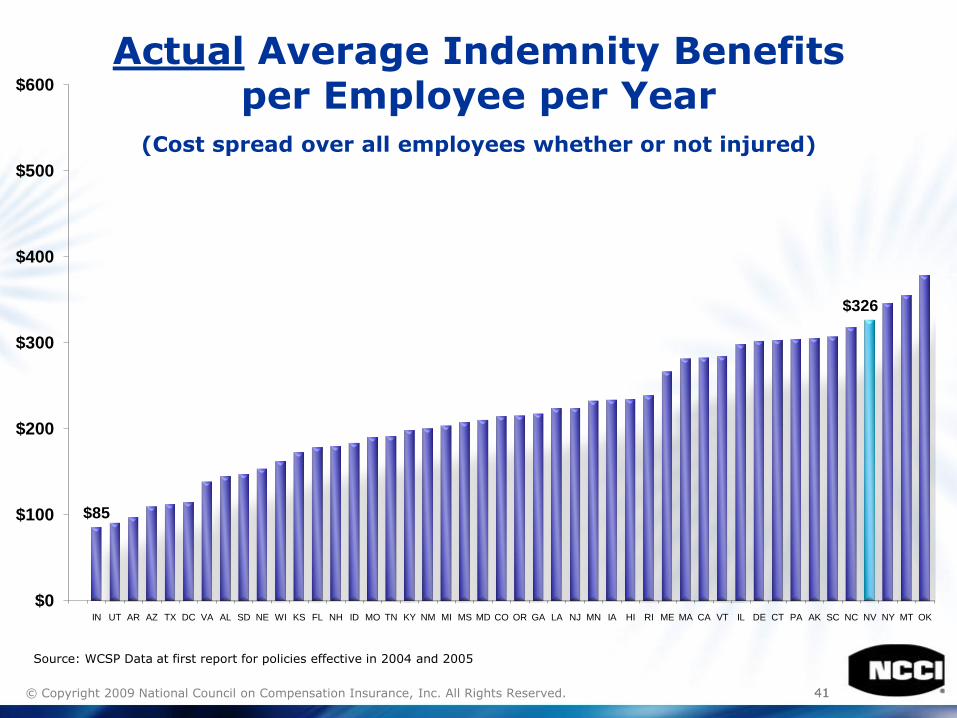
Actual Average Indemnity Benefits per Employee per Year
(Cost spread over all employees whether or not injured)
$85
$326
$0
$100
$200
$300
$400
$500
$600
IN UT AR AZ TX DC VA AL SD NE WI KS FL NH ID MO TN KY NM MI MS MD CO OR GA LA NJ MN IA HI RI ME MA CA VT IL DE CT PA AK SC NC NV NY MT OK
Source: WCSP Data at first report for policies effective in 2004 and 2005
4242© Copyright 2009 National Council on Compensation Insurance, Inc. All Rights Reserved.
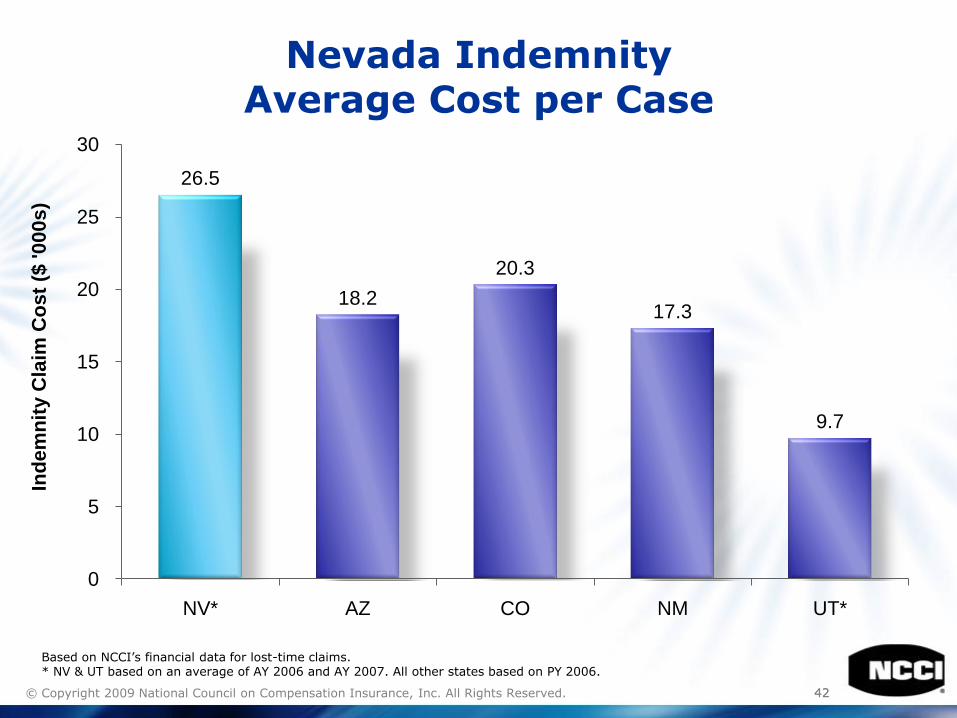
Nevada IndemnityAverage Cost per Case
26.5
18.2
20.3
17.3
9.7
0
5
10
15
20
25
30
NV* AZ CO NM UT*
Ind
em
nit
y C
laim
Co
st
($ '0
00
s)
Based on NCCI’s financial data for lost-time claims.* NV & UT based on an average of AY 2006 and AY 2007. All other states based on PY 2006.
4343© Copyright 2009 National Council on Compensation Insurance, Inc. All Rights Reserved.
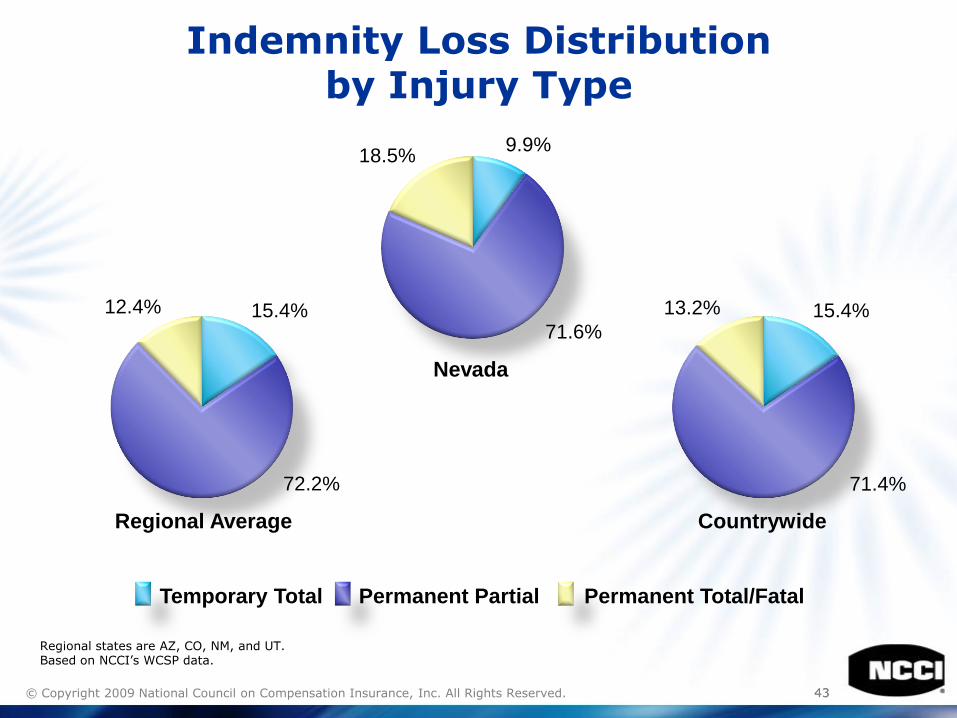
Indemnity Loss Distributionby Injury Type
Regional states are AZ, CO, NM, and UT.Based on NCCI’s WCSP data.
9.9%
71.6%
18.5%
15.4%
72.2%
12.4% 15.4%
71.4%
13.2%
Regional Average Countrywide
Nevada
Permanent Total/FatalTemporary Total Permanent Partial
© Copyright 2009 National Council on Compensation Insurance, Inc. All Rights Reserved.
Medical Claim Costs
4545© Copyright 2009 National Council on Compensation Insurance, Inc. All Rights Reserved.
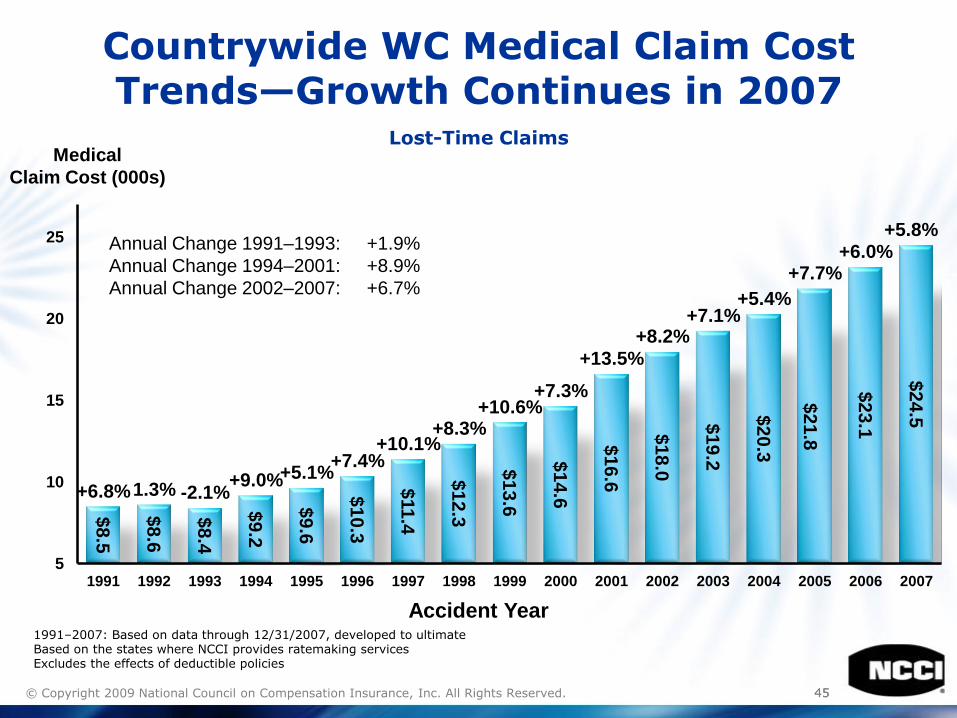
Countrywide WC Medical Claim Cost Trends—Growth Continues in 2007
Lost-Time Claims
$8
.5
$8
.6
$8
.4
$9
.2
$9
.6
$1
0.3
$11
.4
$1
2.3
$1
3.6
$1
4.6
$1
6.6
$1
8.0
$1
9.2
$2
0.3
$2
1.8
$2
3.1
$2
4.5
+6.8%1.3% -2.1%+9.0%+5.1%
+7.4%+10.1%
+8.3%+10.6%
+7.3%
+13.5%
+8.2%+7.1%
+5.4%
+7.7%+6.0%
+5.8%
5
10
15
20
25
1991 1992 1993 1994 1995 1996 1997 1998 1999 2000 2001 2002 2003 2004 2005 2006 2007
Medical
Claim Cost (000s)
1991–2007: Based on data through 12/31/2007, developed to ultimateBased on the states where NCCI provides ratemaking servicesExcludes the effects of deductible policies
Accident Year
Annual Change 1991–1993: +1.9%
Annual Change 1994–2001: +8.9%
Annual Change 2002–2007: +6.7%
4646© Copyright 2009 National Council on Compensation Insurance, Inc. All Rights Reserved.
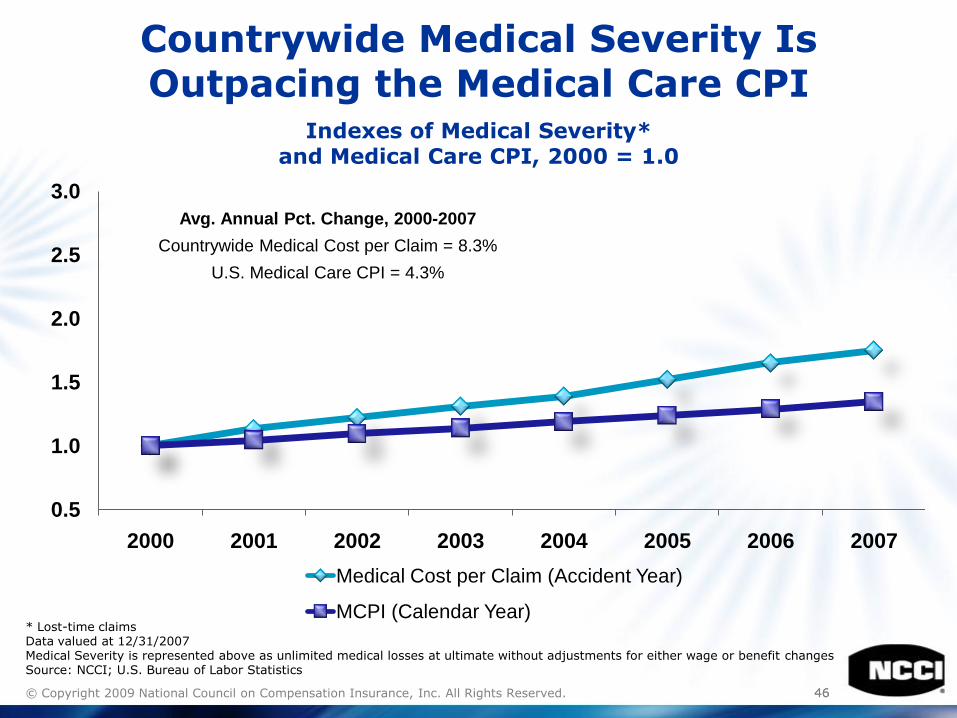
Countrywide Medical Severity Is Outpacing the Medical Care CPI
Indexes of Medical Severity* and Medical Care CPI, 2000 = 1.0
0.5
1.0
1.5
2.0
2.5
3.0
2000 2001 2002 2003 2004 2005 2006 2007
Medical Cost per Claim (Accident Year)
MCPI (Calendar Year)
Avg. Annual Pct. Change, 2000-2007
Countrywide Medical Cost per Claim = 8.3%
U.S. Medical Care CPI = 4.3%
* Lost-time claimsData valued at 12/31/2007Medical Severity is represented above as unlimited medical losses at ultimate without adjustments for either wage or benefit changesSource: NCCI; U.S. Bureau of Labor Statistics
4747© Copyright 2009 National Council on Compensation Insurance, Inc. All Rights Reserved.
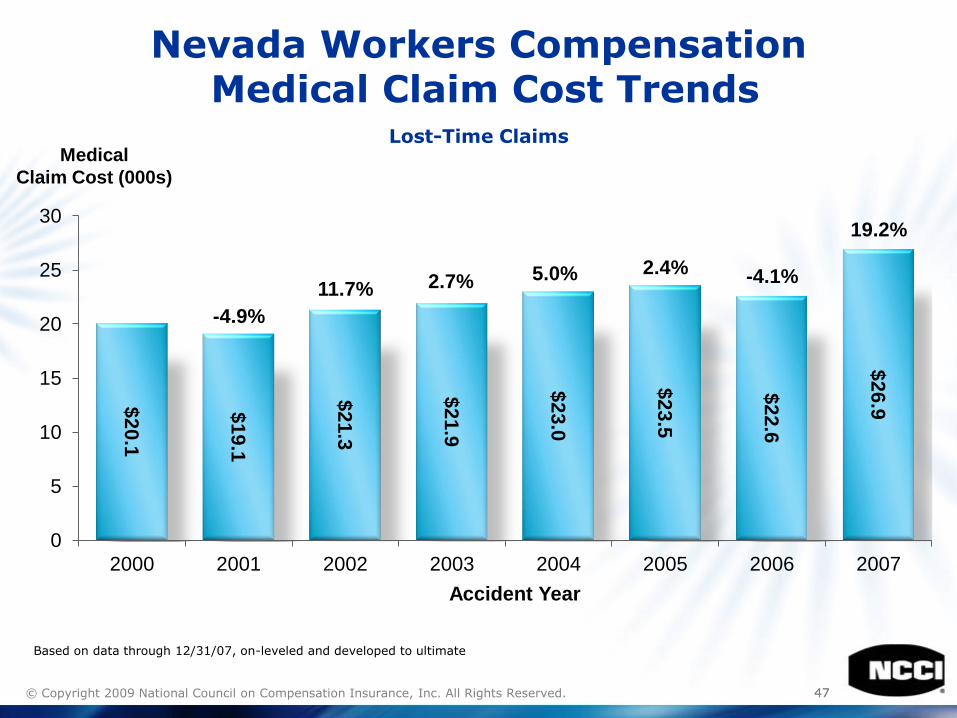
Nevada Workers Compensation Medical Claim Cost Trends
Lost-Time ClaimsMedical
Claim Cost (000s)
Based on data through 12/31/07, on-leveled and developed to ultimate
$2
0.1
$1
9.1
$2
1.3
$2
1.9
$2
3.0
$2
3.5
$2
2.6
$2
6.9
-4.9%
11.7% 2.7% 5.0% 2.4% -4.1%
19.2%
0
5
10
15
20
25
30
2000 2001 2002 2003 2004 2005 2006 2007
Accident Year
4848© Copyright 2009 National Council on Compensation Insurance, Inc. All Rights Reserved.
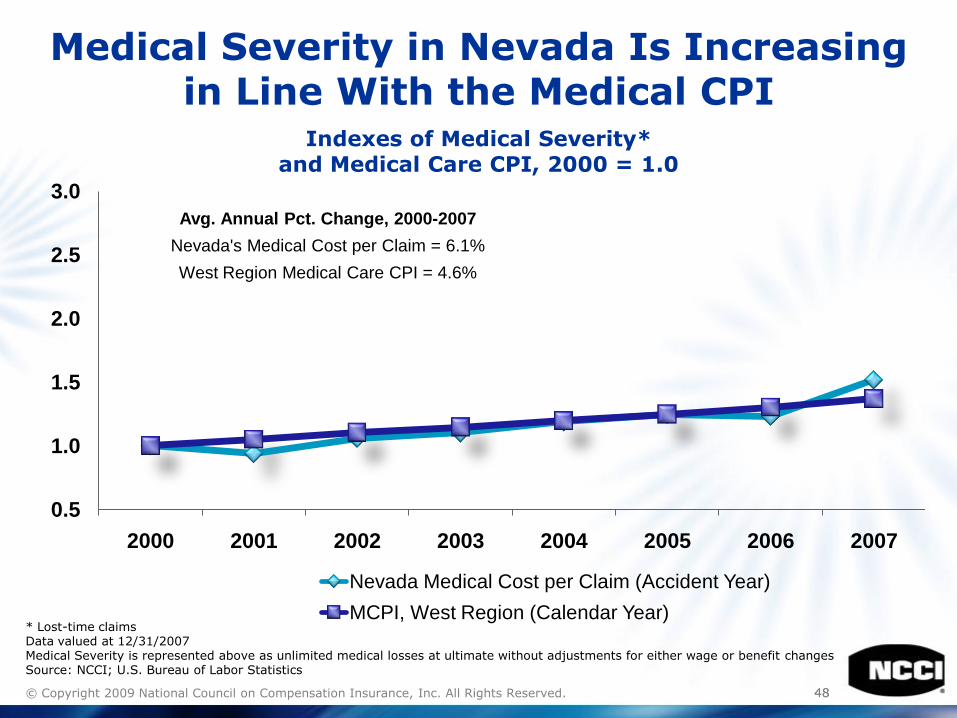
Medical Severity in Nevada Is Increasing in Line With the Medical CPI
Indexes of Medical Severity*and Medical Care CPI, 2000 = 1.0
0.5
1.0
1.5
2.0
2.5
3.0
2000 2001 2002 2003 2004 2005 2006 2007
Nevada Medical Cost per Claim (Accident Year)
MCPI, West Region (Calendar Year)
Avg. Annual Pct. Change, 2000-2007
Nevada's Medical Cost per Claim = 6.1%
West Region Medical Care CPI = 4.6%
* Lost-time claimsData valued at 12/31/2007Medical Severity is represented above as unlimited medical losses at ultimate without adjustments for either wage or benefit changesSource: NCCI; U.S. Bureau of Labor Statistics
4949© Copyright 2009 National Council on Compensation Insurance, Inc. All Rights Reserved.
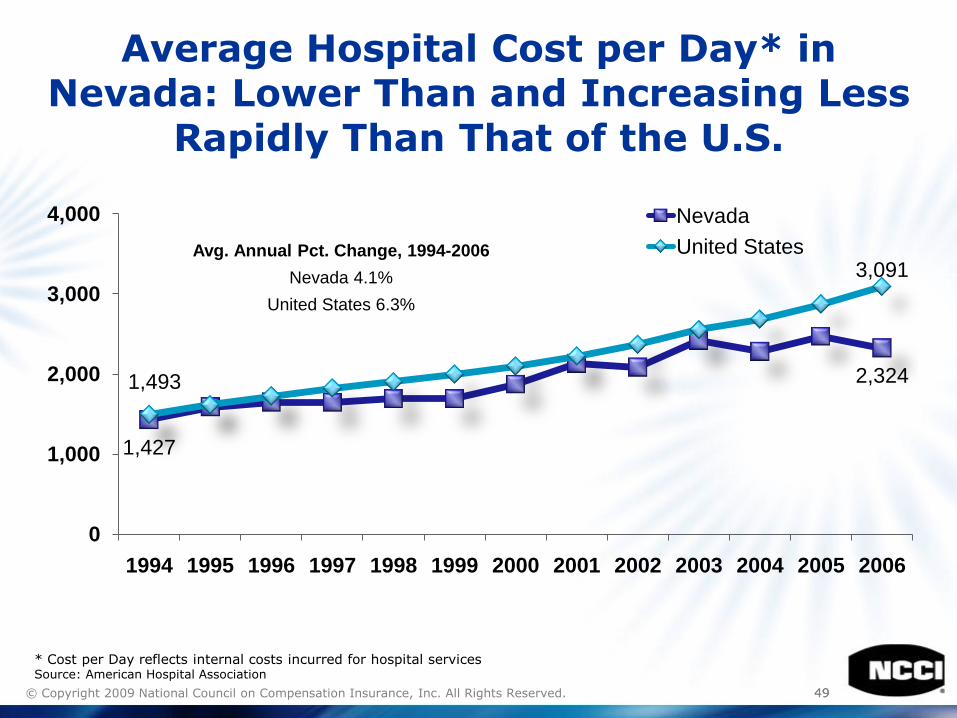
Average Hospital Cost per Day* in Nevada: Lower Than and Increasing Less
Rapidly Than That of the U.S.
1,427
2,3241,493
0
1,000
2,000
3,000
4,000
1994 1995 1996 1997 1998 1999 2000 2001 2002 2003 2004 2005 2006
Nevada
United StatesAvg. Annual Pct. Change, 1994-2006
Nevada 4.1%
United States 6.3%
* Cost per Day reflects internal costs incurred for hospital servicesSource: American Hospital Association
3,091
5050© Copyright 2009 National Council on Compensation Insurance, Inc. All Rights Reserved.
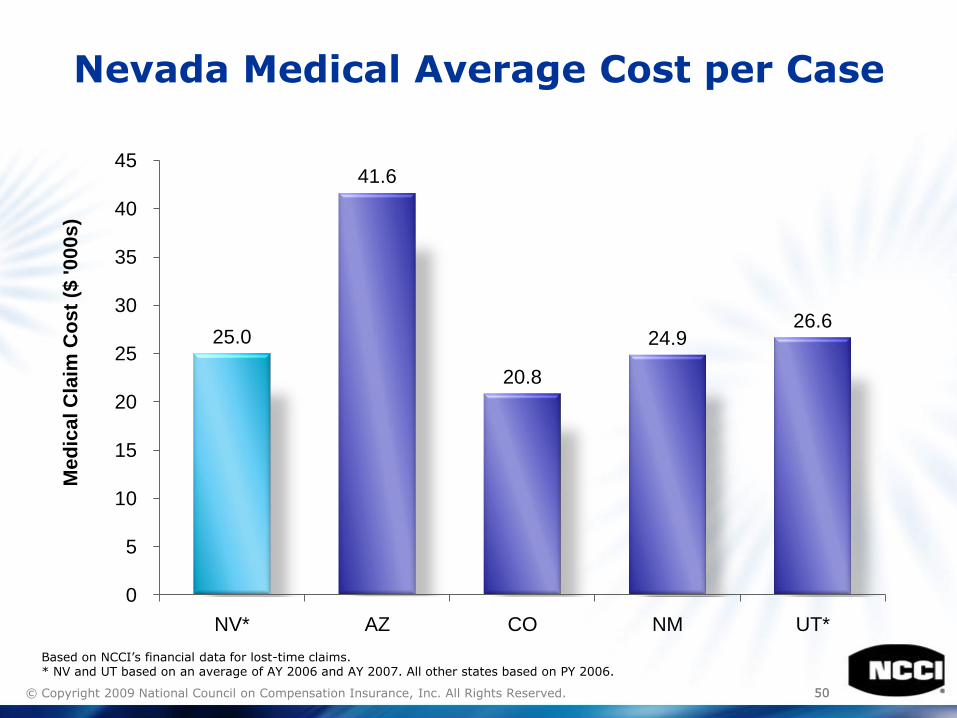
Nevada Medical Average Cost per Case
25.0
41.6
20.8
24.926.6
0
5
10
15
20
25
30
35
40
45
NV* AZ CO NM UT*
Me
dic
al C
laim
Co
st
($ '0
00
s)
Based on NCCI’s financial data for lost-time claims.* NV and UT based on an average of AY 2006 and AY 2007. All other states based on PY 2006.
5151© Copyright 2009 National Council on Compensation Insurance, Inc. All Rights Reserved.
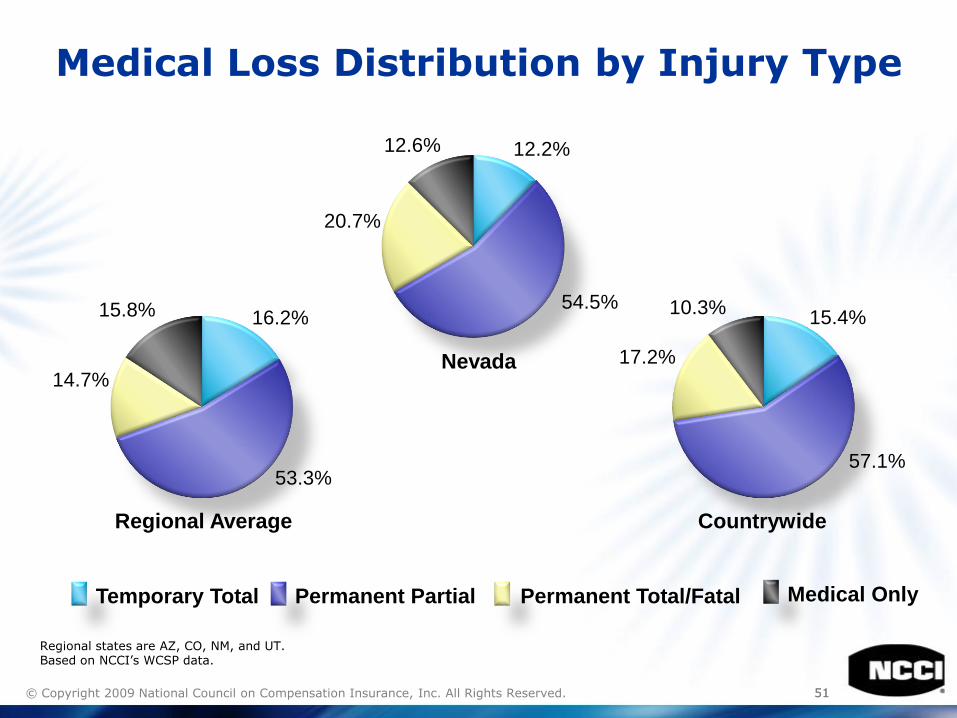
Medical Loss Distribution by Injury Type
12.2%
54.5%
20.7%
12.6%
16.2%
53.3%
14.7%
15.8%
Nevada
Medical OnlyPermanent Total/FatalTemporary Total Permanent Partial
15.4%
57.1%
17.2%
10.3%
Regional Average Countrywide
Regional states are AZ, CO, NM, and UT.Based on NCCI’s WCSP data.
© Copyright 2009 National Council on Compensation Insurance, Inc. All Rights Reserved.
Permanent Partial Claims
5353© Copyright 2009 National Council on Compensation Insurance, Inc. All Rights Reserved.
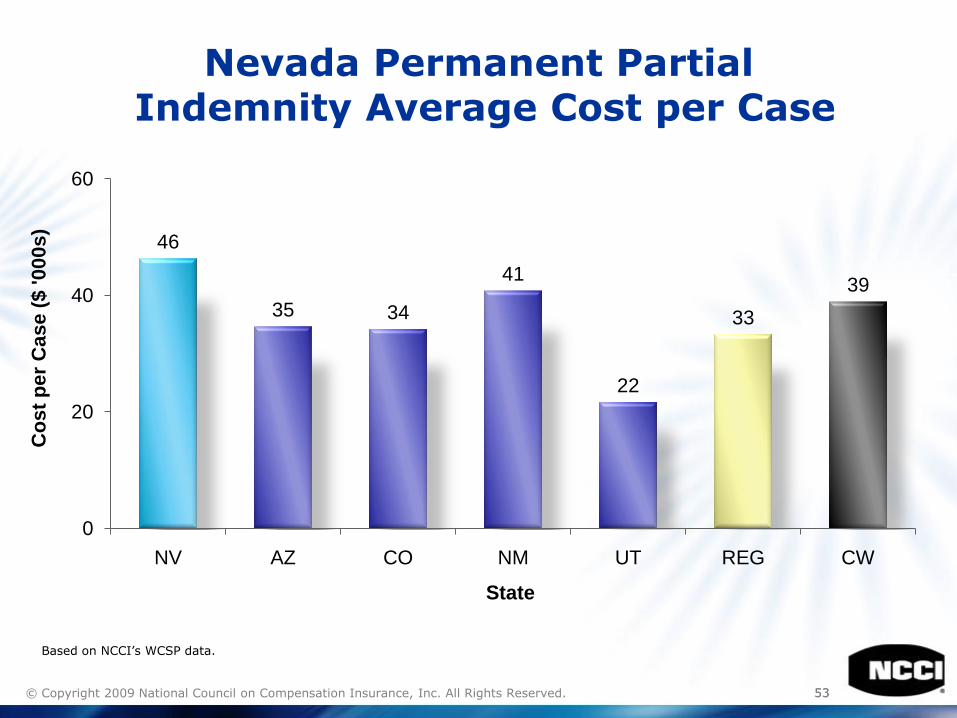
Nevada Permanent Partial Indemnity Average Cost per Case
46
35 34
41
22
33
39
0
20
40
60
NV AZ CO NM UT REG CW
Co
st
pe
r C
as
e (
$ '0
00
s)
State
Based on NCCI’s WCSP data.
5454© Copyright 2009 National Council on Compensation Insurance, Inc. All Rights Reserved.
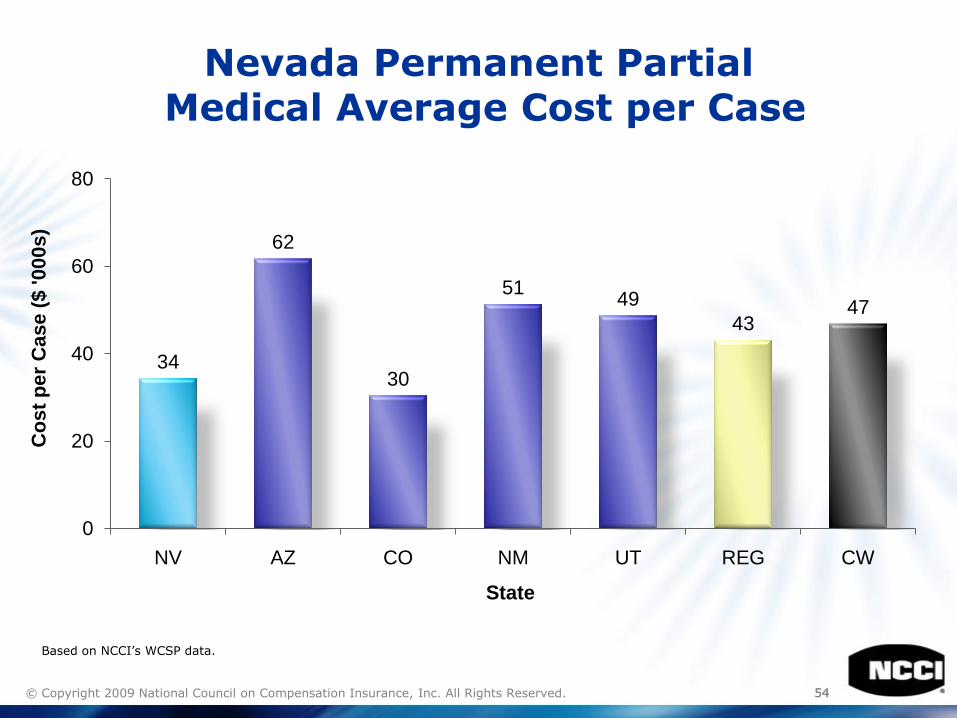
Nevada Permanent Partial Medical Average Cost per Case
34
62
30
5149
4347
0
20
40
60
80
NV AZ CO NM UT REG CW
Co
st
pe
r C
as
e (
$ '0
00
s)
State
Based on NCCI’s WCSP data.
5555© Copyright 2009 National Council on Compensation Insurance, Inc. All Rights Reserved.
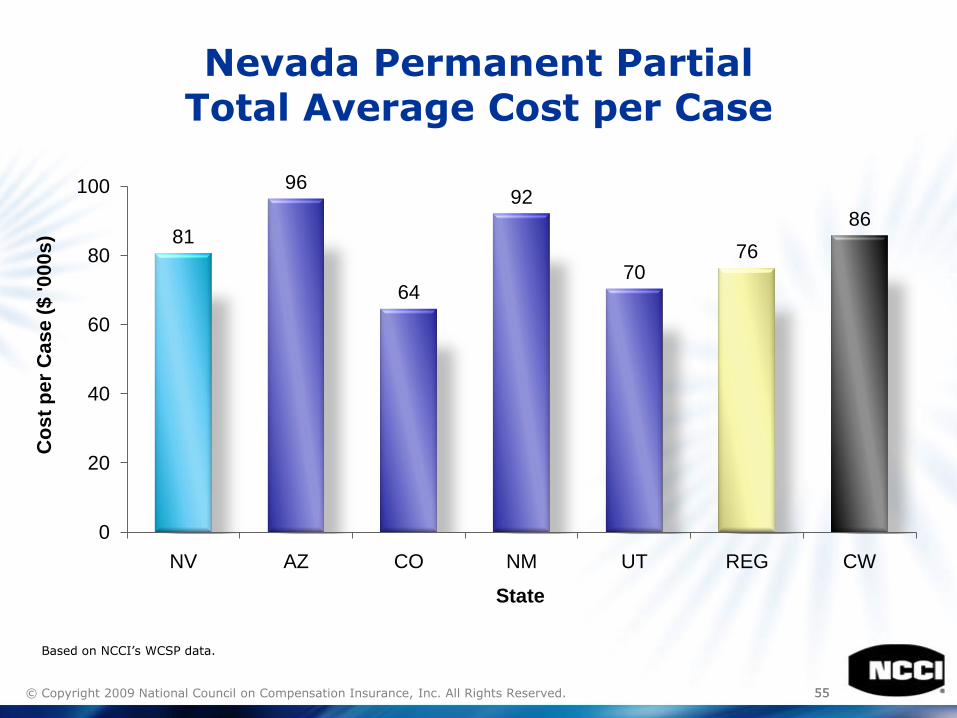
Nevada Permanent PartialTotal Average Cost per Case
81
96
64
92
7076
86
0
20
40
60
80
100
NV AZ CO NM UT REG CW
Co
st
pe
r C
as
e (
$ '0
00
s)
State
Based on NCCI’s WCSP data.
5656© Copyright 2009 National Council on Compensation Insurance, Inc. All Rights Reserved.
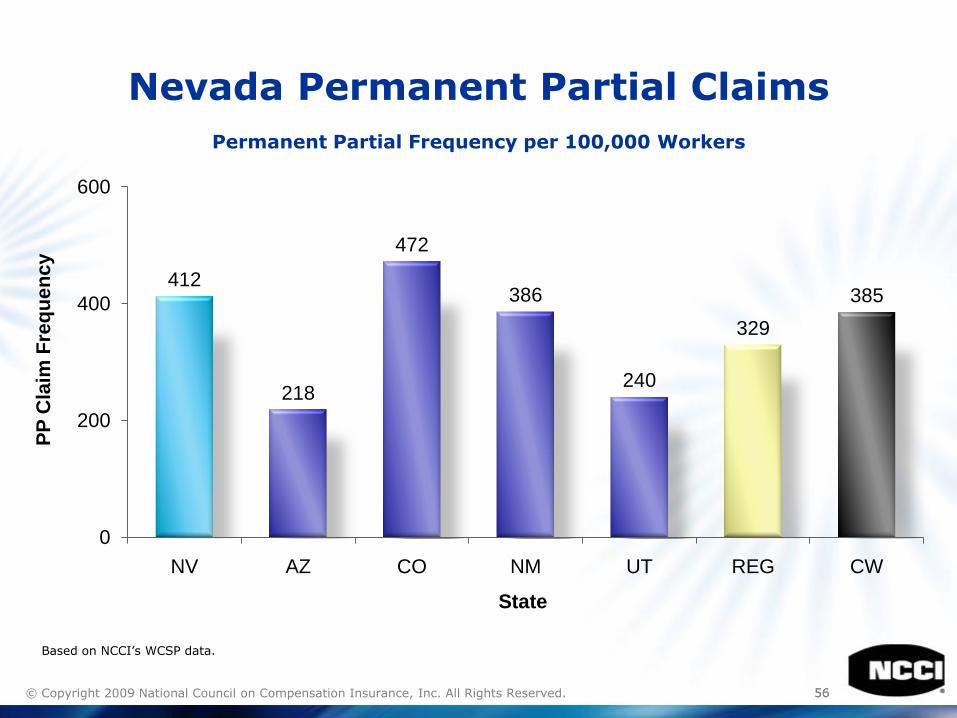
Nevada Permanent Partial Claims
Permanent Partial Frequency per 100,000 Workers
412
218
472
386
240
329
385
0
200
400
600
NV AZ CO NM UT REG CW
PP
Cla
im F
req
ue
nc
y
State
Based on NCCI’s WCSP data.
5757© Copyright 2009 National Council on Compensation Insurance, Inc. All Rights Reserved.
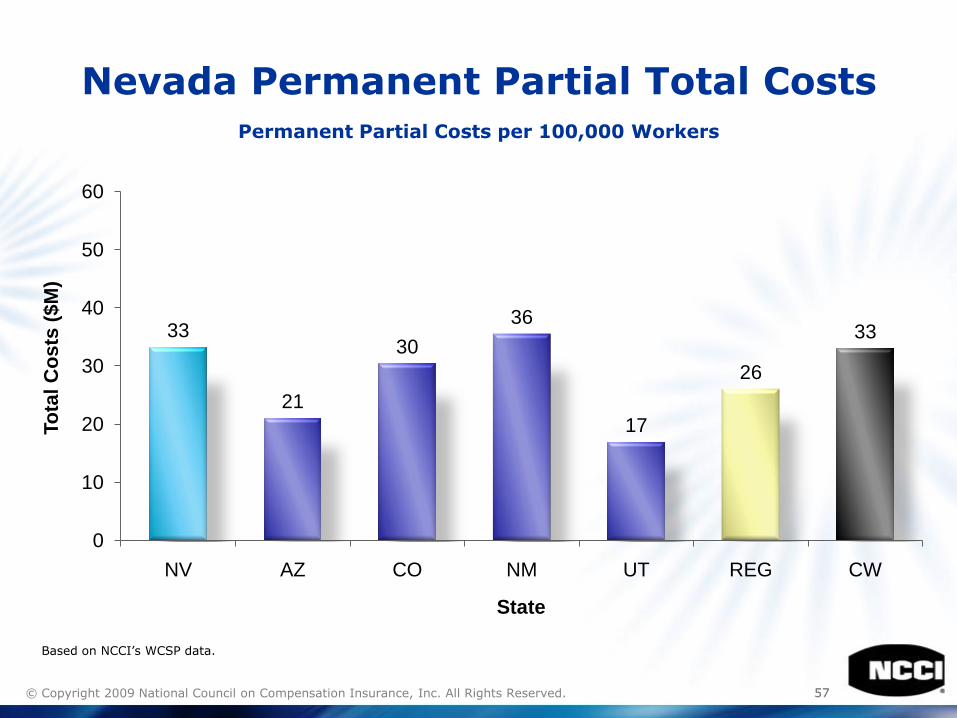
Nevada Permanent Partial Total CostsPermanent Partial Costs per 100,000 Workers
33
21
30
36
17
26
33
0
10
20
30
40
50
60
NV AZ CO NM UT REG CW
To
tal
Co
sts
($
M)
State
Based on NCCI’s WCSP data.
© Copyright 2009 National Council on Compensation Insurance, Inc. All Rights Reserved.
Impact of Recessions on Workers Compensation
5959© Copyright 2009 National Council on Compensation Insurance, Inc. All Rights Reserved.
• Exposure
• Claim Frequency
• Indemnity and Medical Severity
Impact of Recessions on Workers Compensation
© Copyright 2009 National Council on Compensation Insurance, Inc. All Rights Reserved.
Length and Severity of Past Recessions
6161© Copyright 2009 National Council on Compensation Insurance, Inc. All Rights Reserved.
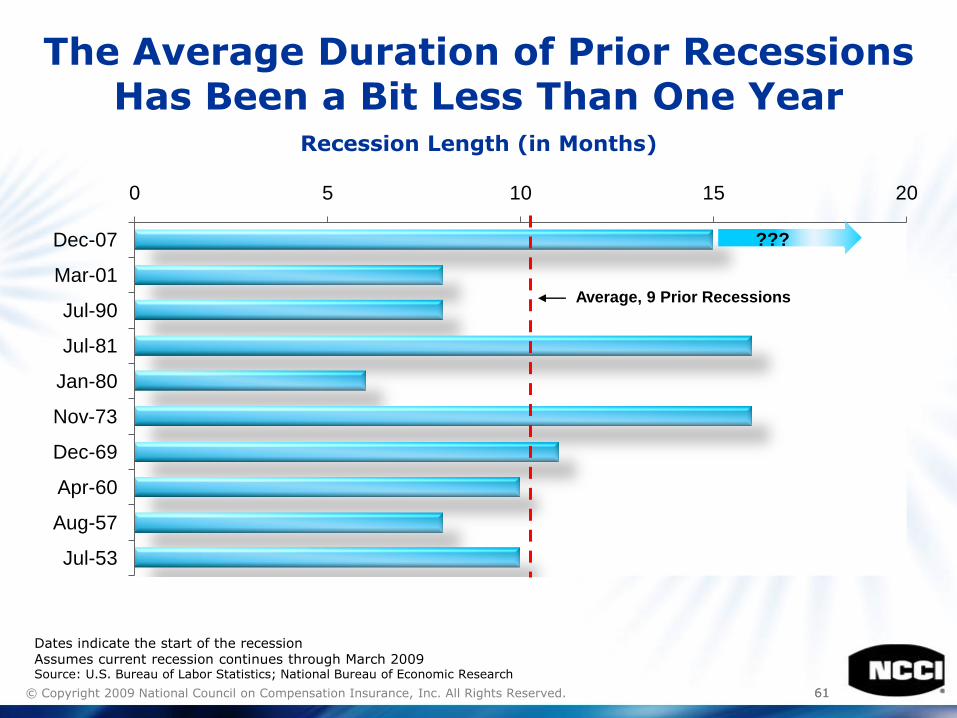
The Average Duration of Prior Recessions Has Been a Bit Less Than One Year
Recession Length (in Months)
0 5 10 15 20
Jul-53
Aug-57
Apr-60
Dec-69
Nov-73
Jan-80
Jul-81
Jul-90
Mar-01
Dec-07
Dates indicate the start of the recessionAssumes current recession continues through March 2009Source: U.S. Bureau of Labor Statistics; National Bureau of Economic Research
Average, 9 Prior Recessions
???
6262© Copyright 2009 National Council on Compensation Insurance, Inc. All Rights Reserved.
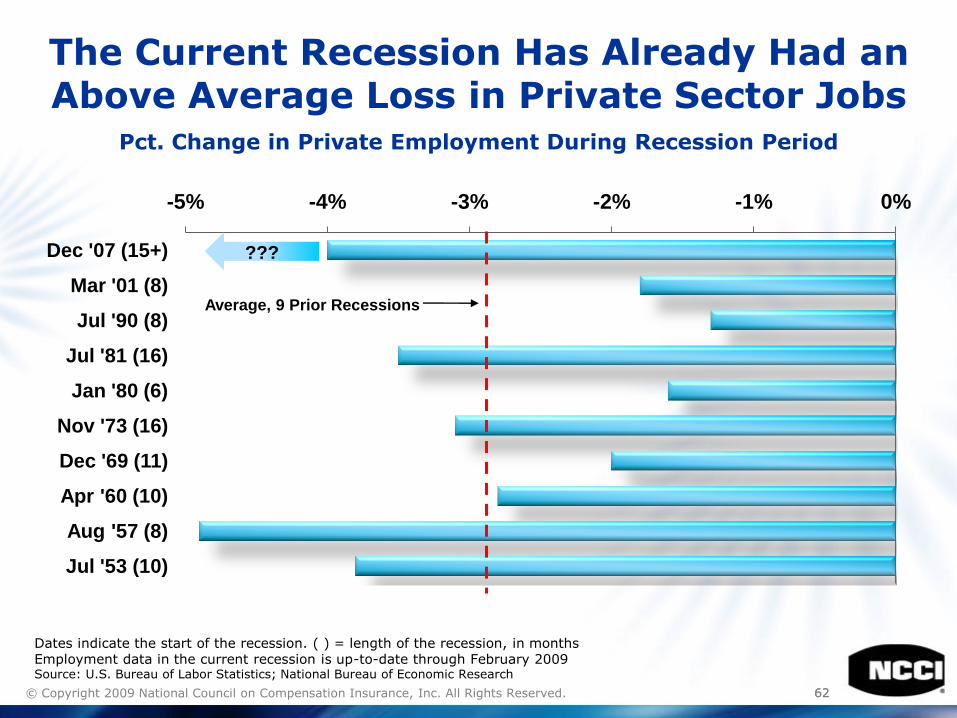
The Current Recession Has Already Had an Above Average Loss in Private Sector Jobs
Pct. Change in Private Employment During Recession Period
-5% -4% -3% -2% -1% 0%
Jul '53 (10)
Aug '57 (8)
Apr '60 (10)
Dec '69 (11)
Nov '73 (16)
Jan '80 (6)
Jul '81 (16)
Jul '90 (8)
Mar '01 (8)
Dec '07 (15+)
Average, 9 Prior Recessions
???
Dates indicate the start of the recession. ( ) = length of the recession, in monthsEmployment data in the current recession is up-to-date through February 2009Source: U.S. Bureau of Labor Statistics; National Bureau of Economic Research
© Copyright 2009 National Council on Compensation Insurance, Inc. All Rights Reserved.
Impact of Recessionson Exposure
6464© Copyright 2009 National Council on Compensation Insurance, Inc. All Rights Reserved.
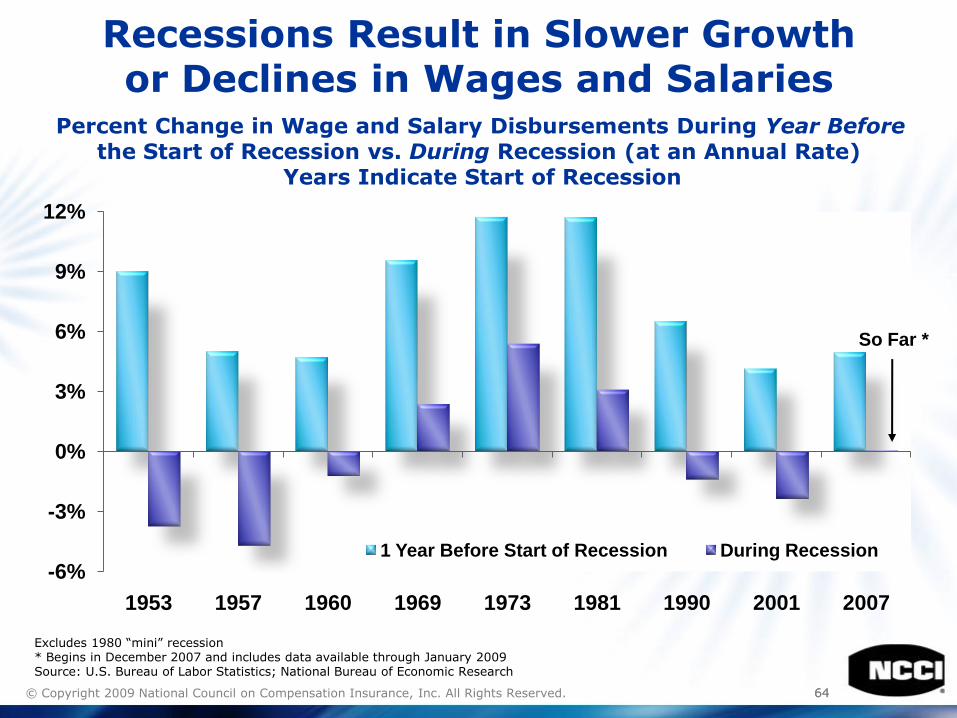
Excludes 1980 ―mini‖ recession* Begins in December 2007 and includes data available through January 2009Source: U.S. Bureau of Labor Statistics; National Bureau of Economic Research
Recessions Result in Slower Growth or Declines in Wages and Salaries
Percent Change in Wage and Salary Disbursements During Year Before the Start of Recession vs. During Recession (at an Annual Rate)
Years Indicate Start of Recession
-6%
-3%
0%
3%
6%
9%
12%
1953 1957 1960 1969 1973 1981 1990 2001 2007
1 Year Before Start of Recession During Recession
So Far *
6565© Copyright 2009 National Council on Compensation Insurance, Inc. All Rights Reserved.
• Changes in employment
• Changes in wages
Changes in Exposure (Payroll) During Business Cycles Reflect . . .
6666© Copyright 2009 National Council on Compensation Insurance, Inc. All Rights Reserved.
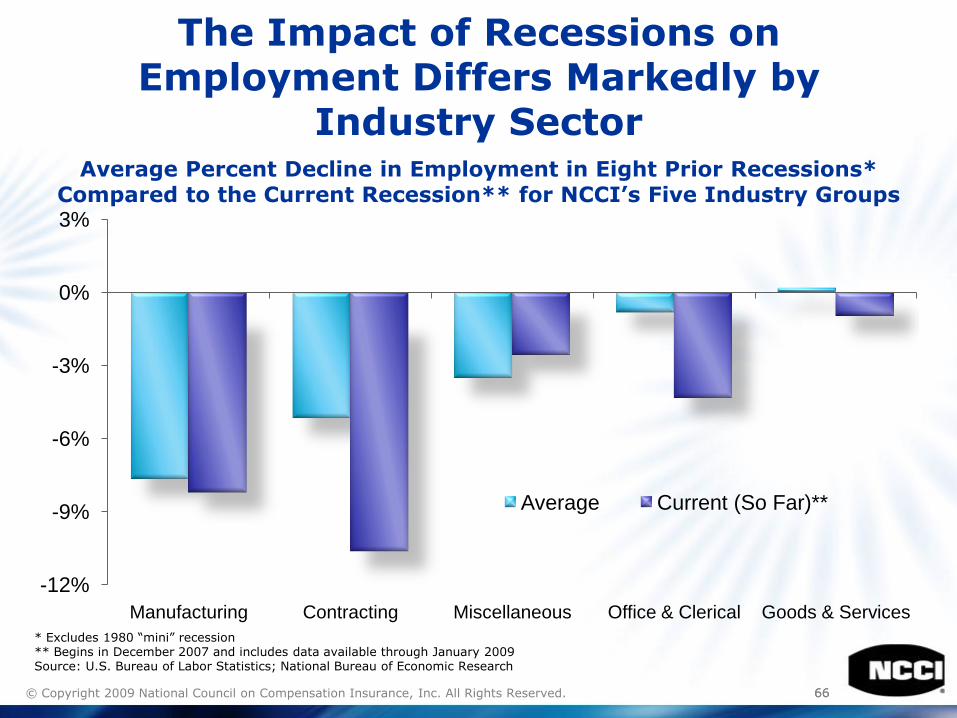
The Impact of Recessions on Employment Differs Markedly by
Industry SectorAverage Percent Decline in Employment in Eight Prior Recessions*
Compared to the Current Recession** for NCCI’s Five Industry Groups
-12%
-9%
-6%
-3%
0%
3%
Manufacturing Contracting Miscellaneous Office & Clerical Goods & Services
Average Current (So Far)**
* Excludes 1980 ―mini‖ recession** Begins in December 2007 and includes data available through January 2009Source: U.S. Bureau of Labor Statistics; National Bureau of Economic Research
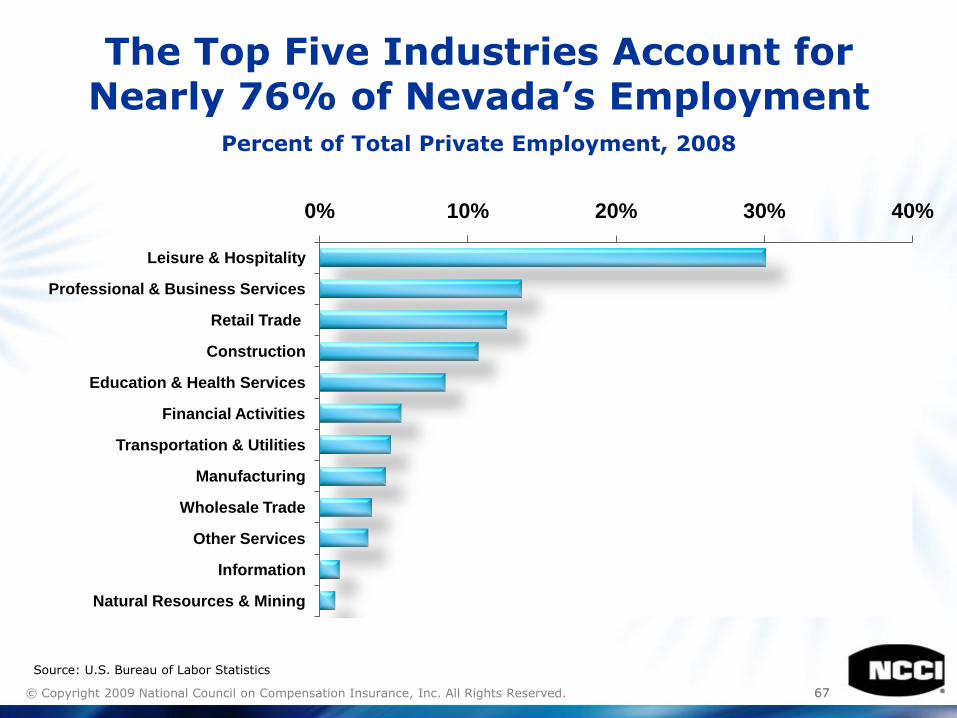
6767© Copyright 2009 National Council on Compensation Insurance, Inc. All Rights Reserved.
The Top Five Industries Account for Nearly 76% of Nevada’s Employment
Percent of Total Private Employment, 2008
0% 10% 20% 30% 40%
Leisure & Hospitality
Professional & Business Services
Retail Trade
Construction
Education & Health Services
Financial Activities
Transportation & Utilities
Manufacturing
Wholesale Trade
Other Services
Information
Natural Resources & Mining
Source: U.S. Bureau of Labor Statistics
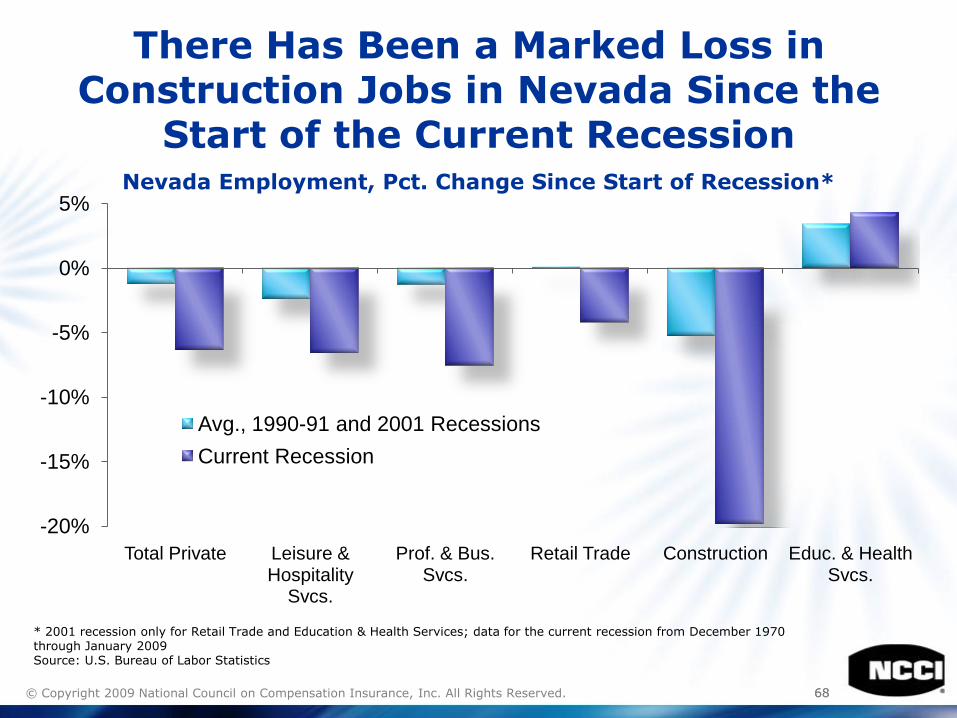
6868© Copyright 2009 National Council on Compensation Insurance, Inc. All Rights Reserved.
There Has Been a Marked Loss in Construction Jobs in Nevada Since the
Start of the Current RecessionNevada Employment, Pct. Change Since Start of Recession*
-20%
-15%
-10%
-5%
0%
5%
Total Private Leisure & Hospitality
Svcs.
Prof. & Bus. Svcs.
Retail Trade Construction Educ. & Health Svcs.
Avg., 1990-91 and 2001 Recessions
Current Recession
* 2001 recession only for Retail Trade and Education & Health Services; data for the current recession from December 1970 through January 2009Source: U.S. Bureau of Labor Statistics
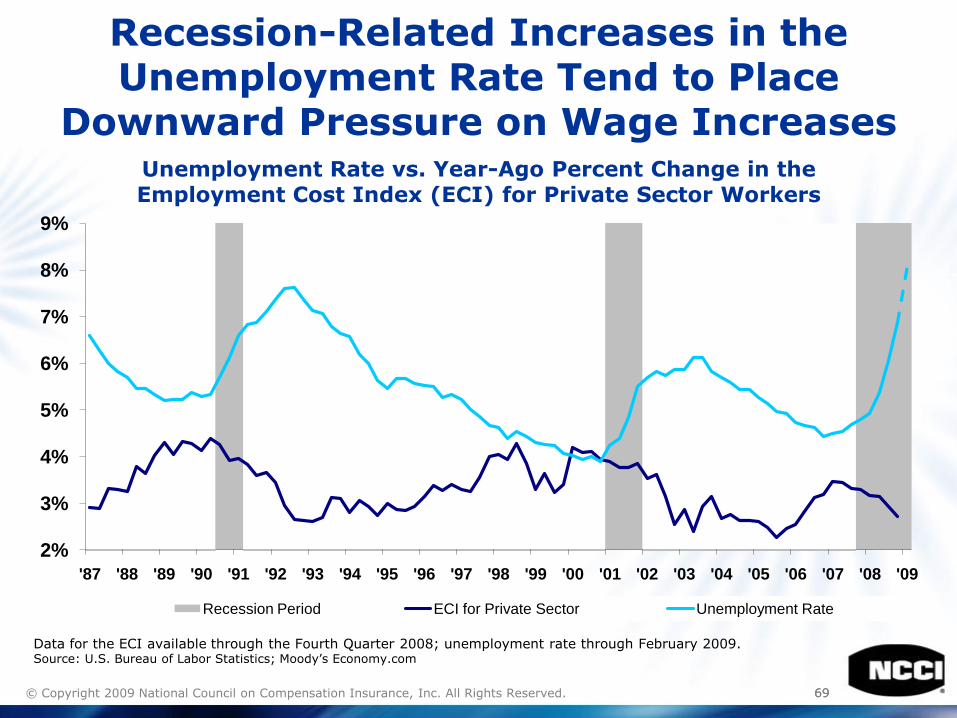
6969© Copyright 2009 National Council on Compensation Insurance, Inc. All Rights Reserved.
Recession-Related Increases in the Unemployment Rate Tend to Place
Downward Pressure on Wage IncreasesUnemployment Rate vs. Year-Ago Percent Change in the Employment Cost Index (ECI) for Private Sector Workers
2%
3%
4%
5%
6%
7%
8%
9%
'87 '88 '89 '90 '91 '92 '93 '94 '95 '96 '97 '98 '99 '00 '01 '02 '03 '04 '05 '06 '07 '08 '09
Recession Period ECI for Private Sector Unemployment Rate
Data for the ECI available through the Fourth Quarter 2008; unemployment rate through February 2009.Source: U.S. Bureau of Labor Statistics; Moody’s Economy.com

© Copyright 2009 National Council on Compensation Insurance, Inc. All Rights Reserved.
Impact of Recessionson Claim Frequency
7171© Copyright 2009 National Council on Compensation Insurance, Inc. All Rights Reserved.
Overview of Just-Completed NCCI Research
• Uses BLS data on injury and illness incidence rates (―BLS frequency,‖ for short) for manufacturing
• Analysis based on growth rate of frequency
• Uses statistical modeling to determine the long-term trend in frequency growth and how frequency growth varies over the business cycle
• Full report will be published later this year
7272© Copyright 2009 National Council on Compensation Insurance, Inc. All Rights Reserved.
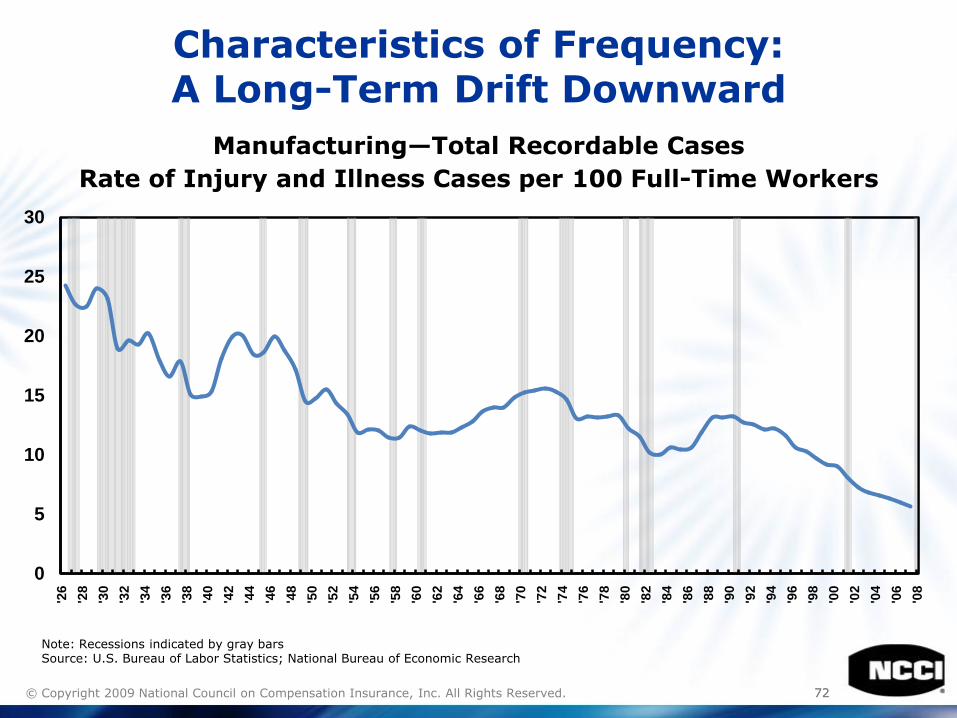
Characteristics of Frequency:A Long-Term Drift Downward
Manufacturing—Total Recordable Cases
Rate of Injury and Illness Cases per 100 Full-Time Workers
0
5
10
15
20
25
30
'26
'28
'30
'32
'34
'36
'38
'40
'42
'44
'46
'48
'50
'52
'54
'56
'58
'60
'62
'64
'66
'68
'70
'72
'74
'76
'78
'80
'82
'84
'86
'88
'90
'92
'94
'96
'98
'00
'02
'04
'06
'08
Note: Recessions indicated by gray barsSource: U.S. Bureau of Labor Statistics; National Bureau of Economic Research
7373© Copyright 2009 National Council on Compensation Insurance, Inc. All Rights Reserved.
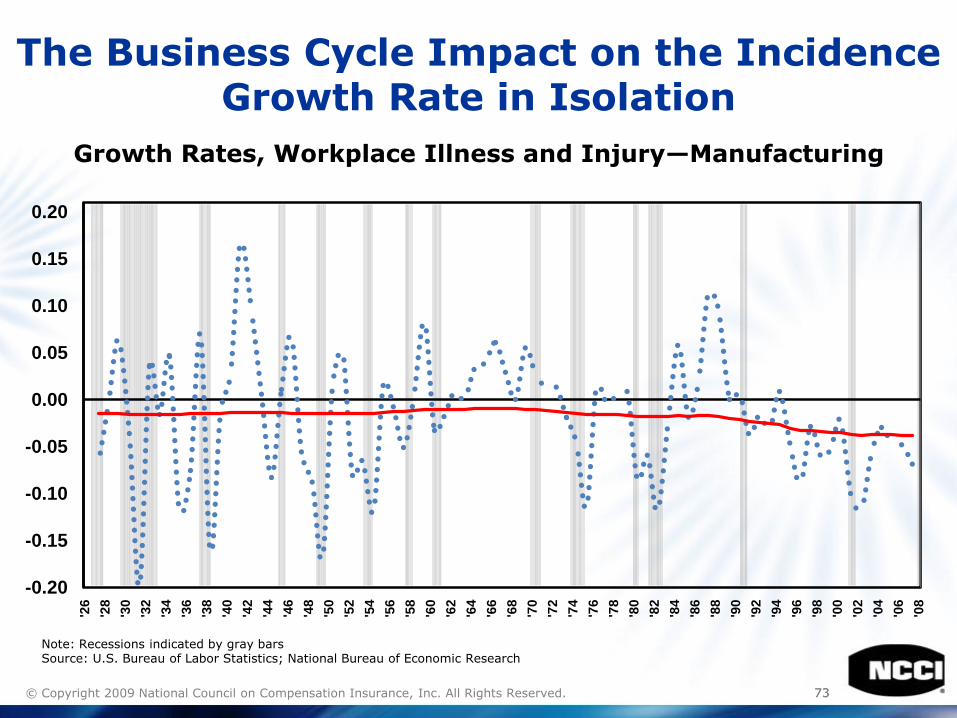
The Business Cycle Impact on the Incidence Growth Rate in Isolation
Growth Rates, Workplace Illness and Injury—Manufacturing
-0.20
-0.15
-0.10
-0.05
0.00
0.05
0.10
0.15
0.20
'26
'28
'30
'32
'34
'36
'38
'40
'42
'44
'46
'48
'50
'52
'54
'56
'58
'60
'62
'64
'66
'68
'70
'72
'74
'76
'78
'80
'82
'84
'86
'88
'90
'92
'94
'96
'98
'00
'02
'04
'06
'08
Note: Recessions indicated by gray barsSource: U.S. Bureau of Labor Statistics; National Bureau of Economic Research
7474
Explaining the Business Cycle Behavior of BLS Frequency Growth
• The observed business cycle behavior of frequency growth is consistent with the ―experienced worker‖ effect:
− In recessions, fewer new jobs are being created, which reduces the fraction of inexperienced workers on the payroll, thus reducing frequency growth
− In contrast, in economic expansions, when new jobs are created at a high rate, many inexperienced workers are added to the payroll, which increases frequency growth
• Nevertheless, there continues to be anecdotal reports of ―job loss‖ effects (claim frequency rising on news of factory shutdowns or large layoffs)
• How do we reconcile these disparate views on how frequency behaves in recessions?
Copyright 2009 National Council on Compensation Insurance, Inc. All Rights Reserved.
7575
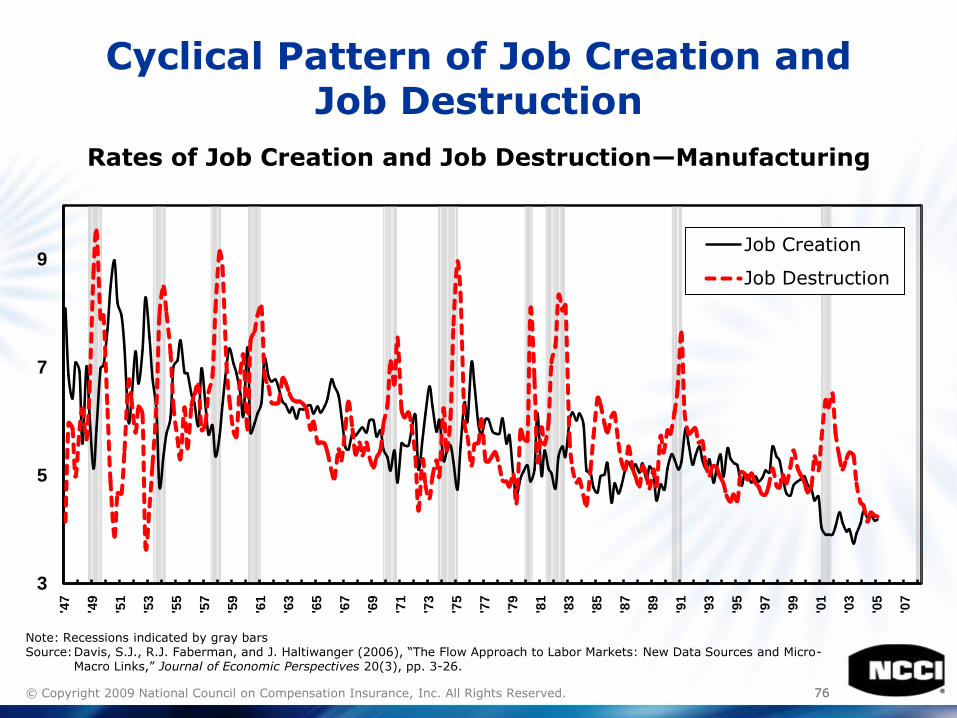
Explaining the Business Cycle Behavior of Frequency Growth: Focus on Job Flows
• Job flows data breaks down net changes in employment into changes related to job creation (the adding of new jobs) and job destruction (the elimination of existing jobs) at the establishment level (e.g., plant level)
• The rates of job creation and job destruction move in opposite directions during recessions
• Those differences help to reconcile the ―experienced worker‖ effect and the ―job loss‖ effect
Copyright 2009 National Council on Compensation Insurance, Inc. All Rights Reserved.
7676© Copyright 2009 National Council on Compensation Insurance, Inc. All Rights Reserved.
Cyclical Pattern of Job Creation and Job Destruction
Rates of Job Creation and Job Destruction—Manufacturing
Note: Recessions indicated by gray barsSource:Davis, S.J., R.J. Faberman, and J. Haltiwanger (2006), ―The Flow Approach to Labor Markets: New Data Sources and Micro-
Macro Links,‖ Journal of Economic Perspectives 20(3), pp. 3-26.
3
5
7
9
'47
'49
'51
'53
'55
'57
'59
'61
'63
'65
'67
'69
'71
'73
'75
'77
'79
'81
'83
'85
'87
'89
'91
'93
'95
'97
'99
'01
'03
'05
'07
Job Creation
Job Destruction
7777
Impact of Job Flows on Frequency Growth:Results of Quantitative Analysis
Copyright 2009 National Council on Compensation Insurance, Inc. All Rights Reserved.
• The decline in job creation at the onset of recessions causes the growth rate of frequency to decrease—reflective of the ―experienced worker‖ effect
• At the same time, the increase in the rate of job destruction causes the growth rate of frequency to increase—the ―job loss‖ effect (possibly indicative of moral hazard)
7878
Impact of Job Flows on Frequency Growth: Results of Quantitative Analysis
Copyright 2009 National Council on Compensation Insurance, Inc. All Rights Reserved.
• Statistical modeling shows that the effect of the decline in job creation in recessions outweighs the effect of the increase in job destruction—so, on net, recessions tend to cause a decline in the rate of frequency growth
• Conversely, economic expansions come with an increase in the growth rate of frequency
© Copyright 2009 National Council on Compensation Insurance, Inc. All Rights Reserved.
Impact of Recessions on Indemnity and Medical
Severity
8080© Copyright 2009 National Council on Compensation Insurance, Inc. All Rights Reserved.
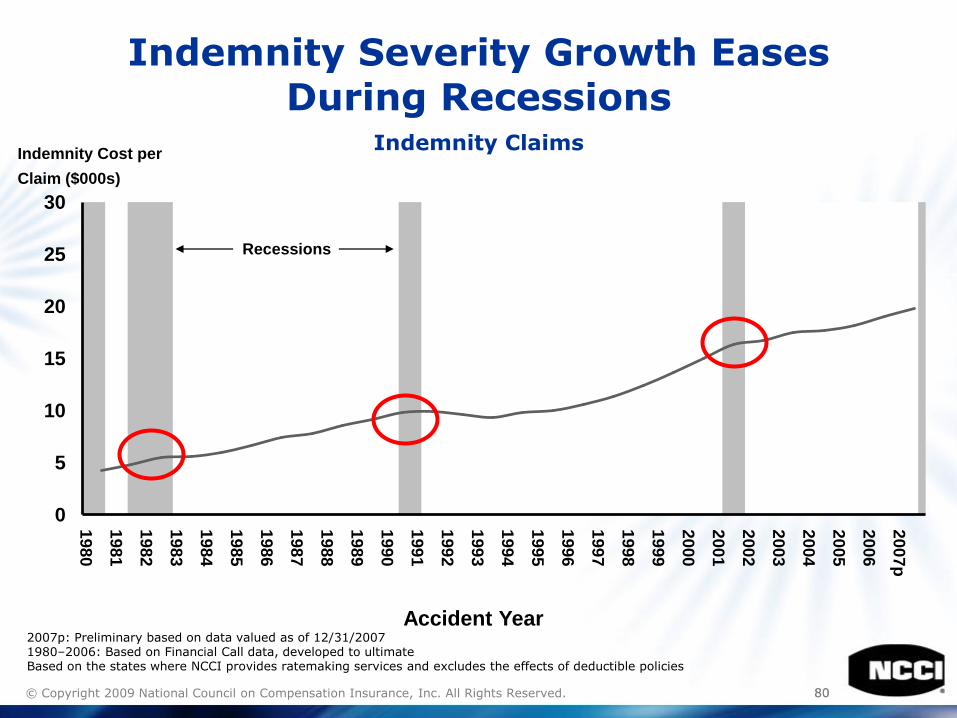
Indemnity Severity Growth EasesDuring Recessions
Indemnity Claims
0
5
10
15
20
25
30
1980
1981
1982
1983
1984
1985
1986
1987
1988
1989
1990
1991
1992
1993
1994
1995
1996
1997
1998
1999
2000
2001
2002
2003
2004
2005
2006
2007p
Recessions
Indemnity Cost per
Claim ($000s)
2007p: Preliminary based on data valued as of 12/31/20071980–2006: Based on Financial Call data, developed to ultimateBased on the states where NCCI provides ratemaking services and excludes the effects of deductible policies
Accident Year
8181© Copyright 2009 National Council on Compensation Insurance, Inc. All Rights Reserved.
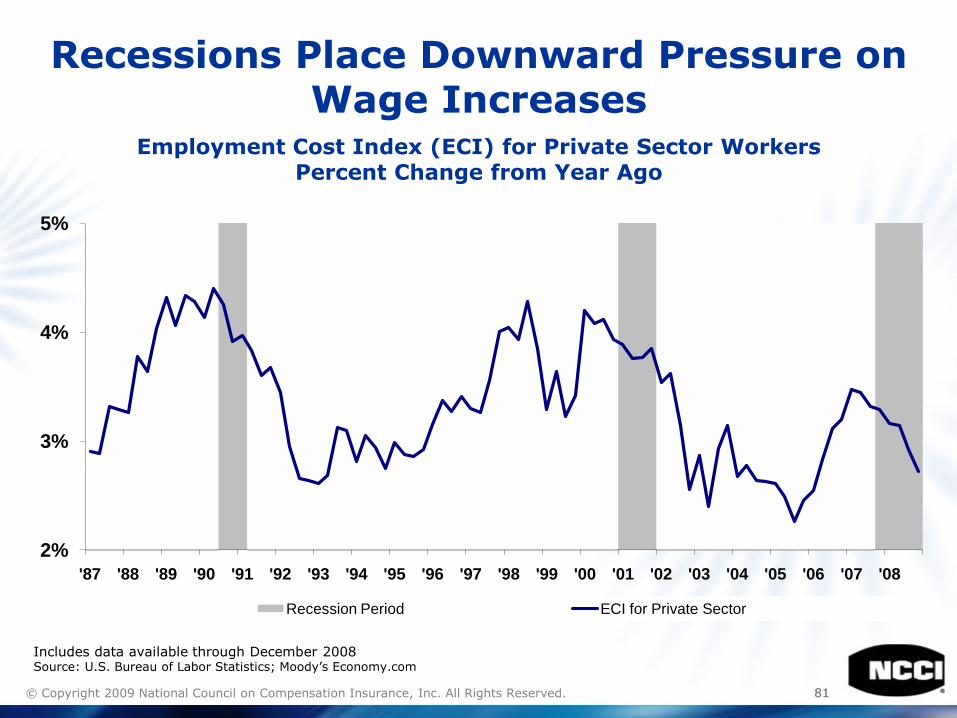
Recessions Place Downward Pressure on Wage Increases
Employment Cost Index (ECI) for Private Sector WorkersPercent Change from Year Ago
2%
3%
4%
5%
'87 '88 '89 '90 '91 '92 '93 '94 '95 '96 '97 '98 '99 '00 '01 '02 '03 '04 '05 '06 '07 '08
Recession Period ECI for Private Sector
Includes data available through December 2008Source: U.S. Bureau of Labor Statistics; Moody’s Economy.com
8282© Copyright 2009 National Council on Compensation Insurance, Inc. All Rights Reserved.
Indemnity Severity—Uncertain Impact of Recession on Worker Attitudes
• Concern for job may reduce time away from work
• High likelihood of job loss may reduce incentives to return to work quickly
8383© Copyright 2009 National Council on Compensation Insurance, Inc. All Rights Reserved.
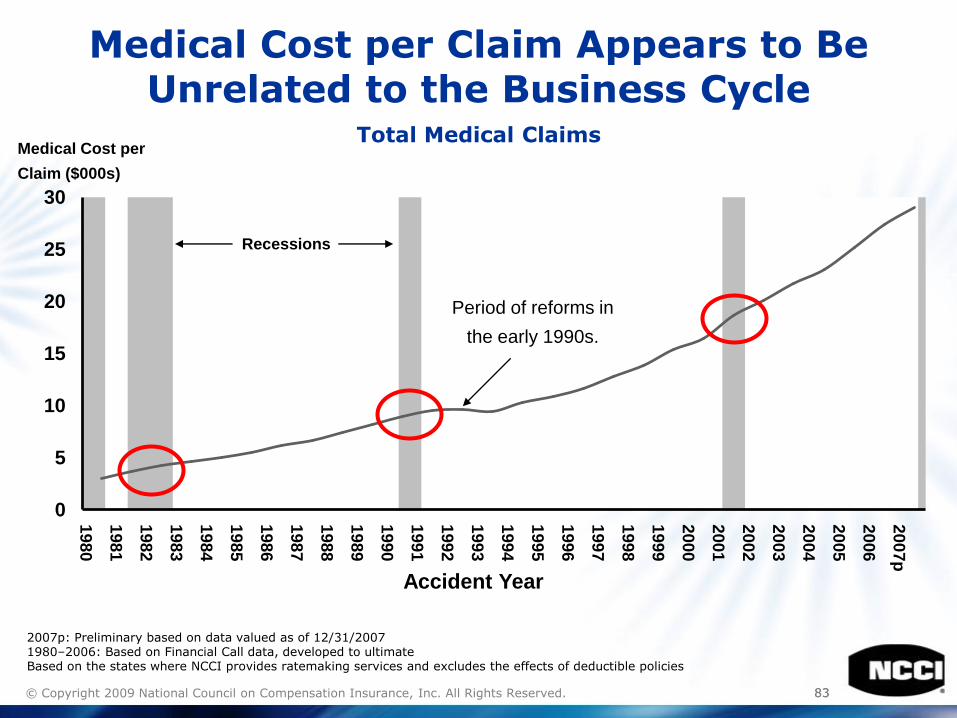
Medical Cost per Claim Appears to Be Unrelated to the Business Cycle
Total Medical Claims
0
5
10
15
20
25
30
1980
1981
1982
1983
1984
1985
1986
1987
1988
1989
1990
1991
1992
1993
1994
1995
1996
1997
1998
1999
2000
2001
2002
2003
2004
2005
2006
2007p
Recessions
Medical Cost per
Claim ($000s)
Period of reforms in
the early 1990s.
2007p: Preliminary based on data valued as of 12/31/20071980–2006: Based on Financial Call data, developed to ultimateBased on the states where NCCI provides ratemaking services and excludes the effects of deductible policies
Accident Year
8484© Copyright 2009 National Council on Compensation Insurance, Inc. All Rights Reserved.
Key Takeaways
• The current recession is likely to be both protracted and severe
• Recessions tend to place downward pressure on exposure (payrolls) because of declines in both employment and slower growth (or declines) in wage rates
• The economy affects claim frequency largely through the experienced worker effect—reflected in fluctuations around a persistent downward trend
8585© Copyright 2009 National Council on Compensation Insurance, Inc. All Rights Reserved.
Key Takeaways (cont.)
• Indemnity severity is impacted by changes in wages (the growth in which varies over the business cycle) as well as by how workers react to changes in economic conditions
• Medical severity seems largely insensitive to the business cycle

© Copyright 2009 National Council on Compensation Insurance, Inc. All Rights Reserved.
The Residual Market in Nevada
8787© Copyright 2009 National Council on Compensation Insurance, Inc. All Rights Reserved.
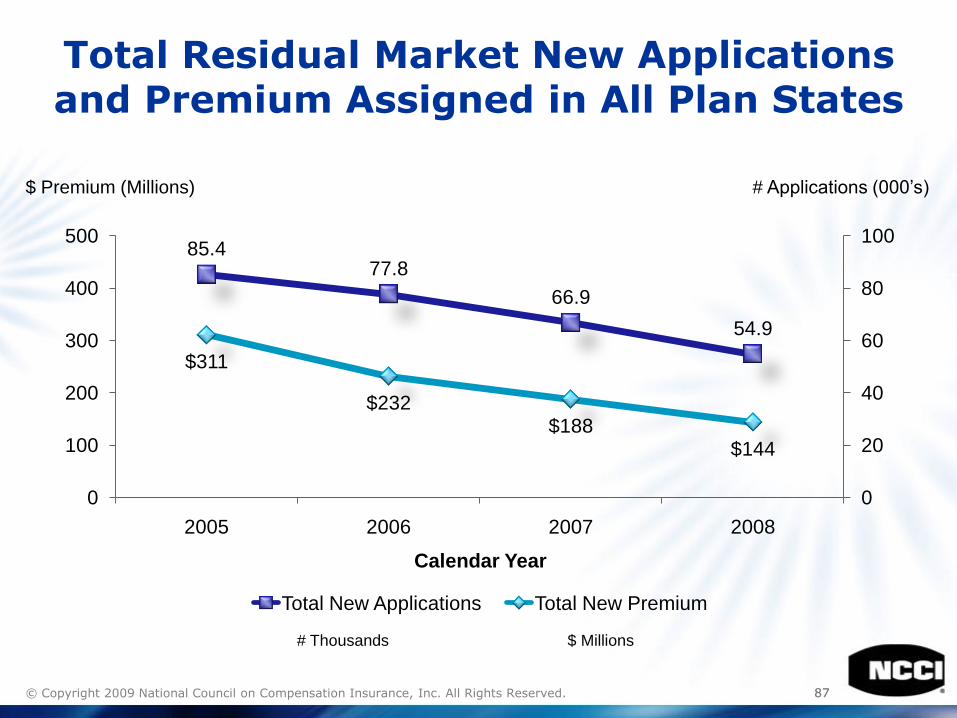
Total Residual Market New Applications and Premium Assigned in All Plan States
85.477.8
66.9
54.9
$311
$232$188
$144
0
100
200
300
400
500
2005 2006 2007 2008
0
20
40
60
80
100
Calendar Year
Total New Applications Total New Premium
# Thousands $ Millions
$ Premium (Millions) # Applications (000’s)
8888© Copyright 2009 National Council on Compensation Insurance, Inc. All Rights Reserved.
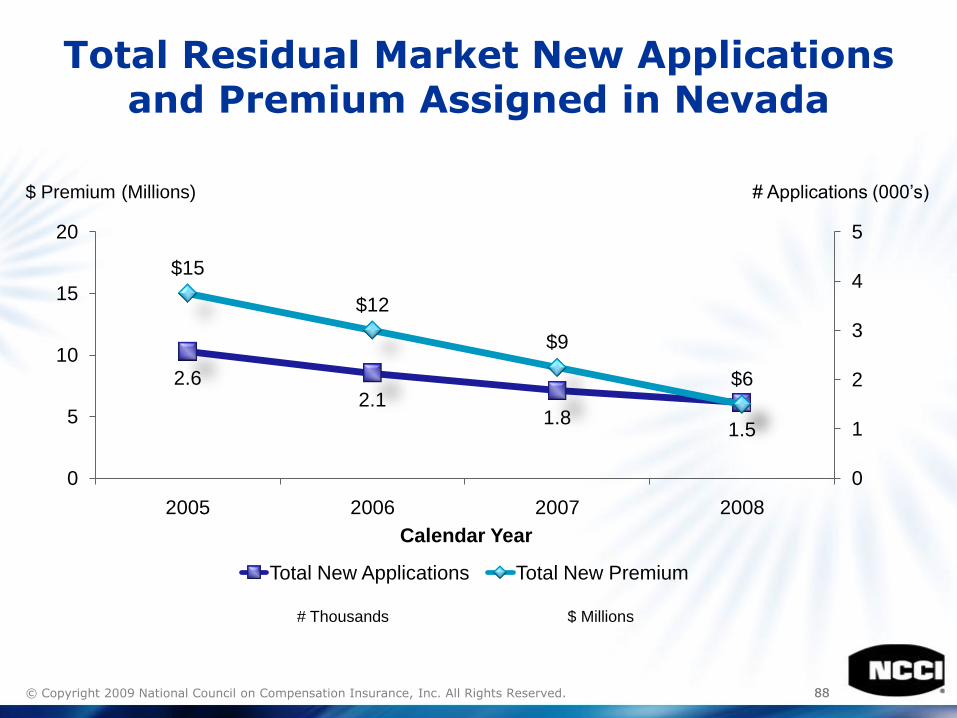
Total Residual Market New Applications and Premium Assigned in Nevada
2.62.1
1.81.5
$15
$12
$9
$6
0
5
10
15
20
2005 2006 2007 2008
0
1
2
3
4
5
Calendar Year
Total New Applications Total New Premium
$ Premium (Millions) # Applications (000’s)
# Thousands $ Millions
8989© Copyright 2009 National Council on Compensation Insurance, Inc. All Rights Reserved.
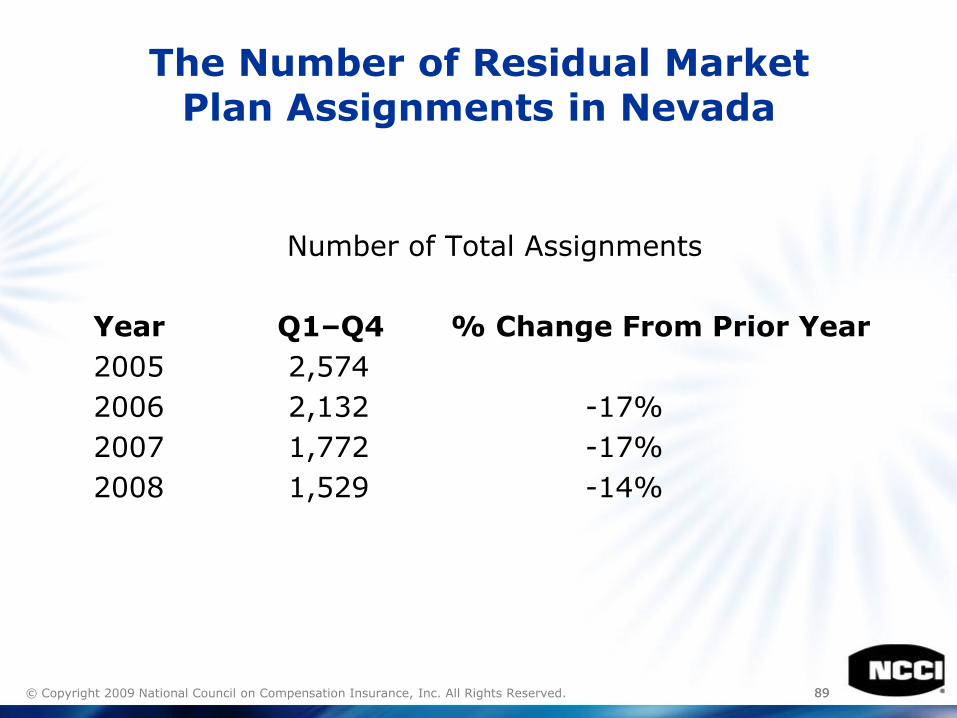
Number of Total Assignments
Year Q1–Q4 % Change From Prior Year
2005 2,574
2006 2,132 -17%
2007 1,772 -17%
2008 1,529 -14%
The Number of Residual Market Plan Assignments in Nevada
9090© Copyright 2009 National Council on Compensation Insurance, Inc. All Rights Reserved.
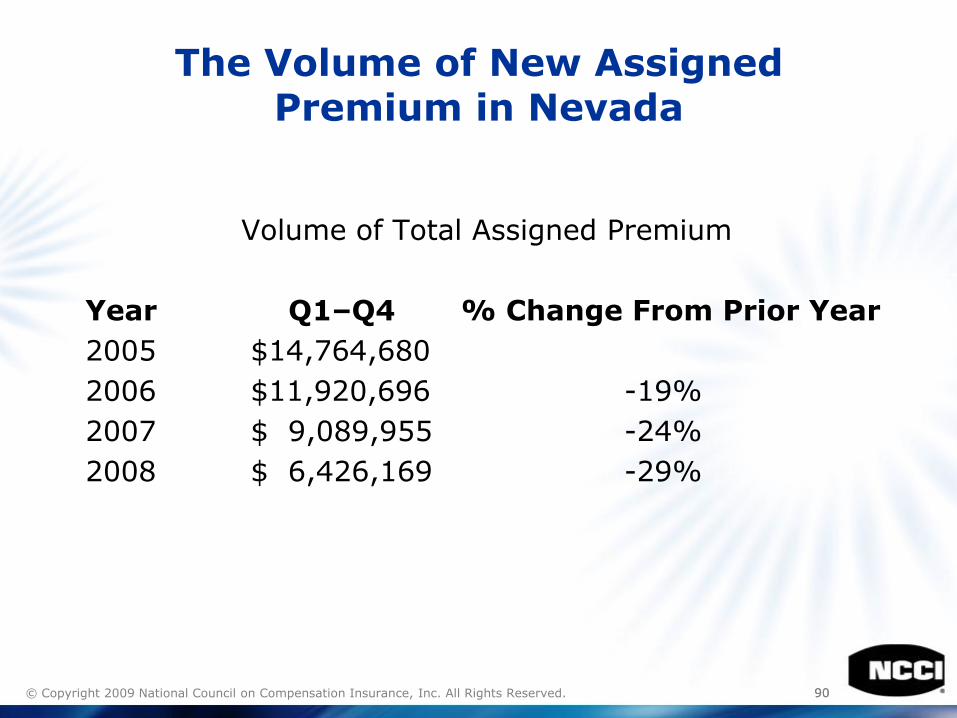
The Volume of New AssignedPremium in Nevada
Volume of Total Assigned Premium
Year Q1–Q4 % Change From Prior Year
2005 $14,764,680
2006 $11,920,696 -19%
2007 $ 9,089,955 -24%
2008 $ 6,426,169 -29%
9191© Copyright 2009 National Council on Compensation Insurance, Inc. All Rights Reserved.
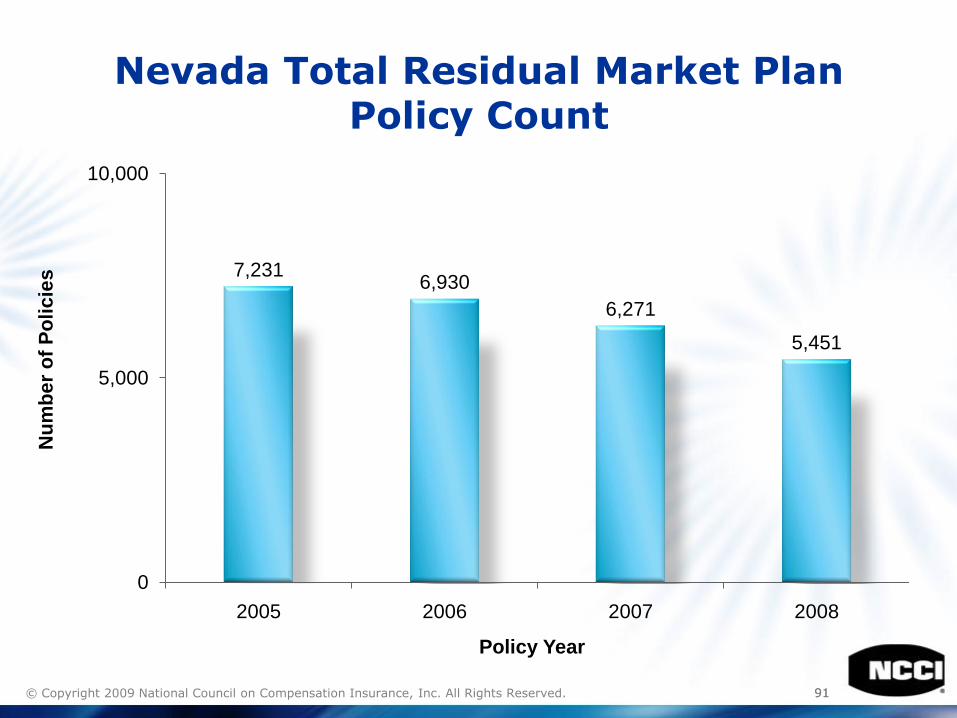
Nevada Total Residual Market Plan Policy Count
7,2316,930
6,271
5,451
0
5,000
10,000
2005 2006 2007 2008
Nu
mb
er
of
Po
lic
ies
Policy Year
9292© Copyright 2009 National Council on Compensation Insurance, Inc. All Rights Reserved.
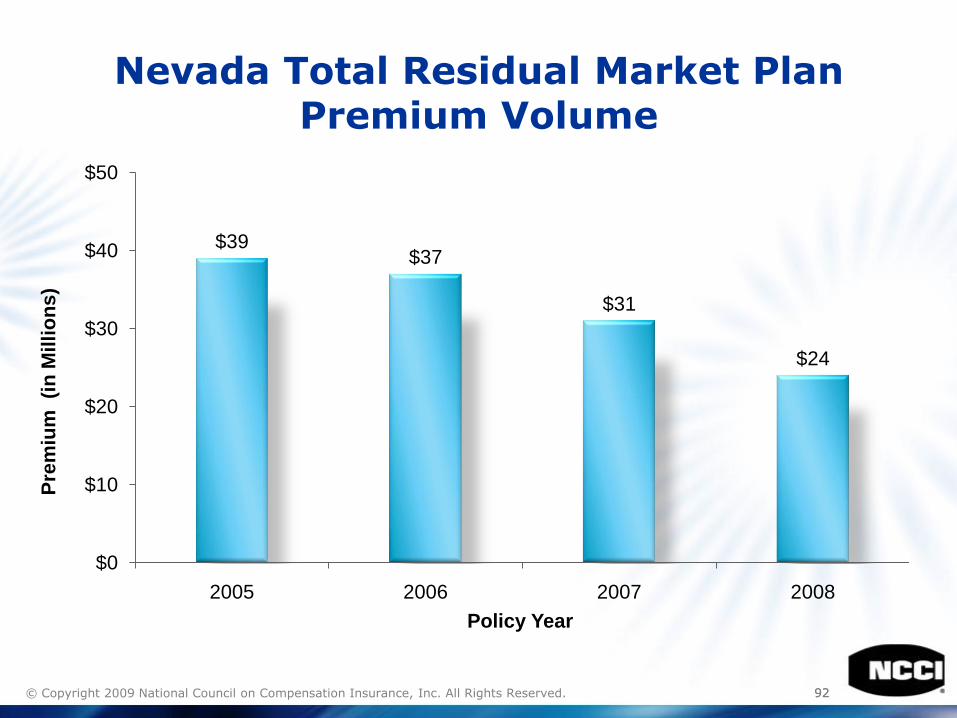
Nevada Total Residual Market Plan Premium Volume
$39$37
$31
$24
$0
$10
$20
$30
$40
$50
2005 2006 2007 2008
Pre
miu
m (i
n M
illi
on
s)
Policy Year
9393© Copyright 2009 National Council on Compensation Insurance, Inc. All Rights Reserved.
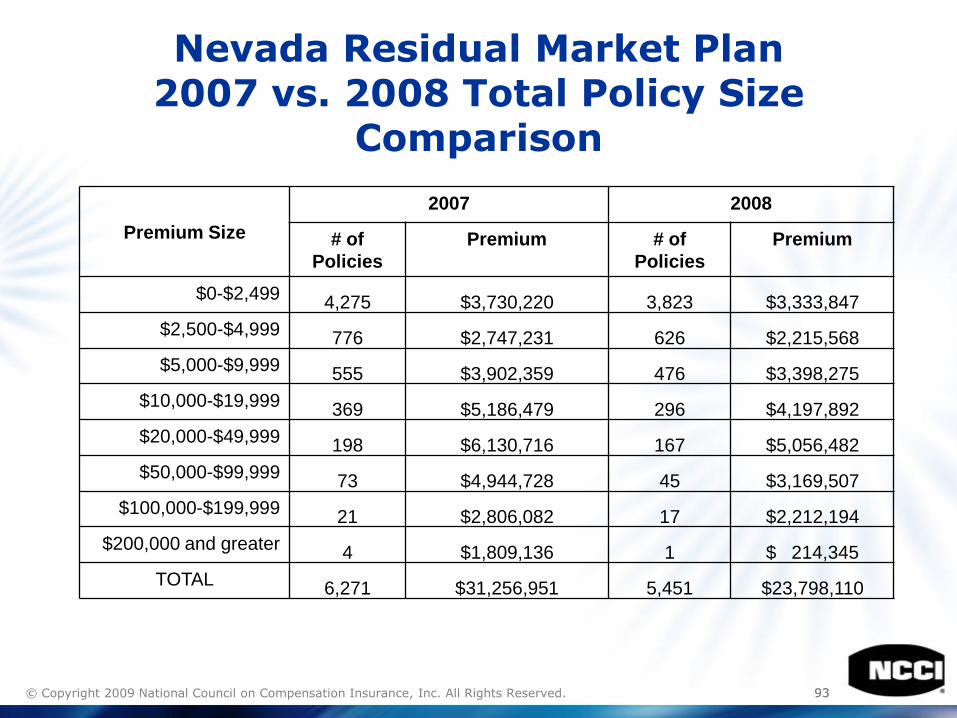
Nevada Residual Market Plan 2007 vs. 2008 Total Policy Size
Comparison
Premium Size
2007 2008
# of
Policies
Premium # of
Policies
Premium
$0-$2,4994,275 $3,730,220 3,823 $3,333,847
$2,500-$4,999776 $2,747,231 626 $2,215,568
$5,000-$9,999555 $3,902,359 476 $3,398,275
$10,000-$19,999369 $5,186,479 296 $4,197,892
$20,000-$49,999198 $6,130,716 167 $5,056,482
$50,000-$99,99973 $4,944,728 45 $3,169,507
$100,000-$199,99921 $2,806,082 17 $2,212,194
$200,000 and greater4 $1,809,136 1 $ 214,345
TOTAL6,271 $31,256,951 5,451 $23,798,110
9494© Copyright 2009 National Council on Compensation Insurance, Inc. All Rights Reserved.
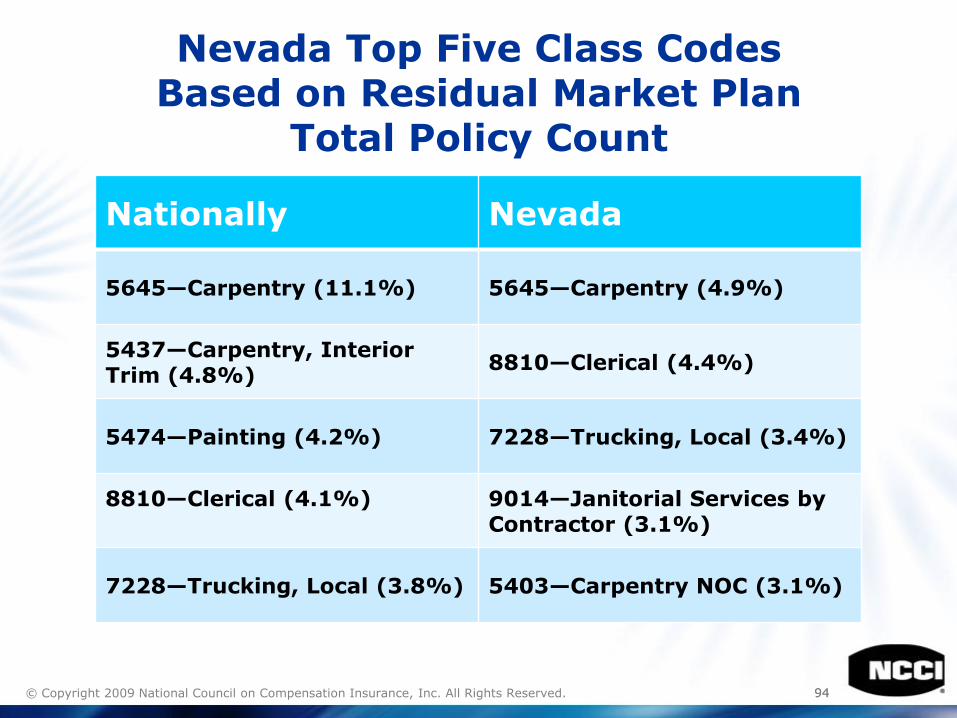
Nevada Top Five Class Codes Based on Residual Market Plan
Total Policy Count
Nationally Nevada
5645—Carpentry (11.1%) 5645—Carpentry (4.9%)
5437—Carpentry, Interior Trim (4.8%)
8810—Clerical (4.4%)
5474—Painting (4.2%) 7228—Trucking, Local (3.4%)
8810—Clerical (4.1%) 9014—Janitorial Services byContractor (3.1%)
7228—Trucking, Local (3.8%) 5403—Carpentry NOC (3.1%)
9595© Copyright 2009 National Council on Compensation Insurance, Inc. All Rights Reserved.
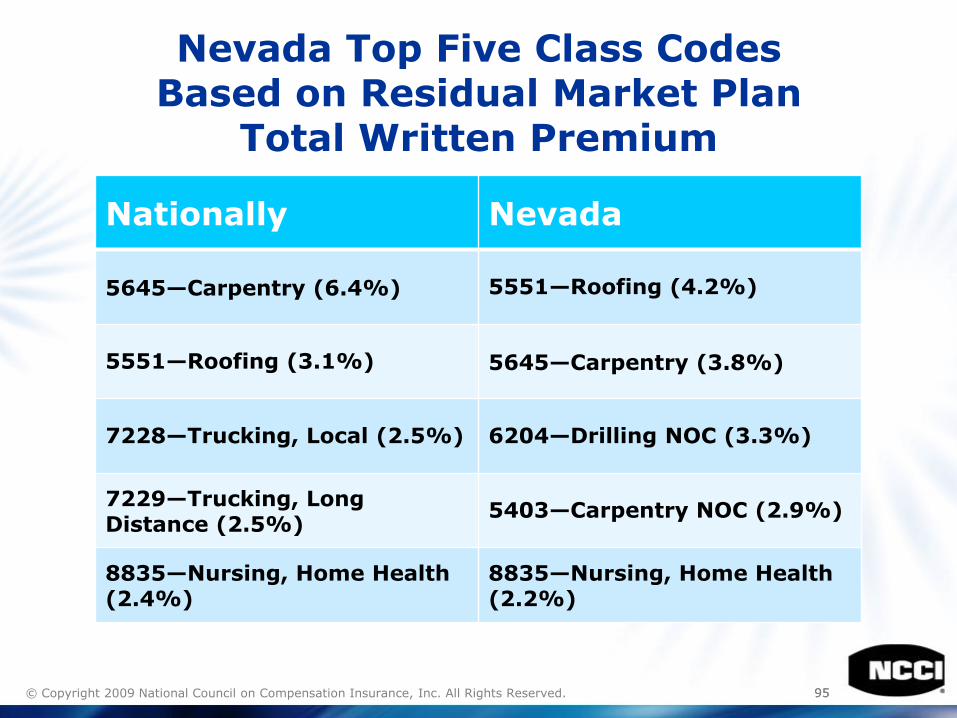
Nevada Top Five Class Codes Based on Residual Market Plan
Total Written Premium
Nationally Nevada
5645—Carpentry (6.4%) 5551—Roofing (4.2%)
5551—Roofing (3.1%) 5645—Carpentry (3.8%)
7228—Trucking, Local (2.5%) 6204—Drilling NOC (3.3%)
7229—Trucking, LongDistance (2.5%)
5403—Carpentry NOC (2.9%)
8835—Nursing, Home Health (2.4%)
8835—Nursing, Home Health (2.2%)
9696© Copyright 2009 National Council on Compensation Insurance, Inc. All Rights Reserved.
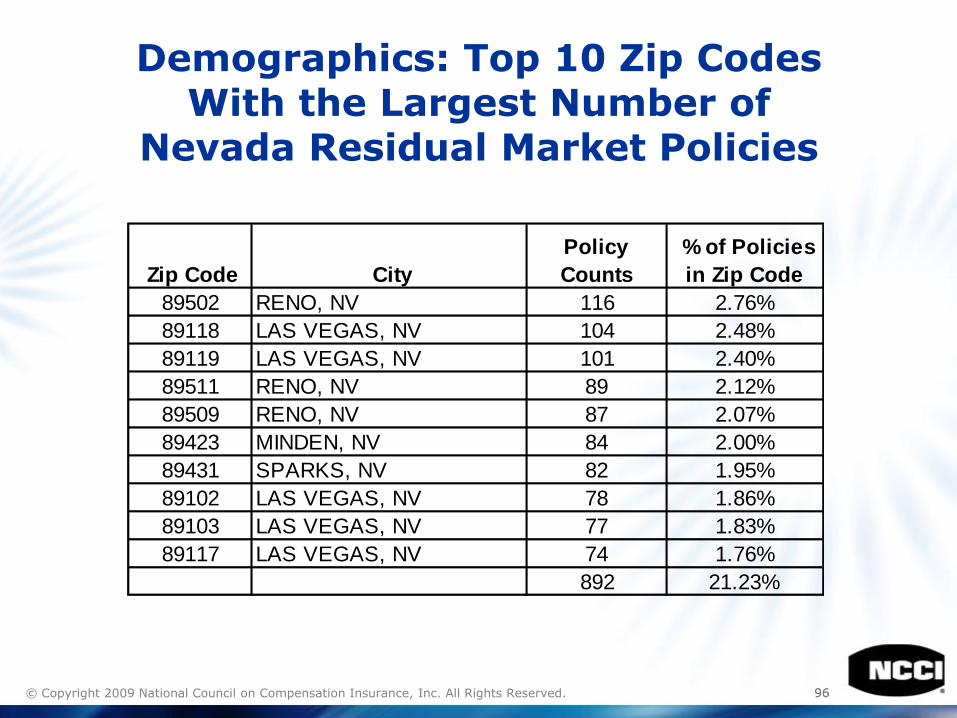
Demographics: Top 10 Zip CodesWith the Largest Number of
Nevada Residual Market Policies
Zip Code City
Policy
Counts
% of Policies
in Zip Code
89502 RENO, NV 116 2.76%
89118 LAS VEGAS, NV 104 2.48%
89119 LAS VEGAS, NV 101 2.40%
89511 RENO, NV 89 2.12%
89509 RENO, NV 87 2.07%
89423 MINDEN, NV 84 2.00%
89431 SPARKS, NV 82 1.95%
89102 LAS VEGAS, NV 78 1.86%
89103 LAS VEGAS, NV 77 1.83%
89117 LAS VEGAS, NV 74 1.76%
892 21.23%
9797© Copyright 2009 National Council on Compensation Insurance, Inc. All Rights Reserved.
Nevada Assigned Risk Pricing Programs
• Assigned Risk Differential
• Assigned Risk Adjustment Program (ARAP)
• Loss Sensitive Rating Plan (LSRP)
• No Premium Discounts
9898© Copyright 2009 National Council on Compensation Insurance, Inc. All Rights Reserved.
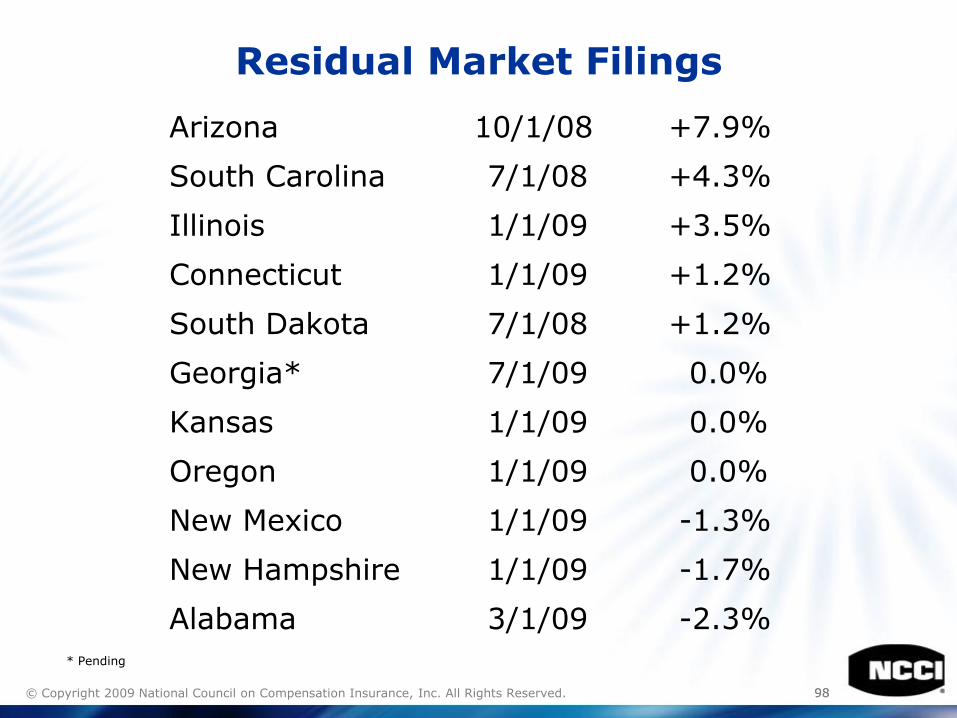
Residual Market Filings
Arizona 10/1/08 +7.9%
South Carolina 7/1/08 +4.3%
Illinois 1/1/09 +3.5%
Connecticut 1/1/09 +1.2%
South Dakota 7/1/08 +1.2%
Georgia* 7/1/09 0.0%
Kansas 1/1/09 0.0%
Oregon 1/1/09 0.0%
New Mexico 1/1/09 -1.3%
New Hampshire 1/1/09 -1.7%
Alabama 3/1/09 -2.3%
* Pending
9999© Copyright 2009 National Council on Compensation Insurance, Inc. All Rights Reserved.
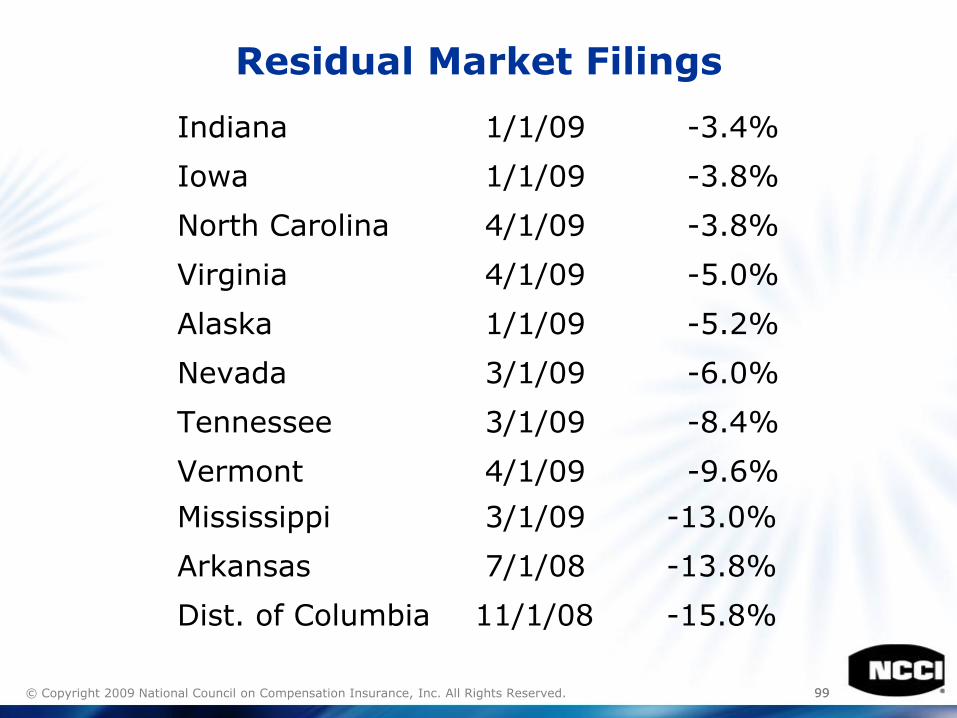
Residual Market Filings
Indiana 1/1/09 -3.4%
Iowa 1/1/09 -3.8%
North Carolina 4/1/09 -3.8%
Virginia 4/1/09 -5.0%
Alaska 1/1/09 -5.2%
Nevada 3/1/09 -6.0%
Tennessee 3/1/09 -8.4%
Vermont 4/1/09 -9.6%
Mississippi 3/1/09 -13.0%
Arkansas 7/1/08 -13.8%
Dist. of Columbia 11/1/08 -15.8%
© Copyright 2009 National Council on Compensation Insurance, Inc. All Rights Reserved.
Implications of the New AMA Guides

© Copyright 2009 National Council on Compensation Insurance, Inc. All Rights Reserved.
Q & A
© Copyright 2009 National Council on Compensation Insurance, Inc. All Rights Reserved.
Closing Remarks
Thank You!
© Copyright 2009 National Council on Compensation Insurance, Inc. All Rights Reserved.
Glossary
104104© Copyright 2009 National Council on Compensation Insurance, Inc. All Rights Reserved.
Glossary
• Assigned Risk Adjustment Program (ARAP)—An assigned risk market program that surcharges residual market risks based on the magnitude of their experience rating modification.
• Calendar Year (CY)—Experience of earned premium and loss transactions occurring within the calendar year beginning January 1, irrespective of the contractual dates of the policies to which the transactions relate and the dates of the accidents.
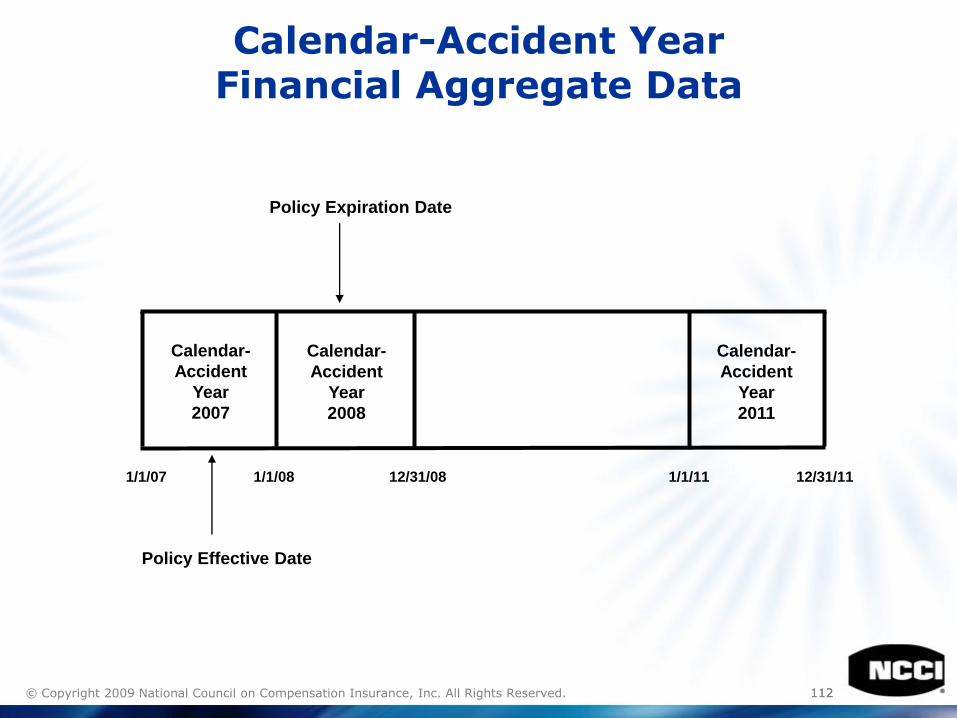
• Calendar-Accident Year (AY)—The accumulation of loss data on all accidents with the date of occurrence falling within a given calendar year. The premium figure is the same as that used in calendar year experience.
• Claim Frequency—The number of claims per unit of exposure. For example, the number of claims per million dollars of premium or per one hundred workers.
105105© Copyright 2009 National Council on Compensation Insurance, Inc. All Rights Reserved.
Glossary
• Claim Severity—The average cost of a claim. Severity is calculated by dividing total losses by the total number of claims.
• Combined Ratio—The sum of the (i) loss ratio, (ii) expense ratio, and (iii) dividend ratio for a given time period.
• Detailed Claim Information (DCI)—An NCCI call that collects detailed information on an individual workers compensation lost-time claim basis, such as type of injury, whether or not an attorney was involved, timing of the claim’s report to the carrier, etc.
• Direct Written Premium (DWP)—The gross premium income adjusted for additional or return premiums, but excluding any reinsurance premiums.
106106© Copyright 2009 National Council on Compensation Insurance, Inc. All Rights Reserved.
Glossary
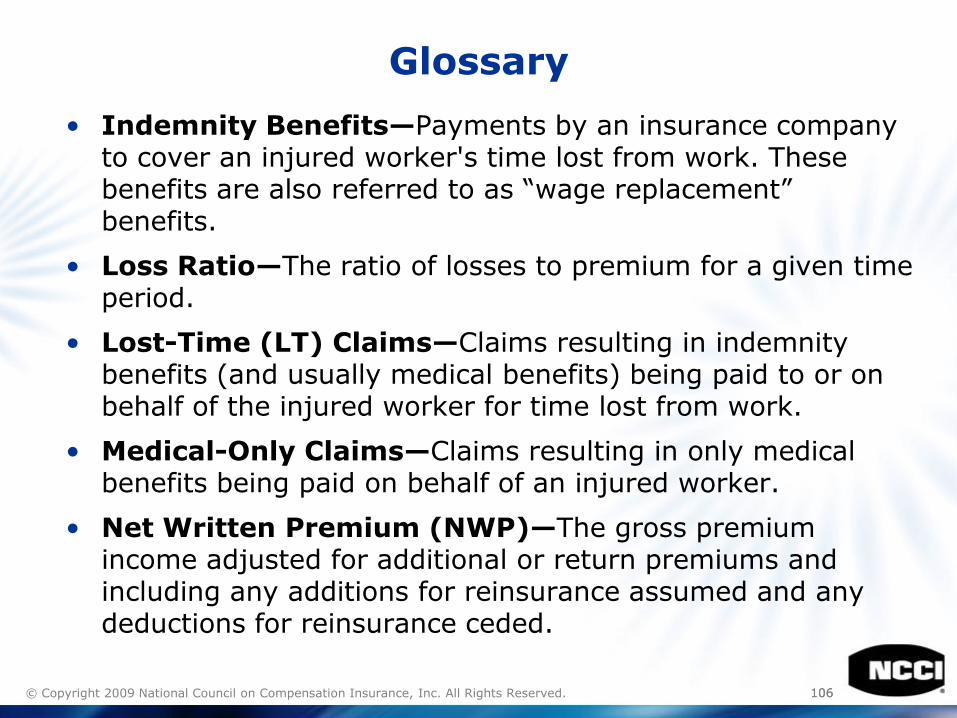
• Indemnity Benefits—Payments by an insurance company to cover an injured worker's time lost from work. These benefits are also referred to as ―wage replacement‖ benefits.
• Loss Ratio—The ratio of losses to premium for a given time period.
• Lost-Time (LT) Claims—Claims resulting in indemnity benefits (and usually medical benefits) being paid to or on behalf of the injured worker for time lost from work.
• Medical-Only Claims—Claims resulting in only medical benefits being paid on behalf of an injured worker.
• Net Written Premium (NWP)—The gross premium income adjusted for additional or return premiums and including any additions for reinsurance assumed and any deductions for reinsurance ceded.
107107© Copyright 2009 National Council on Compensation Insurance, Inc. All Rights Reserved.
Glossary
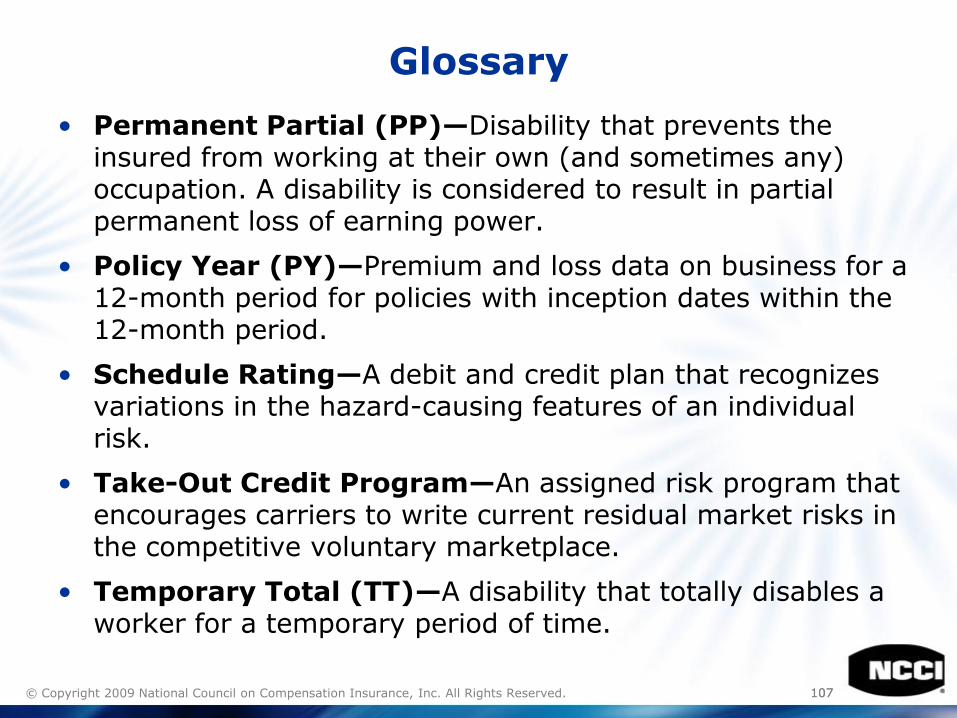
• Permanent Partial (PP)—Disability that prevents the insured from working at their own (and sometimes any) occupation. A disability is considered to result in partial permanent loss of earning power.
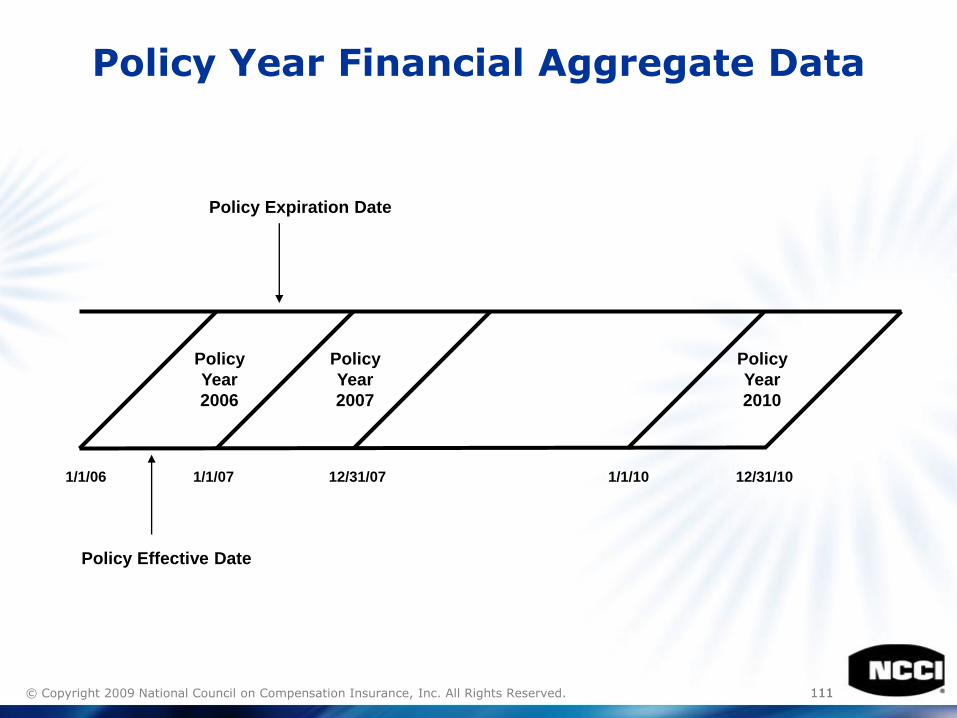
• Policy Year (PY)—Premium and loss data on business for a 12-month period for policies with inception dates within the 12-month period.
• Schedule Rating—A debit and credit plan that recognizes variations in the hazard-causing features of an individual risk.
• Take-Out Credit Program—An assigned risk program that encourages carriers to write current residual market risks in the competitive voluntary marketplace.
• Temporary Total (TT)—A disability that totally disables a worker for a temporary period of time.

© Copyright 2009 National Council on Compensation Insurance, Inc. All Rights Reserved.
Appendix
109109© Copyright 2009 National Council on Compensation Insurance, Inc. All Rights Reserved.
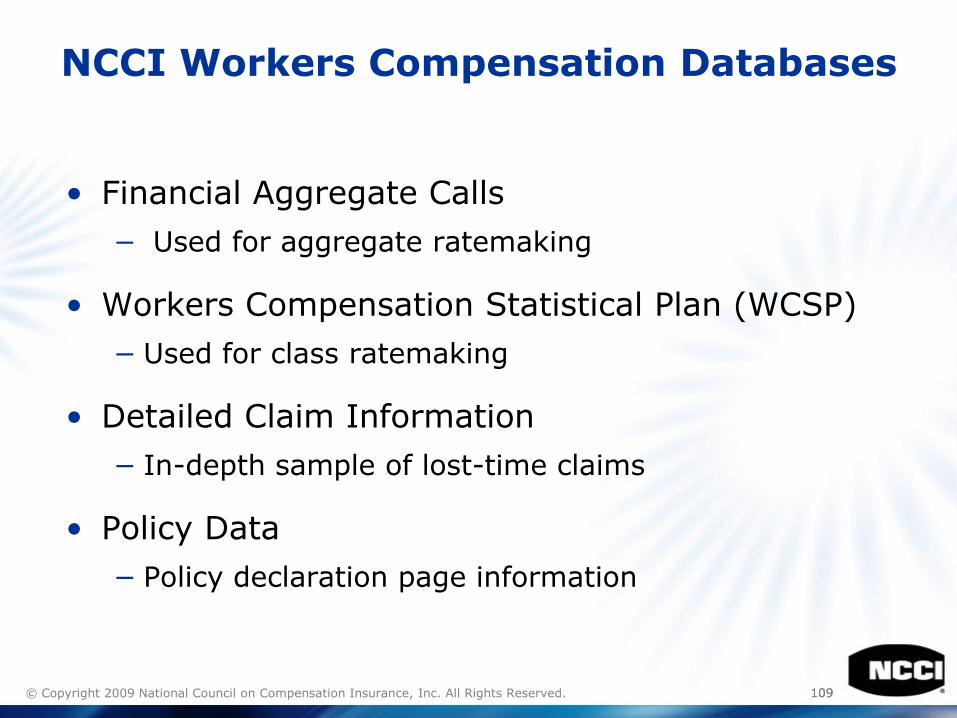
NCCI Workers Compensation Databases
• Financial Aggregate Calls
− Used for aggregate ratemaking
• Workers Compensation Statistical Plan (WCSP)
− Used for class ratemaking
• Detailed Claim Information
− In-depth sample of lost-time claims
• Policy Data
− Policy declaration page information
110110© Copyright 2009 National Council on Compensation Insurance, Inc. All Rights Reserved.
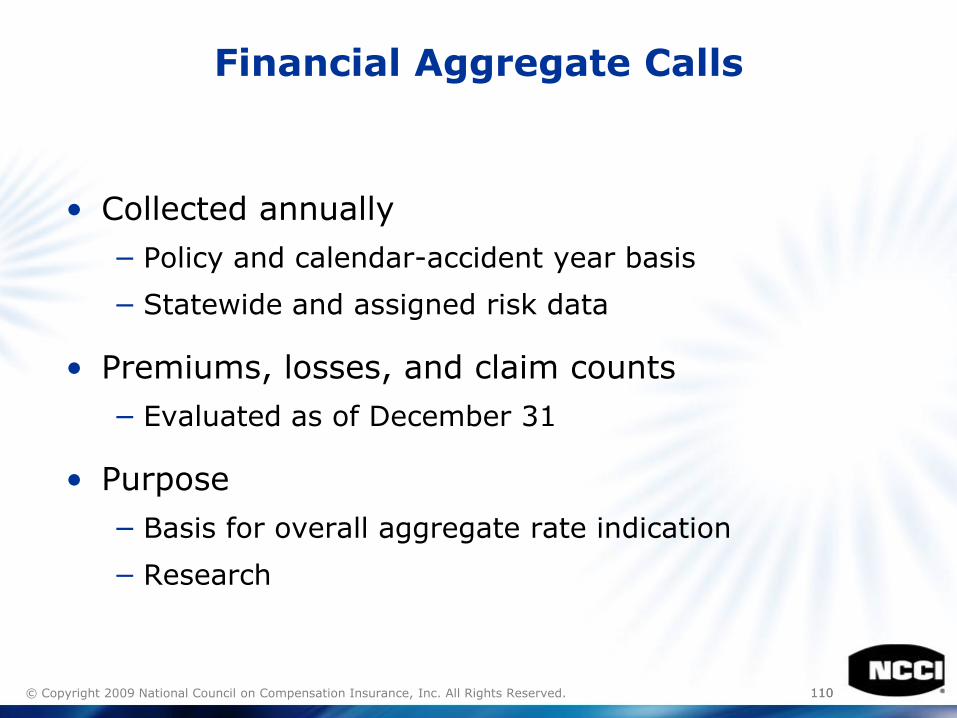
Financial Aggregate Calls
• Collected annually
− Policy and calendar-accident year basis
− Statewide and assigned risk data
• Premiums, losses, and claim counts
− Evaluated as of December 31
• Purpose
− Basis for overall aggregate rate indication
− Research
111111© Copyright 2009 National Council on Compensation Insurance, Inc. All Rights Reserved.
Policy Year Financial Aggregate Data
1/1/07 12/31/071/1/06 1/1/10 12/31/10
Policy Expiration Date
Policy Effective Date
Policy
Year
2006
Policy
Year
2007
Policy
Year
2010
112112© Copyright 2009 National Council on Compensation Insurance, Inc. All Rights Reserved.
Calendar-Accident YearFinancial Aggregate Data
1/1/08 12/31/081/1/07 1/1/11 12/31/11
Policy Expiration Date
Policy Effective Date
Calendar-
Accident
Year
2007
Calendar-
Accident
Year
2008
Calendar-
Accident
Year
2011
113113© Copyright 2009 National Council on Compensation Insurance, Inc. All Rights Reserved.
Workers Compensation Statistical Plan (WCSP) Data
• Experience by policy detail
− Exposure, premium, experience rating modifications
− Individual claims by injury type
• Purposes
− Classification relativities
− Experience Rating Plan
− Research
114114© Copyright 2009 National Council on Compensation Insurance, Inc. All Rights Reserved.
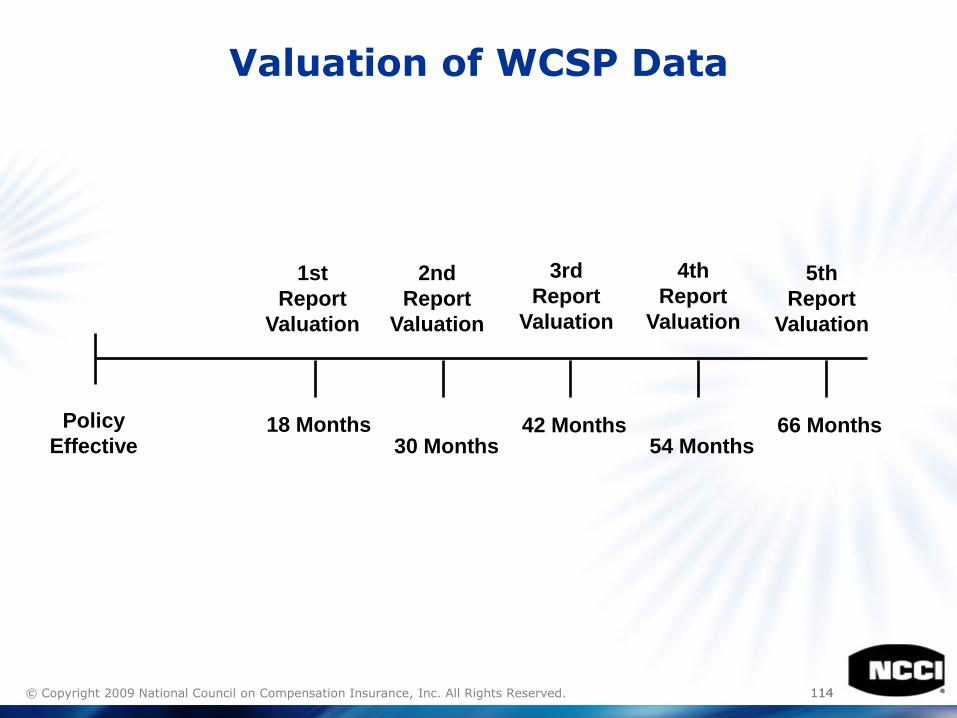
Valuation of WCSP Data
Policy
Effective18 Months
1st
Report
Valuation
2nd
Report
Valuation
3rd
Report
Valuation
4th
Report
Valuation
5th
Report
Valuation
30 Months42 Months
54 Months66 Months