Embed Size (px)
Citation preview

Neutron Capture and Total Cross-Section Measurements andResonance Parameters of Gadolinium
G. Leinweber,* D. P. Barry, M. J. Trbovich, J. A. Burke, N. J. Drindak, H. D. Knox, and R. V. Ballad
Lockheed Martin CorporationP.O. Box 1072, Schenectady, New York 12301-1072
and
R. C. Block, Y. Danon, and L. I. Severnyak
Rensselaer Polytechnic InstituteDepartment of Mechanical, Aerospace, and Nuclear Engineering
Troy, New York 12180-3590
Received July 28, 2005Accepted December 20, 2005
Abstract – Neutron capture and transmission measurements were performed by the time-of-flight tech-nique at the Rensselaer Polytechnic Institute linac facility using metallic and liquid Gd samples. Theliquid samples were isotopically enriched in either 155Gd or 157Gd. The capture measurements were madeat the 25-m flight station with a multiplicity-type capture detector, and the transmission measurementswere performed at 15- and 25-m flight stations with 6Li glass scintillation detectors. The multilevelR-matrix Bayesian code SAMMY was used to extract resonance parameters.
Among the significant findings are the following. The neutron width of the largest resonance in Gd, at0.032 eV in 157Gd, has been measured to be (9 6 1)% smaller than that given in ENDF/B-VI updatedthrough release 8. The thermal (2200 m/s) capture cross section of 157Gd has been measured to be 11%smaller than that calculated from ENDF. The other major thermal resonance, at 0.025 eV in 155Gd, did notdisplay a significant deviation from the thermal capture cross section given by ENDF.
In the epithermal region, the analysis provided here represents the most extensive to date. Twenty-eight new resonances are proposed, and other resonances previously identified in the literature have beenrevisited. The assignment of resonances within regions of complicated structure incorporated the obser-vations of other researchers, particularly on the six occasions where ENDF resonances are recommendedto be removed. The poor match of the ENDF parameters to the current data is significant, and substantialimprovement to the understanding of gadolinium cross sections is presented, particularly above 180 eVwhere the ENDF resolved region for 155Gd ends.
I. INTRODUCTION
The purpose of the present work is to measure theneutron cross sections of gadolinium accurately. Gado-linium has the highest thermal cross section of any nat-ural element. Two large resonances exist slightly abovethermal energy. The resonances are in 155Gd and 157Gd.Isotopically enriched 155Gd and 157Gd samples were pre-pared as liquid solutions with heavy water to produce
uniform, thin samples. These thin samples were used inconjunction with elemental, natural metal samples.
A more detailed description of the present measure-ment and analysis is given in Ref. 1.
II. HISTORICAL REVIEW
A review of the prior measurements of Gd showsthat the resonance parameters for the low-energy dou-blet ~at '0.03 eV! in ENDF0B-VI ~Ref. 2! updated*E-mail: [email protected]
NUCLEAR SCIENCE AND ENGINEERING: 154, 261–279 ~2006!
261

through release 8 are nearly identical to those of Mølleret al.3 The neutron width of the low-energy 155Gd reso-nance and the radiation widths of both low-energy reso-nances come directly from the paper of Møller et al.,3
while the ENDF value for the neutron width of the low-energy 157Gd resonance is within 0.4% of the value givenby Møller et al.3
In the region from 1.0 to 300.0 eV, most of the res-onances occur in 155Gd and 157Gd. In these two isotopes,ENDF resonance parameters are based on a few experi-ments, particularly Mughabghab and Chrien,4 Simpson,5
and Fricke et al.6 The other high-abundance isotopes,158Gd and 160Gd, have few resonances, and their param-eters come from Mughabghab and Chrien4 and Rahnet al.7 The minority isotopes are 152Gd and 154Gd.Gadolinium-152 has a natural abundance of 0.2%. Itsparameters come from Anufriev et al.8 and Macklin.9
Gadolinium-154 has a natural abundance of 2.1%. Itsresonance parameters come from Refs. 7 and 9.
Many other authors contributed observed resonanceenergies and0or spin assignments for resonances ener-gies above 148 eV including Belyaev et al.,10 Karzha-vina et al.,11,12 and Asghar et al.13
III. EXPERIMENTAL CONDITIONS
Table I gives some details of the experimental con-ditions including neutron targets, overlap filters, linacpulse repetition rate, flight path length, and channelwidths. Descriptions of the detectors,14,15 data acquisi-tion,14,16 and neutron-producing targets17–19 used in theseexperiments are available in the references.
The neutron energy for a detected event is deter-mined using the time-of-flight ~TOF! technique. The over-all dead time of the signal-processing electronics hasbeen set at 1.125 ms for capture measurements and 0.6 msfor transmission measurements.14
Table II lists the isotopic content of the gadoliniumsamples used in the experiments. The purity of metalsamples was 99.8%. The isotopic abundances of theelemental metal samples are taken from Ref. 20. Theonly significant contaminant in the metal samples wastantalum with a manufacturer-specified content of,0.1%. The liquid samples were prepared by dissolvingenriched gadolinium oxide in D2NO3 and then dilutingin 99.80% pure D2O. The uncertainties in isotopicenrichment of liquid samples given in Table II were de-termined by mass spectroscopy. No evidence of contam-ination was observed in the liquid sample data.
Table III lists the thicknesses of the samples and themeasurements made with these samples. The uncertain-ties in sample thickness for metal samples were propa-gated from multiple measurements of sample weight anddiameter. The diameter measurements were the domi-nant component of the uncertainties. The uncertainties
in sample thickness for liquid samples are larger thanthose of metals as shown in Table III. The method usedto determine the effective thickness of a liquid consistsof weighing the quantity of Gd2O3 necessary for 10 mlof GdNO3 solution in a 10-ml flask. Then, a knownweight of DNO3 is added to dissolve the Gd2O3. Next, aknown weight of D2O is added to bring the volume to10 ml. The concentration of Gd2O3 is the weight in gramsdivided by 10 ml. The weights are accurate to 0.001%for a 5-g sample. The accuracy of this method is limitedby the accuracy of the volumetric flask, i.e., 0.2%. Eachof the samples used is a further dilution of the stocksolution, introducing a second 0.2% error. Subsequent tothe gadolinium sample preparation, a second method wasdeveloped. It consists of preparing more of each solutionthan is required, so that part of the batch can be extractedwith a precision ~0.02 vol%! pipette, fired and weighed.Experience has shown that estimates of sample thick-ness from these two methods can differ by 2%. The sec-ond method is preferred since it measures the finalproduct. Application of this second method to the cur-rent measurements would require destructively analyz-ing the liquid samples used in this measurement, whichwas not done. Therefore, the uncertainty in sample thick-ness for the liquid samples is �2%.
All metal samples were natural elemental gadolin-ium sealed inside aluminum sample cans. The thicknessof aluminum on each of the front and rear faces of eachsample was 0.38 mm ~15 mils; 1 mil � 0.001 in.!. Theinfluence of these sample cans, as well as all back-ground, was measured by including empty sample cansin the capture measurement. Background in transmis-sion measurements is discussed in Sec. IV.B.
The liquid samples were enclosed in quartz cells.A drawing of the quartz cell is given in Fig. 1. The liquidsamples were needed to measure the strong thermal
Fig. 1. Geometry of the quartz cells used for liquid sam-ples for thermal measurements. Units are millimeter.
262 LEINWEBER et al.
NUCLEAR SCIENCE AND ENGINEERING VOL. 154 NOV. 2006

TABLE I
Gadolinium Experimental Details
ExperimentOverlap
Filter
Neutron-Producing
Target
ElectronPulseWidth~ns!
AverageBeam
Current~mA!
BeamEnergy~MeV!
MaximumChannelWidth~ms!
IntermediateChannelWidth~ms!
MinimumChannelWidth~ms!
PulseRepetition
Rate~pulses0s!
FlightPath
Length~m!
Epithermal transmission a Boron carbide Bare bounce 160 36 56 0.5 at ,27 eV 0.125 at 27 to 236 eV 0.0625 at .236 eV 250 25Epithermal transmission b Cadmium Bare bounce 153 40 50 0.5 at ,27 eV 0.125 at 27 to 236 eV 0.0625 at .236 eV 250 25Thermal transmission a enriched
liquidsNone Enhanced thermal 1000 8 53 128 at ,0.01 eV 32 at 0.01 to 0.04 eV
8 at 0.04 to 0.5 eV0.5 at .0.5 eV 25 15
Thermal transmission b enrichedliquids
None Enhanced thermal 3000 19 60 256 at ,0.008 eV 32 at 0.008 to 0.04 eV8 at 0.04 to 0.19 eV
1.0 at .0.19 eV 25 15
Thermal transmission c natural~elemental! metals
None Enhanced thermal 2100 8.5 50 8 at ,0.29 eV 1 at 0.29 to 4.8 eV 0.5 at .4.8 eV 25 15
Epithermal capture Cadmium Bare bounce 128 45 58 2 at ,1.5 eV 0.5 at 1.5 to 27 eV0.125 at 27 to 236 eV
0.0625 at .236 eV 250 25
Thermal capture None Enhanced thermal 3280 19 52 2048 at ,0.02 eV 128 at 0.02 to 0.06 eV16 at 0.06 to 0.5 eV
1.0 at .0.5 eV 25 25
TABLE II
Liquid Gadolinium Isotopic Enrichment, Atom Percentages
Samples 152Gd 154Gd 155Gd 156Gd 157Gd 158Gd 160Gd
155Gd: enriched LX-1, LX-2, LX-4, LX-9 0.01086 0.0002 0.98596 0.0074 74.42336 0.0095 17.56746 0.0051 3.75136 0.0023 2.53366 0.0024 0.72786 0.0020
157Gd: enriched LX-5, LX-6, LX-7, LX-10, LX-11 0.005106 0.00004 0.075306 0.00025 1.351476 0.00070 7.36276 0.0017 69.66236 0.0081 19.44316 0.0067 2.10006 0.0015
Elemental metals 0.2 2.2 14.8 20.5 15.7 24.8 21.9
GA
DO
LIN
IUM
CR
OS
S-S
EC
TIO
NM
EA
SU
RE
ME
NT
S263
NU
CL
EA
RS
CIE
NC
EA
ND
EN
GIN
EE
RIN
GV
OL
.154N
OV
.2006
region doublet. The thinnest manufacturable metal sam-ple of uniform thickness was 0.025-mm thickness. Atthis thickness the thermal region doublet is saturated.The liquid samples provided a uniform solution of en-riched Gd in heavy water. The heavy water minimizednon-Gd interactions. The sample container was a quartzcell with parallel inner walls. A D2O blank in an equiv-alent quartz container was included in the liquid samplemeasurements as a background measurement.
III.A. Capture Detector
The capture detector is a gamma detector containing20 � of NaI~Tl! ~Refs. 14, 15, and 16!. The scintillationcrystals form an annulus around the neutron beam withthe sample at its center. The metal samples were 5.08 cm
in diameter, and the neutron beam was collimated to4.76 cm. Neutrons that scatter from the sample are ab-sorbed by a hollow cylindrical liner fabricated of boroncarbide ceramic to reduce the number of scattered neu-trons reaching the detector. The liner uses boron enrichedto 98.4 wt% 10B for maximum neutron absorption. Theliquid samples were 1.27 cm in diameter, and the neu-tron beam was collimated to 1.11 cm. The final collima-tor used for the liquid sample measurements was anannular cylinder of 10B powder placed inside the detec-tor just a few centimeters from the samples. The detectorsystem discriminates against the 478-keV gamma ray from10B~n,a! reactions. The efficiency of the capture detec-tor is assumed to be the same for all Gd isotopes. Refer-ence 14 contains a description of the detector and itssignal-processing electronics.
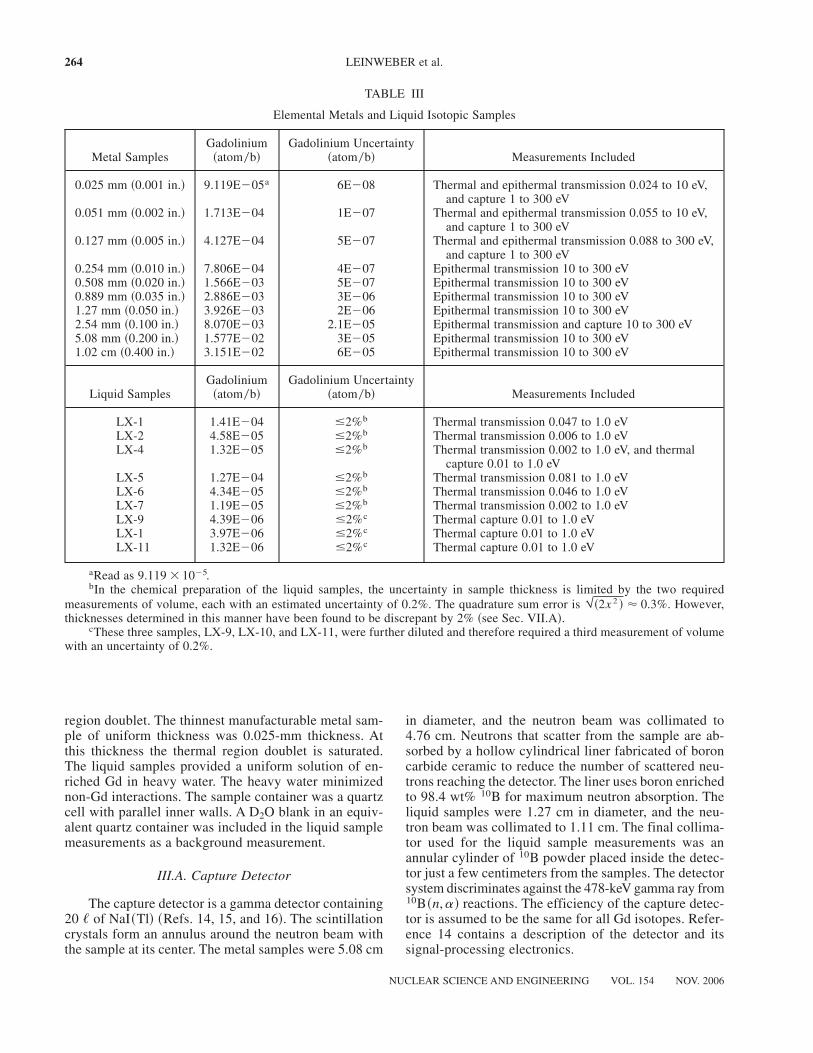
TABLE III
Elemental Metals and Liquid Isotopic Samples
Metal SamplesGadolinium~atom0b!
Gadolinium Uncertainty~atom0b! Measurements Included
0.025 mm ~0.001 in.! 9.119E�05a 6E�08 Thermal and epithermal transmission 0.024 to 10 eV,and capture 1 to 300 eV
0.051 mm ~0.002 in.! 1.713E�04 1E�07 Thermal and epithermal transmission 0.055 to 10 eV,and capture 1 to 300 eV
0.127 mm ~0.005 in.! 4.127E�04 5E�07 Thermal and epithermal transmission 0.088 to 300 eV,and capture 1 to 300 eV
0.254 mm ~0.010 in.! 7.806E�04 4E�07 Epithermal transmission 10 to 300 eV0.508 mm ~0.020 in.! 1.566E�03 5E�07 Epithermal transmission 10 to 300 eV0.889 mm ~0.035 in.! 2.886E�03 3E�06 Epithermal transmission 10 to 300 eV1.27 mm ~0.050 in.! 3.926E�03 2E�06 Epithermal transmission 10 to 300 eV2.54 mm ~0.100 in.! 8.070E�03 2.1E�05 Epithermal transmission and capture 10 to 300 eV5.08 mm ~0.200 in.! 1.577E�02 3E�05 Epithermal transmission 10 to 300 eV1.02 cm ~0.400 in.! 3.151E�02 6E�05 Epithermal transmission 10 to 300 eV
Liquid SamplesGadolinium~atom0b!
Gadolinium Uncertainty~atom0b! Measurements Included
LX-1 1.41E�04 �2%b Thermal transmission 0.047 to 1.0 eVLX-2 4.58E�05 �2%b Thermal transmission 0.006 to 1.0 eVLX-4 1.32E�05 �2%b Thermal transmission 0.002 to 1.0 eV, and thermal
capture 0.01 to 1.0 eVLX-5 1.27E�04 �2%b Thermal transmission 0.081 to 1.0 eVLX-6 4.34E�05 �2%b Thermal transmission 0.046 to 1.0 eVLX-7 1.19E�05 �2%b Thermal transmission 0.002 to 1.0 eVLX-9 4.39E�06 �2%c Thermal capture 0.01 to 1.0 eVLX-1 3.97E�06 �2%c Thermal capture 0.01 to 1.0 eVLX-11 1.32E�06 �2%c Thermal capture 0.01 to 1.0 eV
aRead as 9.119 � 10�5.bIn the chemical preparation of the liquid samples, the uncertainty in sample thickness is limited by the two required
measurements of volume, each with an estimated uncertainty of 0.2%. The quadrature sum error is M~2x 2 ! ' 0.3%. However,thicknesses determined in this manner have been found to be discrepant by 2% ~see Sec. VII.A!.
cThese three samples, LX-9, LX-10, and LX-11, were further diluted and therefore required a third measurement of volumewith an uncertainty of 0.2%.
264 LEINWEBER et al.
NUCLEAR SCIENCE AND ENGINEERING VOL. 154 NOV. 2006

III.B. Transmission Detectors
Neutron transmission measurements were conductedat the 15- and 25-m flight stations. The 15-m stationcontains a 7.62-cm ~3-in.!-diam, 0.3-cm-thick NE 9056Li glass scintillation detector ~6.6% lithium, enrichedto 95% in 6Li! and is used for measurements coveringthe energy range from 0.002 to 10 eV. The 25-m stationcontains a 12.70-cm ~5-in.!-diam, 1.27-cm-thick NE 9056Li glass detector and covers the range from 1 to 300 eV.Each detector is coupled to a photomultiplier tube.
Transmission samples along with empty sample hold-ers, which are used to measure the open-beam count rate,are mounted on an eight-position computer-controlledsample changer. The transmission function, which is ap-proximately the ratio of the count rate with a sample inthe beam to the count rate with samples removed, varieswith neutron energy. Each data run consists of one com-plete cycle through the samples, with a predeterminednumber of linac bursts for each sample position. Thedistribution of bursts per sample position is chosen tominimize the counting statistical error in the measuredcross section.21
IV. DATA REDUCTION
IV.A. Capture Data
Neutron capture data taking and data reduction tech-niques at the Rensselaer Polytechnic Institute ~RPI! linacare described in Refs. 22 and 23.
For the thermal measurement of liquid samples, back-ground was determined using a cell containing D2O. Forthe epithermal measurement of metal samples, back-ground was determined using empty aluminum samplecans.
Processed capture data are expressed as yield. Yieldis defined as the number of neutron captures per neutronincident on the sample. Therefore, in addition to the sam-ple data, another set of data was needed to determine theenergy profile of the neutron flux. This was done bymounting a thick 10B4C sample in the sample changerand adjusting the total energy threshold to record the478-keV gamma rays from neutron absorption in 10B.The boron absorption spectrum provides an accurate rep-resentation of the energy profile of the linac’s neutronbeam flux convoluted with the 10v boron ~n,a! crosssection. These flux data give the shape of the neutronbeam flux but not its magnitude. The thermal flux wassmoothed using a cubic spline interpolation. The thermalyield was normalized to the transmission data in a com-bined SAMMY fit. The epithermal flux was normalizedto the black 6.3-eV predominantly-capture resonance inGd. A small correction ~1.8%! was made for the scatter-ing in the 6.3-eV normalizing resonance. The 2.54-mm~100-mil! sample data were used for this normalization.
The zero time for each experiment was determinedby performing a “gamma flash” measurement. The burstof gamma rays accompanying the neutron burst is de-tected by the capture detector. The centroid of the gamma-flash peak, less the time for light to travel the length ofthe flight path, is defined as the zero time of neutronproduction.
Finally, Yi , the capture yield in TOF channel i , wascalculated by
Yi �Ci � Bi
Kfi
, ~1!
where
Ci � dead-time–corrected and monitor-normalizedcounting rate of the sample measurement
Bi � dead-time–corrected and monitor-normalizedbackground counting rate
K � product of the flux normalization factor andefficiency
Fi � unnormalized neutron flux.
It was this capture yield and its associated statisticaluncertainty that provided input to the SAMMY data analy-sis code24 that extracted the neutron resonance parameters.
Four liquid capture samples were used in the analy-sis of the thermal region. The low-energy cutoff for cap-ture data in the thermal region was 0.01 eV. Four naturalmetal samples were used in the epithermal region, 1 to300 eV.
The flux-to-background ratio in the liquid samplethermal capture experiment peaked at approximately 35-to-1 at 0.1 eV, is 20-to-1 at the thermal region doublet,and fell to 3-to-1 at 0.01 eV. Capture data were not usedbelow 0.01 eV The flux-to-background ratio for the nat-ural metal epithermal capture experiment was approxi-mately 400-to-1 from 150 to 300 eV and fell steadilyto 300-to-1 at 40 eV, to 200-to-1 at 10 eV, and 80-to-1 at2 eV.
IV.B. Transmission Data
For the thermal measurement, liquid sample cellscontaining D2O were used as the open beam measure-ment. In this way the effect of the D2O and quartz in thesample and open cells would cancel in transmission.
The time-dependent background was obtained withthe one-notch0two-notch method.25 The transmissionfunction was calculated from Eq. ~2!:
Ti �~Ci
S � KS Bi � BS !
~CiO � KO Bi � BO !
, ~2!
GADOLINIUM CROSS-SECTION MEASUREMENTS 265
NUCLEAR SCIENCE AND ENGINEERING VOL. 154 NOV. 2006

where
Ti � transmission in TOF channel i
CiS ,Ci
O � dead-time–corrected and monitor-normalized counting rates of the sampleand open measurements, respectively
Bi � time-dependent background counting rate
BS , BO � steady-state background counting ratesfor sample and open measurements,respectively
KS , KO � normalization factors for the sampleand open background measurements,respectively.
The backgrounds of the two thermal liquid samplemeasurements were normalized to extrapolated notch datain Cd at 0.15 eV.
Correction factors of up to 1.3% were applied toLX-1, LX-5, and LX-6 thermal transmission data dueto sample misalignment, so that their transmissions wentto zero in the saturated low-energy region.
For the thermal metal measurement, a single expo-nential function was used to interpolate between twoknown background points: a fixed indium notch at 1.4eV and the region below 0.01 eV, where all metal Gdsamples are black. Normalization constants KS and KO
were fixed at 1.0 for the thermal metal measurement.Each sample’s background function was calculatedindividually.
The background of the first epithermal measurementwas normalized to the extrapolated notch in silver at 5.2eV for all samples except the 1.02-cm ~400-mil! sample,which was normalized at the saturated 20.5-eV reso-nance in Gd.
The background of the second epithermal measure-ment was normalized to the extrapolated notch in tung-sten at 18.8 eV.
The epithermal flight path length ~'25.6 m! andzero time were fitted to match the energies from epither-mal capture data.
Seven liquid transmission data sets were used in thethermal analysis. Three natural metal samples were usedin the thermal and epithermal energy ranges up to 10 eV.Eleven additional natural metal transmission data setswere used in the epithermal analysis from 1 to 300 eV.
The signal-to-background ratios for the two liquidsample thermal experiments peaked at 2000-to-1 near0.5 eV. The ratio in the region of the two strong thermalresonances in Gd was 1000-to-1. Signal-to-backgroundfell to 10-to-1 at 2 meV, the lowest energy at which datawere used. Signal-to-background ratios for the metalsample thermal experiment was 1000-to-1 or greaterfrom thermal energies through 0.1 eV with a peak valueof 2000-to-1 at 0.06 eV. The ratio fell to 200-to-1 at0.5 eV and remained steady at 200-to-1 out to 10 eV.
Signal-to-background ratios for the two metal sampleepithermal experiments were rather constant with en-ergy at approximately 45-to-1 for the boron-filteredexperiment and approximately 75-to-1 for the cadmium-filtered experiment.
V. ANALYSIS METHODS
Resonance parameters, neutron width Gn , radiationwidth Gg , and resonance energy E0, were extracted fromthe capture and transmission data sets using the SAMMYversion M6 multilevel R-matrix Bayesian code.24 Thiswas a combined transmission and capture analysis, whichemployed the resolution broadening, self-shielding,multiple-scattering, and diluent features of SAMMY. Thepresent measurements assumed the same spin assign-ments as ENDF for all resonances analyzed.
In the liquid thermal capture measurement, a D2O-only “blank” cell was used to measure background. Thedata were processed by subtracting the blank from theGd plus D2O capture data. The SAMMY geometry con-sists of a homogeneous mixture of Gd and D2O. Thethree-dimensional geometry in MCNP ~Ref. 26! alloweda realistic treatment of the neutron scattering and capturein Gd, D2O, and the quartz cells. The resulting correc-tion factors were applied to the liquid capture yield data.The factors ranged from 1.02 at 0.01 eV to 0.995 at 0.1 eV.They accounted primarily for quartz scattering and sub-sequent capture in Gd, which could not be modeled inSAMMY. More details are provided in Ref. 1.
For liquid thermal transmission analysis, no diluent,i.e., D2O, specifications are needed. That is because D2O-only blank cells are used for the open beam measure-ment, and therefore, the effect of the diluent cancelsexperimentally from the transmission, defined as ~quartz�sample � diluent!0~quartz � diluent-only open beam!.Therefore, the SAMMY model includes only Gd. Thepresence of Gd in the samples is so dilute that there is noneed to account for D2O displaced by the Gd.
The following assumptions were made for theSAMMY analysis:
1. Background was not fitted during the SAMMYanalysis, which determined the final resonance param-eters. Background was only varied in transmission in the10- to 80-eV region as a sensitivity study for the purposeof determining uncertainties.
2. Resonance parameters of the two bound level res-onances of Gd ~152Gd and 154Gd! were not varied.
3. Resonance parameters of 152Gd were not variedbecause of its low abundance ~0.2%!. They were fixed toENDF values.
4. Normalization of the liquid sample thermal cap-ture data was varied within a combined capture and trans-mission SAMMY fit.
266 LEINWEBER et al.
NUCLEAR SCIENCE AND ENGINEERING VOL. 154 NOV. 2006

5. Normalization was not varied for either captureor transmission in the epithermal region.
6. Energy regions over which each sample has beenfitted are given in Table III. Low-energy cutoffs werechosen at a point where transmission falls below 1%.The thermal flux peaks at '0.08 eV and drops off rap-idly with decreasing energy. The combination of lowflux and the highly absorbing nature of gadolinium atsubthermal energies led to regions of low transmissionwhere the accuracy of the background treatment isimportant.
7. There were concerns about background in bothepithermal transmission measurements using metal sam-ples below 80 eV, and particularly below 10 eV. There-fore, the low-energy cutoff for these data sets was 10 eV.
The potential scattering lengths used in the presentanalysis for gadolinium are taken from ENDF. The po-tential scattering lengths used for deuterium and oxygenin the liquid samples were 5.20 and 5.46 fm, respec-tively. These radii were calculated from potential scat-tering cross sections, deuterium ss � 3.4 b and oxygenss � 3.75 b ~Ref. 27!.
The potential scattering lengths for each of the gad-olinium isotopes except 152Gd were varied with SAMMYto obtain a better fit to the thick ~5.08-mm! transmissiondata. The resulting potential scattering lengths were sim-ilar to ENDF, 60.1 fm.
The radius to be used for penetrabilities and shiftswere calculated using Eq. ~3! ~Ref. 8!:
a � 1.23 � AWRI 103 � 0.8 , ~3!
where a is the channel radius and AWRI is the atomicweight given in the ENDF file. This atomic weight isbased on the mass of the neutron rather than amu.
The effective temperature was 293 K, and no exter-nal R-function was employed. Distant resonances wererepresented by including all of the resonances present inthe ENDF file. No p-wave resonances were observed inthe energy range currently being reported.
The manufacturer-specified tantalum content of thenatural metal samples was 0.1%. A SAMMY fit of thick
samples to the strong 4.28-eV resonance in tantalumyielded an abundance of 0.13%, which was used in allresonance parameter fits. That is, all ENDF resonancesfor Ta were included in all metal-sample SAMMY cal-culations with an abundance of 0.13%.
Resonance integrals are defined in Eq. ~4!:
RI � �0.5eV
`
sC ~E !dE
E, ~4!
where RI is the infinitely dilute capture resonance inte-gral ~in barns! and sC ~E ! is the neutron capture crosssection ~in barns!.
Resonance integrals and thermal cross sections werecalculated using the NJOY program.28 The resonanceintegrals were evaluated from 0.5 eV to 20 MeV. Onecalculation was performed using ENDF resonance pa-rameters, and one calculation was performed with RPIresonance parameters replacing the ENDF parametersfor all resonances below 300 eV. Results are presentedin Sec. VI.C.
VI. RESULTS
VI.A. Results: Thermal
Resonance parameters were determined in a co-variance-matrix–linked SAMMY calculation. The result-ing resonance parameters for the two thermal regionresonances are given in Table IV. ENDF0B-VI reso-nance parameters are nearly identical to those of Mølleret al.3 The uncertainties given in Ref. 3 are reported asENDF uncertainties in Table IV. The uncertainties givenin Table IV for the thermal region were estimated to beon the order of 1s and include the following consider-ations: internal consistency of the transmission data, re-producibility of transmission results, the uncertainty incapture flux normalization, and the balance of inter-actions between the overlapping 155Gd and 157Gd ther-mal resonances.
The methods used to estimate the RPI uncertaintiesare discussed in Sec. VII and Ref. 1. Since both of these
TABLE IV
Thermal Results: Resonance Parameters
DatasetEnergy~eV!
Gg~meV!
Gn~meV! Isotope J
ENDF-B0VI 0.02686 0.0002 1086 1 0.1046 0.002 155 20.03146 0.0002 1066 1 0.47046 0.0080 157 2
RPI 0.0256 0.003 1046 3 0.0976 0.003 155 20.0326 0.003 1076 3 0.4286 0.004 157 2
GADOLINIUM CROSS-SECTION MEASUREMENTS 267
NUCLEAR SCIENCE AND ENGINEERING VOL. 154 NOV. 2006
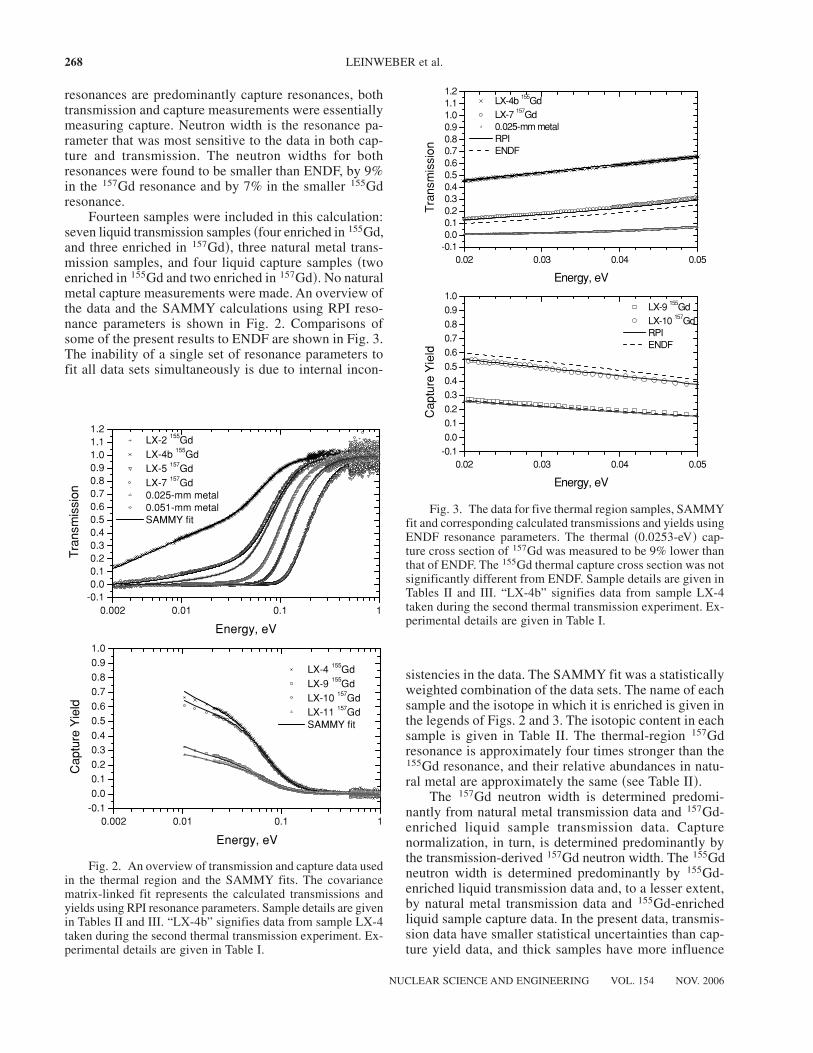
resonances are predominantly capture resonances, bothtransmission and capture measurements were essentiallymeasuring capture. Neutron width is the resonance pa-rameter that was most sensitive to the data in both cap-ture and transmission. The neutron widths for bothresonances were found to be smaller than ENDF, by 9%in the 157Gd resonance and by 7% in the smaller 155Gdresonance.
Fourteen samples were included in this calculation:seven liquid transmission samples ~four enriched in 155Gd,and three enriched in 157Gd!, three natural metal trans-mission samples, and four liquid capture samples ~twoenriched in 155Gd and two enriched in 157Gd!. No naturalmetal capture measurements were made. An overview ofthe data and the SAMMY calculations using RPI reso-nance parameters is shown in Fig. 2. Comparisons ofsome of the present results to ENDF are shown in Fig. 3.The inability of a single set of resonance parameters tofit all data sets simultaneously is due to internal incon-
sistencies in the data. The SAMMY fit was a statisticallyweighted combination of the data sets. The name of eachsample and the isotope in which it is enriched is given inthe legends of Figs. 2 and 3. The isotopic content in eachsample is given in Table II. The thermal-region 157Gdresonance is approximately four times stronger than the155Gd resonance, and their relative abundances in natu-ral metal are approximately the same ~see Table II!.
The 157Gd neutron width is determined predomi-nantly from natural metal transmission data and 157Gd-enriched liquid sample transmission data. Capturenormalization, in turn, is determined predominantly bythe transmission-derived 157Gd neutron width. The 155Gdneutron width is determined predominantly by 155Gd-enriched liquid transmission data and, to a lesser extent,by natural metal transmission data and 155Gd-enrichedliquid sample capture data. In the present data, transmis-sion data have smaller statistical uncertainties than cap-ture yield data, and thick samples have more influence
Fig. 2. An overview of transmission and capture data usedin the thermal region and the SAMMY fits. The covariancematrix-linked fit represents the calculated transmissions andyields using RPI resonance parameters. Sample details are givenin Tables II and III. “LX-4b” signifies data from sample LX-4taken during the second thermal transmission experiment. Ex-perimental details are given in Table I.
Fig. 3. The data for five thermal region samples, SAMMYfit and corresponding calculated transmissions and yields usingENDF resonance parameters. The thermal ~0.0253-eV! cap-ture cross section of 157Gd was measured to be 9% lower thanthat of ENDF. The 155Gd thermal capture cross section was notsignificantly different from ENDF. Sample details are given inTables II and III. “LX-4b” signifies data from sample LX-4taken during the second thermal transmission experiment. Ex-perimental details are given in Table I.
268 LEINWEBER et al.
NUCLEAR SCIENCE AND ENGINEERING VOL. 154 NOV. 2006
on derived resonance parameters than thin samples inboth capture and transmission.21
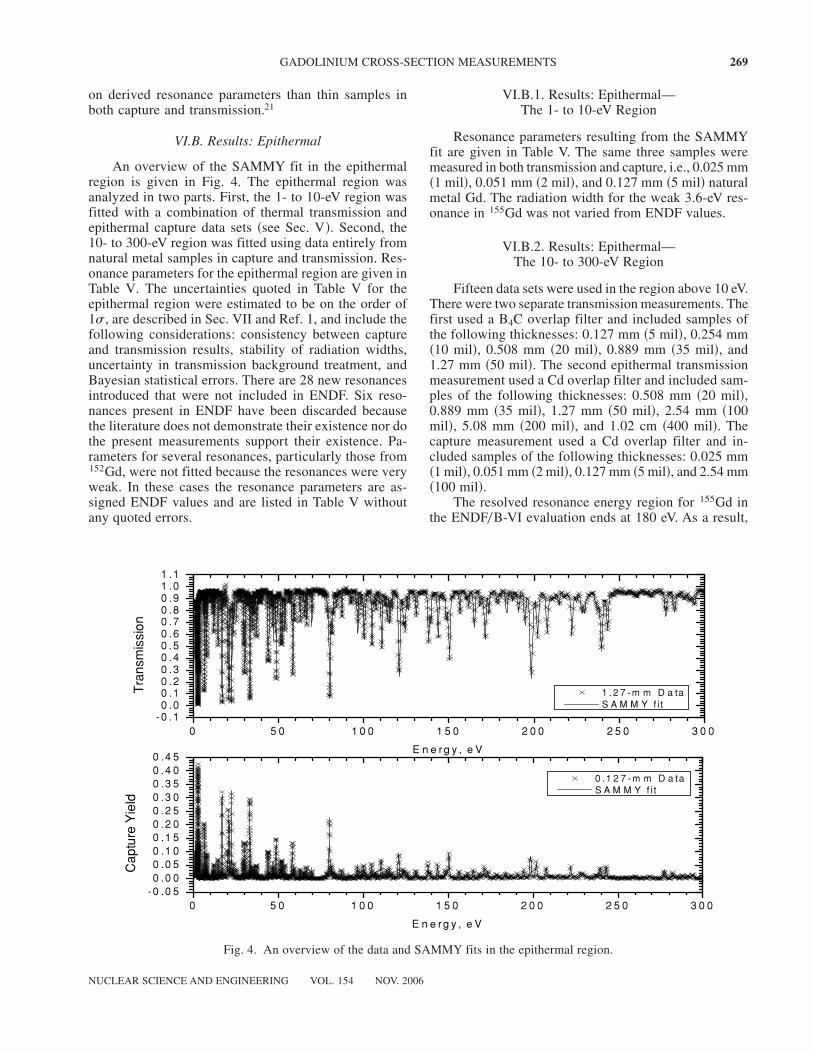
VI.B. Results: Epithermal
An overview of the SAMMY fit in the epithermalregion is given in Fig. 4. The epithermal region wasanalyzed in two parts. First, the 1- to 10-eV region wasfitted with a combination of thermal transmission andepithermal capture data sets ~see Sec. V!. Second, the10- to 300-eV region was fitted using data entirely fromnatural metal samples in capture and transmission. Res-onance parameters for the epithermal region are given inTable V. The uncertainties quoted in Table V for theepithermal region were estimated to be on the order of1s, are described in Sec. VII and Ref. 1, and include thefollowing considerations: consistency between captureand transmission results, stability of radiation widths,uncertainty in transmission background treatment, andBayesian statistical errors. There are 28 new resonancesintroduced that were not included in ENDF. Six reso-nances present in ENDF have been discarded becausethe literature does not demonstrate their existence nor dothe present measurements support their existence. Pa-rameters for several resonances, particularly those from152Gd, were not fitted because the resonances were veryweak. In these cases the resonance parameters are as-signed ENDF values and are listed in Table V withoutany quoted errors.
VI.B.1. Results: Epithermal—The 1- to 10-eV Region
Resonance parameters resulting from the SAMMYfit are given in Table V. The same three samples weremeasured in both transmission and capture, i.e., 0.025 mm~1 mil!, 0.051 mm ~2 mil!, and 0.127 mm ~5 mil! naturalmetal Gd. The radiation width for the weak 3.6-eV res-onance in 155Gd was not varied from ENDF values.
VI.B.2. Results: Epithermal—The 10- to 300-eV Region
Fifteen data sets were used in the region above 10 eV.There were two separate transmission measurements. Thefirst used a B4C overlap filter and included samples ofthe following thicknesses: 0.127 mm ~5 mil!, 0.254 mm~10 mil!, 0.508 mm ~20 mil!, 0.889 mm ~35 mil!, and1.27 mm ~50 mil!. The second epithermal transmissionmeasurement used a Cd overlap filter and included sam-ples of the following thicknesses: 0.508 mm ~20 mil!,0.889 mm ~35 mil!, 1.27 mm ~50 mil!, 2.54 mm ~100mil!, 5.08 mm ~200 mil!, and 1.02 cm ~400 mil!. Thecapture measurement used a Cd overlap filter and in-cluded samples of the following thicknesses: 0.025 mm~1 mil!, 0.051 mm ~2 mil!, 0.127 mm ~5 mil!, and 2.54 mm~100 mil!.
The resolved resonance energy region for 155Gd inthe ENDF0B-VI evaluation ends at 180 eV. As a result,
Fig. 4. An overview of the data and SAMMY fits in the epithermal region.
GADOLINIUM CROSS-SECTION MEASUREMENTS 269
NUCLEAR SCIENCE AND ENGINEERING VOL. 154 NOV. 2006

TABLE V
Epithermal Results: Resonance Parameters
Energy~eV!
Energy ENDF~meV!
Gg~meV!
Gg ENDF~meV!
Gn ~2agGn forunassigned!~meV!
Gn ENDF~meV!
IsotopeENDF J ENDF
2.0120 6 0.0002 2.008 128 6 1 110.00 0.40 6 0.01 0.371 155 12.5729 6 0.0003 2.568 107.16 0.4 111.00 1.706 6 0.003 1.744 155 22.8287 6 0.0003 2.825 109.7 6 0.9 97.00 0.377 6 0.004 0.345 157 2
3.616 6 0.003 3.616 130 130.00 0.05 6 0.02 0.044 155 16.3057 6 0.0002 6.300 108.8 6 0.6 114.00 2.20 6 0.01 2.000 155 27.7477 6 0.0004 7.750 109 6 1 124.00 1.16 6 0.01 1.120 155 2
9.9916 0.003 10.010 110 6 20 115.00 0.20 6 0.04 0.168 155 211.508 6 0.001 11.530 120 6 40 125.00 0.78 6 0.08 0.600 155 1
11.57 6 0.05 11.580 90 6 80 88.00 0.2 6 0.2 0.350 154 12_
11.964 6 0.008 11.990 130 6 20 112.00 1.12 6 0.04 0.880 155 212.35 12.350 58.6 58.60 4.65 4.650 152 1
2_
14.476 6 0.009 14.510 130 6 10 103.00 3.43 6 0.09 3.200 155 116.2016 0.005 16.240 130 6 30 91.00 0.44 6 0.03 0.400 157 116.78 6 0.01 16.770 112 6 7 80.50 13.9 6 0.5 12.800 157 2
17.729 6 0.005 17.770 130 6 40 120.00 0.47 6 0.04 0.392 155 219.86 6 0.01 19.920 118 6 6 104.00 4.5 6 0.1 4.560 155 220.516 0.02 20.560 106 6 8 88.00 13.4 6 0.4 11.360 157 220.97 6 0.02 21.030 140 6 20 98.00 11.6 6 0.5 15.600 155 221.59 6 0.02 21.650 80 6 40 114.00 0.34 6 0.08 0.376 157 222.30 6 0.04 22.300 100 6 40 96.00 7.16 0.8 6.000 158 1
2_
22.5 6 0.2 22.330 100 6 100 88.00 20 6 10 11.500 154 12_
23.28 6 0.03 23.330 140 6 30 121.00 1.3 6 0.3 0.813 157 123.60 6 0.02 23.670 140 6 10 120.00 2.916 0.08 3.120 155 225.35 6 0.01 25.400 130 6 30 85.00 1.99 6 0.06 1.840 157 2
27.509 6 0.002 27.570 140 6 20 125.00 1.316 0.04 1.120 155 129.50 6 0.02 29.580 113 6 2 108.00 4.8 6 0.1 4.320 155 230.05 6 0.02 30.100 130 6 10 100.00 11.16 0.5 10.400 155 231.66 6 0.01 31.720 140 6 20 118.00 1.24 6 0.07 1.120 155 2
33.16 0.2 33.140 110 6 30 109.80 1.6 6 0.6 1.867 155 133.14 6 0.03 33.230 98 6 3 90.00 14 6 2 14.600 156 1
2_
33.4 6 0.3 33.510 120 6 90 115.00 16 4 1.600 155 134.73 6 0.02 34.830 1316 4 152.00 6.8 6 0.2 6.133 155 135.39 6 0.01 35.470 140 6 10 118.00 2.17 6 0.06 1.840 155 2
36.86 36.860 56 56.00 84 84.000 152 12_
37.066 6 0.003 37.120 139 6 6 101.00 8.3 6 0.3 8.400 155 138.93 6 0.01 39.000 130 6 60 118.00 1.25 6 0.07 1.040 155 2
39.30 39.300 56 56.00 39 39.000 152 12_
40.08 6 0.01 40.170 120 6 40 110.00 1.6 6 0.2 1.307 157 142.73 42.730 56 56.00 3.06 3.060 152 1
2_
43.83 6 0.07 43.920 140 6 90 136.00 18 6 9 17.333 155 144.116 0.04 44.220 120 6 70 96.00 9 6 5 8.960 157 245.98 6 0.02 46.100 128 6 6 126.00 2.3 6 0.1 2.240 155 246.79 6 0.02 46.870 140 6 30 100.00 10.2 6 0.4 5.360 155 247.18 6 0.04 47.070 89 6 8 88.00 2.4 6 0.6 3.200 154 1
2_
47.628 6 0.006 47.730 107 6 10 109.80 0.39 6 0.03 0.653 155 148.68 6 0.03 48.790 118 6 9 90.00 26.7 6 0.5 24.000 157 249.63 6 0.07 49.500 90 6 40 88.00 3 6 1 1.800 154 1
2_
51.25 6 0.03 51.380 130 6 30 109.80 20.3 6 0.6 18.667 155 152.016 0.03 52.130 140 6 20 115.00 20.9 6 0.8 19.467 155 152.89 6 0.02 53.030 80 6 30 109.80 1.2 6 0.2 1.360 155 253.62 6 0.02 53.740 140 6 30 92.00 8.7 6 0.2 7.680 155 256.12 6 0.01 56.220 120 6 40 120.00 2.5 6 0.1 2.160 155 258.26 6 0.03 58.300 140 6 20 101.00 32.0 6 0.6 28.000 157 2
~Continued!
270 LEINWEBER et al.
NUCLEAR SCIENCE AND ENGINEERING VOL. 154 NOV. 2006
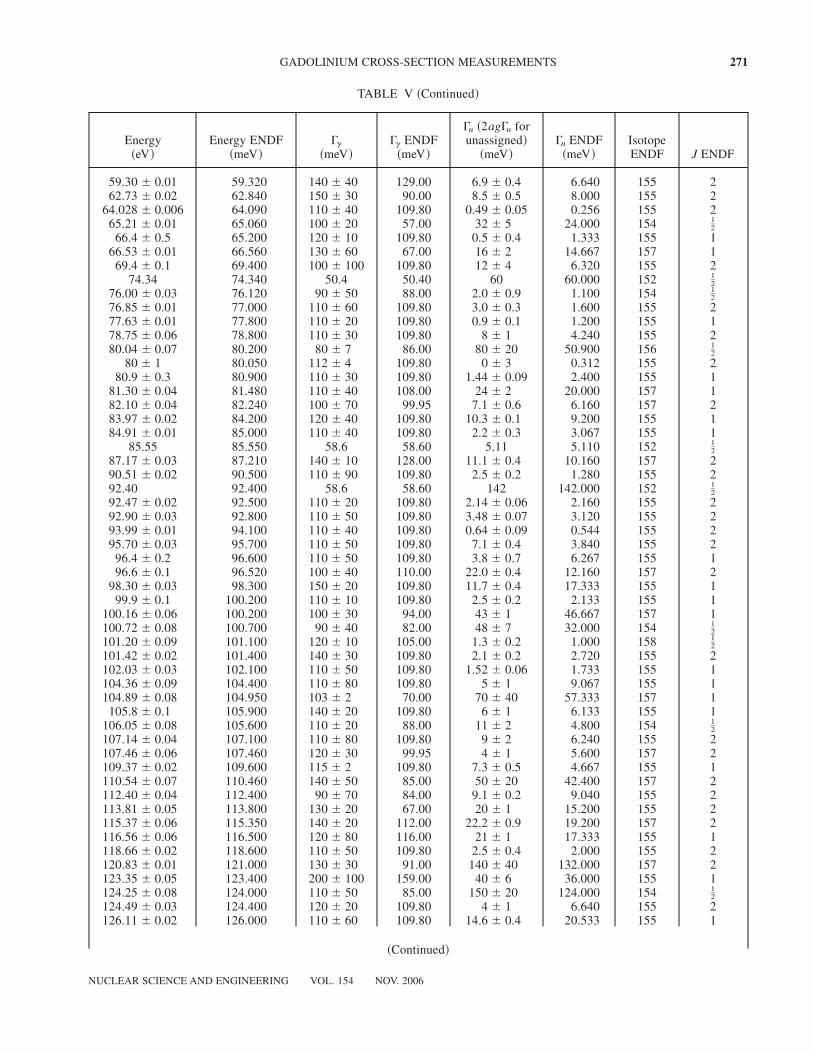
TABLE V ~Continued!
Energy~eV!
Energy ENDF~meV!
Gg~meV!
Gg ENDF~meV!
Gn ~2agGn forunassigned!~meV!
Gn ENDF~meV!
IsotopeENDF J ENDF
59.30 6 0.01 59.320 140 6 40 129.00 6.9 6 0.4 6.640 155 262.73 6 0.02 62.840 150 6 30 90.00 8.5 6 0.5 8.000 155 2
64.028 6 0.006 64.090 110 6 40 109.80 0.49 6 0.05 0.256 155 265.21 6 0.01 65.060 100 6 20 57.00 32 6 5 24.000 154 1
2_
66.4 6 0.5 65.200 120 6 10 109.80 0.5 6 0.4 1.333 155 166.53 6 0.01 66.560 130 6 60 67.00 16 6 2 14.667 157 1
69.4 6 0.1 69.400 100 6 100 109.80 12 6 4 6.320 155 274.34 74.340 50.4 50.40 60 60.000 152 1
2_
76.00 6 0.03 76.120 90 6 50 88.00 2.0 6 0.9 1.100 154 12_
76.85 6 0.01 77.000 110 6 60 109.80 3.0 6 0.3 1.600 155 277.63 6 0.01 77.800 110 6 20 109.80 0.9 6 0.1 1.200 155 178.75 6 0.06 78.800 110 6 30 109.80 8 6 1 4.240 155 280.04 6 0.07 80.200 80 6 7 86.00 80 6 20 50.900 156 1
2_
80 6 1 80.050 112 6 4 109.80 0 6 3 0.312 155 280.9 6 0.3 80.900 110 6 30 109.80 1.44 6 0.09 2.400 155 1
81.30 6 0.04 81.480 110 6 40 108.00 24 6 2 20.000 157 182.10 6 0.04 82.240 100 6 70 99.95 7.1 6 0.6 6.160 157 283.97 6 0.02 84.200 120 6 40 109.80 10.3 6 0.1 9.200 155 184.91 6 0.01 85.000 110 6 40 109.80 2.2 6 0.3 3.067 155 1
85.55 85.550 58.6 58.60 5.11 5.110 152 12_
87.17 6 0.03 87.210 140 6 10 128.00 11.1 6 0.4 10.160 157 290.51 6 0.02 90.500 110 6 90 109.80 2.5 6 0.2 1.280 155 292.40 92.400 58.6 58.60 142 142.000 152 1
2_
92.47 6 0.02 92.500 110 6 20 109.80 2.14 6 0.06 2.160 155 292.90 6 0.03 92.800 110 6 50 109.80 3.48 6 0.07 3.120 155 293.99 6 0.01 94.100 110 6 40 109.80 0.64 6 0.09 0.544 155 295.70 6 0.03 95.700 110 6 50 109.80 7.1 6 0.4 3.840 155 2
96.4 6 0.2 96.600 110 6 50 109.80 3.8 6 0.7 6.267 155 196.6 6 0.1 96.520 100 6 40 110.00 22.0 6 0.4 12.160 157 2
98.30 6 0.03 98.300 150 6 20 109.80 11.7 6 0.4 17.333 155 199.9 6 0.1 100.200 110 6 10 109.80 2.5 6 0.2 2.133 155 1
100.16 6 0.06 100.200 100 6 30 94.00 43 6 1 46.667 157 1100.72 6 0.08 100.700 90 6 40 82.00 48 6 7 32.000 154 1
2_
101.20 6 0.09 101.100 120 6 10 105.00 1.3 6 0.2 1.000 158 12_
101.42 6 0.02 101.400 140 6 30 109.80 2.1 6 0.2 2.720 155 2102.03 6 0.03 102.100 110 6 50 109.80 1.52 6 0.06 1.733 155 1104.36 6 0.09 104.400 110 6 80 109.80 5 6 1 9.067 155 1104.89 6 0.08 104.950 103 6 2 70.00 70 6 40 57.333 157 1
105.8 6 0.1 105.900 140 6 20 109.80 6 6 1 6.133 155 1106.05 6 0.08 105.600 110 6 20 88.00 11 6 2 4.800 154 1
2_
107.14 6 0.04 107.100 110 6 80 109.80 9 6 2 6.240 155 2107.46 6 0.06 107.460 120 6 30 99.95 4 6 1 5.600 157 2109.37 6 0.02 109.600 115 6 2 109.80 7.3 6 0.5 4.667 155 1110.54 6 0.07 110.460 140 6 50 85.00 50 6 20 42.400 157 2112.40 6 0.04 112.400 90 6 70 84.00 9.1 6 0.2 9.040 155 2113.81 6 0.05 113.800 130 6 20 67.00 20 6 1 15.200 155 2115.37 6 0.06 115.350 140 6 20 112.00 22.2 6 0.9 19.200 157 2116.56 6 0.06 116.500 120 6 80 116.00 21 6 1 17.333 155 1118.66 6 0.02 118.600 110 6 50 109.80 2.5 6 0.4 2.000 155 2120.83 6 0.01 121.000 130 6 30 91.00 140 6 40 132.000 157 2123.35 6 0.05 123.400 200 6 100 159.00 40 6 6 36.000 155 1124.25 6 0.08 124.000 110 6 50 85.00 150 6 20 124.000 154 1
2_
124.49 6 0.03 124.400 120 6 20 109.80 4 6 1 6.640 155 2126.11 6 0.02 126.000 110 6 60 109.80 14.6 6 0.4 20.533 155 1
~Continued!
GADOLINIUM CROSS-SECTION MEASUREMENTS 271
NUCLEAR SCIENCE AND ENGINEERING VOL. 154 NOV. 2006

TABLE V ~Continued!
Energy~eV!
Energy ENDF~meV!
Gg~meV!
Gg ENDF~meV!
Gn ~2agGn forunassigned!~meV!
Gn ENDF~meV!
IsotopeENDF J ENDF
128.53 6 0.02 128.600 110 6 30 109.80 1.7 6 0.2 1.120 155 2129.82 6 0.01 129.800 110 6 40 109.80 3.4 6 0.3 2.560 155 2130.79 6 0.01 130.800 150 6 30 109.80 22 6 3 48.533 155 1131.37 6 0.01 New 130 6 10 New 1.27 6 0.08 New Unassigned133.04 6 0.01 133.000 140 6 20 109.80 5.3 6 0.4 3.733 155 1133.95 6 0.01 133.800 110 6 30 109.80 3.4 6 0.2 2.320 155 2135.13 6 0.02 134.700 110 6 60 109.80 1.9 6 0.1 0.880 155 2
Discarded 135.100 99.95 0.880 157 2Discarded 137.900 99.95 78.667 157 1
137.99 6 0.08 137.800 120 6 80 109.80 90 6 30 21.333 155 1138.2 6 0.2 138.700 100 6 10 86.00 21 6 9 82.667 157 1138.9 6 0.2 139.200 94 6 8 91.00 40 6 10 124.000 154 1
2_
139.37 6 0.05 139.300 100 6 70 99.95 40 6 10 10.000 157 1140.00 140.000 58.6 58.60 78.8 78.800 152 1
2_
140.55 6 0.05 140.400 130 6 10 109.80 4.9 6 0.3 4.133 155 1141.30 6 0.01 141.400 120 6 10 109.80 1.69 6 0.08 1.040 155 2143.75 6 0.01 143.610 130 6 30 88.00 60 6 10 60.000 157 2145.66 6 0.01 145.600 150 6 20 109.80 6.5 6 0.3 6.160 155 2147.02 6 0.01 146.900 130 6 10 109.80 5.3 6 0.2 3.760 155 2
148.2 6 0.2 148.400 120 6 20 88.00 46 6 10 38.000 154 12_
148.4 6 0.3 148.200 110 6 10 109.80 8.6 6 0.9 9.600 155 2148.55 6 0.05 148.310 140 6 30 99.95 24 6 1 24.000 157 1149.53 6 0.03 149.600 110 6 40 109.80 36 6 2 33.333 155 1150.37 6 0.04 150.200 110 6 40 109.80 80 6 30 24.800 155 2150.62 6 0.03 151.200 80 6 30 86.00 23 6 7 41.700 156 1
2_
152.27 6 0.01 152.200 150 6 40 109.80 6.2 6 0.8 8.000 155 1153.80 6 0.05 154.000 160 6 30 109.80 1.1 6 0.2 1.120 155 2
156.4 6 0.1 156.300 110 6 80 109.80 30 6 10 7.680 155 2156.70 6 0.02 156.430 140 6 50 91.00 13 6 5 19.760 157 2
160.00 160.000 58.6 58.60 2.83 2.830 152 12_
160.03 6 0.07 160.100 110 6 50 109.80 10.3 6 0.5 9.600 155 2161.57 6 0.08 161.600 150 6 20 109.80 21.6 6 0.8 20.000 155 2
164.8 6 0.2 164.500 98 6 7 77.00 158 6 2 105.000 154 12_
165.00 6 0.09 164.830 100 6 80 100.00 23 6 6 20.560 157 2168.20 6 0.09 168.300 123 6 6 109.80 31 6 4 30.133 155 1168.60 6 0.04 168.030 99.95 99.95 3.333 3.333 157 1
169.4 6 0.1 169.250 90 6 10 99.95 3.4 6 0.2 3.280 157 2170.2 6 0.1 170.300 80 6 30 109.80 8 6 1 8.320 155 2170.4 6 0.1 170.400 85 6 9 88.00 4.9 6 0.4 5.000 154 1
2_
171.2 6 0.2 171.250 100 6 10 99.95 120 6 40 44.000 157 1171.6 6 0.1 171.400 110 6 60 109.80 18 6 1 9.200 155 2173.5 6 0.1 173.500 110 6 80 109.80 33 6 2 32.800 155 2
173.80 173.800 30.1 30.10 86 86.000 152 12_
175.46 6 0.05 175.600 110 6 40 109.80 4.2 6 0.6 2.080 155 2177.99 6 0.02 178.000 130 6 10 109.80 13 6 2 9.733 155 1178.73 6 0.03 178.550 140 6 20 145.00 17.0 6 1.0 16.000 157 2180.34 6 0.04 180.400 110 6 40 109.80 9.7 6 0.3 14.667 155 1183.20 6 0.05 New 110 6 40 New 1.3 6 0.2 New Unassigned183.94 6 0.07 183.830 100 6 90 99.95 34 6 8 17.600 157 2185.11 6 0.04 New 110 6 60 New 0.6 6 0.1 New Unassigned
185.70 185.700 52.5 52.50 84 84.000 152 12_
187.36 6 0.07 New 100 6 100 New 3.5 6 0.2 New Unassigned189.30 6 0.06 New 100 6 80 New 0.3 6 0.1 New Unassigned
190.9 6 0.1 190.730 100 6 90 99.95 60 6 60 28.000 157 1
~Continued!
272 LEINWEBER et al.
NUCLEAR SCIENCE AND ENGINEERING VOL. 154 NOV. 2006

TABLE V ~Continued!
Energy~eV!
Energy ENDF~meV!
Gg~meV!
Gg ENDF~meV!
Gn ~2agGn forunassigned!~meV!
Gn ENDF~meV!
IsotopeENDF J ENDF
194.6 6 0.1 194.530 110 6 50 99.95 60 6 80 44.800 157 2198.4 6 0.2 198.100 92 6 4 86.00 200 6 100 270.000 156 1
2_
199.5 6 0.2 201.600 60 6 40 88.00 80 6 50 11.700 154 12_
Discarded 201.600 86.00 17.000 156 12_
201.99 6 0.01 202.100 160 6 40 86.00 50 6 10 266.000 156 12_
Discarded 202.740 99.95 9.600 157 1203.10 203.100 58.8 58.80 97 97.000 152 1
2_
203.39 6 0.02 New 130 6 10 New 0.98 6 0.04 New Unassigned205.75 6 0.04 205.350 110 6 10 99.95 2.0 6 0.1 0.976 157 2
Discarded 206.900 99.95 1.360 157 2Discarded 207.700 58.60 5.230 152 1
2_
207.77 6 0.04 207.810 150 6 20 114.00 110 6 30 108.000 157 2209.1 6 0.2 New 120 6 10 New 1.1 6 0.2 New Unassigned
210.32 6 0.01 New 140 6 20 New 2.78 6 0.06 New Unassigned211.57 6 0.02 211.000 99 6 8 88.00 45 6 1 35.000 154 1
2_
212.32 6 0.02 New 100 6 10 New 0.64 6 0.02 New Unassigned213.68 6 0.02 New 102 6 10 New 1.02 6 0.03 New Unassigned214.77 6 0.01 New 130 6 20 New 5.5 6 0.5 New Unassigned217.23 6 0.01 217.150 121 6 9 99.95 19.9 6 0.9 8.000 157 1218.57 6 0.02 New 140 6 10 New 1.89 6 0.03 New Unassigned220.24 6 0.08 220.900 150 6 20 99.95 8.3 6 0.4 4.000 157 1222.22 6 0.03 222.000 80 6 20 120.00 50 6 20 50.000 160 1
2_
223.30 223.300 64.2 64.20 301 301.000 152 12_
224.90 6 0.02 224.000 100 6 100 88.00 110 6 60 18.000 154 12_
227.91 6 0.02 228.300 100 6 100 99.95 52 6 3 6.560 157 2229.52 6 0.02 New 100 6 70 New 9.7 6 0.5 New Unassigned230.86 6 0.05 New 100 6 100 New 3.7 6 0.2 New Unassigned
231.40 231.400 62 62.00 46 46.000 152 12_
232.85 6 0.01 New 100 6 90 New 2.2 6 0.2 New Unassigned235.9 6 0.2 New 70 6 60 New 1.4 6 0.2 New Unassigned237.3 6 0.1 New 100 6 100 New 5.8 6 0.2 New Unassigned
238.00 238.000 100 100.00 223.6 223.600 152 12_
239.56 6 0.03 239.550 120 6 20 99.95 250 6 40 152.000 157 2243.17 6 0.01 242.700 90 6 20 105.00 50 6 20 60.000 158 1
2_
245.16 6 0.02 244.000 98 6 9 86.00 3.25 6 0.06 3.100 156 12_
246.80 6 0.01 244.600 118 6 9 99.95 19.8 6 0.5 4.400 157 1248.83 6 0.01 246.640 120 6 10 99.95 5.0 6 0.1 9.280 157 2250.51 6 0.02 250.200 130 6 10 99.95 8.2 6 0.2 5.733 157 1
252.40 252.400 52.4 52.40 127 127.000 152 12_
253.25 6 0.03 252.800 101 6 9 88.00 26 6 1 12.000 154 12_
254.87 6 0.01 255.000 130 6 10 99.95 18.6 6 0.5 3.600 157 1256.46 6 0.06 255.200 101 6 10 99.95 1.46 6 0.09 3.733 157 1258.01 6 0.01 257.500 91 6 7 88.00 40 6 1 34.000 154 1
2_
259.25 6 0.02 New 102 6 10 New 1.11 6 0.03 New Unassigned260.53 6 0.01 260.500 120 6 10 99.95 31 6 3 21.867 157 1262.56 6 0.01 New 104 6 10 New 0.96 6 0.02 New Unassigned264.89 6 0.01 New 110 6 10 New 1.30 6 0.03 New Unassigned266.05 6 0.01 265.610 110 6 10 99.95 7.9 6 0.2 6.400 157 2268.47 6 0.01 268.020 140 6 20 99.95 17.0 6 0.9 10.480 157 2269.57 6 0.03 269.200 120 6 20 88.00 50 6 10 28.000 154 1
2_
272.36 6 0.02 New 100 6 60 New 1.3 6 0.1 New Unassigned277.38 6 0.06 277.200 100 6 300 105.00 40 6 60 18.000 158 1
2_
279.40 6 0.03 New 98 6 10 New 0.44 6 0.03 New Unassigned282.60 282.600 49.1 49.10 145 145.000 152 1
2_
~Continued!
GADOLINIUM CROSS-SECTION MEASUREMENTS 273
NUCLEAR SCIENCE AND ENGINEERING VOL. 154 NOV. 2006

fitting data above 180 eV was performed without initialestimates for resonance locations and widths—a chal-lenging task.
Finally, if a resonance is clearly observed in bothtransmission and capture, it has been added to the data-base shown in Table V. In these cases, the isotope andspin are listed as unassigned, and their associated neu-tron widths are given as 2agGn , where a is abundanceand g is the statistical weighting factor: g � ~2J � 1!0
@2~2I � 1!# , where I is the spin of the target nucleus andJ is the total angular momentum of the compound state~also known as the spin state of the resonance! in units ofh02p where h is Planck’s constant.
An example of the detailed descriptions availablefor the entire epithermal region in Ref. 1 is repeated herefor the 200- to 225-eV region. Resonances in this regionare shown in Fig. 5. Four resonances from ENDF havebeen excluded from the present analysis: 201.6 eV in
TABLE V ~Continued!
Energy~eV!
Energy ENDF~meV!
Gg~meV!
Gg ENDF~meV!
Gn ~2agGn forunassigned!~meV!
Gn ENDF~meV!
IsotopeENDF J ENDF
282.28 6 0.05 281.640 110 6 100 99.95 70 6 30 38.400 157 2284.2 6 0.1 New 100 6 30 New 2.1 6 0.2 New Unassigned
285.24 6 0.05 New 150 6 40 New 2.7 6 0.4 New Unassigned287.89 6 0.04 287.330 100 6 50 99.95 25 6 3 14.240 157 2288.99 6 0.03 New 140 6 30 New 2.3 6 0.3 New Unassigned291.08 6 0.03 290.770 100 6 50 99.95 51 6 9 65.333 157 1292.37 6 0.07 New 130 6 30 New 2.2 6 0.2 New Unassigned
293.40 293.400 71 71.00 352 352.000 152 12_
294.16 6 0.01 293.700 130 6 30 99.95 49 6 8 36.800 157 2295.79 6 0.08 New 100 6 10 New 0.5 6 0.2 New Unassigned
298.0 6 0.1 New 110 6 10 New 0.38 6 0.08 New Unassigned
Fig. 5. An overview of transmission and capture data used in the 200- to 225-eV region and the SAMMY fits using the RPIparameters. The dashed lines represent the ENDF parameters for the thickest samples.
274 LEINWEBER et al.
NUCLEAR SCIENCE AND ENGINEERING VOL. 154 NOV. 2006

156Gd, 202.74 eV in 157Gd, 206.9 eV in 157Gd, and 207.7eV in 152Gd. There are two reasons for these omissions.First, no author has explicitly seen any of these fourresonances. Second, inclusion of these resonances doesnot improve the fit to the data.
There are four resonances listed in ENDF in the 201-to 203-eV region. The first of these, at 201.6 eV in 154Gd,was identified by Ref. 7. It has been moved to 199.4 eVin the present fit. The next two resonances, 201.6 eV in156Gd and 202.1 eV in 156Gd, have never both been ob-served. Mughabghab and Chrien4 and Coceva and Ste-fanon29 each saw a single resonance at 202.1 and 201.8eV, respectively. However, two resonances are listed inRef. 27 and in ENDF. Only one resonance is listed at 202eV in 156Gd in the present analysis. Another specificomission of a resonance listed in ENDF occurred at 206.9eV in 157Gd. This resonance is small in ENDF, Gn � 1.36meV, and cannot be traced to any of the Gd experimentsdiscussed in this paper. It does not improve the fit andhas been omitted from the present results. ENDF con-tains a 152Gd resonance at 207.7 eV, but a review of theliterature failed to reveal the source of this resonance.While, in general, 152Gd resonances were not varied,this particular resonance was omitted from the presentanalysis. The effect of removing this resonance on thewidths of the nearest resonance at 207.8 eV is negligible.
Seven new resonances have been added in the 200-to 225-eV region. The first, at 203.1 eV, is a shoulder onthe 202-eV resonance in 156Gd ~see Fig. 5!. A new reso-nance has been proposed at 209.1 eV. It is a shoulder onthe larger 207.77-eV resonance in 157Gd. Five more res-onances have been assigned at 210.32, 212.32, 213.68,214.77, and 218.57 eV to account for structure apparentin the data in Fig. 5.
VI.B.3. Results: Epithermal—Justification forNew Resonances
Figure 6 shows a “staircase” plot of gadolinium leveldensity including all new resonances added during thepresent analysis. The plot of observed levels versus en-ergy shows a good fit to a straight line that agrees withthe statistical model of the nucleus up to ;50 eV. Alllevels are s-wave. Elemental gadolinium is shown be-cause there is no assignment of isotope to the proposednew resonances. Above 50 eV a significant number oflevels are missed. Therefore, even with the resonancesadded in the present analysis, the expectation of constantlevel density versus energy is not exceeded.
VI.C. Results: Resonance Integrals andThermal Cross Sections
Thermal cross sections and infinitely dilute captureresonance integrals have been calculated using ENDFand RPI resonance parameters. The isotopic ENDF eval-uations used are from ENDF0B-VI updated through re-
lease 8. These files were processed using NJOY ~Ref. 28!into pointwise ~energy and cross-section! data, and iso-topic thermal ~2200 m0s! cross sections were obtained.The original ENDF files were then modified by replac-ing the original file 2 resonance parameters with thosedetermined in the present work for all resonances below300 eV. All resonances listed in Tables IV and V, exceptthose designated “Unassigned” in those tables, were in-cluded. The resulting modified-ENDF files were pro-cessed using NJOY ~Ref. 28!, and thermal cross sectionsand resonance integrals were obtained.
Thermal cross sections from the present measure-ments are compared to those of ENDF in Tables VI andVII. The most significant departure of the present re-sults from ENDF thermal capture cross sections is in157Gd. This 11% reduction ~from 254 000 b for ENDFto 226 000 b for RPI! is consistent with the '9% reduc-tion in neutron width for the thermal 157Gd resonance~see Table IV!. An insignificant reduction in thermalcapture cross section is seen in 155Gd. This is due to thecompeting effects of a 7% reduction in neutron widthcompensated by a 3.7% reduction in total width ~Gn �Gg! and an energy shift toward the thermal energy ~0.0253eV! point. The thermal capture cross section of elemen-tal gadolinium is '9% lower than that calculated fromENDF parameters.
A significant reduction of the thermal elastic crosssection ~Table VII! of the present results from ENDFoccurs in 157Gd ~from 1010 to 798 b!. Thermal elasticscattering cross sections are proportional to Gn
2. So, thereduction in the thermal elastic cross section of 157Gd isconsistent with the '9% reduction in neutron width for
Fig. 6. Staircase plot of elemental gadolinium observedlevels versus energy shows a good fit to a straight line up to;50 eV. Above 50 eV, even with the resonances added in thepresent analysis, the expectation of constant level density ver-sus energy is not exceeded.
GADOLINIUM CROSS-SECTION MEASUREMENTS 275
NUCLEAR SCIENCE AND ENGINEERING VOL. 154 NOV. 2006

the thermal 157Gd resonance ~see Table IV!. The thermalelastic scattering cross section for 157Gd has a large un-certainty since it is essentially the small difference oftwo large numbers ~total and capture cross sections!.Gadolinium-156 also exhibits a large deviation fromENDF in its small and statistically uncertain thermal elas-tic cross section. Gadolinium-156 has only two reso-nances below 100 eV. The increase in its thermal elasticcross section is due to the substantial increase in theneutron width of the 80 eV resonance ~see Table V!.However, the uncertainty on that neutron width ~seeTable V! encompasses the majority of the increase.
Resonance integrals ~Table VIII! are given for eachisotope as well as their contribution to the elementalvalues. The integrations extend from 0.5 eV to 20 MeV.The low-energy cutoff is above the thermal region dou-blet. The elemental resonance integral for Gd as mea-sured is 2.8% ~11 b! larger than that of ENDF. The largestfractional increases in isotopic contributions occur in154Gd and 158Gd; 154Gd and 158Gd have far fewer reso-nances than 155Gd or 157Gd. A 14% increase in the 158Gdresonance integral compared to ENDF was measured.This is dominated by the 22.3-eV resonance whose neu-tron width changed by approximately the same amount.
TABLE VI
Thermal Capture Cross Sections: A Comparison of ENDF0B-VI to RPI Results*
Thermal Capture Cross Sections
ENDF RPI
Isotope AbundanceThermalCapture
Contributionto Elemental Percent
ThermalCapture
Contributionto Elemental Percent
152Gd 0.200 1 050 2.10 0.00430 1 050 2.10 0.00430154Gd 2.18 85.0 1.85 0.00379 85.8 1.87 0.00422155Gd 14.80 60 700 8 980 18.4 60 200 8 910 20.1156Gd 20.47 1.71 0.350 0.000717 1.74 0.356 0.000804157Gd 15.65 254 000 39 800 81.6 226 000 35 400 79.9158Gd 24.84 2.01 0.499 0.00102 2.19 0.544 0.00122160Gd 21.86 0.765 0.167 0.000342 0.755 0.165 0.000372
Gd — 48 800 100.0 44 300 100.0
*The units of all cross sections are barns. The units of abundance are percent.
TABLE VII
Thermal Elastic Scattering Cross Sections: A Comparison of ENDF0B-VI to RPI Results*
Thermal Elastic Cross Sections
ENDF RPI
Isotope AbundanceThermalElastic
Contributionto Elemental Percent
ThermalElastic
Contributionto Elemental Percent
152Gd 0.200 23.4 0.0468 0.0277 23.4 0.0468 0.0342154Gd 2.18 7.29 0.159 0.0941 6.69 0.146 0.107155Gd 14.80 60.8 8.99 5.32 59.7 8.84 6.45156Gd 20.47 5.64 1.16 0.686 6.93 1.42 1.04157Gd 15.65 1010 157 92.9 798 125 91.2158Gd 24.84 3.30 0.820 0.485 3.27 0.812 0.593160Gd 21.86 3.63 0.795 0.470 3.63 0.794 0.580
Gd — 169 100.0 137 100.0
*The units of all cross sections are barns. The units of abundance are percent.
276 LEINWEBER et al.
NUCLEAR SCIENCE AND ENGINEERING VOL. 154 NOV. 2006
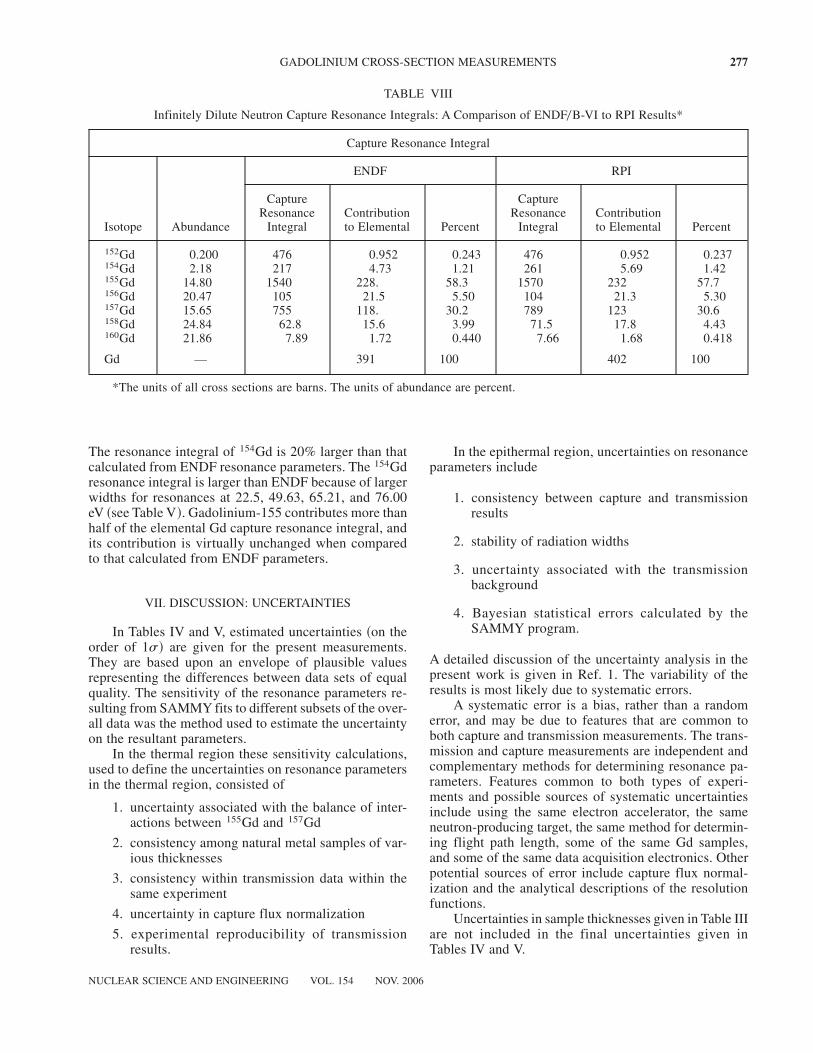
The resonance integral of 154Gd is 20% larger than thatcalculated from ENDF resonance parameters. The 154Gdresonance integral is larger than ENDF because of largerwidths for resonances at 22.5, 49.63, 65.21, and 76.00eV ~see Table V!. Gadolinium-155 contributes more thanhalf of the elemental Gd capture resonance integral, andits contribution is virtually unchanged when comparedto that calculated from ENDF parameters.
VII. DISCUSSION: UNCERTAINTIES
In Tables IV and V, estimated uncertainties ~on theorder of 1s! are given for the present measurements.They are based upon an envelope of plausible valuesrepresenting the differences between data sets of equalquality. The sensitivity of the resonance parameters re-sulting from SAMMY fits to different subsets of the over-all data was the method used to estimate the uncertaintyon the resultant parameters.
In the thermal region these sensitivity calculations,used to define the uncertainties on resonance parametersin the thermal region, consisted of
1. uncertainty associated with the balance of inter-actions between 155Gd and 157Gd
2. consistency among natural metal samples of var-ious thicknesses
3. consistency within transmission data within thesame experiment
4. uncertainty in capture flux normalization
5. experimental reproducibility of transmissionresults.
In the epithermal region, uncertainties on resonanceparameters include
1. consistency between capture and transmissionresults
2. stability of radiation widths
3. uncertainty associated with the transmissionbackground
4. Bayesian statistical errors calculated by theSAMMY program.
A detailed discussion of the uncertainty analysis in thepresent work is given in Ref. 1. The variability of theresults is most likely due to systematic errors.
A systematic error is a bias, rather than a randomerror, and may be due to features that are common toboth capture and transmission measurements. The trans-mission and capture measurements are independent andcomplementary methods for determining resonance pa-rameters. Features common to both types of experi-ments and possible sources of systematic uncertaintiesinclude using the same electron accelerator, the sameneutron-producing target, the same method for determin-ing flight path length, some of the same Gd samples,and some of the same data acquisition electronics. Otherpotential sources of error include capture flux normal-ization and the analytical descriptions of the resolutionfunctions.
Uncertainties in sample thicknesses given in Table IIIare not included in the final uncertainties given inTables IV and V.
TABLE VIII
Infinitely Dilute Neutron Capture Resonance Integrals: A Comparison of ENDF0B-VI to RPI Results*
Capture Resonance Integral
ENDF RPI
Isotope Abundance
CaptureResonance
IntegralContributionto Elemental Percent
CaptureResonance
IntegralContributionto Elemental Percent
152Gd 0.200 476 0.952 0.243 476 0.952 0.237154Gd 2.18 217 4.73 1.21 261 5.69 1.42155Gd 14.80 1540 228. 58.3 1570 232 57.7156Gd 20.47 105 21.5 5.50 104 21.3 5.30157Gd 15.65 755 118. 30.2 789 123 30.6158Gd 24.84 62.8 15.6 3.99 71.5 17.8 4.43160Gd 21.86 7.89 1.72 0.440 7.66 1.68 0.418
Gd — 391 100 402 100
*The units of all cross sections are barns. The units of abundance are percent.
GADOLINIUM CROSS-SECTION MEASUREMENTS 277
NUCLEAR SCIENCE AND ENGINEERING VOL. 154 NOV. 2006

VIII. CONCLUSIONS
Resonance parameters were extracted from com-bined capture and transmission data sets using the multi-level R-matrix Bayesian code SAMMY. The analysisincluded Doppler broadening, resolution broadening, andmultiple scattering correcting of capture data. Separateresolution functions for transmission and capture wereused.
The present measurements assumed the same spinassignments as ENDF for all resonances analyzed.
Neutron widths ~Table IV! and thermal ~2200 m0s!capture cross sections ~Table VI! of the thermal doubletare smaller than currently published ~ENDF! values. Theneutron widths in particular are significantly smaller thanthose of ENDF. The thermal ~2200 m0s! cross section of157Gd is 11% smaller than that of ENDF.
In the epithermal region, a great deal of improve-ment has been made to the Gd resonance parameter data-base. In the energy region near 96 eV, and particularlyabove 165 eV, significant changes are suggested to ENDFparameters. New resonances have been suggested wherecomparisons of data to calculations clearly show theyare needed.
Any future gadolinium measurement must be im-proved beyond the current methods. There were internalinconsistencies between thermal transmission and cap-ture results. There were internal inconsistencies withinthermal transmission measurements. The magnitude ofthese inconsistencies was quantified by the uncertaintieson the resonance parameters quoted in Table IV.
Results in the epithermal region could be improvedwith the use of separated isotopes. Samples would needto be thicker for this region than the samples producedfor use in the present measurement in the thermal region.That is, grams of separated isotopes would be needed forepithermal measurements.
REFERENCES
1. G. LEINWEBER, D. P. BARRY, M. J. TRBOVICH, J. A.BURKE, N. J. DRINDAK, H. D. KNOX, R. V. BALLAD,R. C. BLOCK, Y. DANON, and L. I. SEVERNYAK, “NeutronCapture and Transmission Measurements and Resonance Pa-rameter Analysis of Gadolinium,” U.S. Department of EnergyOffice of Scientific and Technical Information ~2005!.
2. P. F. ROSE and C. L. DUNFORD, “ENDF-102 Data For-mats and Procedures for the Evaluated Nuclear Data File ENDF-6,” BNL-NCS-44945, Rev. 2, Brookhaven National Laboratory~1997!.
3. H. BJERRUM MØLLER, F. J. SHORE, and V. L. SAILOR,“Low-Energy Neutron Resonances in Erbium and Gadolin-ium,” Nucl. Sci. Eng., 8, 183 ~1960!.
4. S. F. MUGHABGHAB and R. E. CHRIEN, “S-Wave Neu-tron Strength Functions of the Gd Isotopes,” Phys. Rev., 180,1131 ~1969!.
5. F. B. SIMPSON, “Neutron Resonance Parameters for Sm147,Sm149, Gd155, and Gd157,” Bull. Am. Phys. Soc., 2, 42~NA7!~1957!.
6. M. P. FRICKE, W. M. LOPEZ, S. J. FRIESENHAHN,A. D. CARLSON, and D. COSTELLO, “Neutron ResonanceParameters and Radiative Capture Cross Section of Gd from3 eV to 750 keV,” Nucl. Phys. A, 146, 337 ~1970!.
7. F. RAHN, H. S. CAMARDA, G. HACKEN, W. W. HA-VENS, Jr., H. I. LIOU, and J. RAINWATER, “Neutron Reso-nance Spectroscopy: 154,158,160Gd,” Phys. Rev. C (Nucl. Phys.),10, 1904 ~1974!.
8. V. A. ANUFRIEV, S. I. BABICH, and S. M. MASY-ONOV, EXFOR0CINDA Database, www.nndc.bnl.gov, NNDCCINDA EXFOR Accession #40984 ~1987!.
9. R. L. MACKLIN, “Neutron Capture Resonances of 152Gdand 154Gd,” Nucl. Sci. Eng., 95, 304 ~1987!.
10. F. N. BELYAEV, V. P. BOLOTSKIY, B. V. EFIMOV,and G. N. MURADYAN, EXFOR0CINDA Database, www.nndc.bnl.gov, NNDC CINDA EXFOR Accession #41107~1990!.
11. E. N. KARZHAVINA, N. N. PHONG, ad A. B. POPOV,EXFOR0CINDA Database, www.nndc.bnl.gov, NNDC CINDAEXFOR Accession #40162 ~1968!.
12. E. N. KARZHAVINA, K.-S. SU, and A. B. POPOV,EXFOR0CINDA Database, www.nndc.bnl.gov, NNDC CINDAEXFOR Accession #40405 ~1973!.
13. M. ASGHAR, P. ASGHAR, E. SILVER, and J. TRO-CHON, Nucl. Phys. A, 145, 549 ~1970!.
14. R. E. SLOVACEK, R. C. BLOCK, Y. DANON, C.WERNER, G.-U. YOUK, J. A. BURKE, N. J. DRINDAK,F. FEINER, J. A. HELM, and K. W. SEEMANN, “NeutronCross Section Measurements at the Rensselaer LINAC,” Proc.Topl. Mtg. Advances in Reactor Physics, Knoxville, Tennes-see, April 11–15, 1994, Vol. II, p. 193, American NuclearSociety ~1994!.
15. R. C. BLOCK, P. J. MARANO, N. J. DRINDAK, F.FEINER, K. W. SEEMANN, and R. E. SLOVACEK, “A Mul-tiplicity Detector for Accurate Low-Energy Neutron CaptureMeasurements,” Proc. Int. Conf. Nuclear Data for Science andTechnology, Mito, Japan, May 30–June 3,1988, p. 383.
16. R. C. BLOCK, Y. DANON, R. E. SLOVACEK, C. J.WERNER, G. YOUK, J. A. BURKE, N. J. DRINDAK, F.FEINER, J. A. HELM, J. C. SAYRES, and K. W. SEEMANN,“Neutron Time-of-Flight Measurements at the RensselaerLINAC,” Proc. Int. Conf. Nuclear Data for Science and Tech-nology, Gatlinburg, Tennessee, May 9–13, 1994, Vol. 1, p. 81,American Nuclear Society ~1994!.
278 LEINWEBER et al.
NUCLEAR SCIENCE AND ENGINEERING VOL. 154 NOV. 2006

17. M. E. OVERBERG, B. E. MORETTI, R. E. SLOVACEK,and R. C. BLOCK, “Photoneutron Target Development for theRPI Linear Accelerator,” Nucl. Instrum. Meth. Phys. Res. A,438, 253 ~1999!.
18. Y. DANON, R. E. SLOVACEK, and R. C. BLOCK, “TheEnhanced Thermal Neutron Target at the RPI LINAC,” Trans.Am. Nucl. Soc., 68, 473 ~1993!.
19. Y. DANON, R. E. SLOVACEK, and R. C. BLOCK, “De-sign and Construction of a Thermal Neutron Target for the RPILINAC,” Nucl. Instrum. Methods Phys. Res. A, 352, 596 ~1995!.
20. E. M. BAUM, H. D. KNOX, and T. R. MILLER, “Chart ofthe Nuclides,” 16th ed., Knolls Atomic Power Laboratory~2002!.
21. Y. DANON and R. C. BLOCK, Nucl. Instrum. MethodsPhys. Res. A, 485, 585 ~2002!.
22. G. LEINWEBER, J. A. BURKE, H. D. KNOX, N. J.DRINDAK, D. W. MESH, W. T. HAINES, R. V. BALLAD,R. C. BLOCK, R. E. SLOVACEK, C. J. WERNER, M. J. TR-BOVICH, D. P. BARRY, and T. SATO, “Neutron Capture andTransmission Measurements and Resonance Parameter Analy-sis of Samarium,” Nucl. Sci. Eng., 142, 1 ~2002!.
23. G. LEINWEBER, J. A. BURKE, C. R. LUBITZ, H. D.KNOX, N. J. DRINDAK, R. C. BLOCK, R. E. SLOVACEK,
C. J. WERNER, N. C. FRANCIS, Y. DANON, and B. E. MOR-ETTI, “Neutron Capture and Total Cross Section Measure-ments and Resonance Parameter Analysis of Zirconium up to2.5 keV,” Nucl. Sci. Eng., 134, 50 ~2000!.
24. N. M. LARSON, “Updated Users’ Guide for SAMMY:Multilevel R-Matrix Fits to Neutron Data Using Bayes’ Equa-tions,” ORNL0TM-91790R5, Lockheed Martin Energy Re-search Corporation, Oak Ridge National Laboratory ~2000!.
25. D. B. SYME, “The Black and White-Filter Method forBackground Determination in Neutron Time-of-Flight Spec-trometry,” Nucl. Instrum. Methods, 198, 357 ~1982!.
26. “MCNP—A General Monte Carlo N-Particle TransportCode, Version 5,” LA-UR-03-1987, J. F. BREISMEISTER, Ed.,Los Alamos National Laboratory ~Apr. 24, 2003!.
27. V. McLANE, P. F. ROSE, and C. L. DUNFORD, NeutronCross Sections, Vol. 2, Academic Press, New York ~1988!.
28. R. E. MacFARLANE and D. W. MUIR, “The NJOY Nu-clear Data Processing System Version 91,” LA-12740-M, LosAlamos National Laboratory ~Oct. 1994!.
29. C. COCEVA and M. STEFANON, Nucl. Phys. A, 315, 1~1979!.
GADOLINIUM CROSS-SECTION MEASUREMENTS 279
NUCLEAR SCIENCE AND ENGINEERING VOL. 154 NOV. 2006