Embed Size (px)
Citation preview
PHYSICAL REVIEW C 92, 024601 (2015)
Isotopic molybdenum total neutron cross section in the unresolved resonance region
R. Bahran,1,* D. Barry,2 R. Block,2 G. Leinweber,2 M. Rapp,2 A. Daskalakis,1 E. Blain,1 D. Williams,1,†B. McDermott,1 L. Leal,3 and Y. Danon1
1Gaerttner LINAC Center, Rensselaer Polytechnic Institute, Troy, New York 12180, USA2Bechtel Marine Propulsion Corp., Knolls Atomic Power Laboratory, P.O. Box 1072, Schenectady, New York 12301, USA
3Oak Ridge National Laboratory, Oak Ridge, Tennessee 37831-6171, USA(Received 20 November 2014; published 4 August 2015)
Accurate isotopic molybdenum nuclear data are important because molybdenum can exist in nuclear reactorcomponents including fuel, cladding, or as a high yield fission product. High-resolution time-of-flight neutrontransmission measurements on highly enriched isotopic metallic samples of 95Mo, 96Mo, 98Mo, and 100Mo wereperformed in the resonance energy range from 1 to 620 keV. The measurements were taken with the newlydeveloped modular 6Li-glass transmission detector positioned at the 100-m experimental flight station. In theunresolved energy region (URR), new comprehensive methods of analysis were developed and validated inorder to obtain accurate neutron total cross-section data from the measurement by correcting for backgroundand transmission enhancement effects. Average parameters and fits to the total cross section for 95Mo wereobtained using the Hauser-Feshbach statistical model code FITACS, which is currently incorporated into theSAMMY code. The fits to the experimental data deviate from the current evaluated nuclear data file/B-VII.1isotopic Mo evaluations by several percent in the URR.
DOI: 10.1103/PhysRevC.92.024601 PACS number(s): 25.40.−h, 28.20.−v
I. INTRODUCTION
High accuracy nuclear data are important in their appli-cation to neutron transport calculations used in the designand analysis of reactor fuel cycles, fusion systems, astrophys-ical systems, nuclear nonproliferation, safeguards, criticalitysafety, stockpile stewardship, radiation protection, shieldingcalculations, particle physics, and medical physics research.Experimental high accuracy data also help contribute to thegrowing understanding of nuclear reaction theory. In the unre-solved resonance region (URR), an accurate representation ofthe shape of the cross section can help validate nuclear modelsdeveloped to understand the underlying physical processes ofnuclear reactions and to predict general cross-section behavior.This paper reports neutron time-of-flight (TOF) transmissionmeasurements of highly enriched metallic samples of 95Mo,96Mo, 98Mo, and 100Mo that were performed at the GaerttnerLINAC Center at Rensselaer Polytechnic Institute (RPI) inthe energy range from 1 to 620 keV. It also describes a newevaluation of a 95Mo total cross section in the unresolvedresonance range. Isotopic molybdenum total neutron cross-section data in particular are important because molybdenumcan exist in nuclear reactors as a high yield fission productor in alloyed form with applications in reactor piping, fuelcladding, and most importantly in advanced nuclear fuel in theform of U-Mo [1–3]. U-Mo alloys are mechanically stable,possess high thermal conductivity, are corrosion resistantin a high-temperature water environment (more so thanunalloyed uranium), and are highly durable under high levels
*Present address: Los Alamos National Laboratory, Los Alamos,New Mexico 87545; [email protected]†Present address: United States Military Academy, West Point, New
York 10966.
of irradiation [2–4]. They also are characterized by a highdensity of uranium, leading low enriched uranium-Mo alloyfuel to become the designated replacement fuel for researchreactors currently operating with highly enriched uraniumwhile still being able to achieve high neutron fluxes [2–4].Molybdenum is also in the makeup of many important fastburst criticality benchmarks. Recently, U-Mo has also beenhighlighted as a viable fuel candidate for small fission spacepower reactors [3]. A comprehensive overview of the physical,thermal, mechanical properties, and fuel performance topicsfor U-Mo alloys can be found in Refs. [2–4].
II. ISOTOPIC MOLYBDENUM CROSS-SECTIONEVALUATION
A. Resolved resonance region
The observed resonance structure in neutron cross sectionsis a result of the discrete energy levels of the compoundnucleus where isolated resonances are characterized by whatare known as resolved resonance parameters. At some point inenergy, only the partially resolved structure is observed as theexperimental resolution becomes comparable to the averagenatural width of the resonances. These unresolved multiplesof resonances can also exist due to the level spacing betweenisolated resonances becoming comparable to their averagenatural width. This transitional region is often referred to asthe unresolved resonance region. For molybdenum, previousisotopic measurements have provided cross-section librariesof resolved resonance parameters up to 2.1 keV for 95Mo,19.5 keV for 96Mo, 52.6 keV for 98Mo, and 26.1 keV for 100Mo[5,6]. New high-resolution isotopic molybdenum total cross-section data were measured at RPI and include newly resolvedresonances allowing an extension of the resolved resonanceregion. For 95Mo, new resonance parameters between En =5–20 keV were determined for 180 newly resolved resonances
0556-2813/2015/92(2)/024601(10) 024601-1 ©2015 American Physical Society
R. BAHRAN et al. PHYSICAL REVIEW C 92, 024601 (2015)
that were fitted from the experimental data [7] using theR-matrix code SAMMY [8]. For the 95Mo measurement andevaluation in the resolved resonance region, the biggestlimitation is caused by finite-energy resolution, which leadsto missing level contributions in the unresolved region. Thesemissing contributions were evident in two empirical metricsas compared to previously reported values. A calculated valueof the neutron strength function based on an analysis of theexperimental data which extends the resonance region upto 50 keV was lower than values reported in the Atlas ofNeutron Resonances [5,7]. There was also a divergence fromtheoretical estimates based on previous values in the plottedcumulative levels [7]. At higher energies, the contributions ofthe missing levels become more important, and an unresolvedresonance treatment of the experimental data could proveto be more useful. Therefore, based on observations of thecumulative levels from the analysis of the new dataset, it canbe concluded that the evaluated nuclear data file (ENDF)/B-VII.1upper energy boundary of 2.2 keV for 95Mo is reasonable [7].This choice of an upper energy boundary for the resolvedresonance region is ultimately decided upon by nuclear dataevaluators who can determine the performance of differentdata treatments on major experimental benchmarks. The upperresolved resonance region boundary can differ significantlybetween evaluated libraries depending on the differential dataand integral benchmark used in the evaluation. For example,evaluators in Japan scaled back the upper resolved resonanceregion boundary for 235U from 2.25 keV (current ENDF/B-VII.1value) to 500 eV for JENDL-4.0 [9].
B. Unresolved resonance region
In the unresolved resonance region, the underlying structurethat leads to the observed partially resolved structure still needsto be characterized. This is especially important for use inneutron transport calculations in codes, such as MCNP [10] orOPENMC [11] in order to account for resonance self-shieldingeffects. Average resonance parameters extracted from ex-perimental data are used to produce probability distributionfunctions representing the total neutron cross section (whosemean value is the infinitely dilute smooth average of thecross section) at discretized energies [12]. These distributionfunctions are represented in tabular form for application inMonte Carlo codes and are referred to as “probability tables”[12]. For MCNP or OPENMC, which have many applications andare used worldwide, the cross-section processing code NJOY
[13] can generate probability tables from a “ladder” of sampledresonances based on average parameters and statistical laws(Wigner spacing for resonance energies, single level Breit-Wigner for resonance shapes, Porter-Thomas χ2 distributionsfor resonance widths, and ψ−χ Doppler broadening) [12,14].Average parameters based on new experimental data provide amore reliable sampling distribution for these ladders. This willultimately allow higher accuracy Monte Carlo calculations,which may be used to improve neutronics calculations andbetter quantify safety margins in nuclear reactor designs.
The goal of the present analysis was to obtain new fits andextract average resonance parameters in the unresolved reso-nance region from the new total cross-section measurements in
an ENDF-compatible format. In this format, URR cross sectionsare computed from average resonance parameters in ENDF file2 and the dilute cross section in file 3 [15]. It is generallyexpected that the infinitely dilute cross section in file 3 shouldbe obtained from the best combination of measurements andmodels as provided by evaluators [16]. The average resonanceparameters are used to determine the energy self-shieldingof the cross section, which is very important for reactorcalculations. Furthermore, it has been proposed, that theunsmoothed high-resolution total cross-section experimentaldata in this region should be stored directly [17,18] in evaluatedfiles to be available to users (who typically plot the infinitelydilute cross section versus energy without any self-shielding[14]). How these files are used is determined by an ENDF-102
“LSSF” flag. This flag indicates (when equal to 1) that the file2 average resonance parameters contained in probability tablesare converted to self-shielding factors and then multiplied bythe cross section in file 3 [14].
The 95Mo total cross-section upper boundary for averageparameters in the unresolved region extends to 206 keV forENDF/B-VII.1 and JEFF-3.1.2 and 400 keV for JENDL-4.0. In thispresent paper, new average parameters and fits to the total crosssections were obtained for 95Mo between En = 190–590 keV.The starting point of the analysis was chosen near the cutoff ofthe current upper boundary of the ENDF/B-VII.0 library. The fitsand average parameters were obtained from the measurementusing the Bayesian Hauser-Feshbach statistical model codeFITACS [19], which is currently incorporated into the SAMMY
Bayesian analysis code [8]. These parameters can improve theexisting library database by better representing the structurein the URR. The new results have been made available ina format that is compatible with ENDF extending the regionwhere average parameters are available in ENDF to 590 keV[7]. The final upper boundary for average parameters shouldstill be determined by evaluators and users at an energywhere self-shielding and temperature-broadening applicationsbecome negligible [15].
III. EXPERIMENTAL SETUP
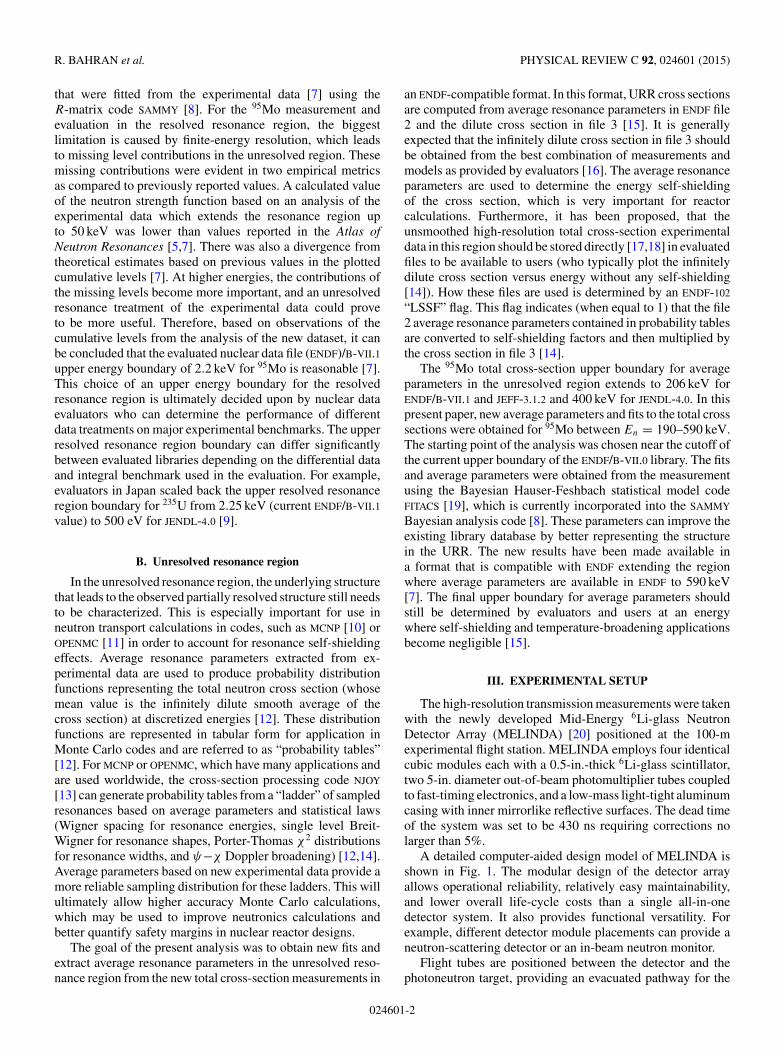
The high-resolution transmission measurements were takenwith the newly developed Mid-Energy 6Li-glass NeutronDetector Array (MELINDA) [20] positioned at the 100-mexperimental flight station. MELINDA employs four identicalcubic modules each with a 0.5-in.-thick 6Li-glass scintillator,two 5-in. diameter out-of-beam photomultiplier tubes coupledto fast-timing electronics, and a low-mass light-tight aluminumcasing with inner mirrorlike reflective surfaces. The dead timeof the system was set to be 430 ns requiring corrections nolarger than 5%.
A detailed computer-aided design model of MELINDA isshown in Fig. 1. The modular design of the detector arrayallows operational reliability, relatively easy maintainability,and lower overall life-cycle costs than a single all-in-onedetector system. It also provides functional versatility. Forexample, different detector module placements can provide aneutron-scattering detector or an in-beam neutron monitor.
Flight tubes are positioned between the detector and thephotoneutron target, providing an evacuated pathway for the
024601-2
ISOTOPIC MOLYBDENUM TOTAL NEUTRON CROSS . . . PHYSICAL REVIEW C 92, 024601 (2015)
FIG. 1. (Color online) Detailed three-dimensional computermodel of the midenergy 6Li-glass neutron detector array.
neutrons to travel. Neutrons are generated at the GaerttnerLINAC when short bursts of energetic electrons (≈50 MeV)are directed at a water-cooled and water-moderated tanta-lum target [21]. A water-moderated photoneutron tantalumtarget [22] was used in the high-resolution transmissionmeasurements utilizing a 12-ns electron burst width from thelinear accelerator. The average current on target during themeasurements was 22 μA.
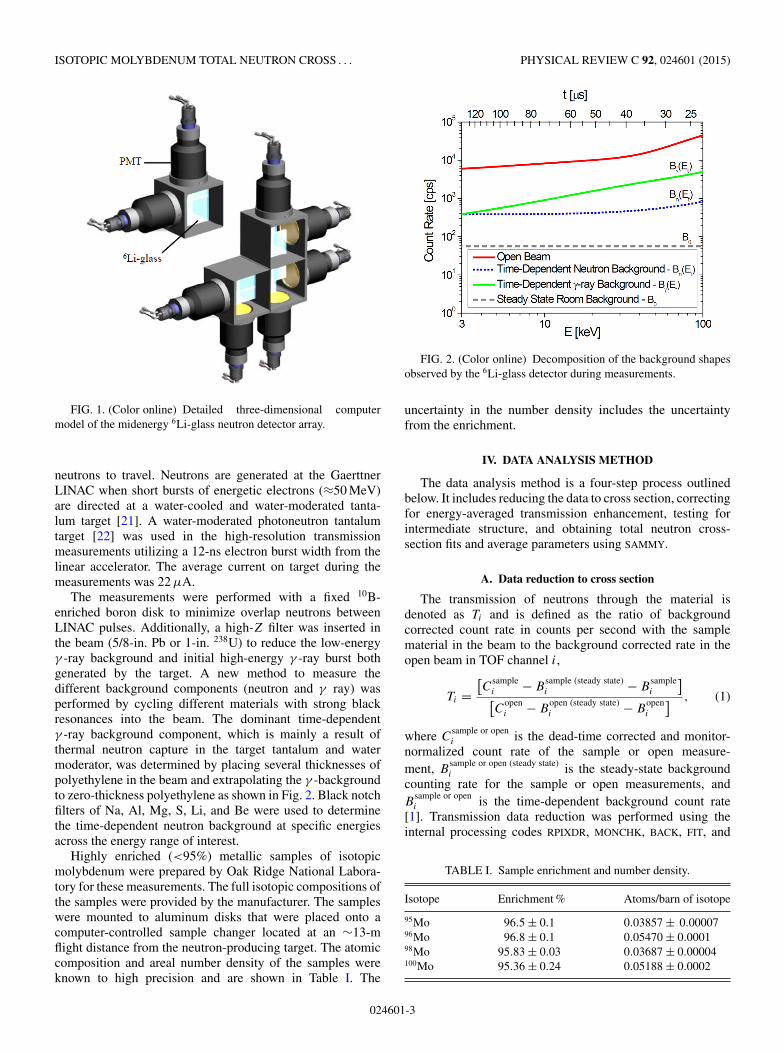
The measurements were performed with a fixed 10B-enriched boron disk to minimize overlap neutrons betweenLINAC pulses. Additionally, a high-Z filter was inserted inthe beam (5/8-in. Pb or 1-in. 238U) to reduce the low-energyγ -ray background and initial high-energy γ -ray burst bothgenerated by the target. A new method to measure thedifferent background components (neutron and γ ray) wasperformed by cycling different materials with strong blackresonances into the beam. The dominant time-dependentγ -ray background component, which is mainly a result ofthermal neutron capture in the target tantalum and watermoderator, was determined by placing several thicknesses ofpolyethylene in the beam and extrapolating the γ -backgroundto zero-thickness polyethylene as shown in Fig. 2. Black notchfilters of Na, Al, Mg, S, Li, and Be were used to determinethe time-dependent neutron background at specific energiesacross the energy range of interest.
Highly enriched (<95%) metallic samples of isotopicmolybdenum were prepared by Oak Ridge National Labora-tory for these measurements. The full isotopic compositions ofthe samples were provided by the manufacturer. The sampleswere mounted to aluminum disks that were placed onto acomputer-controlled sample changer located at an ∼13-mflight distance from the neutron-producing target. The atomiccomposition and areal number density of the samples wereknown to high precision and are shown in Table I. The
FIG. 2. (Color online) Decomposition of the background shapesobserved by the 6Li-glass detector during measurements.
uncertainty in the number density includes the uncertaintyfrom the enrichment.
IV. DATA ANALYSIS METHOD
The data analysis method is a four-step process outlinedbelow. It includes reducing the data to cross section, correctingfor energy-averaged transmission enhancement, testing forintermediate structure, and obtaining total neutron cross-section fits and average parameters using SAMMY.
A. Data reduction to cross section
The transmission of neutrons through the material isdenoted as Ti and is defined as the ratio of backgroundcorrected count rate in counts per second with the samplematerial in the beam to the background corrected rate in theopen beam in TOF channel i,
Ti =[C
samplei − B
sample (steady state)i − B
samplei
][C
openi − B
open (steady state)i − B
openi
] , (1)
where Csample or openi is the dead-time corrected and monitor-
normalized count rate of the sample or open measure-ment, B
sample or open (steady state)i is the steady-state background
counting rate for the sample or open measurements, andB
sample or openi is the time-dependent background count rate
[1]. Transmission data reduction was performed using theinternal processing codes RPIXDR, MONCHK, BACK, FIT, and
TABLE I. Sample enrichment and number density.
Isotope Enrichment % Atoms/barn of isotope
95Mo 96.5 ± 0.1 0.03857 ± 0.0000796Mo 96.8 ± 0.1 0.05470 ± 0.000198Mo 95.83 ± 0.03 0.03687 ± 0.00004100Mo 95.36 ± 0.24 0.05188 ± 0.0002
024601-3
R. BAHRAN et al. PHYSICAL REVIEW C 92, 024601 (2015)
TRANS. RPIXDR produces dead-time-corrected, run-summed,and monitor-normalized data files that can be grouped anddisplayed in counts per second. Statistical checks and corre-lations between beam monitor data and time-of-flight trans-mission data were performed with MONCHK. For backgroundcorrections, a function was fitted through the experimentallydetermined background points and subtracted from the data.The experimental transmission and its associated error weredetermined by TRANS. The total cross section is related to thetransmission by
T (E) = exp [−Nσt (E)], (2)
where N is the areal number density of the sample inatoms/barn, T (E) is the probability of a neutron of energy Eto pass through the sample without interaction, i.e., the trans-mission, and σt is the total microscopic neutron cross section.When converting the experimental data to transmission, all ofthe isotopes in the highly enriched samples were accountedfor.
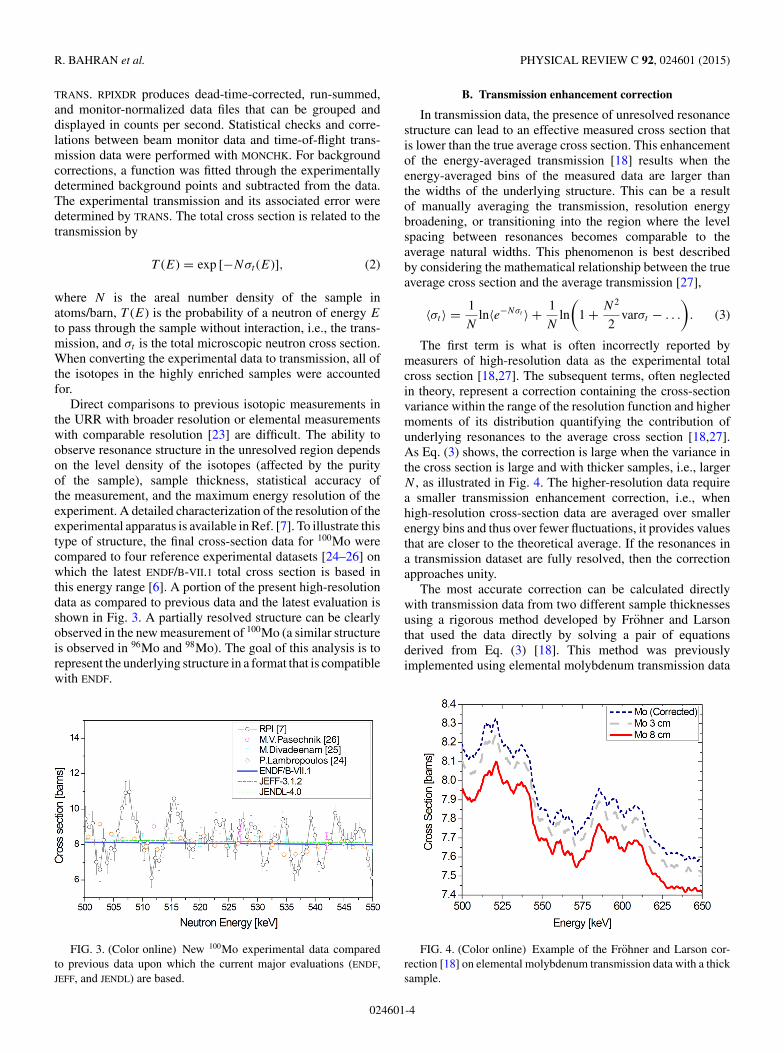
Direct comparisons to previous isotopic measurements inthe URR with broader resolution or elemental measurementswith comparable resolution [23] are difficult. The ability toobserve resonance structure in the unresolved region dependson the level density of the isotopes (affected by the purityof the sample), sample thickness, statistical accuracy ofthe measurement, and the maximum energy resolution of theexperiment. A detailed characterization of the resolution of theexperimental apparatus is available in Ref. [7]. To illustrate thistype of structure, the final cross-section data for 100Mo werecompared to four reference experimental datasets [24–26] onwhich the latest ENDF/B-VII.1 total cross section is based inthis energy range [6]. A portion of the present high-resolutiondata as compared to previous data and the latest evaluation isshown in Fig. 3. A partially resolved structure can be clearlyobserved in the new measurement of 100Mo (a similar structureis observed in 96Mo and 98Mo). The goal of this analysis is torepresent the underlying structure in a format that is compatiblewith ENDF.
FIG. 3. (Color online) New 100Mo experimental data comparedto previous data upon which the current major evaluations (ENDF,JEFF, and JENDL) are based.
B. Transmission enhancement correction
In transmission data, the presence of unresolved resonancestructure can lead to an effective measured cross section thatis lower than the true average cross section. This enhancementof the energy-averaged transmission [18] results when theenergy-averaged bins of the measured data are larger thanthe widths of the underlying structure. This can be a resultof manually averaging the transmission, resolution energybroadening, or transitioning into the region where the levelspacing between resonances becomes comparable to theaverage natural widths. This phenomenon is best describedby considering the mathematical relationship between the trueaverage cross section and the average transmission [27],
〈σt 〉 = 1
Nln〈e−Nσt 〉 + 1
Nln
(1 + N2
2varσt − . . .
). (3)
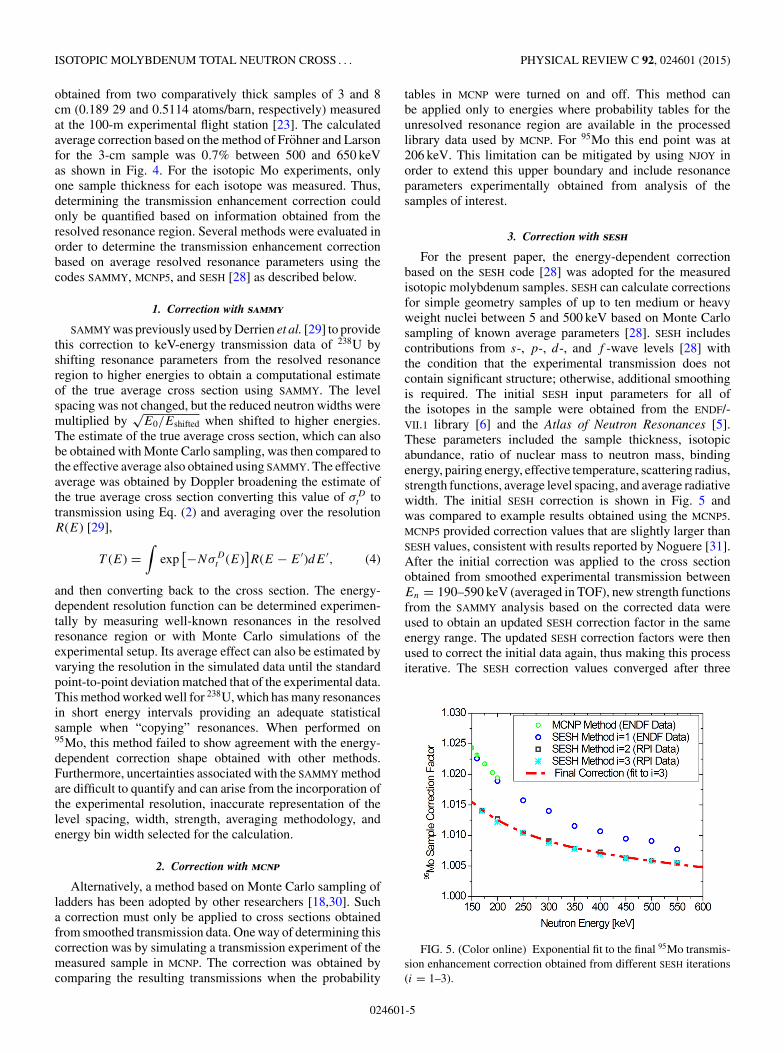
The first term is what is often incorrectly reported bymeasurers of high-resolution data as the experimental totalcross section [18,27]. The subsequent terms, often neglectedin theory, represent a correction containing the cross-sectionvariance within the range of the resolution function and highermoments of its distribution quantifying the contribution ofunderlying resonances to the average cross section [18,27].As Eq. (3) shows, the correction is large when the variance inthe cross section is large and with thicker samples, i.e., largerN , as illustrated in Fig. 4. The higher-resolution data requirea smaller transmission enhancement correction, i.e., whenhigh-resolution cross-section data are averaged over smallerenergy bins and thus over fewer fluctuations, it provides valuesthat are closer to the theoretical average. If the resonances ina transmission dataset are fully resolved, then the correctionapproaches unity.
The most accurate correction can be calculated directlywith transmission data from two different sample thicknessesusing a rigorous method developed by Frohner and Larsonthat used the data directly by solving a pair of equationsderived from Eq. (3) [18]. This method was previouslyimplemented using elemental molybdenum transmission data
FIG. 4. (Color online) Example of the Frohner and Larson cor-rection [18] on elemental molybdenum transmission data with a thicksample.
024601-4
ISOTOPIC MOLYBDENUM TOTAL NEUTRON CROSS . . . PHYSICAL REVIEW C 92, 024601 (2015)
obtained from two comparatively thick samples of 3 and 8cm (0.189 29 and 0.5114 atoms/barn, respectively) measuredat the 100-m experimental flight station [23]. The calculatedaverage correction based on the method of Frohner and Larsonfor the 3-cm sample was 0.7% between 500 and 650 keVas shown in Fig. 4. For the isotopic Mo experiments, onlyone sample thickness for each isotope was measured. Thus,determining the transmission enhancement correction couldonly be quantified based on information obtained from theresolved resonance region. Several methods were evaluated inorder to determine the transmission enhancement correctionbased on average resolved resonance parameters using thecodes SAMMY, MCNP5, and SESH [28] as described below.
1. Correction with sammy
SAMMY was previously used by Derrien et al. [29] to providethis correction to keV-energy transmission data of 238U byshifting resonance parameters from the resolved resonanceregion to higher energies to obtain a computational estimateof the true average cross section using SAMMY. The levelspacing was not changed, but the reduced neutron widths weremultiplied by
√E0/Eshifted when shifted to higher energies.
The estimate of the true average cross section, which can alsobe obtained with Monte Carlo sampling, was then compared tothe effective average also obtained using SAMMY. The effectiveaverage was obtained by Doppler broadening the estimate ofthe true average cross section converting this value of σD
t totransmission using Eq. (2) and averaging over the resolutionR(E) [29],
T (E) =∫
exp[−NσD
t (E)]R(E − E′)dE′, (4)
and then converting back to the cross section. The energy-dependent resolution function can be determined experimen-tally by measuring well-known resonances in the resolvedresonance region or with Monte Carlo simulations of theexperimental setup. Its average effect can also be estimated byvarying the resolution in the simulated data until the standardpoint-to-point deviation matched that of the experimental data.This method worked well for 238U, which has many resonancesin short energy intervals providing an adequate statisticalsample when “copying” resonances. When performed on95Mo, this method failed to show agreement with the energy-dependent correction shape obtained with other methods.Furthermore, uncertainties associated with the SAMMY methodare difficult to quantify and can arise from the incorporation ofthe experimental resolution, inaccurate representation of thelevel spacing, width, strength, averaging methodology, andenergy bin width selected for the calculation.
2. Correction with mcnp
Alternatively, a method based on Monte Carlo sampling ofladders has been adopted by other researchers [18,30]. Sucha correction must only be applied to cross sections obtainedfrom smoothed transmission data. One way of determining thiscorrection was by simulating a transmission experiment of themeasured sample in MCNP. The correction was obtained bycomparing the resulting transmissions when the probability
tables in MCNP were turned on and off. This method canbe applied only to energies where probability tables for theunresolved resonance region are available in the processedlibrary data used by MCNP. For 95Mo this end point was at206 keV. This limitation can be mitigated by using NJOY inorder to extend this upper boundary and include resonanceparameters experimentally obtained from analysis of thesamples of interest.
3. Correction with sesh
For the present paper, the energy-dependent correctionbased on the SESH code [28] was adopted for the measuredisotopic molybdenum samples. SESH can calculate correctionsfor simple geometry samples of up to ten medium or heavyweight nuclei between 5 and 500 keV based on Monte Carlosampling of known average parameters [28]. SESH includescontributions from s-, p-, d-, and f -wave levels [28] withthe condition that the experimental transmission does notcontain significant structure; otherwise, additional smoothingis required. The initial SESH input parameters for all ofthe isotopes in the sample were obtained from the ENDF/-VII.1 library [6] and the Atlas of Neutron Resonances [5].These parameters included the sample thickness, isotopicabundance, ratio of nuclear mass to neutron mass, bindingenergy, pairing energy, effective temperature, scattering radius,strength functions, average level spacing, and average radiativewidth. The initial SESH correction is shown in Fig. 5 andwas compared to example results obtained using the MCNP5.MCNP5 provided correction values that are slightly larger thanSESH values, consistent with results reported by Noguere [31].After the initial correction was applied to the cross sectionobtained from smoothed experimental transmission betweenEn = 190–590 keV (averaged in TOF), new strength functionsfrom the SAMMY analysis based on the corrected data wereused to obtain an updated SESH correction factor in the sameenergy range. The updated SESH correction factors were thenused to correct the initial data again, thus making this processiterative. The SESH correction values converged after three
FIG. 5. (Color online) Exponential fit to the final 95Mo transmis-sion enhancement correction obtained from different SESH iterations(i = 1–3).
024601-5
R. BAHRAN et al. PHYSICAL REVIEW C 92, 024601 (2015)
iterations as shown in Fig. 5. The final SESH correction thatwas applied to the data was <1.4%, which was on par with theaverage statistical uncertainty (1σ ) in the experimental totalcross section in this region (1.5%). The uncertainty on thecorrection was neglected in the present paper.
C. Testing for intermediate structure
Nonstatistical fluctuations in the observed experimentalcross section in the unresolved region indicated the existenceof either partially resolved overlapping compound nucleusresonance structure or intermediate structure [32]. Interme-diate structure is characterized by an intermediate width thatis much larger than the width and spacing of the compoundnuclear levels but smaller than the structure and spacing ofthe optical model shaped resonances [33]. Such a structurehas been described by Feshbach et al. [33] and others interms of “doorway states,” a simple mode of excitation whosecomplexity falls in between the optical model single-particlestates and the compound nuclear states [33].
Intermediate structure cannot be represented by averageparameters obtained from FITACS that are based on theconventional Hauser-Feshbach model. Therefore, a widelyused method [24,34] was applied to determine the existence ofintermediate structure based on the interferential fluctuationsin the experimental data. Other methods [24,35,36] have alsobeen described. In his seminal paper [34], Pappalardo proposesan autocorrelation function C(�) to test for the presenceof intermediate structure in the energy-dependent total crosssection σ (E) [24,34],
C(�) = 1
N
N∑i=1
[σ (Ei) − σ (Ei)]2, (5)
where
σ (Ei) = 1
�
∫ Ei+0.5�
Ei−0.5�
σ (E)dE, (6)
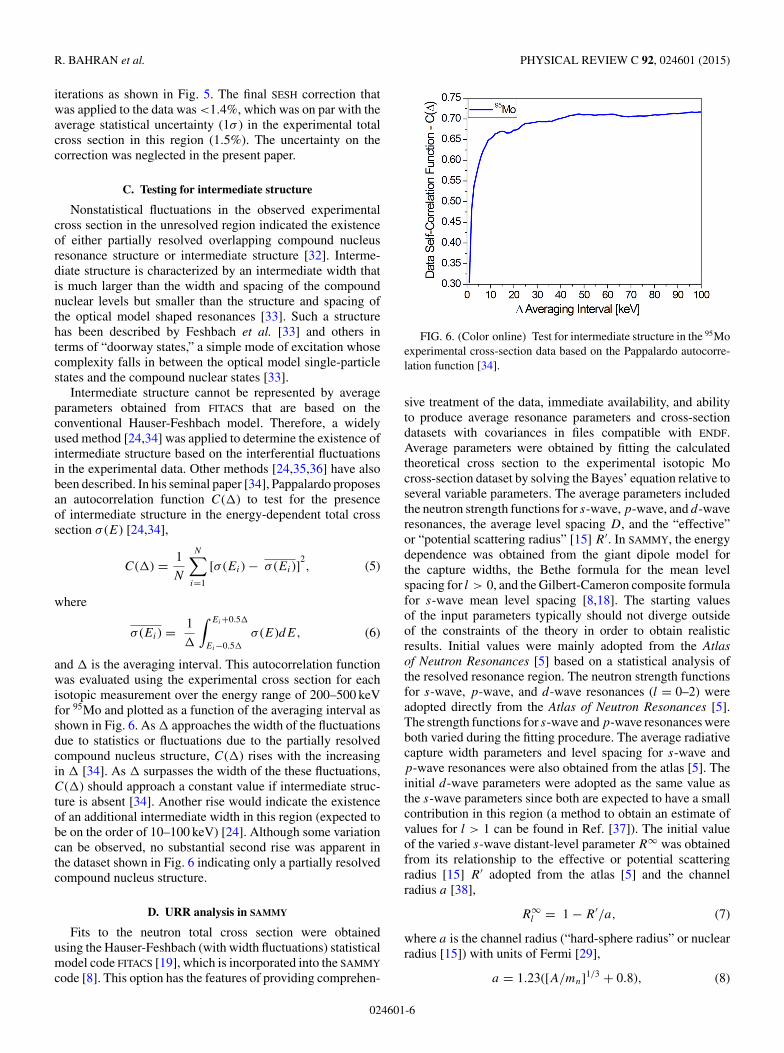
and � is the averaging interval. This autocorrelation functionwas evaluated using the experimental cross section for eachisotopic measurement over the energy range of 200–500 keVfor 95Mo and plotted as a function of the averaging interval asshown in Fig. 6. As � approaches the width of the fluctuationsdue to statistics or fluctuations due to the partially resolvedcompound nucleus structure, C(�) rises with the increasingin � [34]. As � surpasses the width of the these fluctuations,C(�) should approach a constant value if intermediate struc-ture is absent [34]. Another rise would indicate the existenceof an additional intermediate width in this region (expected tobe on the order of 10–100 keV) [24]. Although some variationcan be observed, no substantial second rise was apparent inthe dataset shown in Fig. 6 indicating only a partially resolvedcompound nucleus structure.
D. URR analysis in SAMMY
Fits to the neutron total cross section were obtainedusing the Hauser-Feshbach (with width fluctuations) statisticalmodel code FITACS [19], which is incorporated into the SAMMY
code [8]. This option has the features of providing comprehen-
FIG. 6. (Color online) Test for intermediate structure in the 95Moexperimental cross-section data based on the Pappalardo autocorre-lation function [34].
sive treatment of the data, immediate availability, and abilityto produce average resonance parameters and cross-sectiondatasets with covariances in files compatible with ENDF.Average parameters were obtained by fitting the calculatedtheoretical cross section to the experimental isotopic Mocross-section dataset by solving the Bayes’ equation relative toseveral variable parameters. The average parameters includedthe neutron strength functions for s-wave, p-wave, and d-waveresonances, the average level spacing D, and the “effective”or “potential scattering radius” [15] R′. In SAMMY, the energydependence was obtained from the giant dipole model forthe capture widths, the Bethe formula for the mean levelspacing for l > 0, and the Gilbert-Cameron composite formulafor s-wave mean level spacing [8,18]. The starting valuesof the input parameters typically should not diverge outsideof the constraints of the theory in order to obtain realisticresults. Initial values were mainly adopted from the Atlasof Neutron Resonances [5] based on a statistical analysis ofthe resolved resonance region. The neutron strength functionsfor s-wave, p-wave, and d-wave resonances (l = 0–2) wereadopted directly from the Atlas of Neutron Resonances [5].The strength functions for s-wave and p-wave resonances wereboth varied during the fitting procedure. The average radiativecapture width parameters and level spacing for s-wave andp-wave resonances were also obtained from the atlas [5]. Theinitial d-wave parameters were adopted as the same value asthe s-wave parameters since both are expected to have a smallcontribution in this region (a method to obtain an estimate ofvalues for l > 1 can be found in Ref. [37]). The initial valueof the varied s-wave distant-level parameter R∞ was obtainedfrom its relationship to the effective or potential scatteringradius [15] R′ adopted from the atlas [5] and the channelradius a [38],
R∞l = 1 − R′/a, (7)
where a is the channel radius (“hard-sphere radius” or nuclearradius [15]) with units of Fermi [29],
a = 1.23([A/mn]1/3 + 0.8), (8)
024601-6
ISOTOPIC MOLYBDENUM TOTAL NEUTRON CROSS . . . PHYSICAL REVIEW C 92, 024601 (2015)
where A is the atomic weight of the sample isotope and mn
is the mass of the neutron both in atomic mass units. Thedistant-level parameter R∞ is energy dependent and representsthe contributions from resonances above and below a givenenergy [38]. Varying the distant-level parameter varies thescattering radius R′ since the channel radius must remainconstant (there is no theoretical justification to vary the channelradius [38]). Additional input parameters are required thatcannot be varied. Such parameters include the binding energyor “neutron separation energy” Sn, which was obtained fromthe atlas [5] which reports values based on Ref. [39]. Theneutron pairing energy is zero for 95Mo (odd A) and +apA
−3/4
for the other even-even Mo isotopes where ap = 34 MeV andis an empirically based constant [40]. The energies of thenuclear excited states (inelastic states) were obtained fromthe National Nuclear Data Center evaluated nuclear structuredata file [6]. SAMMY does not have the capability for URRanalysis of multiple nuclides in one sample [8], so only theparameters for the enriched isotope were adopted. Due tothe highly enriched nature of the samples, the effects of thislimitation were determined to be negligible.
V. RESULTS
A. cross-section comparison to latest evaluation
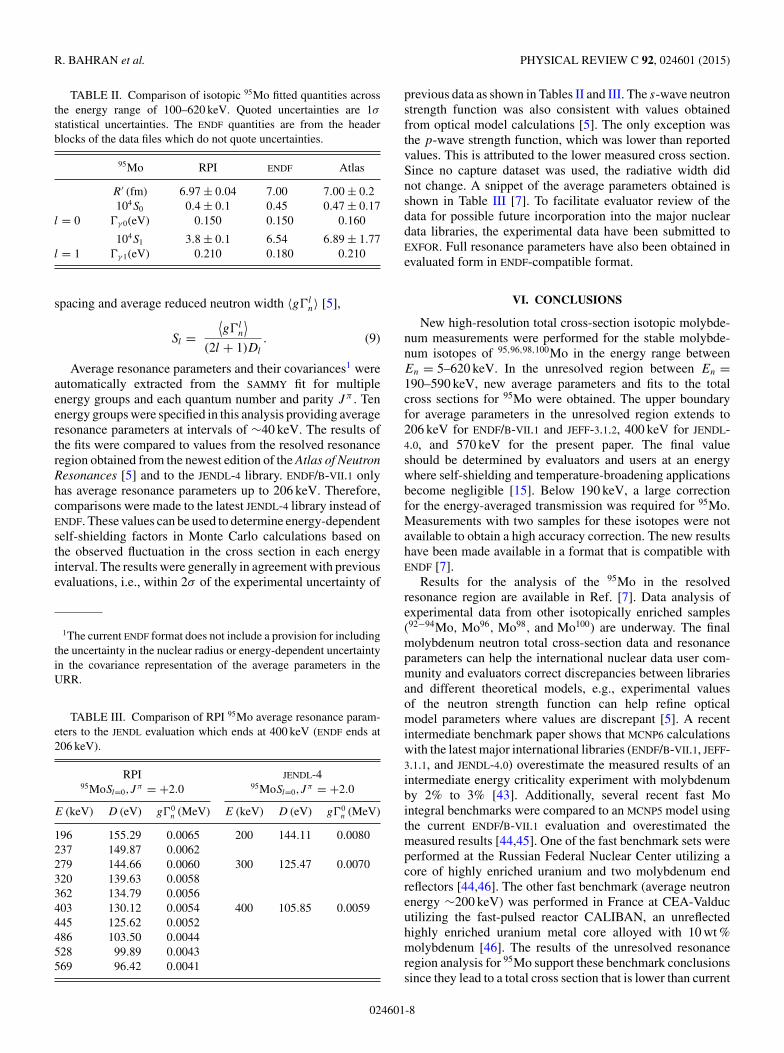
Neutron total cross-section fits for En = 175 − 590 keVwere obtained from SAMMY at a region where the transmissionenhancement correction was on average approximately 1%(with a maximum value of approximately 2%). The final fitswere evaluated by how well they reproduced the experimentalcross section and how they compared to the latest totalcross-section evaluated libraries as shown in Fig. 7. Errorbars on the SAMMY fit are within the thickness of the line.The ENDF/B-VII.1, JEFF, and JENDL evaluations are nearlyidentical in the unresolved resonance region. The fits to thehigh-resolution experimental data deviate from the currentisotopic 95Mo evaluations by up to 4% at some points in theunresolved resonance region. The cross sections in the URR
FIG. 7. (Color online) 95Mo SAMMY fit compared to data andevaluation. The fit to the new experimental data is slightly lowerthan the current evaluations across most of the graphed energy range.
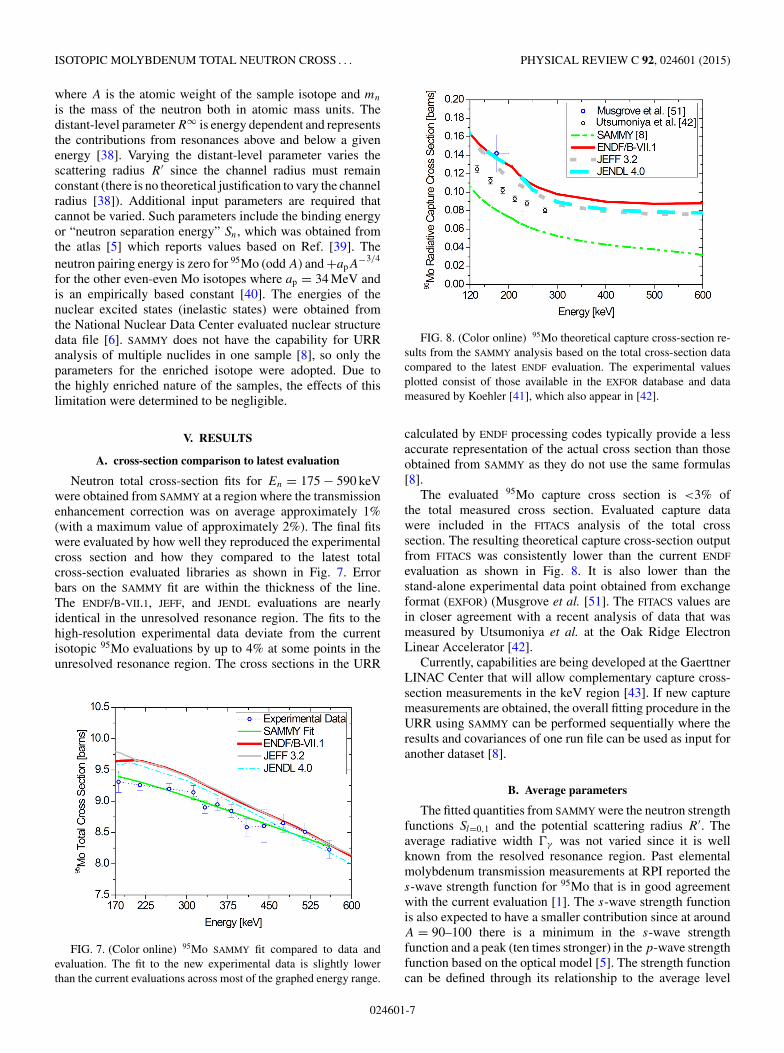
FIG. 8. (Color online) 95Mo theoretical capture cross-section re-sults from the SAMMY analysis based on the total cross-section datacompared to the latest ENDF evaluation. The experimental valuesplotted consist of those available in the EXFOR database and datameasured by Koehler [41], which also appear in [42].
calculated by ENDF processing codes typically provide a lessaccurate representation of the actual cross section than thoseobtained from SAMMY as they do not use the same formulas[8].
The evaluated 95Mo capture cross section is <3% ofthe total measured cross section. Evaluated capture datawere included in the FITACS analysis of the total crosssection. The resulting theoretical capture cross-section outputfrom FITACS was consistently lower than the current ENDF
evaluation as shown in Fig. 8. It is also lower than thestand-alone experimental data point obtained from exchangeformat (EXFOR) (Musgrove et al. [51]. The FITACS values arein closer agreement with a recent analysis of data that wasmeasured by Utsumoniya et al. at the Oak Ridge ElectronLinear Accelerator [42].
Currently, capabilities are being developed at the GaerttnerLINAC Center that will allow complementary capture cross-section measurements in the keV region [43]. If new capturemeasurements are obtained, the overall fitting procedure in theURR using SAMMY can be performed sequentially where theresults and covariances of one run file can be used as input foranother dataset [8].
B. Average parameters
The fitted quantities from SAMMY were the neutron strengthfunctions Sl=0,1 and the potential scattering radius R′. Theaverage radiative width �γ was not varied since it is wellknown from the resolved resonance region. Past elementalmolybdenum transmission measurements at RPI reported thes-wave strength function for 95Mo that is in good agreementwith the current evaluation [1]. The s-wave strength functionis also expected to have a smaller contribution since at aroundA = 90–100 there is a minimum in the s-wave strengthfunction and a peak (ten times stronger) in the p-wave strengthfunction based on the optical model [5]. The strength functioncan be defined through its relationship to the average level
024601-7
R. BAHRAN et al. PHYSICAL REVIEW C 92, 024601 (2015)
TABLE II. Comparison of isotopic 95Mo fitted quantities acrossthe energy range of 100–620 keV. Quoted uncertainties are 1σ
statistical uncertainties. The ENDF quantities are from the headerblocks of the data files which do not quote uncertainties.
95Mo RPI ENDF Atlas
R′ (fm) 6.97 ± 0.04 7.00 7.00 ± 0.2104S0 0.4 ± 0.1 0.45 0.47 ± 0.17
l = 0 �γ 0(eV) 0.150 0.150 0.160
104S1 3.8 ± 0.1 6.54 6.89 ± 1.77l = 1 �γ 1(eV) 0.210 0.180 0.210
spacing and average reduced neutron width 〈g�ln〉 [5],
Sl =⟨g�l
n
⟩(2l + 1)Dl
. (9)
Average resonance parameters and their covariances1 wereautomatically extracted from the SAMMY fit for multipleenergy groups and each quantum number and parity Jπ . Tenenergy groups were specified in this analysis providing averageresonance parameters at intervals of ∼40 keV. The results ofthe fits were compared to values from the resolved resonanceregion obtained from the newest edition of the Atlas of NeutronResonances [5] and to the JENDL-4 library. ENDF/B-VII.1 onlyhas average resonance parameters up to 206 keV. Therefore,comparisons were made to the latest JENDL-4 library instead ofENDF. These values can be used to determine energy-dependentself-shielding factors in Monte Carlo calculations based onthe observed fluctuation in the cross section in each energyinterval. The results were generally in agreement with previousevaluations, i.e., within 2σ of the experimental uncertainty of
1The current ENDF format does not include a provision for includingthe uncertainty in the nuclear radius or energy-dependent uncertaintyin the covariance representation of the average parameters in theURR.
TABLE III. Comparison of RPI 95Mo average resonance param-eters to the JENDL evaluation which ends at 400 keV (ENDF ends at206 keV).
RPI JENDL-495MoSl=0,J
π = +2.0 95MoSl=0,Jπ = +2.0
E (keV) D (eV) g�0n (MeV) E (keV) D (eV) g�0
n (MeV)
196 155.29 0.0065 200 144.11 0.0080237 149.87 0.0062279 144.66 0.0060 300 125.47 0.0070320 139.63 0.0058362 134.79 0.0056403 130.12 0.0054 400 105.85 0.0059445 125.62 0.0052486 103.50 0.0044528 99.89 0.0043569 96.42 0.0041
previous data as shown in Tables II and III. The s-wave neutronstrength function was also consistent with values obtainedfrom optical model calculations [5]. The only exception wasthe p-wave strength function, which was lower than reportedvalues. This is attributed to the lower measured cross section.Since no capture dataset was used, the radiative width didnot change. A snippet of the average parameters obtained isshown in Table III [7]. To facilitate evaluator review of thedata for possible future incorporation into the major nucleardata libraries, the experimental data have been submitted toEXFOR. Full resonance parameters have also been obtained inevaluated form in ENDF-compatible format.
VI. CONCLUSIONS
New high-resolution total cross-section isotopic molybde-num measurements were performed for the stable molybde-num isotopes of 95,96,98,100Mo in the energy range betweenEn = 5–620 keV. In the unresolved region between En =190–590 keV, new average parameters and fits to the totalcross sections for 95Mo were obtained. The upper boundaryfor average parameters in the unresolved region extends to206 keV for ENDF/B-VII.1 and JEFF-3.1.2, 400 keV for JENDL-4.0, and 570 keV for the present paper. The final valueshould be determined by evaluators and users at an energywhere self-shielding and temperature-broadening applicationsbecome negligible [15]. Below 190 keV, a large correctionfor the energy-averaged transmission was required for 95Mo.Measurements with two samples for these isotopes were notavailable to obtain a high accuracy correction. The new resultshave been made available in a format that is compatible withENDF [7].
Results for the analysis of the 95Mo in the resolvedresonance region are available in Ref. [7]. Data analysis ofexperimental data from other isotopically enriched samples(92−94Mo, Mo96, Mo98, and Mo100) are underway. The finalmolybdenum neutron total cross-section data and resonanceparameters can help the international nuclear data user com-munity and evaluators correct discrepancies between librariesand different theoretical models, e.g., experimental valuesof the neutron strength function can help refine opticalmodel parameters where values are discrepant [5]. A recentintermediate benchmark paper shows that MCNP6 calculationswith the latest major international libraries (ENDF/B-VII.1, JEFF-3.1.1, and JENDL-4.0) overestimate the measured results of anintermediate energy criticality experiment with molybdenumby 2% to 3% [43]. Additionally, several recent fast Mointegral benchmarks were compared to an MCNP5 model usingthe current ENDF/B-VII.1 evaluation and overestimated themeasured results [44,45]. One of the fast benchmark sets wereperformed at the Russian Federal Nuclear Center utilizing acore of highly enriched uranium and two molybdenum endreflectors [44,46]. The other fast benchmark (average neutronenergy ∼200 keV) was performed in France at CEA-Valducutilizing the fast-pulsed reactor CALIBAN, an unreflectedhighly enriched uranium metal core alloyed with 10 wt %molybdenum [46]. The results of the unresolved resonanceregion analysis for 95Mo support these benchmark conclusionssince they lead to a total cross section that is lower than current
024601-8
ISOTOPIC MOLYBDENUM TOTAL NEUTRON CROSS . . . PHYSICAL REVIEW C 92, 024601 (2015)
evaluated data by up to 4%. This difference is not accountedfor in the absorption cross section and therefore is assumedto be scattering, which could reduce the reported intermediateand fast molybdenum benchmark discrepancy.
To fully quantify the impact of the new measurements, thedata can be incorporated into Monte Carlo radiation transportmodels of integral criticality experimental benchmarks thatinclude molybdenum. The models can incorporate data fromthe present paper that can be combined with complementarydata of isotopic molybdenum measured at the GaerttnerLINAC Center at Rensselaer. This includes high-resolutionmolybdenum total cross-section data for the energy rangebetween 0.5 and 20 MeV that were measured at a 250-mexperimental flight station. Measured samples included natMo[47], 95Mo, 96Mo, 98Mo, 100Mo [23], and two samples of92/94Mo which provided a more accurate correction for theenhancement of the energy-averaged transmission. It alsoincludes a differential scattering cross-section dataset forelemental Mo which was measured in the energy rangebetween 0.5 and 20 MeV [48]. If high-resolution complimen-tary capture cross-section data were available, then a morecomplete analysis of the keV region for 95Mo would lead toa better overall data evaluation. In the unresolved resonanceregion, such complimentary capture cross-section data wouldbetter constrain the total cross-section SAMMY analysis. In theresolved resonance region above 2 keV, it would allow a morerigorous approach for parity and spin assignments based onγ -ray multiplicities. This is especially important since 95Mohas many low-lying states with different J values [49]. Furtherevaluation of the measured isotopic Mo datasets could providea statistical model calculation of 99Mo cross-section values asperformed in Ref. [50].
Although the end products of this experiment and anal-ysis are ENDF-compatible files, there are still several majorproblems that exist within the ENDF total cross-section rep-resentation. These issues have been identified by two majorpapers [10,32] and one international report by the WorkingParty on International Nuclear Data Evaluation Co-operation(WPEC) [52] and are described here for completeness. InENDF format, the cross section in the URR is computedfrom average resonance parameters that are stored in ENDF
file 2 and dilute cross sections stored in file 3 [15]. Howthese files are used is determined by an ENDF-102 LSSF flag[15]. When LSSF = 0, the dilute unresolved cross section is
calculated from average parameters in file 2 and requires anadditional partial background cross section from file 3 [15].When LSSF = 1, the file 2 average resonance parameterscontained in probability tables are converted to self-shieldingfactors and then multiplied by the cross section in file 3with the same smoothness as the URR evaluation [14]. Itis generally expected that the infinitely diluted cross sectionin file 3 should be obtained from the best combination ofmeasurements and models as provided by evaluators [16].The three papers propose the enforcement of the LSSF = 1option and stress the importance of using resonance parameterinterpolation instead of cross-section interpolation in theURR for more accuracy even though interpolating the crosssection is a faster calculation. The FITACS analysis in thepresent paper ensures that the infinitely dilute cross sectionscalculated from the average resonance parameters in file 2 arein agreement with the cross section stored in file 3, which isnot always the case. For example, the conversion of averageparameters obtained from an optical model calculations intoan equivalent single-level Breit-Wigner representation in ENDF
can misrepresent the shape of the total cross section [52].Another option that has been proposed for this region is to storeunsmoothed high-resolution total cross-section experimentaldata directly [17,18] in evaluated files to be available to userswho typically plot the infinitely dilute cross section versusenergy without any self-shielding [14]. The ENDF formatmanual cautions that this should only be done if the structurerepresents a statistically significant number of levels (>10)to avoid “double shielding” [15]. Finally there is an ongoingeffort to develop a generalized nuclear data format [53] asa modern alternative to replace the ENDF format, which wasdeveloped in the 1960s.
ACKNOWLEDGMENTS
The authors would like to thank P. Brand, M. Gray, M.Strock, and A. Kerdoun for their efforts in operating the LINACand their help in setting up experiments. They would alsolike to thank T. Sutton, P. Romano, C. Lubitz, B. Becker,P. Schillebeeckx, and T. Trumbull for helpful discussionsregarding theory and analysis methods in the unresolvedresonance region. This research endeavor was made possiblewith funding generously provided by Knolls Atomic PowerLaboratory (KAPL).
[1] G. Leinweber, D. P. Barry, J. A. Burke, N. J. Drindak, Y. Danon,R. C. Block, N. C. Francis, and B. E. Moretti,Nucl. Sci. Eng.164, 287 (2010).
[2] J. Rest et al., Argonne National Laboratory Report No. ANL-09/31, 2009 (unpublished).
[3] L. Mason et al., National Aeronautics Space AdministrationReport No. NASA/TM-2011-217099, 2011 (unpublished).
[4] A. M. Phillips, G. S. Mickum, and D. E. Burkes, IdahoNational Laboratory Report No. INL/EXT-10-19373, 2010(unpublished).
[5] S. F. Mughabghab, Atlas of Neutron Resonances: ResonanceParameters and Thermal Cross Sections Z = 1–100 (Elsevier,Amsterdam, Netherlands, 2006).
[6] M. Chadwick et al., Nucl. Data Sheets 112, 2887 (2011).[7] R. Bahran, Ph.D. thesis, Rensselaer Polytechnic Institute, 2013.[8] N. Larson, Oak Ridge National Laboratory Report No.
ORNL/TM-9179/R8, 2008 (unpublished).[9] K. Shibata et al., J. Korean Phys. Soc. 59, 1046 (2011).
[10] J. Goorley et al., Nucl. Technol. 180, 298 (2012).[11] P. K. Romano and B. Forget, Ann. Nucl. Energy 51, 274
(2013).[12] L. B. Levitt, Nucl. Sci. Eng. 49, 450 (1972).[13] R. E. MacFarlane and D. W. Muir, Los Alamos National
Laboratory Report No. LA-12740-M, 1994 (unpublished).[14] J. C. Sublet et al., Commissariat a L’Energie Atomique Report
No. CEA-R-6227, 2009 (unpublished).
024601-9
R. BAHRAN et al. PHYSICAL REVIEW C 92, 024601 (2015)
[15] M. Herman and A. Trkov, Brookhaven National LaboratoryReport No. ENDF-102, 2009 (unpublished).
[16] D. E. Cullen, Lawrence Livermore National Laboratory ReportNo. LLNL-TR-461199, 2010 (unpublished).
[17] C. Lubitz (private communication).[18] F. H. Frohner and D. C. Larson, Nuclear Energy Agency Report
No. NEA/WPEC-15, 1995 (unpublished).[19] F. H. Frohner, Nucl. Sci. Eng. 103, 119 (1989).[20] R. Bahran, M. Rapp, F. Saglime, D. Williams, Y. Danon,
D. Barry, G. Leinweber, R. C. Block, and J. Hoole, 10thInternational Topical Meeting on Nuclear Applications ofAccelerators (AccApp’11), Knoxville, 2011 (American NuclearSociety, Knoxville, TN, 2011).
[21] Y. Danon et al., Eighth International Topical Meeting NuclearApplications and Utilization of Accelerators (AccApp’07),Pocatello, ID, 2007 (American Nuclear Society, Pocatello, ID,2007).
[22] M. E. Overberg, B. E. Moretti, R. E. Slovacek, and R. C. Block,Nucl. Instrum. Methods Phys. Res., Sect. A 438, 253 (1999).
[23] M. Rapp, D. Barry, R. Block, G. Leinweber, and Y. Danon,American Nuclear Society Summer Meeting, Chicago, 2012(American Nuclear Society, Chicago, 2012).
[24] P. Lambropoulos et al., Nucl. Phys. A 201, 1 (1973).[25] M. Divadeenam, Ph.D. thesis, Duke University, 1968.[26] M. V. Pasechnik, M. B. Fedorov, and V. D. Ovdienko, in All
Union Conference on Neutron Physics, Kiev, 1980 (unpub-lished).
[27] F. Frohner, Nuclear Energy Agency Report No. OECD JEFFReport 18, 2000 (unpublished).
[28] F. Frohner, Gulf General Atomic Inc. Report No. GA-8380,1968 (unpublished).
[29] H. Derrien et al., Oak Ridge National Laboratory Report No.ORNL/TM-2000/129, 2000 (unpublished).
[30] P. Schillebeeckx et al., Nucl. Data Sheets 113, 3054 (2012).[31] G. Noguere, Ph.D. thesis, Commissariat a L’Energie Atomique,
2005.
[32] A. Carlson and H. Barschall, Phys. Rev. 158, 1142 (1967).[33] H. Feshbach, A. K. Kerman, and R. H. Lemmer, Ann. Phys.
(N.Y.) 41, 230 (1967).[34] G. Pappalardo, Phys. Lett. 13, 320 (1964).[35] G. D. James, Nucl. Phys. A 170, 309 (1971).[36] I. Hall, Phys. Lett. 10, 199 (1964).[37] E. Rich, G. Noguere, C. De Saint Jean, and A. Tudora, Nucl.
Sci. Eng. 162, 76 (2009).[38] F. H. Frohner and O. Bouland, Nucl. Sci. Eng. 137, 70
(2001).[39] G. Audi, A. H. Wapstra, and C. Thibault, Nucl. Phys. A 729,
337 (2003).[40] K. S. Krane and D. Halliday, Introductory Nuclear Physics
(Wiley, New York, 1987).[41] P. Koehler (private communication).[42] H. Utsumoniya et al., Phys. Rev. C 88, 015805 (2013).[43] B. McDermott et al., American Nuclear Society 2013 Student
Conference, Boston, 2013 (American Nuclear Society, Boston,2013).
[44] S. C. van der Mark, Nucl. Data Sheets 113, 2935 (2012).[45] V. M. Shmakov et al., Russian Federal Nuclear Center Report
No. HEU-MET-FAST-092 NEA/NSC/DOC/(95)03/VolumeII, 2012, https://www.oecd-nea.org/science/wpncs/icsbep/handbook.html.
[46] B. Richard, Ph.D. thesis, Centre CEA Valduc, 2012.[47] (NEA-OECD, 2014), Vol. online database.[48] M. Rapp, et al., J. Korean Phys. Soc. 59, 1745 (2011).[49] F. J. Saglime, Ph.D. thesis, Rensselaer Polytechnic Institute,
2009.[50] S. A. Sheets et al., Phys. Rev. C 76, 064317 (2007).[51] A. R. De, L. Musgrove, B. J. Allen, J. W. Boldeman, and R. L.
Macklin, Nucl. Phys. A 270, 108 (1976).[52] L. Leal and K. Shibata, Nuclear Energy Agency Report No.
NEA/NSC/WPEC/DOC (2011) 430, 2011 (unpublished).[53] C. M. Mattoon et al., Nuclear Data Sheets 113, 3145
(2012).
024601-10