Embed Size (px)
Citation preview

Neuronetics, Inc.NASDAQ: STIM
Company PresentationMarch 2021
2
DisclaimersThis presentation contains estimates and other statistical data prepared by independent parties and by Neuronetics, Inc. (the “Company”) relating to market size and growth and other data about the industry in which the Company operates. These estimates and data involve a number of assumptions and limitations, and you are cautioned not to give undue weight to such estimates and data.
Certain statements in this presentation and the accompanying oral commentary are forward-looking statements within the meaning of the Private Securities Litigation Reform Act of 1995. These statements, including statements relating to the Company’s business strategy and financial metrics as well as revenue, operating expense and earnings guidance and projections for future periods, relate to future events or the future financial performance of the Company and involve known and unknown risks, uncertainties and other factors that may cause the actual results, levels of activity, performance or achievements of the Company or its industry to be materially different from those expressed or implied by any forward-looking statements. In some cases, forward-looking statements can be identified by terminology such as “may,” “will,” “could,” “would,” “should,” “expect,” “plan,” “anticipate,” “intend,” “believe,” “estimate,” “predict,” “potential” or other comparable terminology, as well as the negative of such statements. All statements other than statements of historical fact may be deemed to be forward-looking statements, including those concerning any expectations regarding investment returns; any projections of financial information; any statements about historical results that may suggest trends for our business; any statements of the plans, strategies, and objectives of management for future operations; any statements of expectation or belief regarding future events, potential markets or market size, additional indications or technology developments; developments in clinical trials or regulatory review of NeuroStar Advanced Therapy System for additional indications; and any statements of assumptions underlying any of the items mentioned. The Company has based these forward-looking statements on its current expectations, assumptions, estimates and projections. While the Company believes these expectations, assumptions, estimates andprojections are reasonable, such forward-looking statements are only predictions and involve known and unknown risks and uncertainties, many of which are beyond the Company’s control. These and other important factors may cause actual results, performance or achievements to differ materially from those expressed or implied by such forward-looking statements. The forward-looking statements in this presentation are made only as of the date hereof. Except as required by law, the Company assumes no obligation and does not intend to update these forward-looking statements or to conform these statements to actual results or to changes in the Company’s expectations, assumptions, estimates and projections.
Presenters
3
Steve Furlong
Senior Vice President, Chief Financial Officer and Treasurer
34+ years of experience:
Keith Sullivan
President & CEO
35+ years of experience:
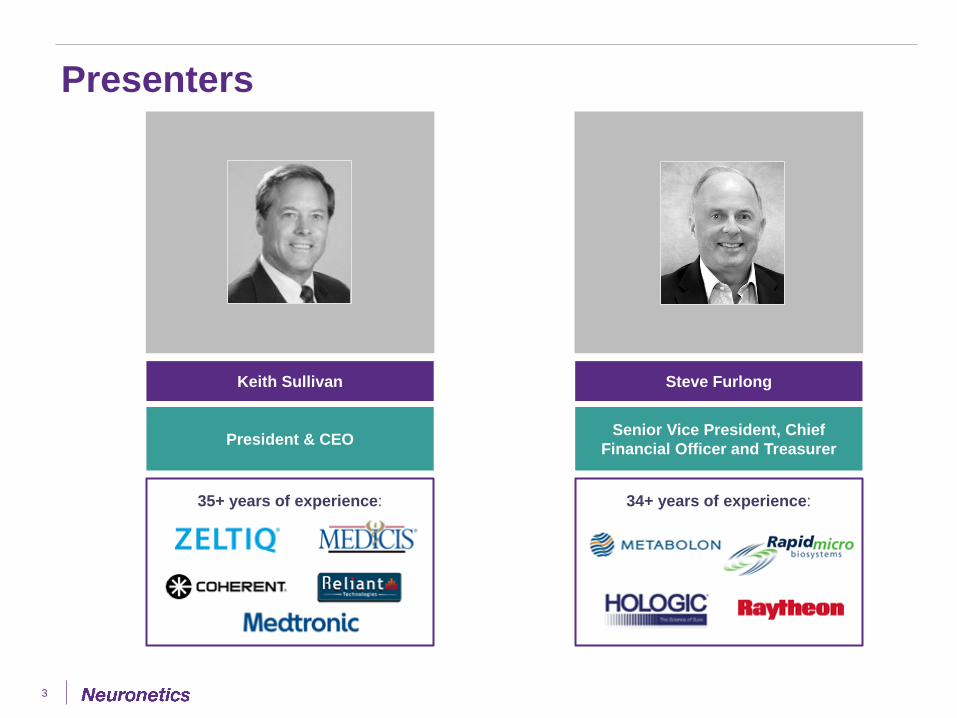
• NeuroStar Advanced Therapy —Transcranial Magnetic Stimulation (TMS)
• Focused on psychiatric indications
• Current Indication: Major Depressive Disorder (MDD) in adults failed to receive satisfactoryimprovement from prior antidepressant medication in the current episode
• Safe, effective and non-invasive office-based treatment
• FDA cleared 2008
• CE mark (2012) and approved in Japan in September 2017. Reimbursement in Japanacquired in June 2019
Neuronetics Snapshot
4
5
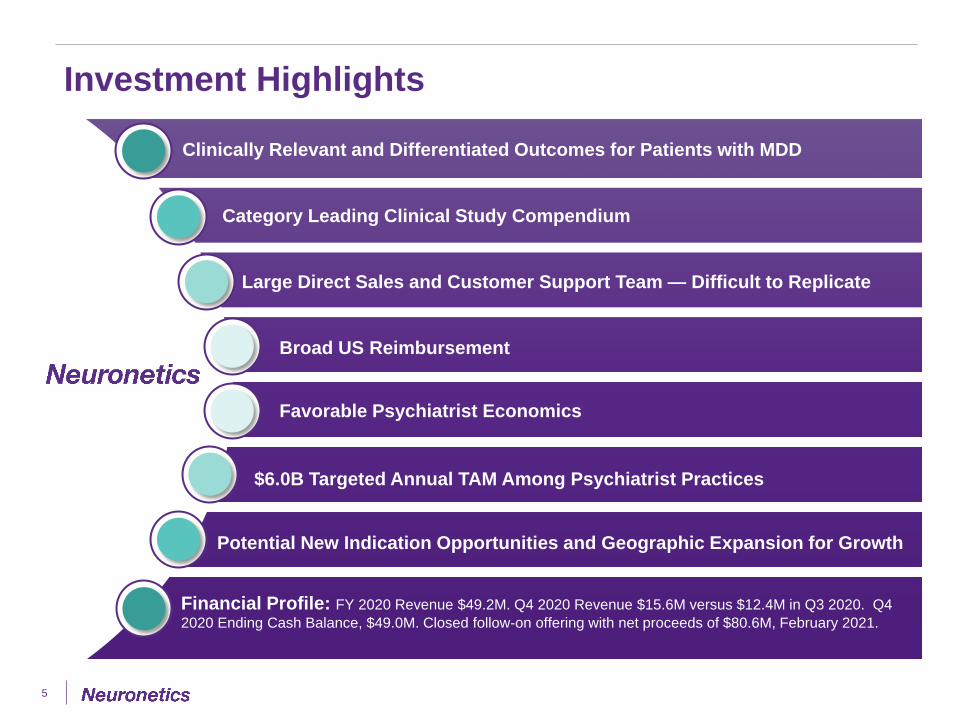
Investment Highlights
Clinically Relevant and Differentiated Outcomes for Patients with MDD
Category Leading Clinical Study Compendium
Large Direct Sales and Customer Support Team — Difficult to Replicate
Broad US Reimbursement
Favorable Psychiatrist Economics
$6.0B Targeted Annual TAM Among Psychiatrist Practices
Potential New Indication Opportunities and Geographic Expansion for Growth
Financial Profile: FY 2020 Revenue $49.2M. Q4 2020 Revenue $15.6M versus $12.4M in Q3 2020. Q4 2020 Ending Cash Balance, $49.0M. Closed follow-on offering with net proceeds of $80.6M, February 2021.
Major Depressive Disorder
6
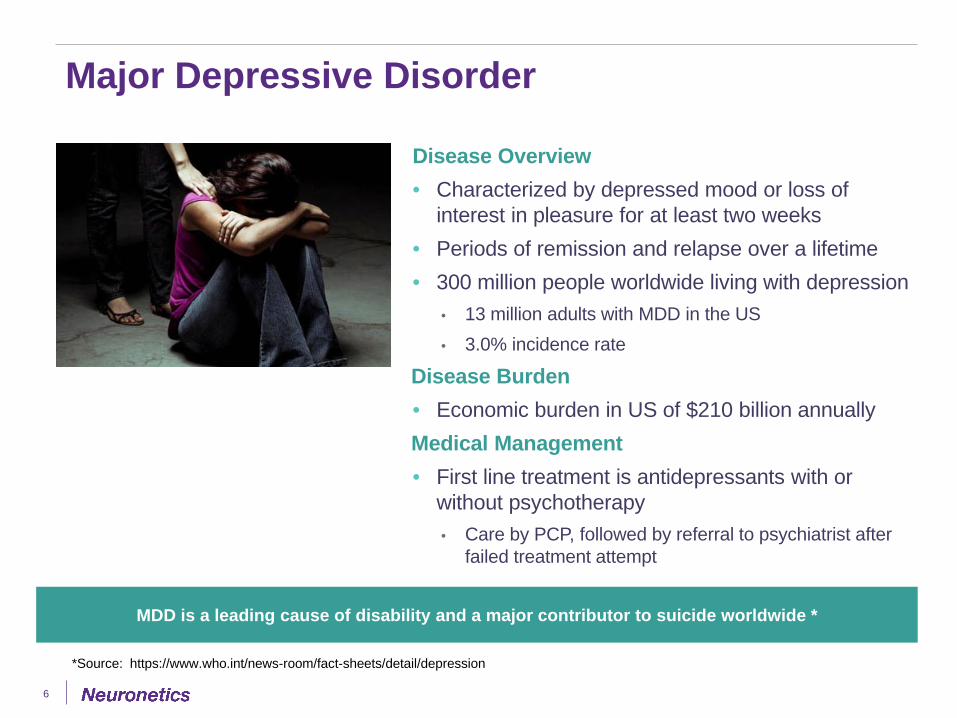
Disease Overview• Characterized by depressed mood or loss of
interest in pleasure for at least two weeks• Periods of remission and relapse over a lifetime• 300 million people worldwide living with depression
• 13 million adults with MDD in the US• 3.0% incidence rate
Disease Burden• Economic burden in US of $210 billion annuallyMedical Management• First line treatment is antidepressants with or
without psychotherapy• Care by PCP, followed by referral to psychiatrist after
failed treatment attempt
MDD is a leading cause of disability and a major contributor to suicide worldwide *
*Source: https://www.who.int/news-room/fact-sheets/detail/depression
7
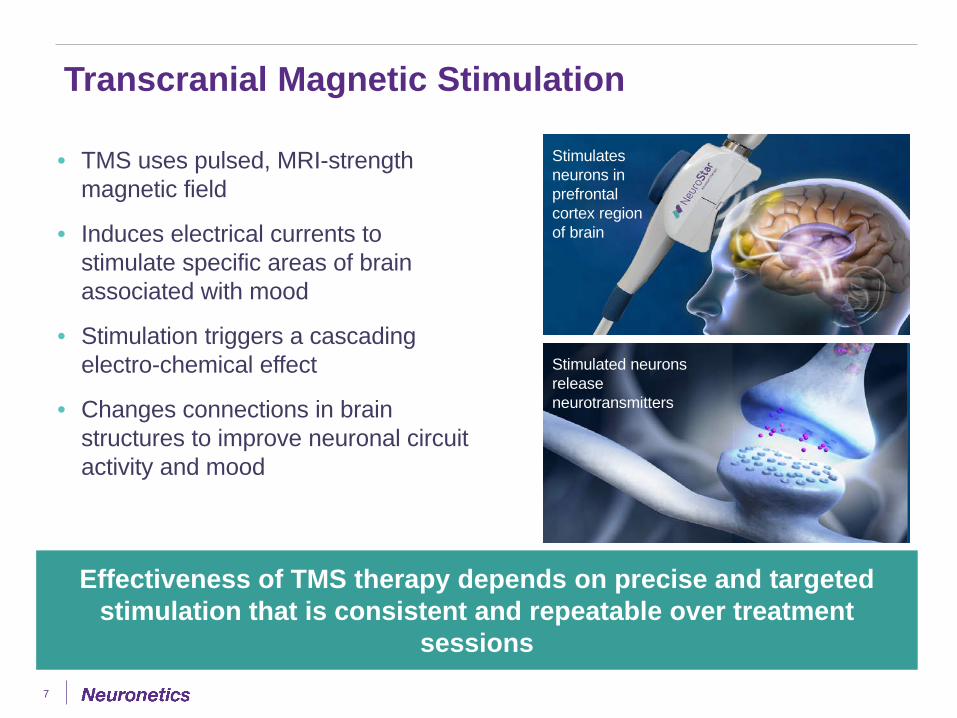
• TMS uses pulsed, MRI-strength magnetic field
• Induces electrical currents to stimulate specific areas of brain associated with mood
• Stimulation triggers a cascading electro-chemical effect
• Changes connections in brain structures to improve neuronal circuit activity and mood
Stimulated neuronsrelease neurotransmitters
Transcranial Magnetic Stimulation
Effectiveness of TMS therapy depends on precise and targeted stimulation that is consistent and repeatable over treatment
sessions
Stimulates neurons in prefrontal cortex region of brain
8.6%
23.1%
36.2%41.4%
0%
10%
20%
30%
40%
50%
First-LineTreatment
Effect(N=2,876)
One-PriorTreatment
Failure(N=727)
Two-PriorTreatmentFailures(N=221)
Three-PriorTreatmentFailures(N=58)
Patie
nts
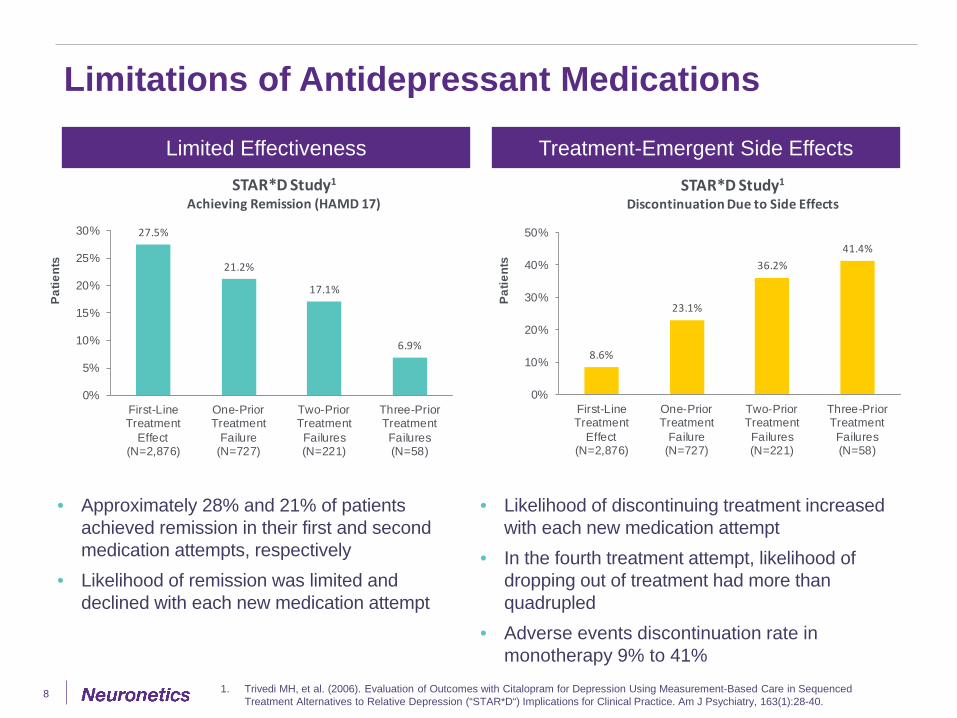
STAR*D Study1
Discontinuation Due to Side Effects
27.5%
21.2%
17.1%
6.9%
0%
5%
10%
15%
20%
25%
30%
First-LineTreatment
Effect(N=2,876)
One-PriorTreatment
Failure(N=727)
Two-PriorTreatmentFailures(N=221)
Three-PriorTreatmentFailures(N=58)
Patie
nts
STAR*D Study1
Achieving Remission (HAMD 17)
1. Trivedi MH, et al. (2006). Evaluation of Outcomes with Citalopram for Depression Using Measurement-Based Care in Sequenced Treatment Alternatives to Relative Depression (“STAR*D“) Implications for Clinical Practice. Am J Psychiatry, 163(1):28-40.
Limitations of Antidepressant Medications
8
• Approximately 28% and 21% of patients achieved remission in their first and second medication attempts, respectively
• Likelihood of remission was limited and declined with each new medication attempt
• Likelihood of discontinuing treatment increased with each new medication attempt
• In the fourth treatment attempt, likelihood of dropping out of treatment had more than quadrupled
• Adverse events discontinuation rate in monotherapy 9% to 41%
Limited Effectiveness Treatment-Emergent Side Effects
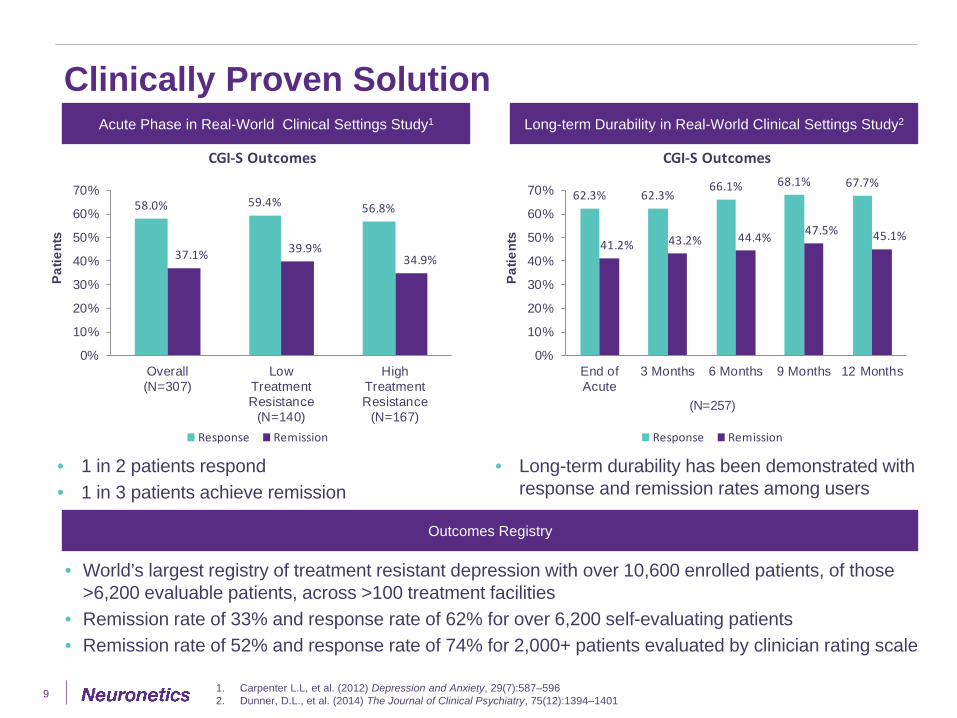
58.0% 59.4% 56.8%
37.1% 39.9%34.9%
0%
10%
20%
30%
40%
50%
60%
70%
Overall(N=307)
LowTreatmentResistance
(N=140)
HighTreatmentResistance
(N=167)
Patie
nts
CGI-S Outcomes
Response Remission
Clinically Proven Solution
9
• 1 in 2 patients respond• 1 in 3 patients achieve remission
• Long-term durability has been demonstrated with response and remission rates among users
Acute Phase in Real-World Clinical Settings Study1 Long-term Durability in Real-World Clinical Settings Study2
1. Carpenter L.L, et al. (2012) Depression and Anxiety, 29(7):587–5962. Dunner, D.L., et al. (2014) The Journal of Clinical Psychiatry, 75(12):1394–1401
62.3% 62.3%66.1% 68.1% 67.7%
41.2% 43.2% 44.4% 47.5% 45.1%
0%
10%
20%
30%
40%
50%
60%
70%
End ofAcute
3 Months 6 Months 9 Months 12 Months
Patie
nts
CGI-S Outcomes
Response Remission
(N=257)
Outcomes Registry
• World’s largest registry of treatment resistant depression with over 10,600 enrolled patients, of those >6,200 evaluable patients, across >100 treatment facilities
• Remission rate of 33% and response rate of 62% for over 6,200 self-evaluating patients• Remission rate of 52% and response rate of 74% for 2,000+ patients evaluated by clinician rating scale
Clinically Proven Solution
10
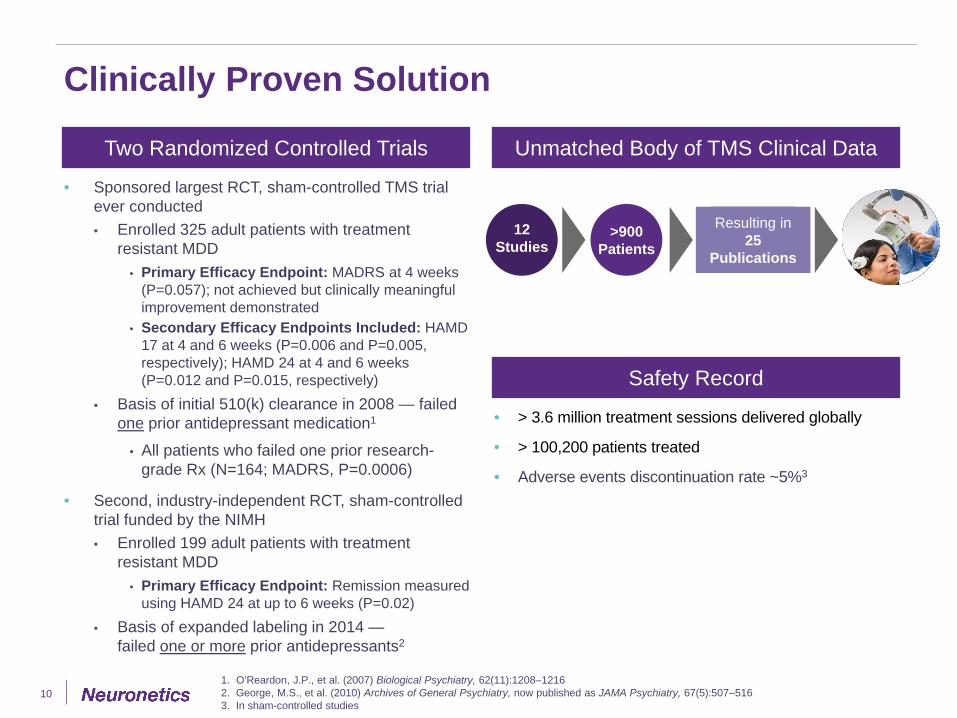
Two Randomized Controlled Trials Unmatched Body of TMS Clinical Data
• Sponsored largest RCT, sham-controlled TMS trial ever conducted• Enrolled 325 adult patients with treatment
resistant MDD• Primary Efficacy Endpoint: MADRS at 4 weeks
(P=0.057); not achieved but clinically meaningful improvement demonstrated
• Secondary Efficacy Endpoints Included: HAMD 17 at 4 and 6 weeks (P=0.006 and P=0.005, respectively); HAMD 24 at 4 and 6 weeks (P=0.012 and P=0.015, respectively)
• Basis of initial 510(k) clearance in 2008 — failed one prior antidepressant medication1
• All patients who failed one prior research-grade Rx (N=164; MADRS, P=0.0006)
• Second, industry-independent RCT, sham-controlled trial funded by the NIMH• Enrolled 199 adult patients with treatment
resistant MDD• Primary Efficacy Endpoint: Remission measured
using HAMD 24 at up to 6 weeks (P=0.02)• Basis of expanded labeling in 2014 —
failed one or more prior antidepressants2
1. O’Reardon, J.P., et al. (2007) Biological Psychiatry, 62(11):1208–12162. George, M.S., et al. (2010) Archives of General Psychiatry, now published as JAMA Psychiatry, 67(5):507–5163. In sham-controlled studies
Safety Record
• > 3.6 million treatment sessions delivered globally
• > 100,200 patients treated
• Adverse events discontinuation rate ~5%3
12Studies
>900Patients
Resulting in25
Publications

Electroconvulsive Therapy*
MDD Patient Continuum of Care
11
First-Line Treatment Attempts• SSRIs• SNRIs
Next Attempt
Antidepressant Switch
• Other SSRIs or SNRIs
• First-generation antidepressant medications
TMSNon-invasiveNon-systemic
Augmentation Strategies
Atypical Antipsychotic Augmentation
Next Attempt
NeuroStar Advanced Therapy is indicated for treatment of MDD in adult patients who have failed to achieve satisfactory improvement from prior antidepressant medication in the current episode
NextAttempt
NextAttempt
Next Attempt TMS**
Next Attempt
Next Attempt
Next Attempt
Vagus Nerve Stimulation
Next Attempt
NextAttempt
Psychotherapy
* ECT may be used earlier in the patient continuum of care in patients experiencing catatonia, acute suicidal behaviors or psychotic symptoms** TMS may be used at any point along the continuum of care following one or more failed treatment attempts
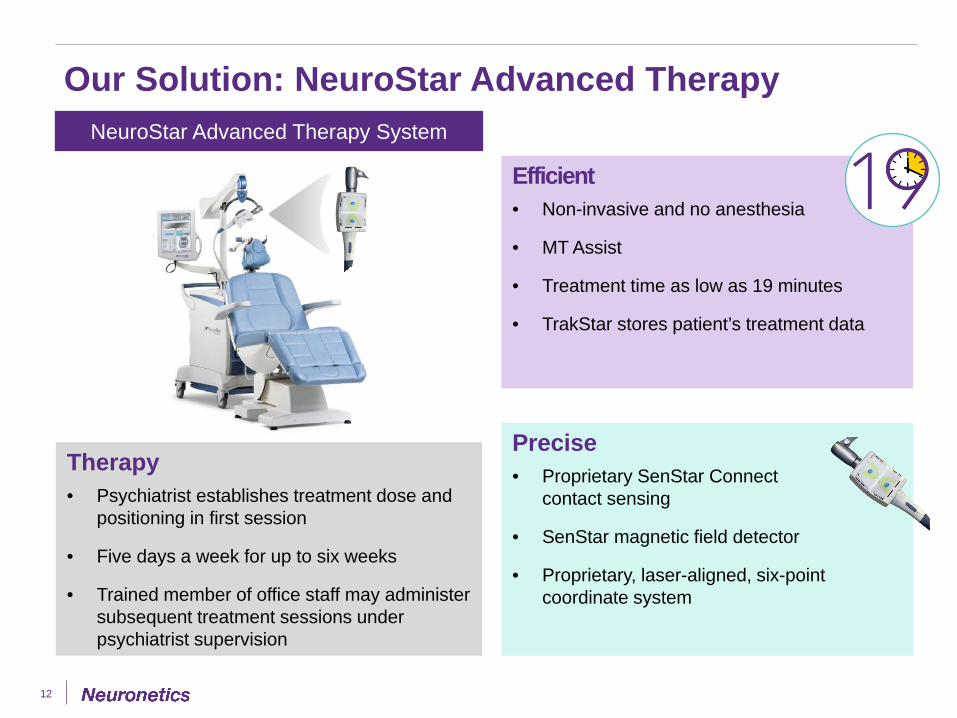
Efficient• Non-invasive and no anesthesia
• MT Assist
• Treatment time as low as 19 minutes
• TrakStar stores patient’s treatment data
Our Solution: NeuroStar Advanced Therapy
Precise• Proprietary SenStar Connect
contact sensing
• SenStar magnetic field detector
• Proprietary, laser-aligned, six-point coordinate system
12
NeuroStar Advanced Therapy System
Therapy• Psychiatrist establishes treatment dose and
positioning in first session
• Five days a week for up to six weeks
• Trained member of office staff may administer subsequent treatment sessions under psychiatrist supervision
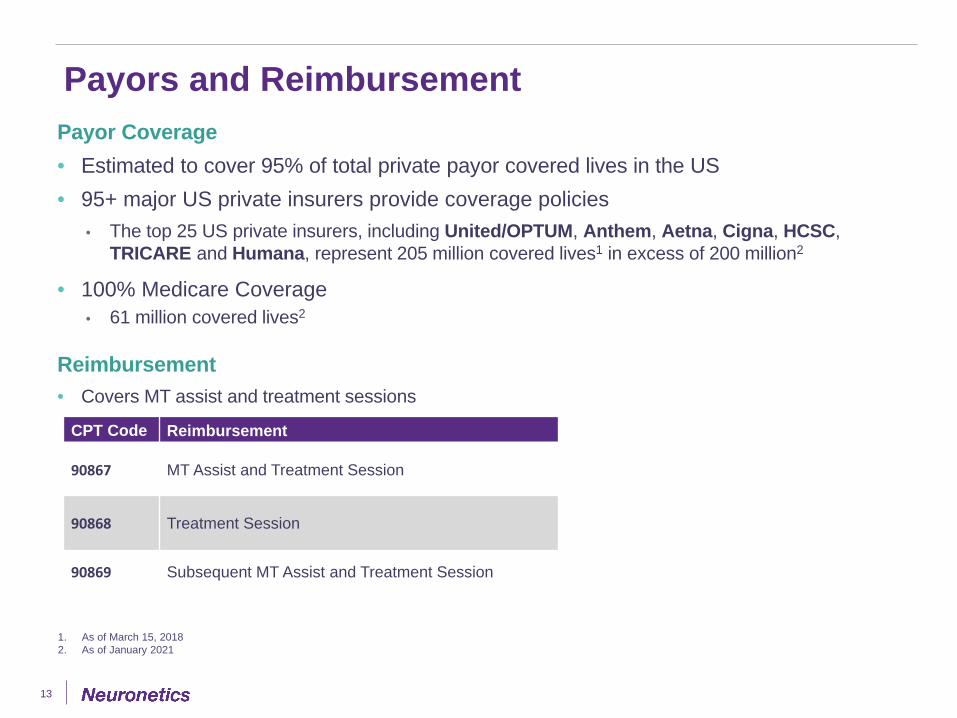
Payors and Reimbursement
13
Reimbursement• Covers MT assist and treatment sessions
CPT Code Reimbursement
90867 MT Assist and Treatment Session
90868 Treatment Session
90869 Subsequent MT Assist and Treatment Session
Payor Coverage• Estimated to cover 95% of total private payor covered lives in the US• 95+ major US private insurers provide coverage policies
• The top 25 US private insurers, including United/OPTUM, Anthem, Aetna, Cigna, HCSC, TRICARE and Humana, represent 205 million covered lives1 in excess of 200 million2
• 100% Medicare Coverage• 61 million covered lives2
1. As of March 15, 20182. As of January 2021
Physician Practice Economics
14
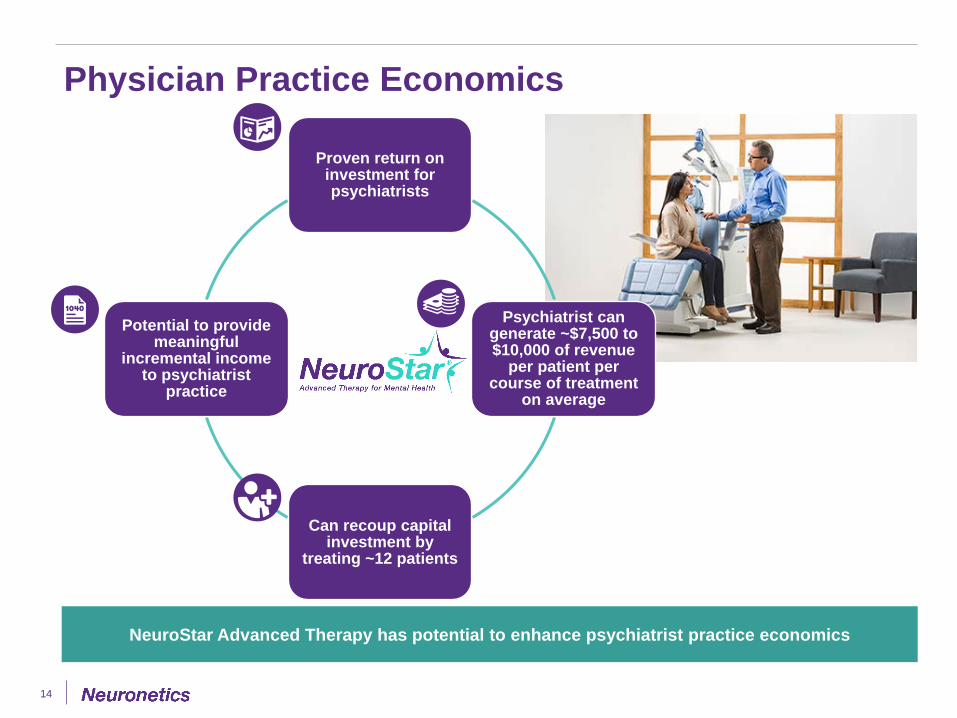
Proven return on investment for psychiatrists
Psychiatrist can generate ~$7,500 to $10,000 of revenue
per patient per course of treatment
on average
Can recoup capital investment by
treating ~12 patients
Potential to provide meaningful
incremental income to psychiatrist
practice
NeuroStar Advanced Therapy has potential to enhance psychiatrist practice economics
Competitive Positioning
15
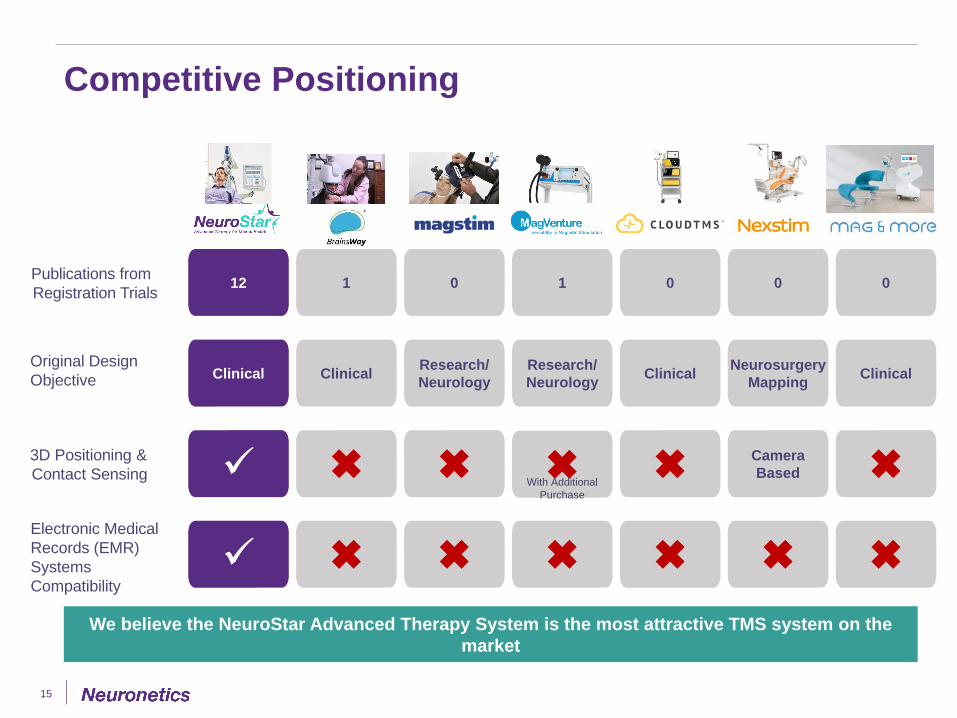
12
Clinical
1
Clinical
Publications from Registration Trials
Original DesignObjective
3D Positioning & Contact Sensing
Electronic Medical Records (EMR)Systems Compatibility
Research/Neurology
Research/Neurology
Clinical
Neurosurgery Mapping
0 1 0 0
Camera Based
We believe the NeuroStar Advanced Therapy System is the most attractive TMS system on the market
Clinical
0
With Additional Purchase

Barriers to Entry
16
Barriers to Market Entry
Proprietary technology with a broad intellectual property portfolio
Large, direct sales force
Comprehensive customer support and practice development resources
Significant body of clinical data and key opinion leader support
Significant know how and capital required to replicate our infrastructure
A market leader in TMS therapy, first mover

Japan Growth Opportunity
17
• Primary international focus is on Japan• Third largest healthcare spend globally• Single payor healthcare system• Shonin Approval: September 2017• Exclusive distribution agreement with Teijin
Pharma signed October 2017• Teijin to promote sales of systems and
treatment sessions• Minimum purchase requirements• Milestone payments received in 2017, $2.8M
• Reimbursement listing effective June 2019• 2nd Milestone payment received in 2019, $0.7M• 158 hospitals qualified• Approved reimbursement amount is ¥12,000
Japan represents a large market opportunity
Adults Suffering from MDD2.4 million2
Treated by a Psychiatrist655,0002
Failed to achieve remission475,0003
Estimated TAM in Japan for Treatment Sessions1
~$600 Million Addressable Market
1. Assumes psychiatrist reimbursement levels per treatment course are similar to those in the U.S.2. Source: National Center for Biotechnology and Information 3. Estimate based on Star*D data and all of whom covered by Japan’s single payor healthcare system
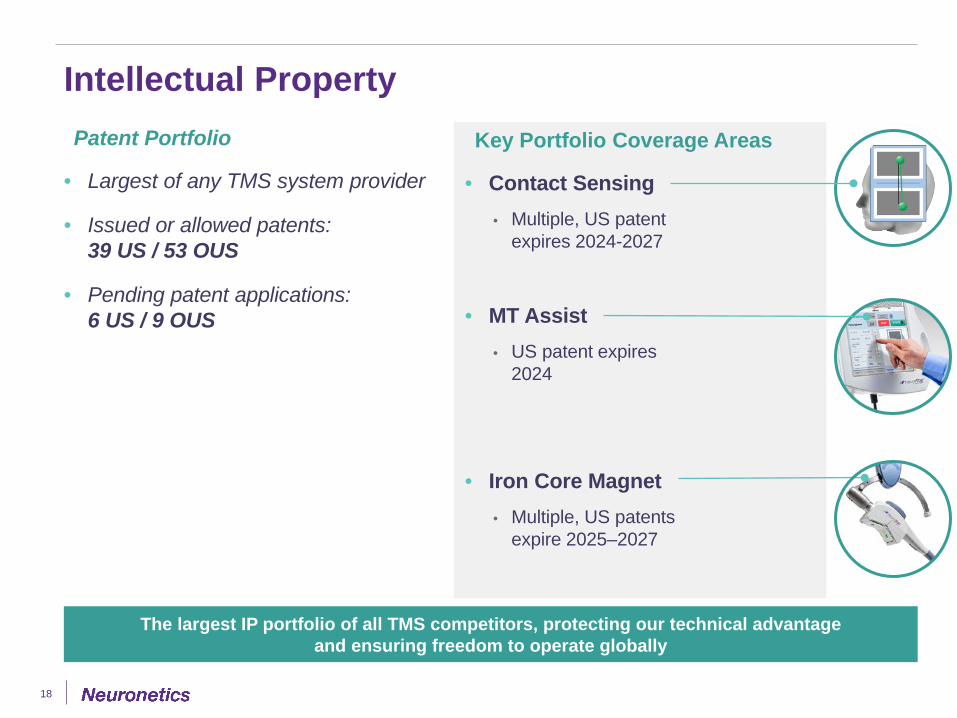
Patent Portfolio
• Largest of any TMS system provider
• Issued or allowed patents:39 US / 53 OUS
• Pending patent applications:6 US / 9 OUS
Intellectual Property
18
Key Portfolio Coverage Areas
• Contact Sensing• Multiple, US patent
expires 2024-2027
• MT Assist• US patent expires
2024
• Iron Core Magnet• Multiple, US patents
expire 2025–2027
The largest IP portfolio of all TMS competitors, protecting our technical advantage and ensuring freedom to operate globally
Management and Board of Directors
19
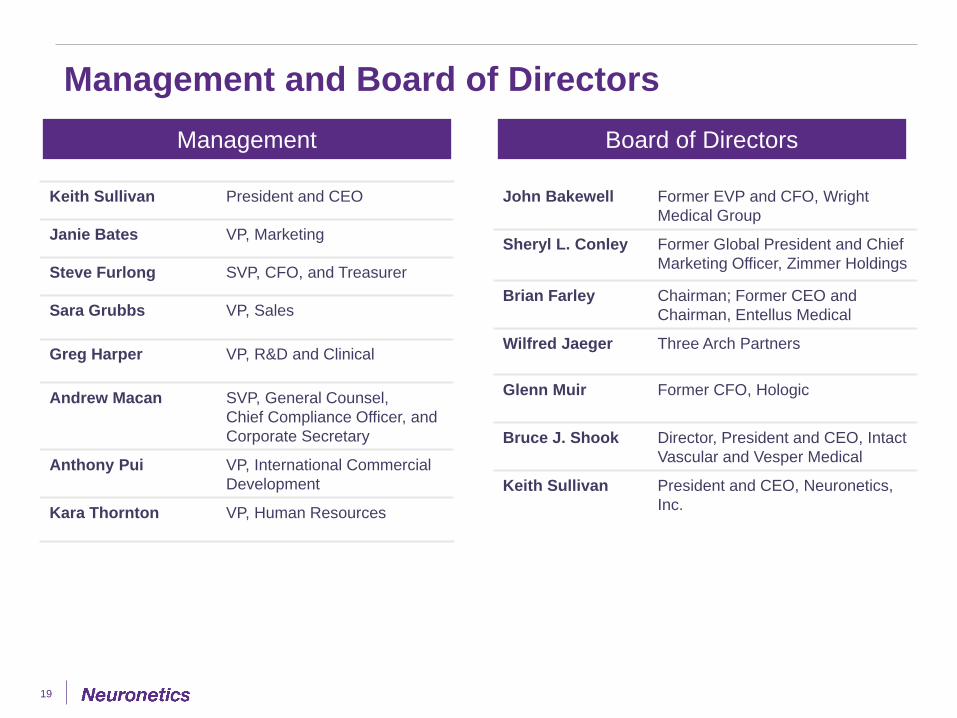
Keith Sullivan President and CEO
Janie Bates VP, Marketing
Steve Furlong SVP, CFO, and Treasurer
Sara Grubbs VP, Sales
Greg Harper VP, R&D and Clinical
Andrew Macan SVP, General Counsel, Chief Compliance Officer, and Corporate Secretary
Anthony Pui VP, International Commercial Development
Kara Thornton VP, Human Resources
John Bakewell Former EVP and CFO, Wright Medical Group
Sheryl L. Conley Former Global President and Chief Marketing Officer, Zimmer Holdings
Brian Farley Chairman; Former CEO and Chairman, Entellus Medical
Wilfred Jaeger Three Arch Partners
Glenn Muir Former CFO, Hologic
Bruce J. Shook Director, President and CEO, Intact Vascular and Vesper Medical
Keith Sullivan President and CEO, Neuronetics, Inc.
Management Board of Directors

Financial Overview

Annual Revenue
21
$51.5 $60.8
$47.5
$58.0-$62.0
$1.3
$1.9
$0.0
$10.0
$20.0
$30.0
$40.0
$50.0
$60.0
$70.0
2018 2019 2020 2021US OUS
$1.7
$62.7
$52.8$49.2
($ in millions)
Annual Revenue by Geography Annual Product Revenue (US)
$14.6 $18.0 $11.1
$35.3
$41.1
$34.9
$1.6
$1.6
$1.6
$51.5 $47.5
$0.0
$10.0
$20.0
$30.0
$40.0
$50.0
$60.0
2018 2019 2020NeuroStar Systems Treatment Sessions Other
$60.8

$10.2
$13.3 $13.7 $15.6
$12.7
$16.6 $16.0 $17.4
$11.5
$9.7
$12.4
$15.6
$11.0-$12.0
$0
$6
$12
$18
Q12018
Q22018
Q32018
Q42018
Q12019
Q22019
Q32019
Q42019
Q12020
Q22020
Q32020
Q42020
Q12021
Worldwide Quarterly Revenue
22
($ in millions)
Q3 2020 and Q4 2020 both had double digit sequential growth of 28% and 25% respectively
Guidance
Results of Operations
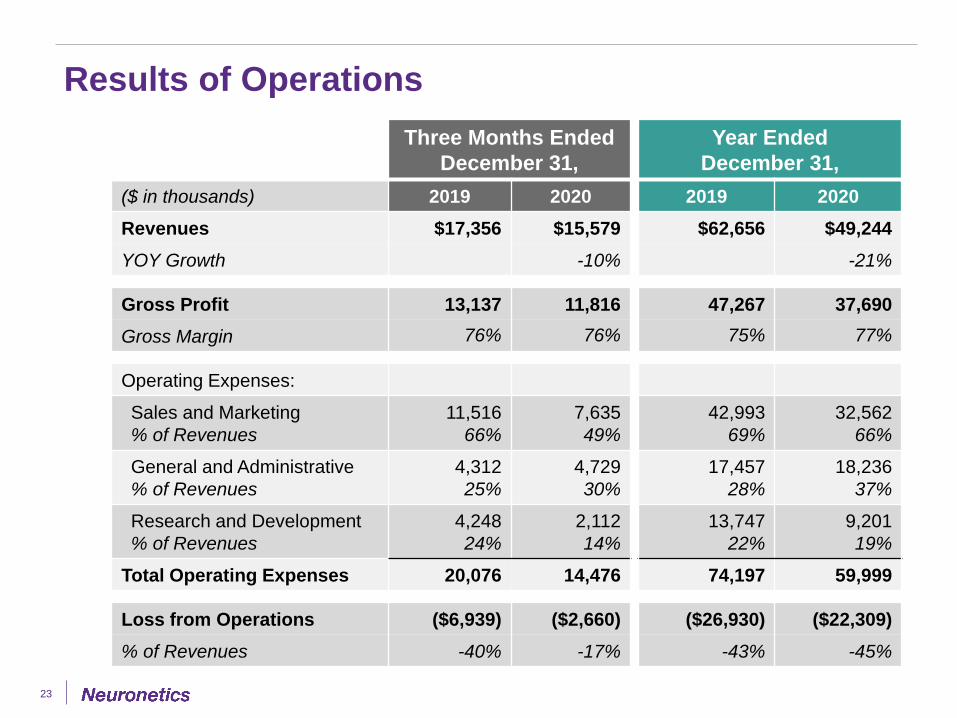
23
Three Months Ended December 31,
($ in thousands) 2019 2020Revenues $17,356 $15,579YOY Growth -10%
Gross Profit 13,137 11,816Gross Margin 76% 76%
Operating Expenses:
Sales and Marketing% of Revenues
11,51666%
7,63549%
General and Administrative% of Revenues
4,31225%
4,72930%
Research and Development% of Revenues
4,24824%
2,11214%
Total Operating Expenses 20,076 14,476
Loss from Operations ($6,939) ($2,660)% of Revenues -40% -17%
Year Ended December 31,
2019 2020$62,656 $49,244
-21%
47,267 37,69075% 77%
42,99369%
32,56266%
17,45728%
18,23637%
13,74722%
9,20119%
74,197 59,999
($26,930) ($22,309)-43% -45%

Financial Position
24
($ in thousands) As of December 31, 2020Cash and Cash Equivalents $48,957
Other Assets $29,700
Total Assets $78,657
Long-term Debt, net $34,620
Convertible Preferred Stock Warrant Liability
$0
Convertible Preferred Stock $0
Accumulated Deficit ($277,540)
Total Stockholders’ Equity $25,493

25
Supplemental Information
U.S. NeuroStar Unit Sales, Active Sites, and Installed Base
26
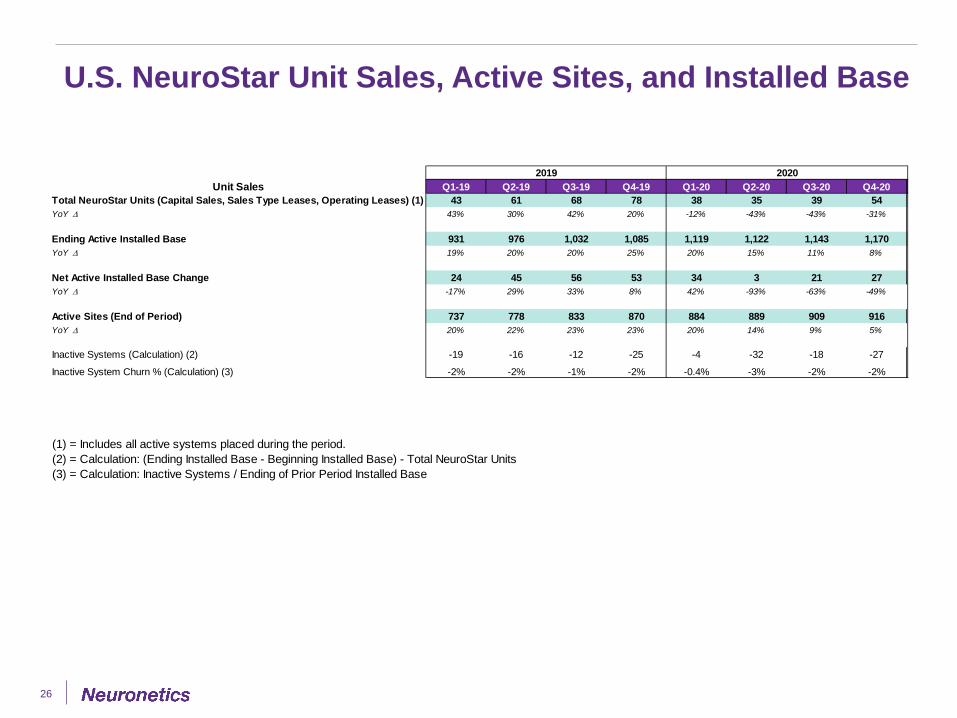
Unit Sales Q1-19 Q2-19 Q3-19 Q4-19 Q1-20 Q2-20 Q3-20 Q4-20Total NeuroStar Units (Capital Sales, Sales Type Leases, Operating Leases) (1) 43 61 68 78 38 35 39 54YoY ∆ 43% 30% 42% 20% -12% -43% -43% -31%
Ending Active Installed Base 931 976 1,032 1,085 1,119 1,122 1,143 1,170YoY ∆ 19% 20% 20% 25% 20% 15% 11% 8%
Net Active Installed Base Change 24 45 56 53 34 3 21 27YoY ∆ -17% 29% 33% 8% 42% -93% -63% -49%
Active Sites (End of Period) 737 778 833 870 884 889 909 916YoY ∆ 20% 22% 23% 23% 20% 14% 9% 5%
Inactive Systems (Calculation) (2) -19 -16 -12 -25 -4 -32 -18 -27
Inactive System Churn % (Calculation) (3) -2% -2% -1% -2% -0.4% -3% -2% -2%
20202019
(1) = Includes all active systems placed during the period.(2) = Calculation: (Ending Installed Base - Beginning Installed Base) - Total NeuroStar Units(3) = Calculation: Inactive Systems / Ending of Prior Period Installed Base

U.S. NeuroStar Revenue
27
(4) = Revenue includes NeuroStar System Capital Sales and Sales Type Leases(5) = Revenue derived from Operating Lease revenue amortization during the period(6) = Revenue derived from Treatment Coils in U.S.
NeuroStar Revenue Q1-19 Q2-19 Q3-19 Q4-19 Q1-20 Q2-20 Q3-20 Q4-20Total U.S. NeuroStar Revenue ($000s) $3,350 $4,628 $4,616 $5,413 $2,594 $2,338 $2,541 $3,620YoY ∆ 41% 30% 18% 14% -23% -49% -45% -33%
U.S. NeuroStar Capital Revenue ($000s) (4) $2,939 $4,034 $4,264 $4,959 $2,410 $2,224 $2,438 $3,446YoY ∆ 54% 23% 24% 14% -18% -45% -43% -31%
U.S. NeuroStar Operating Lease Revenue ($000s) (5) $182 $187 $184 $177 $155 $114 $88 $79YoY ∆ -29% 3% -31% -24% -15% -39% -52% -55%
U.S. NeuroStar Other ($000s) (6) $229 $407 $167 $278 $29 $0 $15 $96YoY ∆ 11% 239% -21% 50% -87% -100% -91% -66%
20202019
U.S. NeuroStar Treatment Sessions
28
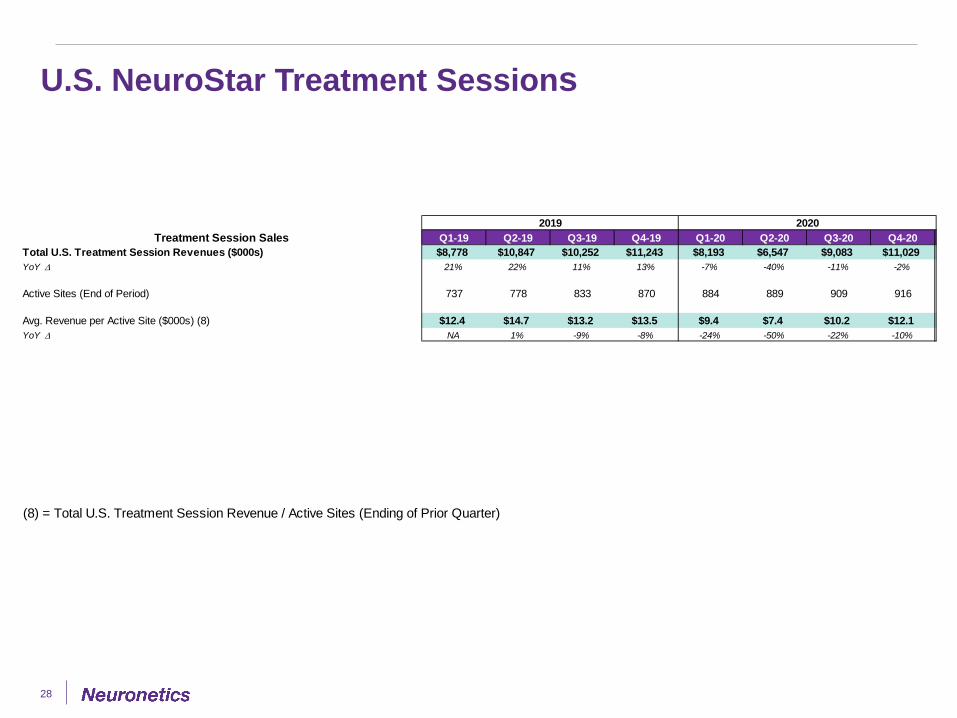
Treatment Session Sales Q1-19 Q2-19 Q3-19 Q4-19 Q1-20 Q2-20 Q3-20 Q4-20Total U.S. Treatment Session Revenues ($000s) $8,778 $10,847 $10,252 $11,243 $8,193 $6,547 $9,083 $11,029YoY ∆ 21% 22% 11% 13% -7% -40% -11% -2%
Active Sites (End of Period) 737 778 833 870 884 889 909 916
Avg. Revenue per Active Site ($000s) (8) $12.4 $14.7 $13.2 $13.5 $9.4 $7.4 $10.2 $12.1YoY ∆ NA 1% -9% -8% -24% -50% -22% -10%
2019 2020
(8) = Total U.S. Treatment Session Revenue / Active Sites (Ending of Prior Quarter)
Neuronetics, Inc. Supplemental Financial and Operating Information
29
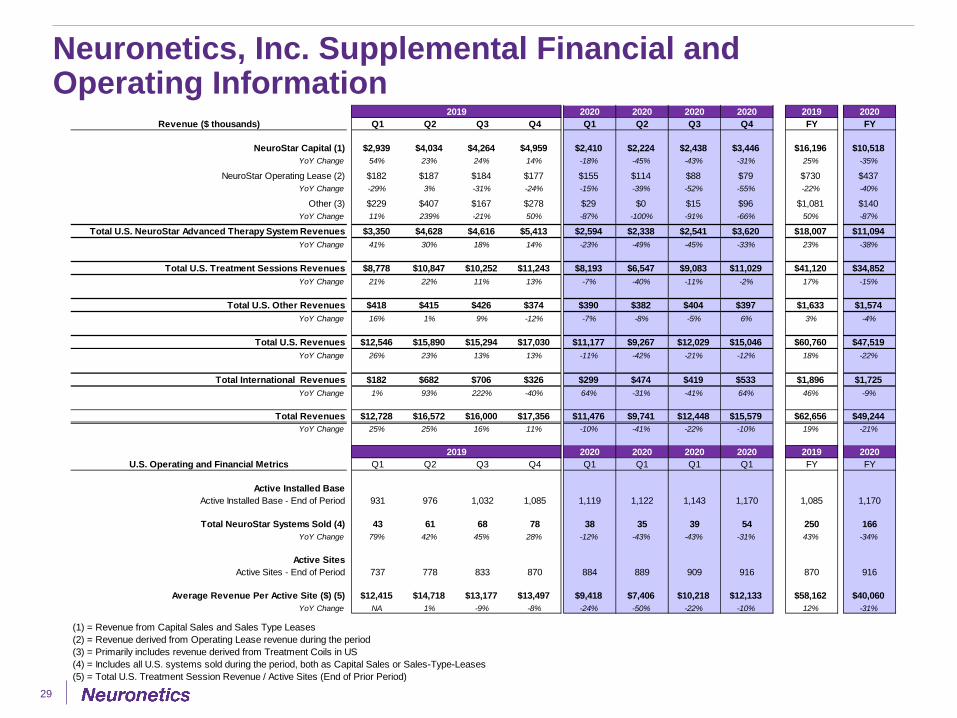
2020 2020 2020 2020 2019 2020Revenue ($ thousands) Q1 Q2 Q3 Q4 Q1 Q2 Q3 Q4 FY FY
NeuroStar Capital (1) $2,939 $4,034 $4,264 $4,959 $2,410 $2,224 $2,438 $3,446 $16,196 $10,518YoY Change 54% 23% 24% 14% -18% -45% -43% -31% 25% -35%
NeuroStar Operating Lease (2) $182 $187 $184 $177 $155 $114 $88 $79 $730 $437YoY Change -29% 3% -31% -24% -15% -39% -52% -55% -22% -40%
Other (3) $229 $407 $167 $278 $29 $0 $15 $96 $1,081 $140YoY Change 11% 239% -21% 50% -87% -100% -91% -66% 50% -87%
Total U.S. NeuroStar Advanced Therapy System Revenues $3,350 $4,628 $4,616 $5,413 $2,594 $2,338 $2,541 $3,620 $18,007 $11,094YoY Change 41% 30% 18% 14% -23% -49% -45% -33% 23% -38%
Total U.S. Treatment Sessions Revenues $8,778 $10,847 $10,252 $11,243 $8,193 $6,547 $9,083 $11,029 $41,120 $34,852YoY Change 21% 22% 11% 13% -7% -40% -11% -2% 17% -15%
Total U.S. Other Revenues $418 $415 $426 $374 $390 $382 $404 $397 $1,633 $1,574YoY Change 16% 1% 9% -12% -7% -8% -5% 6% 3% -4%
Total U.S. Revenues $12,546 $15,890 $15,294 $17,030 $11,177 $9,267 $12,029 $15,046 $60,760 $47,519YoY Change 26% 23% 13% 13% -11% -42% -21% -12% 18% -22%
Total International Revenues $182 $682 $706 $326 $299 $474 $419 $533 $1,896 $1,725YoY Change 1% 93% 222% -40% 64% -31% -41% 64% 46% -9%
Total Revenues $12,728 $16,572 $16,000 $17,356 $11,476 $9,741 $12,448 $15,579 $62,656 $49,244YoY Change 25% 25% 16% 11% -10% -41% -22% -10% 19% -21%
2020 2020 2020 2020 2019 2020U.S. Operating and Financial Metrics Q1 Q2 Q3 Q4 Q1 Q1 Q1 Q1 FY FY
Active Installed BaseActive Installed Base - End of Period 931 976 1,032 1,085 1,119 1,122 1,143 1,170 1,085 1,170
Total NeuroStar Systems Sold (4) 43 61 68 78 38 35 39 54 250 166YoY Change 79% 42% 45% 28% -12% -43% -43% -31% 43% -34%
Active SitesActive Sites - End of Period 737 778 833 870 884 889 909 916 870 916
Average Revenue Per Active Site ($) (5) $12,415 $14,718 $13,177 $13,497 $9,418 $7,406 $10,218 $12,133 $58,162 $40,060YoY Change NA 1% -9% -8% -24% -50% -22% -10% 12% -31%
2019
2019
(1) = Revenue from Capital Sales and Sales Type Leases(2) = Revenue derived from Operating Lease revenue during the period(3) = Primarily includes revenue derived from Treatment Coils in US(4) = Includes all U.S. systems sold during the period, both as Capital Sales or Sales-Type-Leases(5) = Total U.S. Treatment Session Revenue / Active Sites (End of Prior Period)
3222 Phoenixville PikeMalvern, PA 19355www.neurostar.com610.640.4202