Embed Size (px)
Citation preview

Neural evidence that three dimensions organize mentalstate representation: Rationality, social impact,and valenceDiana I. Tamira,1, Mark A. Thorntonb,1,2, Juan Manuel Contrerasc, and Jason P. Mitchellb
aDepartment of Psychology, Princeton University, Princeton, NJ 08544; bDepartment of Psychology, Harvard University, Cambridge, MA 02138; and cWhiteHouse Social and Behavioral Sciences Team, Washington, DC 20006
Edited by Uta Frith, University College London, London, United Kingdom, and approved October 30, 2015 (received for review June 17, 2015)
How do people understand the minds of others? Existing psycho-logical theories have suggested a number of dimensions thatperceivers could use to make sense of others’ internal mental states.However, it remains unclear which of these dimensions, if any, thebrain spontaneously uses when we think about others. The presentstudy used multivoxel pattern analysis (MVPA) of neuroimagingdata to identify the primary organizing principles of social cognition.We derived four unique dimensions of mental state representationfrom existing psychological theories and used functional magneticresonance imaging to test whether these dimensions organize theneural encoding of others’ mental states. MVPA revealed that threesuch dimensions could predict neural patterns within the medialprefrontal and parietal cortices, temporoparietal junction, and ante-rior temporal lobes during social thought: rationality, social impact,and valence. These results suggest that these dimensions serve asorganizing principles for our understanding of other people.
social cognition | theory of mind | mentalizing | functional magneticresonance imaging | multivoxel pattern analysis
The human mind plays host to a panoply of thoughts, feelings,intentions, and impressions. External observers can never
directly perceive these mental states—one can never see “nos-talgia” nor touch “awe.” Nevertheless, humans are quite adept atrepresenting other people’s internal states. Our ability to per-ceive and distinguish among the rich set of others’ mental statesserves as the bedrock of human social life. We understand thefine differences between pure joy and schadenfreude and judge afriend’s glee accordingly. Our ability to distinguish a partner’ssympathy from sarcasm can make a world of difference to a re-lationship. Legal decisions frequently hinge on nuanced mentaldistinctions such as that between inattention and intentionalneglect. How do people navigate such complexities in others’internal mental worlds?One crucial tool for any navigator is a compass: a set of di-
mensions that help organize the contents of the world. By at-tending to the position of others’mental states on key dimensions,humans might reduce the complexity of others’minds to just a fewessential elements—coordinates on a map. Might navigators ofthe world of mental states make use of such an intuitive compass?Research in other domains of cognition suggests such organizationmight be possible: The brain has a demonstrated capacity forextracting and capitalizing on useful regularities in the world. Forexample, our object representation system makes use of dimen-sions such as size and animacy to organize its processing tracts (1).Here, we explore the possibility that similar principles may orga-nize our representations of other people’s minds.Decades of research in social cognitive neuroscience, primarily
using functional magnetic resonance imaging (fMRI), have al-ready implicated a well-defined set of brain regions in the pro-cess of thinking about mental states: Thinking about the lives andminds of others reliably engages a network including the medialprefrontal cortex (MPFC), medial parietal cortex (MPC), tem-poroparietal junction (TPJ), superior temporal sulcus (STS), andthe anterior temporal lobe (ATL) (for a review, see refs. 2 and 3).
However, this relatively young field has yet to explain how thesocial brain’s hardware processes the richness and complexity ofothers’ mental states. Fortunately, research in psychology suppliesa set of theories regarding how people might organize theirknowledge of mental states. The dimensions of these theoriesinclude valence and arousal (4, 5), warmth and competence (6, 7),agency and experience (8), emotion and reason, mind and body(9), social and nonsocial (2, 10, 11), and uniquely human andshared with animals (12). Any of these dimensions might plausiblyplay a role in organizing our understanding of mental states. Butwhich, if any, do we spontaneously use during mentalizing? If adimension actually matters to the way people typically think aboutothers’ mental states, we should see evidence that the brain or-ganizes its activity around that dimension. However, merely lo-cating where in the brain mental state processing occurs—as socialneuroscience has done so well already—cannot tell us how theseregions represent mental states.Fortunately, new analytic techniques in functional neuro-
imaging, under the umbrella of multivariate or multivoxel patternanalysis (MVPA), enable us to bridge these levels of analysis.MVPA examines activity in distributed sets of voxels, allowing fordiscrimination between stimuli by their associated patterns of ac-tivity even when absolute magnitudes of activity remain constant.In this study, we use the form of MVPA known as representationalsimilarity analysis (13) to test which psychological dimensionsorganize people’s understanding of mental states. These analyseswork by measuring the extent to which neural patterns of activitycan be predicted from theories of representational organization.To illustrate, the dimension “arousal” would predict that “ecstasy”and “rage” are represented very similarly in the brain because both
Significance
This study uses advanced functional neuroimaging analyses totest both existing and novel psychological theories about howwe understand others’ minds. Analyses show that three di-mensions—rationality, social impact, and valence—account foralmost half of the variation in the neural representation ofmental states, the most comprehensive theory to date regardingour ability to think about others’ minds. These findings bothinform long-standing debates within social psychology abouttheory of mind and generate testable predictions about how ourneural hardware supports our ability to mentalize.
Author contributions: D.I.T., M.A.T., J.M.C., and J.P.M. designed research; D.I.T., M.A.T.,and J.M.C. performed research; D.I.T. and M.A.T. analyzed data; and D.I.T., M.A.T., andJ.P.M. wrote the paper.
The authors declare no conflict of interest.
This article is a PNAS Direct Submission.
Data deposition: The neuroimaging data have been deposited in the Harvard UniversityDataverse, https://dataverse.harvard.edu (accession ELLLZM).1D.I.T. and M.A.T. contributed equally to this work.2To whom correspondence should be addressed. Email: [email protected].
This article contains supporting information online at www.pnas.org/lookup/suppl/doi:10.1073/pnas.1511905112/-/DCSupplemental.
www.pnas.org/cgi/doi/10.1073/pnas.1511905112 PNAS Early Edition | 1 of 6
NEU
ROSC
IENCE
PSYC
HOLO
GICALAND
COGNITIVESC
IENCE
S

are similarly intense mental states. In contrast, the dimension “va-lence” would predict that “ecstasy” and “rage” are represented verydifferently in the brain because one state is very positive, whereasthe other is very negative. Both predictions can be tested by mea-suring the extent to which patterns of neural activity elicited bythinking about a person in ecstasy are similar to those elicited bythinking about a person in a fit of rage. Each dimension makesthousands of predictions about the similarity of each mental statecompared with each other mental state; representational similarityanalysis allows us to assess the accuracy of all of these predictionssimultaneously. Thus, we can test which psychological dimensionscapture the way the brain encodes others’ mental states.
ResultsRefining Psychological Theories. We used 16 dimensions extractedfrom the psychological literature as a starting point for developinga theory of mental state representation: positive, negative, higharousal, low arousal, warmth, competence, agency, experience,emotion, reason, mind, body, social, nonsocial, shared, andunique. Note that these initial dimensions are nominal—in manycases they merely represent different poles of the same underlyingvariable—but we initially analyze them separately to remainmaximally agnostic to the possible covariance between them. Todetermine what predictions each dimension would make aboutmental state representation—that is, which mental states werepredicted to be similar or different with regard to each dimension—we used a large online sample (n = 1,205) to measure the positionof 166 mental states on each dimension. Ratings across manyof the dimensions were highly correlated (Fig. S1). We distilledthe overlapping intuitions embodied in the original dimensionsdown to a smaller set of nonredundant dimensions using principalcomponent analysis (PCA).The PCA revealed a much simpler set of four orthogonal di-
mensions, each with easily interpretable loadings (Fig. 1). The firstcomponent, which we term “rationality,” loaded highly in onedirection on the original dimensions experience, emotion, andwarmth, and loaded highly in the opposite direction on compe-tence, reason, and agency. States such as embarrassment and ec-stasy occupy one pole of this dimension whereas the other pole isoccupied by states such as planning and decision. The secondcomponent, which we term “social impact,” loaded positively onthe dimensions high arousal and social, and negatively on lowarousal and nonsocial. States such as dominance, friendliness, andlust rate highly on social impact whereas sleepiness and pensive-ness rate as minimally impactful. The third component, which weterm “human mind,” loaded positively on unique to humans andmind, and negatively on shared with other animals and body.States high in human mind include those like imagination or self-pity whereas states such as fatigue and stupor are considered morephysical in nature. The fourth component, which we term “va-lence,” loaded positively on positive and warmth, and negativelyon negative. Positive states include affection and satisfactionwhereas negative states include disgust and disarray. From eachPCA dimension, we derived predictions about the similarity ofeach mental state to the others by calculating their psychologicalsimilarity as the absolute difference between the positions ofmental states on each dimension. These predictions were testedagainst the neural data using representational similarity analysis,allowing us to see whether patterns of neural activity elicited bythinking about mental states reflected each dimension.
Neural Patterns Representing PCA Dimensions. Participants werescanned while performing a task designed to elicit their thoughtsabout 60 mental states (Table S1). On each trial, participants sawthe name of a mental state (e.g., “awe”) and decided which of twoscenarios would better evoke that mental state in another person(e.g., “seeing the pyramids” or “watching a meteor shower”). Thistask allowed us to estimate neural representations for each of 60mental states by averaging the patterns elicited across the variedscenarios. We estimated the pairwise similarity of the neuralrepresentations of the 60 states by correlating their activity patterns.
These measures of neural similarity were then regressed ontothe predictions of psychological similarity made by the four PCA-derived dimensions. For example, if mental states that ratedsimilarly on the valence dimension (such as “affection” and“inspiration”) also elicited similar neural patterns of activity, theregression would reveal that valence was a strong predictor ofneural pattern similarity. We would take this result as evidence thatmental state representations—embodied by these neural patterns—were indeed organized by valence. This process was conducted re-peatedly using local patterns extracted from throughout the brain ofeach participant. Regression maps for each dimension were com-bined across participants using t tests, thus revealing which dimen-sions reliably organized mental state representations in each regionof the brain.This analysis revealed that three PCA-derived psychological di-
mensions organize the way the brain represents mental states. Mostregions implicated in mental state representation fell within a net-work of regions previously implicated in social cognition (Fig. 2 andTable S2). The “rationality” dimension predicted the similarity ofpatterns of neural activity in portions of the dorsolateral prefrontalcortex (DLPFC), ventral lateral prefrontal cortex (VLPFC), dorsalmedial prefrontal cortex (DMPFC), lateral orbitofrontal cortex(OFC), and anterior temporal lobe (ATL) bilaterally (Fig. 2A). The“social impact” dimension robustly predicted neural pattern simi-larity in a widespread set of regions, including significant clusters inthe DLPFC, VLPFC, DMPFC, VMPFC, anterior cingulate cortex(ACC), posterior cingulate cortex (PCC), precuneus, temporopar-ietal junction (TPJ) extending into the posterior superior temporalsulcus (pSTS) and ATL (Fig. 2B). The valence dimension predictedneural pattern similarity in a completely left-lateralized set of re-gions including the DLPFC, VLPFC, and TPJ (Fig. 2C). Finally, the“human mind” dimension captured a spatially restricted set ofneural patterns, predicting representations in only a single region inthe posterior parahippocampal cortex (Fig. 2D).This analysis identified regions of the brain within which local
patterns of activity were predicted by the PCA-based models. Totest whether relevant patterns of activity were represented in amore distributed manner, we conducted a network-wide analysis.In this analysis, we extracted a single set of activity patterns fromacross the entirety of a neural network sensitive to mental state
Fig. 1. Principal component loadings. Principal component loadings of the 16existing theoretical dimensions onto the optimal four-dimensional solution.
2 of 6 | www.pnas.org/cgi/doi/10.1073/pnas.1511905112 Tamir et al.

content. As with the whole brain analysis, the neural similarity ofeach pair of mental states was estimated, and the results werecorrelated with the predictions of the PCA-derived dimensions.Results showed that three dimensions significantly predictednetwork-level patterns: rationality [r = 0.16; 95% bootstrapconfidence interval (CI) (0.06, 0.20)], social impact [r = 0.21;95% bootstrap CI (0.12, 0.26)], and valence [r = 0.12; 95%bootstrap CI (0.04, 0.17)]. The human mind dimension [r = 0.05;95% bootstrap CI (−0.01, 0.10)] did not (Fig. 3B). Results of amultidimensional scaling analysis (Fig. S2) allowed us to esti-mate that the dimensions of rationality, social impact, and va-lence collectively account for approximately one-third of thevariance in neural patterns underlying mental state representa-tion (weighted total R2 = 0.33) (SI Text). Disattenuating thisvalue by dividing it by the reliability of the neural similarity (α =0.69) yielded a final R2 = 0.47. The results of the networkanalyses were highly robust to different analytic approaches (SIText). Statistically controlling for the influence of scenario con-creteness, complexity, and familiarity did not produce any quali-tative changes in the outcomes. Using independent componentanalysis (ICA) instead of PCA to generate dimensions, conductingthe analysis with Spearman rank correlations, and using a meta-analysis-based feature selection method all produced very similarresults. Further, results were not contingent on the use of statisticalsignificance: The same three dimensions emerged from a modelselection technique based on cross-validation performance (14)(Fig. S3). Finally, allowing two-way interactions between dimensionsdid not alter the significance of the main effects although threesignificant interactions were observed: human mind with rationality,human mind with social impact, and social impact with valence.
Neural Patterns Representing Theoretical Models. Although theprimary purpose of this study was to discover the organization ofmental state representation, we also tested whether the sevenpsychological theories from which we drew our PCA dimensionscould predict neural representations of mental states. To do so,we repeated the whole brain and network-level representationalsimilarity analysis with the original psychological dimensions.Whole brain analyses on each of the seven extant theoreticalmodels revealed regions of the brain within which patterns ofneural activity were predicted by each model (Fig. 4 and TableS3). The valence and arousal model (Fig. 4A) predicted patternsof activity in a number of regions, including the PCC, ACC, bi-lateral lateral temporoparietal cortex, left lateral and anteriortemporal cortex, bilateral DLPFC, and both rostral and caudalportions of the DMPFC. The warmth and competence model(Fig. 4B) predicted patterns of activity in the left TPJ, rostral andcaudal DMPFC, bilateral ATL, bilateral VLPFC, and bilateralDLPFC. Agency and experience (Fig. 4C) and emotion reason(Fig. 4D) produced very similar results, an unsurprising outcomegiven the degree of correlation between these models. Thesemodels both predicted patterns of activity in the VMPFC, rostralDMPFC, bilateral ATL, bilateral VLPFC and DLPFC, andportions of the lateral temporal cortex. The mind and body di-mensions (Fig. 4E) predicted patterns in a proximal but distinctset of regions to those discussed above, including the ACC, PCC,TPJ, and portions of the lateral prefrontal cortex. Sociality (Fig.4F) and human uniqueness (Fig. 4G) models both predictedmuch less extensive clusters of activity, with both appearing inthe precuneus and uniqueness also appearing in a posteriorportion of the parahippocampal gyrus.
Fig. 2. Searchlight results indicating regionssensitive to the (A) rationality, (B) social impact,(C) valence, and (D) human mind of others’mental states. Within the yellow/orange re-gions, the similarity of patterns elicited bythinking about mental states can be explainedin terms of the corresponding social cognitivedimension extracted from existing theories viaPCA (P < 0.05, corrected). Representationalsimilarity searchlight analyses were conductedon each participant and combined throughone-sample random-effects t tests.
Fig. 3. Network-wide representational similarity analysis. (A) Whole brain ANOVA used for feature selection (voxelwise P < 0.0001). Different mental statesreliably elicited different levels of univariate activity within these regions. (B) Bar graphs of model fits for dimensions derived via principal component analysisfrom existing psychological theories. (C) Bar graphs of model fits for existing psychological models. All model fits are given in terms of Pearson product-moment correlations between neural pattern similarity and model predictions, with error bars indicating bootstrapped SEs. Note that bars in B refer toindividual dimensions derived via PCA whereas bars in C indicate the performance of full multidimensional theories. The theoretical advantage of thesynthetic model presented here can thus be seen by comparing any one bar in C with the combination of the three significant bars in B.
Tamir et al. PNAS Early Edition | 3 of 6
NEU
ROSC
IENCE
PSYC
HOLO
GICALAND
COGNITIVESC
IENCE
S
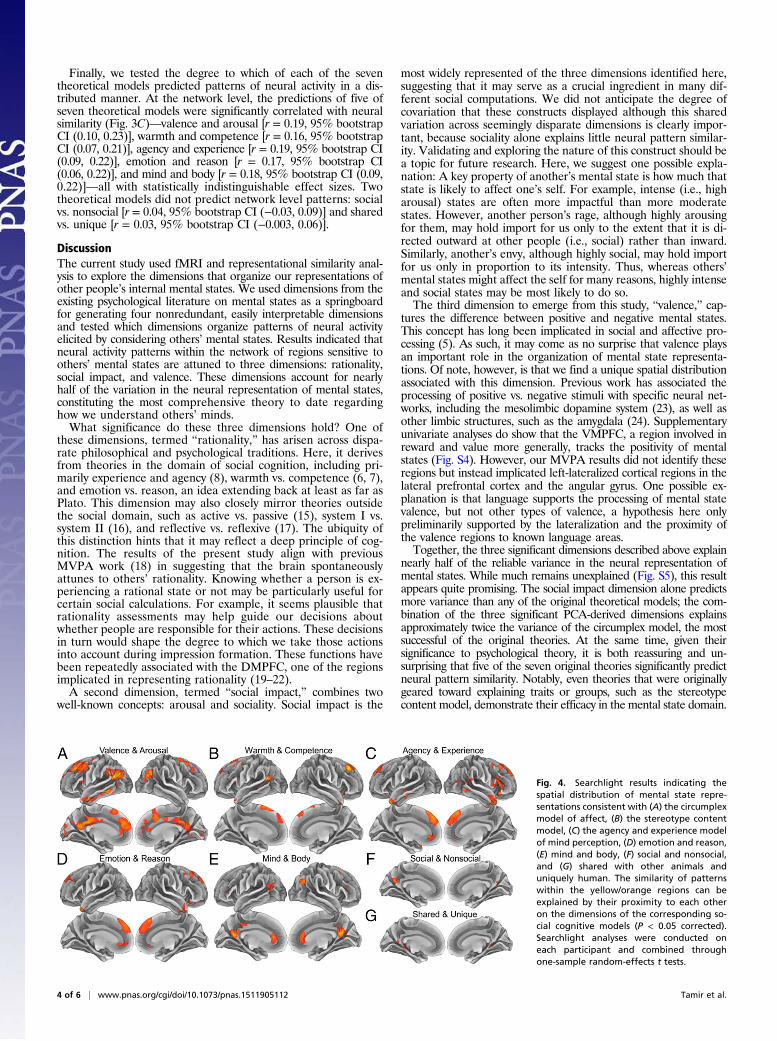
Finally, we tested the degree to which of each of the seventheoretical models predicted patterns of neural activity in a dis-tributed manner. At the network level, the predictions of five ofseven theoretical models were significantly correlated with neuralsimilarity (Fig. 3C)—valence and arousal [r = 0.19, 95% bootstrapCI (0.10, 0.23)], warmth and competence [r = 0.16, 95% bootstrapCI (0.07, 0.21)], agency and experience [r = 0.19, 95% bootstrap CI(0.09, 0.22)], emotion and reason [r = 0.17, 95% bootstrap CI(0.06, 0.22)], and mind and body [r = 0.18, 95% bootstrap CI (0.09,0.22)]—all with statistically indistinguishable effect sizes. Twotheoretical models did not predict network level patterns: socialvs. nonsocial [r = 0.04, 95% bootstrap CI (−0.03, 0.09)] and sharedvs. unique [r = 0.03, 95% bootstrap CI (−0.003, 0.06)].
DiscussionThe current study used fMRI and representational similarity anal-ysis to explore the dimensions that organize our representations ofother people’s internal mental states. We used dimensions from theexisting psychological literature on mental states as a springboardfor generating four nonredundant, easily interpretable dimensionsand tested which dimensions organize patterns of neural activityelicited by considering others’ mental states. Results indicated thatneural activity patterns within the network of regions sensitive toothers’ mental states are attuned to three dimensions: rationality,social impact, and valence. These dimensions account for nearlyhalf of the variation in the neural representation of mental states,constituting the most comprehensive theory to date regardinghow we understand others’ minds.What significance do these three dimensions hold? One of
these dimensions, termed “rationality,” has arisen across dispa-rate philosophical and psychological traditions. Here, it derivesfrom theories in the domain of social cognition, including pri-marily experience and agency (8), warmth vs. competence (6, 7),and emotion vs. reason, an idea extending back at least as far asPlato. This dimension may also closely mirror theories outsidethe social domain, such as active vs. passive (15), system I vs.system II (16), and reflective vs. reflexive (17). The ubiquity ofthis distinction hints that it may reflect a deep principle of cog-nition. The results of the present study align with previousMVPA work (18) in suggesting that the brain spontaneouslyattunes to others’ rationality. Knowing whether a person is ex-periencing a rational state or not may be particularly useful forcertain social calculations. For example, it seems plausible thatrationality assessments may help guide our decisions aboutwhether people are responsible for their actions. These decisionsin turn would shape the degree to which we take those actionsinto account during impression formation. These functions havebeen repeatedly associated with the DMPFC, one of the regionsimplicated in representing rationality (19–22).A second dimension, termed “social impact,” combines two
well-known concepts: arousal and sociality. Social impact is the
most widely represented of the three dimensions identified here,suggesting that it may serve as a crucial ingredient in many dif-ferent social computations. We did not anticipate the degree ofcovariation that these constructs displayed although this sharedvariation across seemingly disparate dimensions is clearly impor-tant, because sociality alone explains little neural pattern similar-ity. Validating and exploring the nature of this construct should bea topic for future research. Here, we suggest one possible expla-nation: A key property of another’s mental state is how much thatstate is likely to affect one’s self. For example, intense (i.e., higharousal) states are often more impactful than more moderatestates. However, another person’s rage, although highly arousingfor them, may hold import for us only to the extent that it is di-rected outward at other people (i.e., social) rather than inward.Similarly, another’s envy, although highly social, may hold importfor us only in proportion to its intensity. Thus, whereas others’mental states might affect the self for many reasons, highly intenseand social states may be most likely to do so.The third dimension to emerge from this study, “valence,” cap-
tures the difference between positive and negative mental states.This concept has long been implicated in social and affective pro-cessing (5). As such, it may come as no surprise that valence playsan important role in the organization of mental state representa-tions. Of note, however, is that we find a unique spatial distributionassociated with this dimension. Previous work has associated theprocessing of positive vs. negative stimuli with specific neural net-works, including the mesolimbic dopamine system (23), as well asother limbic structures, such as the amygdala (24). Supplementaryunivariate analyses do show that the VMPFC, a region involved inreward and value more generally, tracks the positivity of mentalstates (Fig. S4). However, our MVPA results did not identify theseregions but instead implicated left-lateralized cortical regions in thelateral prefrontal cortex and the angular gyrus. One possible ex-planation is that language supports the processing of mental statevalence, but not other types of valence, a hypothesis here onlypreliminarily supported by the lateralization and the proximity ofthe valence regions to known language areas.Together, the three significant dimensions described above explain
nearly half of the reliable variance in the neural representation ofmental states. While much remains unexplained (Fig. S5), this resultappears quite promising. The social impact dimension alone predictsmore variance than any of the original theoretical models; the com-bination of the three significant PCA-derived dimensions explainsapproximately twice the variance of the circumplex model, the mostsuccessful of the original theories. At the same time, given theirsignificance to psychological theory, it is both reassuring and un-surprising that five of the seven original theories significantly predictneural pattern similarity. Notably, even theories that were originallygeared toward explaining traits or groups, such as the stereotypecontent model, demonstrate their efficacy in the mental state domain.
Fig. 4. Searchlight results indicating thespatial distribution of mental state repre-sentations consistent with (A) the circumplexmodel of affect, (B) the stereotype contentmodel, (C) the agency and experience modelof mind perception, (D) emotion and reason,(E) mind and body, (F) social and nonsocial,and (G) shared with other animals anduniquely human. The similarity of patternswithin the yellow/orange regions can beexplained by their proximity to each otheron the dimensions of the corresponding so-cial cognitive models (P < 0.05 corrected).Searchlight analyses were conducted oneach participant and combined throughone-sample random-effects t tests.
4 of 6 | www.pnas.org/cgi/doi/10.1073/pnas.1511905112 Tamir et al.

This finding raises the interesting possibility that the same dimensionsorganize neural activity about different types of social constructs.In addition to informing us about the psychological question of
interest—the organization of mental states—the current resultsalso hint at the neural encoding scheme within the social brainnetwork. By assessing the representation of mental states at twodifferent levels of spatial organization—local activity patternswithin spherical searchlights and broader activity patterns acrossthe social brain network—the current study is well placed to bearon this issue. The results of the present study support the hy-pothesis that information is encoded by patterns of activitywithin localized brain regions, rather than across different re-gions. If local patterns did not encode social information butcoarse patterns across the network did, the searchlight analysiswould fail to produce results. Instead, we observe reliableencoding of mental state information in local patterns across thesocial brain, and explanatory power at the network level appearsroughly in proportion to the cortical extent of their localencoding. As such, the current results provide no evidence thatothers’ mental states are represented by interregional activitydifferences above and beyond the information already containedin local patterns. Interestingly, we find that two regions, thedMPFC and TPJ, each underlie multiple dimensions. Previouswork has already heavily implicated these regions in mentalizing.The convergence of multiple dimensions on these nodes mayhelp to explain their prominence in this domain.Here, we have identified three dimensions that organize our
representations of others’ mental states. However, participants inthis study thought about only the mental states of a nonspecificother. Do these same dimensions apply across different categoriesof “other”? For example, our understanding of a friend’s happi-ness likely differs considerably from our concept of a stranger’shappiness; our understanding of our own happiness likely differsconsiderably from others’ happiness. Future work should en-deavor to understand whether the dimensions we discovered hereexpand or contract in their importance on the basis of the personunder consideration. We might expect such changes to be asym-metric across dimensions depending on one’s relationship with theperson experiencing the mental state. For instance, when consid-ering a close friend’s mental state, we might become more sensi-tive to valence differences but less sensitive to social impact(because all of the friend’s states are more impactful).We can also ask how these dimensions might apply across social
cognition more generally. The current study used only lexicalstimuli and tested these dimensions on only English-speakingadults. Do these dimensions apply to social cognition in othercultures? Do infants or other primates demonstrate any of thebuilding blocks of these dimensions? Do these same dimensionsapply when mentalizing about nonlinguistic content? Previouswork on cross-modal emotion representation indeed suggests thatvisual and verbal emotional stimuli may be processed similarly (25,26) although the full model has yet to be tested. We hope that thecurrent data will provide a solid foundation for future research inthese domains. It is also worth considering precisely which pro-cesses the imaging task taps. The task relies heavily on conceptualrepresentations of mental states, and it is not entirely clear howstrongly these concepts might guide other forms of mentalizing.Finally, we should endeavor to ask why the social brain would
organize its activity in accordance with the three dimensionsdiscussed above and not others. The dimensions that shapemental state representations likely contribute to helping us solveproblems in the social world. For example, we speculate that thethree dimensions identified here might inform calculations re-garding the threat posed by others: Valence could indicate theprobability of help or harm; social impact would help estimatethe likely magnitude of that that help or harm; and rationalitywould indicate the likely method of its expression (e.g., harmthrough a devious plot vs. an explosion of rage).The present study derived four potential dimensions of mental
state representation—rationality, social impact, human mind, andvalence—from the existing psychological literature. We discovered
that three of these dimensions—rationality, social impact, andvalence—predicted patterns of neural activity elicited across thesocial brain network by consideration of others’ mental states. Bydiscovering which dimensions the brain spontaneously uses toorganize the domain of mental states, we have forged a deeperunderstanding of both human social cognition and its relationshipto our own internal mental experience. These findings both informlong-standing debates within social psychology about theory ofmind and can be used to generate novel predictions about how thebrain supports our ability to mentalize.
Materials and MethodsParticipants. Participants (N = 20) were recruited via the Harvard University StudyPool (16 female; mean age, 22.7 y; range, 18–27 y). A Monte Carlo simulation wasused to determine participant and trial numbers consistent with adequate sta-tistical power (SI Text). All participants were right-handed native speakers ofEnglish, reported no history of neurological problems, and had normal or cor-rected-to-normal vision. Participants provided informed consent in a mannerapproved by the Committee on the Use of Human Subjects at Harvard University.
Experimental Design. Participants underwent functional neuroimaging whileconsidering another person experiencing a variety of mental states. The taskelicited patterns of neural activity that reflect the representation of eachstate. On each trial, participants considered 1 of 60 mental states (Table S1).At the onset of the trial, one mental state term was presented for 1 s. Thisword remained on screen while two very brief scenarios associated with thatmental state appeared for 3.75 s, one on the lower left side of the screenand one on the lower right side. Participants were instructed to report whichof the two scenarios they thought would better evoke the mental state inanother person. Participants indicated their response using a button box intheir left hand by pressing either the middle finger for the left scenario ortheir index finger for the right scenario. There were no correct answersbecause both scenarios were pretested to elicit the scenario in question.Each trial was followed by a minimum 250-ms fixation and a randomizedjittered fixation period (mean 1.67 s, range 0–10 s, in 2.5-s increments).During scanning, participants saw each of the 60 mental states on 16 occa-sions. Each state was presented once per run over the course of 16 consec-utive runs of 405 s each. Participants judged a unique pair of scenarios oneach trial; each of 16 scenarios was used only twice over the course of theexperiment. Stimuli were presented with PsychoPy (27).
The 60 mental states in this study were selected to maximize observabledifferences based on survey ratings from a separate set of participants (n =1,205) (SI Text). Many of the theories under consideration made similar pre-dictions about mental state representations. We pared down the informationcontained in the extant models using PCA. The PCA was conducted with re-spect to the 16 rating dimensions described above and the 60 mental statesselected for the experiment. Varimax rotation was used to maximize the in-terpretability of the factors while maintaining their orthogonality (obliquerotation indicated that the orthogonal solution was satisfactory) (SI Text).Parallel analysis (28) and very simple structure (29) criteria were used to de-termine component number, with both indicating four factor solutions. Thescenarios presented to subjects in this study were all written to be concise(fewer than five words), believable, devoid of personal pronouns, in the pre-sent tense, and maximally associated with their respective mental state. Weselected an optimal set of scenarios using a genetic algorithm on survey rat-ings from a separate set of participants (n = 795) (SI Text).
Functional Imaging Procedure. Functional data were acquired using a gradi-ent-echo echo-planar pulse sequence with parallel imaging and prospectivemotion correction [repetition time, 2,500 ms; echo time (TE), 30 ms; flip angle,90°) on a 3T Siemens Trio with standard 32-channel headcoil. Images wereacquired using 43 axial, interleaved slices with a thickness of 2.5 mm and 2.51 ×2.51-mm in-plane resolution (field of view, 216 mm2; matrix size, 86 × 86voxels; 162 measurements per run). Functional images were preprocessed andanalyzed with SPM8 (Wellcome Department of Cognitive Neurology), usingSPM8w. Data were first spatially realigned to correct for head movement andthen normalized to a standard anatomical space (2-mm isotropic voxels) basedon the ICBM 152 brain template (Montreal Neurological Institute).
A general linear model (GLM) was used to generate participant-specificpatterns of activity for each mental state. The model included one regressorfor each of the mental states, for a total of 60 regressors of interest. Eventswere modeled using a canonical hemodynamic response function andcovariates of no interest (temporal and dispersion derivatives, session mean,run mean, linear trends, outlier time points, and six motion realignment
Tamir et al. PNAS Early Edition | 5 of 6
NEU
ROSC
IENCE
PSYC
HOLO
GICALAND
COGNITIVESC
IENCE
S

parameters). Boxcar regressors for events began at the onset of the pre-sentation of the mental state. GLM analyses resulted in 60 t-value maps, onefor each mental state, for each participant. In essence, these maps embodythe average neural representation of each state.
We compared neural representations at each voxel in the brain using asearchlight procedure (30). Patterns of activity for each of the 60 mentalstates were extracted from participant’s GLM-derived t-value maps using aspherical searchlight with 4-voxel radius (∼9 mm). To compare the similarityof activity patterns for different mental states, we computed the Pearsoncorrelation between each pair of patterns. Thus, two mental states thatelicited highly correlated patterns of activity across the searchlight wereconsidered to be more similar to each other. This searchlight procedureresulted in neural similarity matrices at each point in the brain: 60 × 60matrices whose elements correspond to the correlations between the pat-terns of neural activity within that searchlight.
We used these estimates of neural similarity to test whether mental stateswere represented in amanner predicted by the four PCA-derived dimensions.To do so, we made similarity predictions for each dimension with respect toeach pair of mental states by taking the absolute difference in their scores onthe dimension in question. Multiple regression was used to determine howwell the predictions of the PCA-derived dimensions accounted for neuralsimilarity. These regressions generated four maps of unstandardized re-gression coefficients for each participant, one for each component. Theparticipant-specific maps were smoothed (Gaussian 6-mm FWHM kernel) andentered into random effects analysis using one-sample t tests. The fourresulting t-value maps indicate regions of the brain in which differences inthe neural patterns elicited by mental states correspond to the differencesbetween mental states along each component. Results were corrected formultiple comparisons via a Monte Carlo simulation using the AFNI (31)3dClustSim script (estimates of actual smoothness obtained from the fourPCA maps and averaged; whole brain mask from the contrasts constrainedvoxel number). This simulation indicated that, with an uncorrected thresholdP < 0.001, a 76-voxel extent was sufficient to yield a corrected threshold ofP < 0.05. For visualization, statistical maps were rendered on the corticalsurface using Connectome Workbench (32).
To test whether relevant patterns of activity were represented in a moredistributed manner, we conducted an additional network-wide similarityanalysis. In this analysis, we generated a single neural similarity matrix per
participant based on the pattern of activity across an independently definednetwork of neural regions. This network was defined using a whole brainomnibus repeated-measures ANOVA across the 60 mental states and 20participants, which selected any voxels that showed different levels of activityacross mental states (Fig. 3A). Due to the sensitivity of this analysis, voxelswere selected at a conservative voxelwise threshold of P < 0.0001. Theunivariate nature of this approach appeared adequate as similar regionsemerge from split-half searchlight reliability (Fig. S6). Note that, whereasthis feature selection relied on the same data subjected to MPVA, it wasindependent of any of the dimensions being tested and thus did not yieldbiased results. Indeed, the network analysis based on these voxels producedresults nearly indistinguishable from the same analysis conducted usingvoxels selected via a metaanalysis of mentalizing studies (SI Text).
As with the searchlight analysis, in the network analysis, patterns of neuralactivity were extracted from the entirety of the feature selected area for eachof the 60 mental states. These patterns were correlated to produce a singleneural similarity matrix for each participant. These matrices were then av-eraged to produce a single group-level matrix. The group neural similaritymatrix was Pearson-correlated with the similarity matrices generated fromeach of the four latent dimensions. To generate confidence intervals for thesecorrelations, this procedure was repeated 10,000 times with group similaritymatrices based on bootstrapped samples of the 20 participants.
We conducted analogous searchlight and network similarity analyses totest the seven theoretical models. The similarity between pairs of mentalstates was calculated as the (opposite of the) distance between the twomental states in the Euclidean space determined by the dimensions of eachtheory. This analysis diverged from that used for the PCA-based models onlyin that each theoretical model’s predictions were independently correlatedwith neural similarity. This divergence was due to the substantial collinearitybetween the models, which was absent from the PCA-based models.
ACKNOWLEDGMENTS. We thank Talia Konkle, Brenda Li, Radhika Rastogi, EveWesson, and Ava Zhang. D.I.T. was supported by NIH Blueprint for NeuroscienceResearch Training Grant T90DA022759.M.A.T. and J.M.C. were supported by Grad-uate Research Fellowships from the National Science Foundation (DGE 1144152).M.A.T. was also supported by The Sackler Scholar Programme in Psychobiology.The views expressed in this article do not necessarily reflect the views of theGeneral Services Administration or the United States Government.
1. Konkle T, Caramazza A (2013) Tripartite organization of the ventral stream by ani-macy and object size. J Neurosci 33(25):10235–10242.
2. Mitchell JP (2008) Contributions of functional neuroimaging to the study of socialcognition. Curr Dir Psychol Sci 17(2):142–146.
3. Van Overwalle F, Baetens K (2009) Understanding others’ actions and goals by mirrorand mentalizing systems: A meta-analysis. Neuroimage 48(3):564–584.
4. Posner J, Russell JA, Peterson BS (2005) The circumplex model of affect: An integrativeapproach to affective neuroscience, cognitive development, and psychopathology.Dev Psychopathol 17(3):715–734.
5. Russell JA (1980) A circumplex model of affect. J Pers Soc Psychol 39(6):1161–1178.6. Cuddy AJ, Fiske ST, Glick P (2008) Warmth and competence as universal dimensions of social
perception: The stereotype content model and the BIAS map. Adv Exp Soc Psychol 40:61–149.7. Fiske ST, Cuddy AJ, Glick P, Xu J (2002) A model of (often mixed) stereotype content:
Competence and warmth respectively follow from perceived status and competition.J Pers Soc Psychol 82(6):878–902.
8. Gray HM, Gray K, Wegner DM (2007) Dimensions of mind perception. Science315(5812):619.
9. Forstmann M, Burgmer P (2015) Adults are intuitive mind-body dualists. J Exp PsycholGen 144(1):222–235.
10. Mitchell JP (2009) Social psychology as a natural kind. Trends Cogn Sci 13(6):246–251.11. Britton JC, et al. (2006) Neural correlates of social and nonsocial emotions: An fMRI
study. Neuroimage 31(1):397–409.12. HaslamN (2006) Dehumanization: An integrative review. Pers Soc Psychol Rev 10(3):252–264.13. Kriegeskorte N, Mur M, Bandettini P (2008) Representational similarity analysis:
Connecting the branches of systems neuroscience. Front Syst Neurosci 2:4.14. Khaligh-Razavi SM, Kriegeskorte N (2014) Deep supervised, but not unsupervised,
models may explain IT cortical representation. PLOS Comput Biol 10(11):e1003915.15. Osgood CE, Suci GJ, Tannenbaum PH (1957) The Measurement of Meaning (Univ of
Illinois Press, Oxford, England).16. Kahneman D (2003) Maps of bounded rationality: Psychology for behavioral eco-
nomics. Am Econ Rev 93(5):1449–1475.17. Heckhausen H, Gollwitzer PM (1987) Thought contents and cognitive functioning in
motivational versus volitional states of mind. Motiv Emot 11(2):101–120.18. Corradi-Dell’Acqua C, Hofstetter C, Vuilleumier P (2014) Cognitive and affective
theory of mind share the same local patterns of activity in posterior temporal but notmedial prefrontal cortex. Soc Cogn Affect Neurosci 9(8):1175–1184.
19. Mende-Siedlecki P, Cai Y, Todorov A (2013) The neural dynamics of updating personimpressions. Soc Cogn Affect Neurosci 8(6):623–631.
20. Mitchell JP, Cloutier J, Banaji MR, Macrae CN (2006) Medial prefrontal dissociationsduring processing of trait diagnostic and nondiagnostic person information. Soc CognAffect Neurosci 1(1):49–55.
21. Mitchell JP, Neil Macrae C, Banaji MR (2005) Forming impressions of people versusinanimate objects: Social-cognitive processing in the medial prefrontal cortex.Neuroimage 26(1):251–257.
22. Schiller D, Freeman JB, Mitchell JP, Uleman JS, Phelps EA (2009) A neural mechanismof first impressions. Nat Neurosci 12(4):508–514.
23. Sabatinelli D, Bradley MM, Lang PJ, Costa VD, Versace F (2007) Pleasure rather thansalience activates human nucleus accumbens and medial prefrontal cortex. J Neurophysiol98(3):1374–1379.
24. Garavan H, Pendergrass JC, Ross TJ, Stein EA, Risinger RC (2001) Amygdala responseto both positively and negatively valenced stimuli. Neuroreport 12(12):2779–2783.
25. Peelen MV, Atkinson AP, Vuilleumier P (2010) Supramodal representations of per-ceived emotions in the human brain. J Neurosci 30(30):10127–10134.
26. Skerry AE, Saxe R (2014) A common neural code for perceived and inferred emotion.J Neurosci 34(48):15997–16008.
27. Peirce JW (2007) PsychoPy: Psychophysics software in Python. J Neurosci Methods162(1-2):8–13.
28. Horn JL (1965) A rationale and test for the number of factors in factor analysis.Psychometrika 30(2):179–185.
29. Revelle W, Rocklin T (1979) Very simple structure: An alternative procedure for estimatingthe optimal number of interpretable factors. Multivariate Behav Res 14(4):403–414.
30. Kriegeskorte N, Goebel R, Bandettini P (2006) Information-based functional brainmapping. Proc Natl Acad Sci USA 103(10):3863–3868.
31. Cox RW (1996) AFNI: Software for analysis and visualization of functional magneticresonance neuroimages. Comput Biomed Res 29(3):162–173.
32. Marcus DS, et al. (2011) Informatics and data mining tools and strategies for thehuman connectome project. Front Neuroinform 5:4.
33. Brysbaert M, Warriner AB, Kuperman V (2014) Concreteness ratings for 40 thousandgenerally known English word lemmas. Behav Res Methods 46(3):904–911.
34. Kuperman V, Stadthagen-Gonzalez H, Brysbaert M (2012) Age-of-acquisition ratingsfor 30,000 English words. Behav Res Methods 44(4):978–990.
6 of 6 | www.pnas.org/cgi/doi/10.1073/pnas.1511905112 Tamir et al.

Supporting InformationTamir et al. 10.1073/pnas.1511905112SI TextPower AnalysisA Monte-Carlo simulation in MATLAB 7 was conducted toestablish a design with adequate statistical power. We simulated abehavioral similarity matrix and a neural similarity matrix thatwere correlated at the estimated population effect size of r = 0.15.This effect size was thought to be reasonable based on previouswork (e.g., ref. 13). To generate the behavioral similarity matrix,we simulated activity in a single searchlight. That searchlightconsisted of 200 voxels and 60 separate patterns of activity, torepresent each of the mental states. The simulated “activity”within the voxels should be normally distributed (M = 0, SD = 1)as an approximation for the t-values used in the actual analysis.The 60 × 60 correlation matrix produced by this searchlight wasconsidered the behavioral model. We created patterns of neuralactivity within the simulated searchlight by taking the 200 voxel-by-60 state matrix used to generate the behavioral model andadding additional random noise: ∼N(0, 2.4). When these neuralpatterns were correlated with one another, the resulting neuralsimilarity matrix consistently correlated with the correspondingbehavioral matrix at approximately r = 0.15. Because this neuralpattern matrix reflects experiment-level data, we added addi-tional noise ∼N(0, 10) to represent data from individual trials.On each iteration of the simulation, a particular participant
number and trial (per mental state) were set. Trial-wise neuralpatterns of searchlight activity were generated for each partici-pant and averaged to produce a single pattern for each partici-pant. These patterns were then converted to similarity matricesand correlated with the overall behavioral similarity matrix. Theresulting r values were R-to-z transformed and entered into a ttest across simulated participants. The result of this t test wastabulated to estimate power. Participant numbers between 2 and30 and item numbers between 2 and 20 were simulated, with 100simulation iterations at each combination of these parameters.These simulations indicated that 20 participants with 16 trialsper mental state should be adequate to ensure 95% voxelwisestatistical power at an uncorrected threshold of P < 0.001.
Mental State SelectionThe 60 mental states in this study were selected to maximizeobservable differences and thus statistical power. To accomplishthis outcome, a set of participants assessed how representativeeach of 166 mental states was of each of 16 univariate dimensions.Participants (n = 1,205) were recruited through Amazon Me-chanical Turk and the Harvard University Study Pool to com-plete one or more of eight online surveys: emotion/reason (n =145), mind/body (n = 140), agency/experience (n = 145), warmth/competence (n = 157), high/low arousal (n = 151), social/nonsocial(n = 137), positive/negative (n = 168), and shared/uniquely human(n = 153). In each survey, participants were provided with def-initions of the two dimensions of interest and then were asked oneach trial whether a particular mental state could be catego-rized along one, both, or neither of the two dimensions of in-terest in that survey. Across all participants, we could thusassess the proportion of trials in which each mental state was (orwas not) associated with each dimension. This aggregation re-sulted in continuous ratings between 0 and 1 for each of the 166mental states on each of 16 psychological dimensions. We useddata from the ratings of the 166 mental states along the16 nominal dimensions to select the optimal set of states. To doso, we ran the resulting 166 × 16 matrix of data through anoptimization selection process, which iteratively selected a random
subset of mental states (separately for subsets between 50 and 98),calculated how well they sampled each dimension using aKolmogorov–Smirnov test (compared with a uniform distribution),calculated the redundancy of each dimension using Tolerance, andthen, over 10,000,000 iterations, selected the solution that max-imized the former and minimized the latter. The optimal solu-tion of 60 mental states was used in the current study.
Analysis on Excluded Mental StatesTo ensure that the mental state selection process did not bias thefactors derived from principal component analysis, an identicalanalysis was carried out with respect to the 106 mental states notincluded in the imaging experiment. Very simple structure in-dicated a four-factor solution to this analysis for the 106 mentalstates not included in this study as well. Factor order was notidentical across the two solutions, but, when rearranged, includingreflection where necessary, the factor loadings were reproducedwith the following respective reliabilities (rs): 0.97, 0.96, 0.84, 0.95.The reliability of the solutions not only suggests that the 60-statemodel did not produce a biased factor structure, but also providesadditional evidence for the importance of the identified factors.The full set of mental states was also used to determine whether
an orthogonal PCA rotation was appropriate. The 16 psycho-logical dimensions were subjected to PCA across all 166 ratedmental states, with four components retained. These componentswere then allowed to correlate with each other via an obliquedirect oblimin rotation. The resulting factor correlation matrixindicated little tendency for the components to correlate. Thehighest correlation was between social impact and valence (r =0.27), and the mean (absolute value) of the intercomponentcorrelations was r = 0.12. This result suggests that the orthogonalvarimax rotation and its concomitant interpretational simplicitymay be retained without substantially distorting the relationshipbetween components.
Scenario Selection AlgorithmThe scenarios presented to participants in this study were allwritten to be concise (fewer than five words), believable (e.g.,“finding $5 on the sidewalk” rather than “winning the lottery”),devoid of personal pronouns, in the present tense, and maximallyassociated with their respective mental state. To select an opti-mal set of scenarios, a separate set of participants (n = 795) wererecruited through Amazon Mechanical Turk and the HarvardUniversity Study Pool to complete an online survey that assessedhow well each mental state was associated with each scenario.On each trial, participants saw one of the 60 mental states se-lected using the procedure described above and one of 36 sce-narios specific to that mental state. Their task was to rate thedegree to which the mental state was associated with the sce-nario on a scale from 1 (mildly) to 5 (highly). Each participantwas presented with 180 such items.The sets of 16 scenarios for each mental state used in this study
were selected (out of a larger set of 36 for each state) by a customgenetic algorithm using participant ratings. Genetic algorithmsare optimization programs intended to achieve a desired result bymimicking the mechanisms of organic evolution by natural se-lection. The algorithm was initiated by randomly generating 100“strains,” with strain defined as any set of 16 scenarios for eachmental state. On each of 10,000 iterations, the “fitness” of eachstrain was evaluated (as described below), and strains were se-lected for reproduction proportional to their fitness raised to thepower of 100 (to increase selection pressure) through stochastic
Tamir et al. www.pnas.org/cgi/content/short/1511905112 1 of 12

universal sampling. Imitating sexual reproduction, two-parenttwo-child crossover of scenarios within mental state was used togenerate a new generation of strains. In this process, each sce-nario in a “child” strain had an equal probability of being drawnfrom either of the two “parent” strains. During reproduction,each scenario also had 0.001 probability of “mutating” to a dif-ferent scenario within the same mental state (even if that sce-nario appeared in neither of the parent strains). Additionally,the best strain from each generation persisted unchanged toavoid discarding a potential optimum solution.The “fitness” in this algorithm was determined by four equally
weight parts: (i) The scenarios should maximally evoke themental state of interest—to ensure the appropriateness of eachscenario to the mental state in question; (ii) they should mini-mize variability in how well different mental states are evoked—to make sure we were not left with many good examples of onestate and bad examples of another; (iii) they should minimizevariability in how variably scenarios evoke mental states acrossscenarios—to ensure that choices were not easier for one state(with high variability between scenarios) than another (withlower variability); and (iv) they should minimize average char-acter length variability across mental states—to ensure that lowlevel features such as size on retina did not differ across states.The strain with the best fitness at the end of the simulationdictated the scenarios ultimately used in the experiment.
Text Analysis of ScenariosTo control the scenarios more closely, an automated text analysiswas performed to assess several midlevel linguistic properties. Inparticular, we aimed to control for the concreteness, complexity,and familiarity of the scenarios associated with each mental state.Concreteness and complexity norms were taken from large ratingsets (33, 34), with the latter measured using age of acquisition as aproxy. Familiarity was based on the SUBTLEXus word frequencymeasure. For a given scenario, each word’s concreteness, com-plexity, and familiarity values were determined and then aver-aged to produce a single measure. These measures were thenaveraged across scenarios to provide a single score along eachlinguistic dimension for each of the 60 mental states.The network-level representational similarity analysis was re-
peated after partialing out the influence of the linguistic variableson neural pattern similarity. In other words, each linguistic var-iable was converted to a set of similarity predictions by takingabsolute differences, and neural pattern similarity was thenregressed onto these predictions. The residuals of this regressionwere then correlated with the four dimensions derived frompsychological theories. These correlations remained very similarto the values obtained before removing the influence of thelinguistic variables: rationality (r = 0.15), social impact (r = 0.21),human mind (r = 0.05), and valence (r = 0.12). Moreover, thestatistical significance (or lack thereof) at P < 0.05 of the PCA-derived dimensions remained unchanged. This result suggeststhat the influence of these linguistic features cannot account forthe predictive power of the psychological dimensions.
ICA Network Representational Similarity AnalysisTo further assess the robustness of the results to varying analytictechniques, we repeated the feature-selected network represen-tational similarity analysis using dimensions extracted from thebehavioral ratings via independent component analysis (ICA) in-stead of PCA. The four components that emerged from the ICAanalysis of the 60 mental states closely resembled those extractedvia PCA in terms of simple structure. Adjusting for changes inorder, and ignoring arbitrary sign reflections, ICA and PCAcomponents expressed the following correlations for rationality,social impact, human mind, and valence, respectively: rs = 0.86,0.95, 0.94, and 0.89. The ICA components were converted tosimilarity predictions and correlated with neural pattern similarity
from the ANOVA-selected social brain network. Unsurprisingly,given the high correlations with the PCA components, similarcorrelations with the neural data obtained: rationality (r = 0.10),social impact (r = 0.23), human mind (r = 0.03), and valence (r =0.18). The statistical significance of these values—as determinedthrough bootstrapping participants—did not differ qualitativelyfrom that reported for the PCA dimensions.
Spearman Correlation Network AnalysisAgain, to assess the robustness of the results reported in the maintext, we repeated the representational similarity analyses on thefeature-selected network, this time using Spearman rank correlationinstead of Pearson correlation to associate the behavioral andneural data. Spearman correlations have the advantages of beingmore robust to outliers than Pearson correlations, and also of beingable to detect any (monotonic) nonlinear relationships that mightexist. The analysis, including bootstrapping, otherwise proceededexactly as in the original Pearson case. Results were nearly in-distinguishable from those in the Pearson correlation analysis: ra-tionality (r = 0.13), social impact (r = 0.22), human mind (r = 0.04),and valence (r = 0.12). For the original theories, correlations alsoremained quite stable: valence and arousal (r = 0.19), warmth andcompetence (r = 0.16), agency and experience (r = 0.19), emotionand reason (r = 0.17), mind and body (r = 0.18), social and non-social (r = 0.04), and shared and unique (r = 0.03). The statisticalsignificance of the results remained unchanged. This outcomesuggests that neither outliers nor nonlinearity is likely to havecontributed substantially to the results we present.
Interdimensional Interaction Network AnalysisThe primary network analysis we present features only the maineffects of the four PCA-derived dimensions. It is quite possiblethat these dimensions interact with each other in terms of theirinfluence on neural pattern similarity. Such an interaction wouldeffectively indicate that the importance of one dimension fordistinguishing mental states changes depending on how differentthose states were along another dimension. To test for thispossibility here, we repeated the ANOVA-selected networkrepresentational similarity analysis, including interaction effects.Although the possibility exists for highly complex interactionsbetween the four dimensions, we considered only two-way in-teractions for the sake of interpretability and limiting multiplecomparisons.As before, the four dimensions were converted to similarity
predictions by taking the absolute distance between points. Thesedistances were then z-scored and multiplied to produce the sixpossible two-way interaction terms. The main effects and in-teraction terms were simultaneously entered into a multiple re-gression predicting neural similarity. The resulting coefficientswere bootstrapped across participants—as in the original cor-relation analyses—to determine their statistical significance. Themain effects of rationality, social impact, and valence remainedstatistically significant whereas the main effect of human mindremained nonsignificant. In addition, three interaction termsemerged as significant at the P < 0.05 level: rationality × humanmind [b = −0.003, 95% bootstrap CI (−0.004, −0.002)], socialimpact × human mind [b = −0.002, 95% bootstrap CI (−0.004,−0.001)], and social impact × valence [b = 0.001, 95% bootstrapCI (0.0005, 0.002)].Interestingly, two of these results involve the human mind
despite the fact that this variable has no main effect on neuralpattern similarity. This result may help clarify the role of thisdimension with respect to mental state representation. Ratherthan distinguishing between mental states, the human mind mayprimarily play a modulatory role, moderating the importance ofother dimensions on mental state representation. In both cases,these interactions were negative; thus, they can be interpreted asfollows: The more mental states differ in terms of their human
Tamir et al. www.pnas.org/cgi/content/short/1511905112 2 of 12

mind, the fewer differences in rationality and social impactpredict neural pattern differentiation. The third interaction termruns in the opposite direction: The greater the difference in socialimpact between twomental states, themore differences in valencecan predict pattern differences.
Network Analysis with Alternative Feature SelectionThe feature selection approach we used to isolate the social brainnetwork was based on a univariate ANOVA over the same dataanalyzed in the subsequent representational similarity analysis.This ANOVA is agnostic to the theories we are testing and notstatistically biased to produce a spurious correlation betweenneural similarity and the behavioral ratings. It is in essence similarto choosing voxels based on their univariate reliability. A biased,circular analysis selects voxels based on their correlation with theexternal measure with which they will ultimately be correlated;here, our approach selected voxels based on their correlation withthemselves (i.e., their reliability) producing an orthogonal contrast.Nonetheless, we consider it worthwhile to repeat the network
analysis using a completely independent feature selection method.In this case, we turned to Neurosynth (neurosynth.org/), an onlinetool for performing automated metaanalyses over large numbers ofimaging studies. Using the “theory mind” reverse inference map,Neurosynth produced a metaanalysis of 140 studies involving the-ory of mind. We used this map [at the default false discovery rate(FDR) q = 0.01] to produce a feature selection mask. This ap-proach has the virtues of being both completely statistically in-dependent of our current data, and also coming about as close aspossible to producing a set of canonical voxels involved in thinkingabout other minds. From this point on, the representational simi-larity analysis proceeded as previously described in FunctionalImaging Procedure in the main text. The correlations between thePCA-derived dimensions and neural similarity within the networkselected by metaanalysis remained similar to the values previouslyobserved, with no changes in statistical significance at the P < 0.05level: rationality [r = 0.19; 95% bootstrap CI (0.08, 0.22)], socialimpact [r = 0.20; 95% bootstrap CI (0.10, 0.24)], human mind [r =0.02; 95% bootstrap CI (−0.03, 0.08)], and valence [r = 0.10; 95%bootstrap CI (0.02, 0.15)]. The fact that these values have notuniformly decreased serves as further evidence for the unbiasednature of the ANOVA feature selection technique. Results fromthe seven original theories also remained qualitatively unchanged:valence and arousal [r = 0.16; 95% bootstrap CI (0.8, 0.21)],warmth and competence [r = 0.17; 95% bootstrap CI (0.07, 0.21)],agency and experience [r = 0.23; 95% bootstrap CI (0.12, 0.25)],emotion and reason [r = 0.21; 95% bootstrap CI (0.10, 0.24)], mindand body [r = 0.16; 95% bootstrap CI (0.08, 0.20)], social andnonsocial [r = 0.04; 95% bootstrap CI (−0.03, 0.10)], and sharedand unique [r = 0.02; 95% bootstrap CI (−0.02, 0.05)].
Multidimensional ScalingNonmetric multidimensional scaling (MDS) was used to estimatethe proportion of variance in representational space of mentalstates that could be explained by the three significant PCA-de-rived dimensions from the representational similarity analysis.We took this approach to better assess the proportion of varianceour model explains in the true dimensions underlying mentalstate representation. The raw R2 between the similarity predic-tions of the PCA-derived dimensions and neural similarity esti-mates would systematically underestimate this quantity by aquadratic factor, leading us to use this MDS approach. A 5Dscaling yielded an acceptable stress (0.13) below the conven-tional threshold of 0.15. Unfortunately, due to the arbitraryorientation of MDS solutions and the high dimensionality of thisparticular solution, it is beyond the scope of this article to ex-plore the nature of the unidentified dimensions. However, we dopresent the results of a 2D scaling solution to allow the reader toexplore the neural similarity more directly (Fig. S2). The relative
importance of the five dimensions was assessed by regressing theoriginal dissimilarity matrix onto similarity predictions madeby the five MDS dimensions and partitioning the resulting R2.These estimates were normalized by the total R2 of the re-gression and later used as weights. The 5D scaling dimensionswere then individually regressed onto the three significant PCA-based dimensions from the network analysis. The resulting R2
values were summed into a final estimate of total R2, withweights based upon the relative importance of each dimension tooverall neural similarity as calculated via regression of the MDSdimensions onto the original neural dissimlarity matrix.
Model Selection by Cross-Validated PerformanceThe principal aim of this study has been to establish whichpsychological dimensions contribute to shaping the neural rep-resentation of mental states. To that aim, we have used thestandard null hypothesis significance testing framework to assessingthe contribution of each of our four PCA-derived dimensionsin turn. However, it is also worth considering a model selectiontechnique that holistically assesses the representational spacesdictated by different possible combinations of our hypotheticaldimensions. Moreover, such a technique need not necessarily relyon the concept of statistical significance to determine whichdimensions ought to be included in the optimal model. Instead, itmight rely on cross-validated prediction performance as a measureof support for different potential models.To this end, we conducted an alternative to the network rep-
resentational similarity analysis described in the main text. Thistechnique proceeded as follows. First, a set of dimensions consistingof between one and four of the PCA-derived dimensions was se-lected. This step was repeated exhaustively to ultimately include allpossible unique combinations of principal components (PCs) (15 intotal). Next, the regression coefficients were simultaneously esti-mated for all of the selected dimensions with respect to the neuraldata using nonnegative linear least squares. Squared similarityvalues were used for both behavioral and neural data to allow forlater comparison with models containing nonorthogonal dimen-sions (distances in Euclidean spaces do not sum unless dimensionsare orthogonal, but their squares do, regardless). The regressioncoefficients estimated using this approach with the 19 “training”participants were used to weight the squared behavioral similarityvalues from each dimension. These values were then summed toform a single predictor for the neural similarity space. This pre-dictor was then correlated with the squared neural similarity valuesof the left-out participant to produce a measure of predictiveperformance. This process was repeated leaving out each partici-pant in turn, and the 20 correlations for each combination of PCswere averaged to produce an overall measure of model perfor-mance for that combination. The cross-validated performance ofall possible PC combinations could then be directly compared.Consistent with the findings from the earlier representationalsimilarity analyses, the highest performing model consisted of thethree dimensions of rationality, social impact, and valence. Thismodel achieved a cross-validated r = 0.12 (note that this value isconsiderably lower than those previously reported because it cor-responds to the prediction of an individual participant rather thanthe group average).This cross-validation approach also provided an alternative
approach to comparing the PCA-based model with the originaltheoretical models. This approachmight favor the original modelsmore than the representational similarity analysis reported earlierbecause it allows the weights of their dimensions to differ ratherthan effectively fixing them to equality. The original theoreticalmodels achieved the following performance: valence and arousal(r = 0.07), warmth and competence (r = 0.06), agency and ex-perience (r = 0.07), emotion and reason (r = 0.07), mind andbody (r = 0.06), social and nonsocial (r = 0.02), and shared andunique (r = 0.01). Although again the values are smaller due to
Tamir et al. www.pnas.org/cgi/content/short/1511905112 3 of 12
the fact that they apply to single participants, the overall patternof results remains qualitatively quite similar, with most of theoriginal models performing in the r = 0.06–0.07 range and whilesociality and human uniqueness perform close to r = 0. Un-surprisingly, the best PCA-derived model also retained its sub-stantial lead over the original theories in explaining neuralpattern similarity (Fig. S3).A noise ceiling for cross-validated model performance was
obtained by iteratively correlating the neural similarity matrix ofeach participant with the average neural similarity matrix of theother 19. The result was a ceiling of r = 0.28. This ceiling is anindication of the expected single-participant predictive perfor-mance of a “perfect” or “complete” model of mental state rep-resentation, as approximated by the group average similaritymatrix. Consistent with the R2 results reported in the main text,comparison of the noise ceiling with the performance of the best“3 PC” model indicates that the dimensions of rationality, socialimpact, and valence explain slightly less than half of the neuralrepresentation of others mental states. Although we consider thisresult surprisingly high given the early state of this research, thisresult also highlights the need to uncover the dimensions that canexplain the remaining variance in mental state representation.
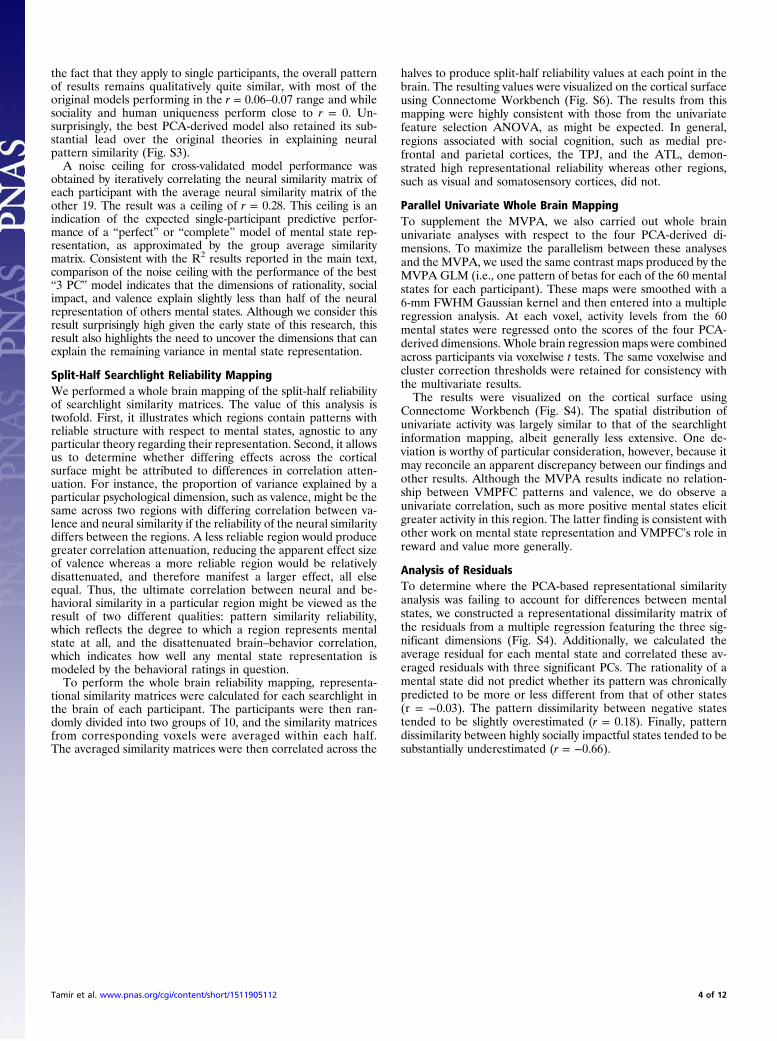
Split-Half Searchlight Reliability MappingWe performed a whole brain mapping of the split-half reliabilityof searchlight similarity matrices. The value of this analysis istwofold. First, it illustrates which regions contain patterns withreliable structure with respect to mental states, agnostic to anyparticular theory regarding their representation. Second, it allowsus to determine whether differing effects across the corticalsurface might be attributed to differences in correlation atten-uation. For instance, the proportion of variance explained by aparticular psychological dimension, such as valence, might be thesame across two regions with differing correlation between va-lence and neural similarity if the reliability of the neural similaritydiffers between the regions. A less reliable region would producegreater correlation attenuation, reducing the apparent effect sizeof valence whereas a more reliable region would be relativelydisattenuated, and therefore manifest a larger effect, all elseequal. Thus, the ultimate correlation between neural and be-havioral similarity in a particular region might be viewed as theresult of two different qualities: pattern similarity reliability,which reflects the degree to which a region represents mentalstate at all, and the disattenuated brain–behavior correlation,which indicates how well any mental state representation ismodeled by the behavioral ratings in question.To perform the whole brain reliability mapping, representa-
tional similarity matrices were calculated for each searchlight inthe brain of each participant. The participants were then ran-domly divided into two groups of 10, and the similarity matricesfrom corresponding voxels were averaged within each half.The averaged similarity matrices were then correlated across the
halves to produce split-half reliability values at each point in thebrain. The resulting values were visualized on the cortical surfaceusing Connectome Workbench (Fig. S6). The results from thismapping were highly consistent with those from the univariatefeature selection ANOVA, as might be expected. In general,regions associated with social cognition, such as medial pre-frontal and parietal cortices, the TPJ, and the ATL, demon-strated high representational reliability whereas other regions,such as visual and somatosensory cortices, did not.
Parallel Univariate Whole Brain MappingTo supplement the MVPA, we also carried out whole brainunivariate analyses with respect to the four PCA-derived di-mensions. To maximize the parallelism between these analysesand the MVPA, we used the same contrast maps produced by theMVPA GLM (i.e., one pattern of betas for each of the 60 mentalstates for each participant). These maps were smoothed with a6-mm FWHM Gaussian kernel and then entered into a multipleregression analysis. At each voxel, activity levels from the 60mental states were regressed onto the scores of the four PCA-derived dimensions. Whole brain regression maps were combinedacross participants via voxelwise t tests. The same voxelwise andcluster correction thresholds were retained for consistency withthe multivariate results.The results were visualized on the cortical surface using
Connectome Workbench (Fig. S4). The spatial distribution ofunivariate activity was largely similar to that of the searchlightinformation mapping, albeit generally less extensive. One de-viation is worthy of particular consideration, however, because itmay reconcile an apparent discrepancy between our findings andother results. Although the MVPA results indicate no relation-ship between VMPFC patterns and valence, we do observe aunivariate correlation, such as more positive mental states elicitgreater activity in this region. The latter finding is consistent withother work on mental state representation and VMPFC’s role inreward and value more generally.
Analysis of ResidualsTo determine where the PCA-based representational similarityanalysis was failing to account for differences between mentalstates, we constructed a representational dissimilarity matrix ofthe residuals from a multiple regression featuring the three sig-nificant dimensions (Fig. S4). Additionally, we calculated theaverage residual for each mental state and correlated these av-eraged residuals with three significant PCs. The rationality of amental state did not predict whether its pattern was chronicallypredicted to be more or less different from that of other states(r = −0.03). The pattern dissimilarity between negative statestended to be slightly overestimated (r = 0.18). Finally, patterndissimilarity between highly socially impactful states tended to besubstantially underestimated (r = −0.66).
Tamir et al. www.pnas.org/cgi/content/short/1511905112 4 of 12

Fig. S1. Correlations between theoretical dimensions. Pearson product-moment correlations between participant ratings of 60 mental states on 16 potentialdimensions of mental state representation derived from the existing psychological literature (n = 1,205).
Tamir et al. www.pnas.org/cgi/content/short/1511905112 5 of 12

Fig. S2. Multidimensional scaling of network-level neural similarity. Proximity between points indicates greater neural pattern similarity within the socialbrain network. The same 2D scaling is presented in A–D, overlaid with each of the four hypothetical dimensions of mental state representation. The 2D scalingis insufficient to fully capture the differences between patterns elicited for each mental state, but associations between neural space and psychological di-mension are still visible.
Tamir et al. www.pnas.org/cgi/content/short/1511905112 6 of 12

Fig. S3. Cross-validated model performance. Bars indicate performance of a representation similarity analysis based on nonnegative least-squares regression.Weights for dimensions within each theory were trained on data from 19 participants. This regression model was then tested by predicting the neural patternsimilarity of the left-out participant. Each participant was left out iteratively, and results were averaged across all 20 training-testing combinations. Points inthe “PC combinations” column indicate the performance of every possible combination of 1–4 of the 4 PCs. The farthest left bar indicates the performance ofthe best model, consisting of the PCs rationality, social impact, and valence. The noise ceiling indicates the expected performance of an ideal model for mentalstate representation.
Tamir et al. www.pnas.org/cgi/content/short/1511905112 7 of 12

Fig. S4. Univariate effects of PCA-derived dimensions. Significant associations between each of the four PCA-derived dimensions and voxelwise univariate brainactivity. Orange voxels indicate activity associated with greater emotionality (and less rationality) of mental states (A), greater social impact (B), or greaternegativity (D). Blue voxels indicate activity associated with more shared/bodily states (C), or more positive states (D). Statistical maps resulted from random effectsone-sample t tests across participants and were corrected for multiple comparisons (P < 0.05) via Monte Carlo simulation (voxelwise P < .001, k > 75).
Tamir et al. www.pnas.org/cgi/content/short/1511905112 8 of 12

Fig. S5. Residual representational dissimilarity matrix. High positive residuals (red) indicate that mental states were more dissimilar than three significantPCA-derived dimensions would predict. High negative residuals (blue) indicate pairs of mental states that were less different than the PCA-derived dimensionswould predict.
Tamir et al. www.pnas.org/cgi/content/short/1511905112 9 of 12

Fig. S6. Reliability of similarity searchlights. The reliability of the neural representations of other’s mental states throughout the brain, calculated as the split-half correlation between pattern similarity estimates. Many regions typically implicated in theory of mind demonstrate relatively high reliability.
Table S1. The 60 mental states used in the imaging experiment
Affection Disgust Intrigue RelaxationAgitation Distrust Judgment SatisfactionAlarm Dominance Laziness Self-consciousness
Anticipation Drunkenness Lethargy Self-pityAttention Contemplation Lust SeriousnessAwareness Earnestness Nervousness Skepticism
Awe Ecstasy Objectivity SleepinessBelief Embarrassment Opinion Stupor
Cognition Exaltation Patience SubordinationConsciousness Exhaustion Peacefulness Thought
Craziness Fatigue Pensiveness TranceCuriosity Friendliness Pity TranscendenceDecision Imagination Planning UneasinessDesire Insanity Playfulness WearinessDisarray Inspiration Reason Worry
Tamir et al. www.pnas.org/cgi/content/short/1511905112 10 of 12

Table S2. Regions representing PCA-derived dimensions (cluster-corrected, P < 0.05)
Dimension/anatomical label x y z Max T Volume
RationalityAnterior temporal lobe −40 21 −40 4.83 123Anterior temporal lobe/orbitofrontal cortex 46 13 −36 5.23 584Ventrolateral prefrontal cortex 48 21 22 4.82 250Dorsomedial prefrontal cortex/dorsolateral prefrontal cortex 32 33 48 5.13 1,449
Social ImpactAnterior temporal lobe/insula −38 −3 −12 6.08 890Posterior cingulate/dorsolateral prefrontal cortex/dorsomedial prefrontal cortex −8 −57 20 8.29 14,306Anterior temporal lobe 40 41 22 5.88 1,106Insula 48 3 10 8.52 433Temporoparietal junction −40 −69 22 6.62 2,038Posterior superior temporal sulcus −54 −37 0 4.28 78Temporoparietal junction 46 −63 26 6.40 939Dorsolateral prefrontal cortex 30 11 60 5.73 955
Human mindParahippocampal gyrus 18 −41 −14 5.29 108
ValenceVentrolateral prefrontal cortex −52 17 10 3.98 99Temporoparietal junction −48 −47 28 4.66 646Dorsolateral prefrontal cortex −34 23 38 5.01 591Precentral gyrus −32 −7 60 4.58 387
Coordinates refer to the Montreal Neurological Institute stereotaxic space.
Tamir et al. www.pnas.org/cgi/content/short/1511905112 11 of 12

Table S3. Regions containing patterns consistent with existing psychological theories (cluster-corrected, P < 0.05)
Dimensions/anatomical label x y z Max T Volume
Agency & experienceAnterior temporal lobe −42 19 −40 6.17 462Anterior temporal lobe/dorsomedial prefrontal cortex/dorsolateral prefrontal cortex 46 13 −36 5.81 5,826Superior temporal sulcus −54 −19 −18 4.98 340Lateral orbitofrontal cortex −34 37 −10 5.21 281Ventromedial prefrontal cortex −6 41 −6 5.03 303Temporoparietal junction/posterior superior temporal sulcus 58 −47 20 4.74 662
Valence & arousalAnterior temporal lobe −56 1 −30 5.33 531Middle temporal gyrus −58 −45 −10 5.37 608Hippocampus −34 −13 −12 4.42 78Thalamus 12 −23 −4 5.29 120Cuneus −4 −89 0 5.49 282Medial parietal lobe −10 −55 20 6.5 2,746Dorsolateral/dorsomedial prefrontal cortex 8 21 34 6.82 7,608Temporoparietal junction −46 −51 26 7.02 2,311Ventrolateral prefrontal cortex −56 17 10 4.18 113Temporoparietal junction 52 −69 30 6.01 960Midcingulate gyrus 6 −1 38 4.41 137
Emotion & reasonAnterior temporal lobe −42 19 −38 5.51 170Anterior temporal lobe/orbitofrontal cortex 16 35 −8 5.95 951Ventromedial prefrontal cortex −8 41 −4 4.18 310Lateral prefrontal cortex 48 21 22 4.03 77Dorsomedial prefrontal cortex 0 51 30 4.9 3,011
Mind & bodyAnterior insula −40 13 −22 4.25 78Medial prefrontal/anterior cingulate cortex 0 35 12 4.95 916Ventrolateral prefrontal cortex −46 33 4 4.38 106Temporoparietal junction −42 −61 8 4.48 336Medial parietal lobe 4 −53 20 6.23 1,753Dorsolateral prefrontal cortex 38 33 10 4.2 185Temporoparietal junction 46 −67 32 5.68 316Dorsolateral prefrontal cortex 22 15 52 4.39 194
Shared & uniqueParahippocampal gyrus −16 −39 −2 4.56 86Posterior cingulate cortex 12 −49 6 5.63 260
Social & nonsocialPrecuneus −4 −65 26 4.92 186
Warmth & competenceAnterior temporal lobe 42 19 −42 5.61 101Anterior temporal lobe/ventrolateral prefrontal cortex −50 19 12 4.3 374Superior temporal gyrus 46 21 −12 4.05 94Middle temporal gyrus −48 −41 −4 4.31 135Temporoparietal junction −46 −57 20 6.02 371Dorsomedial prefrontal cortex/dorsolateral prefrontal cortex 18 37 46 6.6 2,638
Coordinates refer to the Montreal Neurological Institute stereotaxic space.
Tamir et al. www.pnas.org/cgi/content/short/1511905112 12 of 12