Embed Size (px)
Citation preview
B R A I N R E S E A R C H 1 1 8 5 ( 2 0 0 7 ) 1 3 6 – 1 5 1
ava i l ab l e a t www.sc i enced i rec t . com
www.e l sev i e r. com/ loca te /b ra in res
Research Report
Neural correlates associated with intermanual transfer ofsensorimotor adaptation
Joaquin A. Angueraa, Colleen A. Russellb, Douglas C. Nolld, Rachael D. Seidlera,b,c,e,⁎aDivision of Kinesiology, University of Michigan, Ann Arbor, MI 48109-2214, USAbDepartment of Psychology, University of Michigan, 1012 East Hall, 525 East University, Ann Arbor, MI 48109-1109, USAcNeuroscience Program, University of Michigan, 4137 Undergraduate Research Building (USB),Box 2215, 2004 Washtenaw Ave., Ann Arbor, MI 48109-2215, USAdDepartments of Biomedical Engineering and Radiology, University of Michigan, 2350 Hayward St., Ann Arbor, MI 48109-2125, USAeInstitute of Gerontology, University of Michigan, 300 North Ingalls, 9th Floor, Ann Arbor, MI 48109-2007, USA
A R T I C L E I N F O
⁎ Corresponding author. 401 Washtenaw Ave.E-mail address: [email protected] (R.D.
0006-8993/$ – see front matter © 2007 Publisdoi:10.1016/j.brainres.2007.09.088
A B S T R A C T
Article history:Accepted 26 September 2007Available online 11 October 2007
Investigations of intermanual transfer of learning have demonstrated that individuals cantransfer acquired motor skills from one hand to the other. The purpose of the current studywas touse fMRI to investigate thepotential overlap of neural regions engagedduring learningand at transfer of learning from the dominant arm to the non-dominant arm duringsensorimotor adaptation. Participants performed a visuomotor adaptation joystick taskwhere they adapted manual aiming movements to a 30° rotation of the visual feedbackdisplay. They performed eleven blocks (24 trials/block) of right-hand adaptation beforeperforming the taskwith their left hand (transfer). Participants showed a selective transfer oflearning effect: prior right-hand practice led to reduced endpoint errors but not trajectoryerrors for the left hand. This is consistentwithwork showing that the right arm is specializedfor trajectory control while the left is specialized for endpoint control [Sainburg, R.L., 2005.Handedness,Differential specializations for control of trajectory andposition. Exerc Sport SciRev 33, 206–213.]. Early adaptation processes were associated with activation in frontal andparietal regions, including bilateral dorsal premotor cortex. At transfer, activation was seenin the temporal cortex aswell as the rightmedial frontal gyrus and themiddle occipital gyrus.These regions have been observed in other studies during the late phases of sensorimotoradaptation. Integrating these data with the existing literature, we suggest that the left dorsalpremotor cortex contributes to trajectory control, while the left visual and temporal corticescontribute to endpoint control.
© 2007 Published by Elsevier B.V.
Keywords:Intermanual transferVisuomotor adaptationMotor learningfMRI
1. Introduction
The sensorimotor system must have the ability to adapt inorder to deal with the changing demands of everyday life. Onecommon way of studying this adaptive capacity is with
, Ann Arbor, MI 48109-22Seidler).
hed by Elsevier B.V.
visuomotor adaptation tasks, in which the mapping betweenvisual andmotor space is distorted (cf. Welch et al., 1974; Bock,1992; Pine et al., 1996; Ghilardi et al., 2000). Neuroimagingstudies of visuomotor adaptation in human participants haverevealed that a variety of cortical and subcortical brain regions
14, USA. Fax: +1 734 936 1925.
137B R A I N R E S E A R C H 1 1 8 5 ( 2 0 0 7 ) 1 3 6 – 1 5 1
contribute to this adaptive process, including initial contribu-tions by the primarymotor cortex (M1), prefrontal cortex (PFC),parietal cortex, supplementary motor area (SMA), cerebellum,and striatum (Ghilardi et al., 2000; Imamizu et al., 2000; Inoueet al., 2000; Miall et al., 2001; Krakauer et al., 2004; Graydonet al., 2005; Seidler et al., 2006). Later in learning, activation hasbeen observed in the cerebellum, as well as the visual, parietaland temporal cortices (Imamizu et al., 2000; Inoue et al., 2000;Miall et al., 2001; Krakauer et al., 2004; Graydon et al., 2005).These studies have contributed greatly to our understandingof the neural and behavioral mechanisms underlying visuo-motor adaptation. However, the aforementioned studiestested adaptation only with the right (dominant) hand. Inves-tigation of transfer of adaptation from one hand to the otherwould allow for identification of brain regions associated withthe creation of the abstract representation of what is learnedduring adaptation, regardless of the hand being used, as wellas an examination of whether the regions involved withlearning are also engaged at transfer.
Studies on the lateralization of brain activity during se-quence learning have found evidence for left-hemisphere do-minance (Grafton et al., 1998, 2002). Specifically, the left dorsalpremotor cortex and the left SMA contributed to sequencelearning regardless of which hand was used during practice.These findings support Taylor and Heilman's (1980) (callosal)
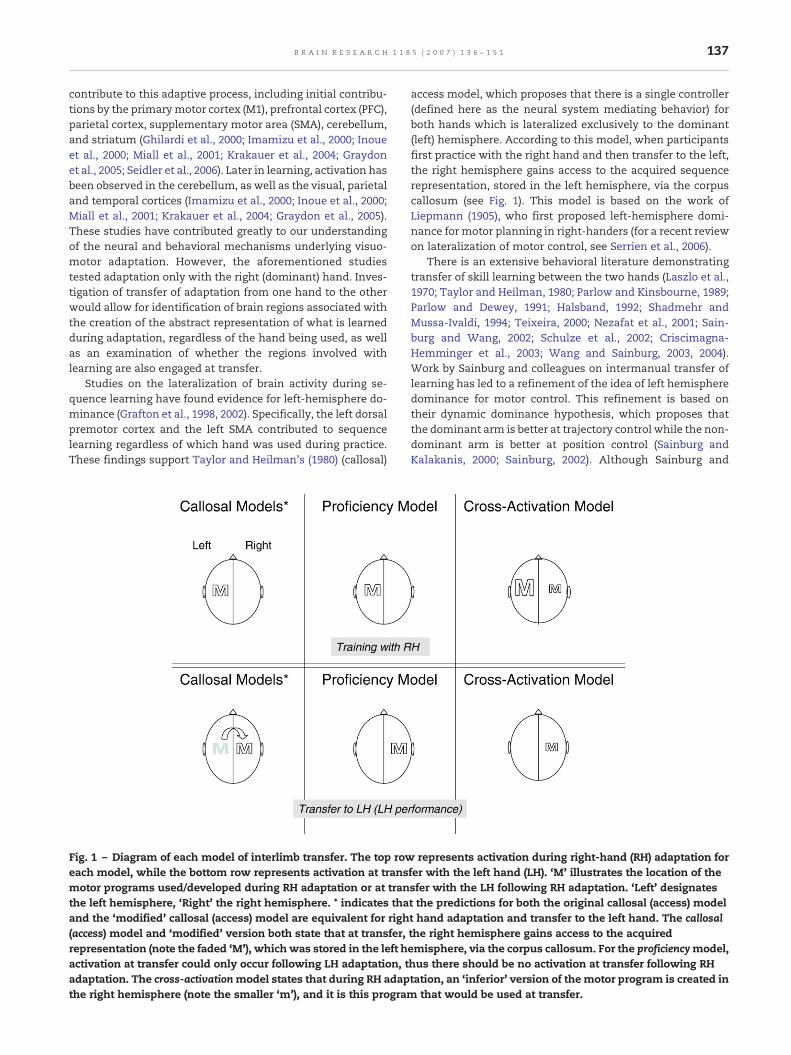
Fig. 1 – Diagram of each model of interlimb transfer. The top roweach model, while the bottom row represents activation at transmotor programs used/developed during RH adaptation or at tranthe left hemisphere, ‘Right’ the right hemisphere. * indicates thaand the ‘modified’ callosal (access) model are equivalent for righ(access) model and ‘modified’ version both state that at transfer,representation (note the faded ‘M’), whichwas stored in the left hactivation at transfer could only occur following LH adaptation, tadaptation. The cross-activationmodel states that during RH adapthe right hemisphere (note the smaller ‘m’), and it is this program
access model, which proposes that there is a single controller(defined here as the neural system mediating behavior) forboth hands which is lateralized exclusively to the dominant(left) hemisphere. According to this model, when participantsfirst practice with the right hand and then transfer to the left,the right hemisphere gains access to the acquired sequencerepresentation, stored in the left hemisphere, via the corpuscallosum (see Fig. 1). This model is based on the work ofLiepmann (1905), who first proposed left-hemisphere domi-nance formotor planning in right-handers (for a recent reviewon lateralization of motor control, see Serrien et al., 2006).
There is an extensive behavioral literature demonstratingtransfer of skill learning between the two hands (Laszlo et al.,1970; Taylor and Heilman, 1980; Parlow and Kinsbourne, 1989;Parlow and Dewey, 1991; Halsband, 1992; Shadmehr andMussa-Ivaldi, 1994; Teixeira, 2000; Nezafat et al., 2001; Sain-burg and Wang, 2002; Schulze et al., 2002; Criscimagna-Hemminger et al., 2003; Wang and Sainburg, 2003, 2004).Work by Sainburg and colleagues on intermanual transfer oflearning has led to a refinement of the idea of left hemispheredominance for motor control. This refinement is based ontheir dynamic dominance hypothesis, which proposes thatthe dominant arm is better at trajectory control while the non-dominant arm is better at position control (Sainburg andKalakanis, 2000; Sainburg, 2002). Although Sainburg and
represents activation during right-hand (RH) adaptation forfer with the left hand (LH). ‘M’ illustrates the location of thesfer with the LH following RH adaptation. ‘Left’ designatest the predictions for both the original callosal (access) modelt hand adaptation and transfer to the left hand. The callosalthe right hemisphere gains access to the acquiredemisphere, via the corpus callosum. For the proficiencymodel,hus there should be no activation at transfer following RHtation, an ‘inferior’ version of the motor program is created inthat would be used at transfer.
138 B R A I N R E S E A R C H 1 1 8 5 ( 2 0 0 7 ) 1 3 6 – 1 5 1
colleagues (Sainburg and Wang, 2002; Wang and Sainburg,2003; Sainburg, 2005) often refer to the two controllers as beingfor the “left arm” and “right arm”, it is not necessarily the casethat each arm's controller is found in the contralateralhemisphere. In fact, the bulk of the literature suggests a lefthemisphere dominance for motor planning and control,regardless of the arm being used (cf. Serrien et al., 2006).Sainburg and colleagues have shown that sensorimotoradaptation differentially transfers from the right to the lefthand and likewise from the left to the right hand (Sainburgand Wang, 2002; Wang and Sainburg, 2003). Sainburg andWang (2002) found that non-dominant (left) arm adaptation toa visuomotor rotation improved trajectory control of thedominant (right) arm adapting to the same transformation.In contrast, dominant (right) arm adaptation improved end-point position but not trajectory control of the non-dominant(left) arm adapting to the same transformation. Sainburg andcolleagues proposed that learned information about trajectoryand endpoint position is stored in two distinct memory re-sources located in each hemisphere (Wang and Sainburg,2003), with the arm used during adaptation determining thenature of the information transferred across limbs. Thesebehavioral results can be used as a model to make predictionsregarding the neural activity associated with sensorimotoradaptation. The theory put forth by the Sainburg group wouldpredict that sensorimotor adaptation is associated withbilateral activation, regardless of the hand used duringpractice. This is in contrast to what has been shown withsequence learning: namely, a preponderance of left hemi-sphere activation regardless of the performing hand (Graftonet al., 1998, 2002).
Three distinct models have been proposed to explain thecontribution of each hemisphere to the control of handmovements in light of the data on transfer of learning: (i) theaforementioned (callosal) access model, (ii) the proficiencymodel (Laszlo et al., 1970), which proposes that motorprograms are formed and stored contra-laterally to the handbeing trained, (iii) and the cross-activation model (Parlow andKinsbourne, 1989), which proposes that dual motor programsare formed in each hemisphere following dominant handtraining. Eachmodel would have unique predictions regardingwhether brain activation is unilateral or bilateral at transfer oflearning and how this activation overlaps with areas engagedduring the adaptation period (for a schematic interpretation ofthese predictions, see Fig. 1).
The callosal (access) model (and the Sainburg modifiedcallosal (access) model) predicts unilateral activation attransfer which would not normally overlap with activationthat occurred during the adaptation period.1 However, thismodel, unlike the cross-activation model, leaves open thepossibility of brain activation that is independent of the handbeing used, as left-hand usage could engage similar regionswithin the dominant (left) hemisphere that would be activated
1 The predictions of activation between the callosal (access) andSainburg-modified callosal (access) models would be different iftransfer of learning went from the left to right hand. With transferprogressing from the right to left hand, the two models areequivalent in their predicted activation patterns.
with right-hand usage. Thus, it is possible that someactivation at transfer may overlap for regions whose functionis independent of the hand being used. The proficiency modelwould predict that brain activitywould switch to contralateral,homologous regions from learning to transfer, as it proposesthat separate engrams are formed in the hemisphere contra-lateral to the hand being used. Therefore, this model would beunable to explain any type of overlap in brain activationduring learning and at transfer. Finally, the cross-activationmodel predicts bilateral activation during adaptation, andnon-overlapping unilateral activation at transfer.We base thison the proposal by Parlow and Kinsbourne (1989), which statesthat the non-dominant motor cortex uses an ‘inferior’ motorprogram independent of the ‘superior’ motor program foundin the dominant motor cortex during performance. Theseauthors also suggest that the use of the non-dominant handwould lead to unilateral activation at the non-dominanthemisphere, which would be congruent with activation ob-served at transfer.
The purpose of the current study was to determine theactivation pattern of brain regions associated with learningand transfer of a visuomotor adaptation task. In doing so, wehoped to evaluate the models of hand controllers describedabove with regards to their specific predictions of brainactivation patterns during adaptation and transfer. Specifi-cally, we wished to determine to what extent the brain regionscontributing to learning overlapwith areas engaged at transferof learning, if at all. Participants performed a sensorimotoradaptation task with their dominant (right) hand and thensubsequently transferred performance to their non-dominant(left) hand. Given the findings of Grafton and colleagues (1998,2002), we hypothesized overlapping activation in the lefthemisphere for both adaptation and transfer, which wouldargue against the predictions made by the proficiency andcross-activation models of hand controllers. Trajectory con-trol during prism adaptation has been associated with the leftdorsal premotor cortex (Lee and van Donkelaar, 2006), and weexpected to see similar activation for our visuomotor adapta-tion task during the learning stage. Furthermore, in line withthe dynamic dominance hypothesis (Sainburg, 2002), wepredicted that differential activation would be observed forright-hand performance (indicative of trajectory controlprocesses) and left-hand performance (indicative of endpointcontrol processes) during sensorimotor adaptation.
2. Results
2.1. Behavioral – adaptation
Twenty-five right-handed participants (13 men) between 18and 30 years of age (mean age 21.4 years, S.D.=2.2 years)participated in this study. In order to verify that transfer oflearning occurred, 9 participants (5 men) served as a controlgroup which performed an abbreviated version of the task in amock fMRI scanner environment, with the remaining 16participants making up the fMRI group. Data from fourparticipants in the fMRI group were excluded due to excessivehead movement in the scanner, and another participant'sdata were lost due to technical difficulties. Thus, the
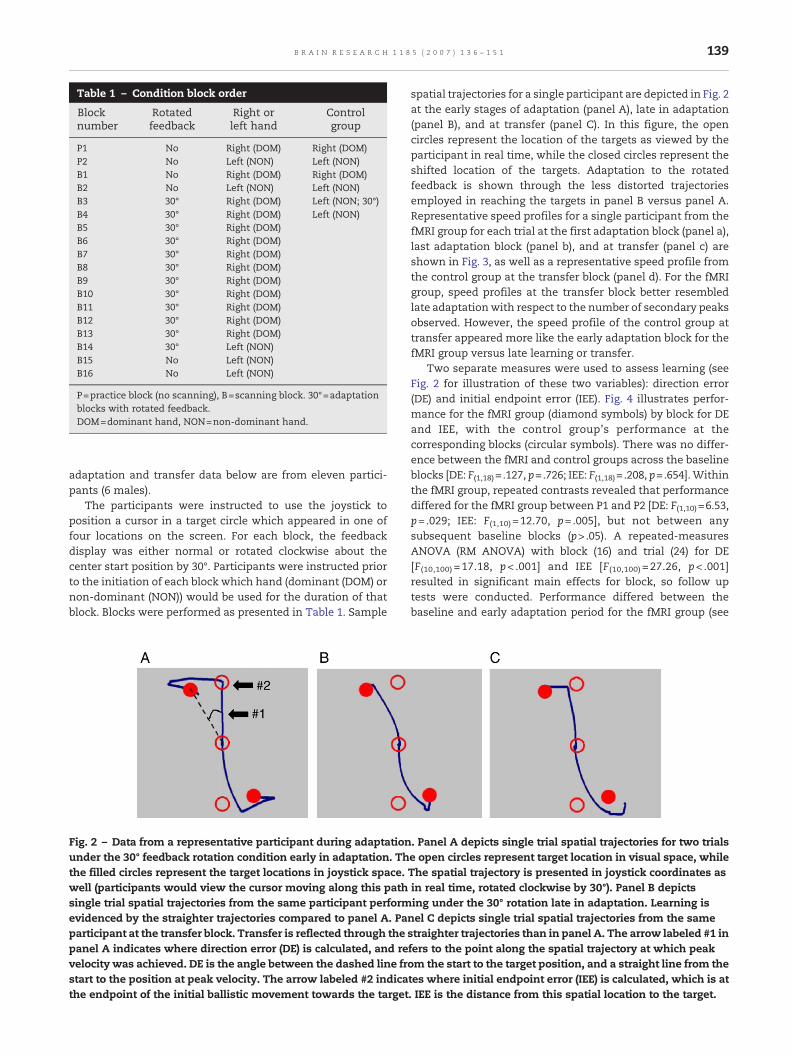
Table 1 – Condition block order
Blocknumber
Rotatedfeedback
Right orleft hand
Controlgroup
P1 No Right (DOM) Right (DOM)P2 No Left (NON) Left (NON)B1 No Right (DOM) Right (DOM)B2 No Left (NON) Left (NON)B3 30° Right (DOM) Left (NON; 30°)B4 30° Right (DOM) Left (NON)B5 30° Right (DOM)B6 30° Right (DOM)B7 30° Right (DOM)B8 30° Right (DOM)B9 30° Right (DOM)B10 30° Right (DOM)B11 30° Right (DOM)B12 30° Right (DOM)B13 30° Right (DOM)B14 30° Left (NON)B15 No Left (NON)B16 No Left (NON)
P=practice block (no scanning), B=scanning block. 30°=adaptationblocks with rotated feedback.DOM=dominant hand, NON=non-dominant hand.
139B R A I N R E S E A R C H 1 1 8 5 ( 2 0 0 7 ) 1 3 6 – 1 5 1
adaptation and transfer data below are from eleven partici-pants (6 males).
The participants were instructed to use the joystick toposition a cursor in a target circle which appeared in one offour locations on the screen. For each block, the feedbackdisplay was either normal or rotated clockwise about thecenter start position by 30°. Participants were instructed priorto the initiation of each block which hand (dominant (DOM) ornon-dominant (NON)) would be used for the duration of thatblock. Blocks were performed as presented in Table 1. Sample
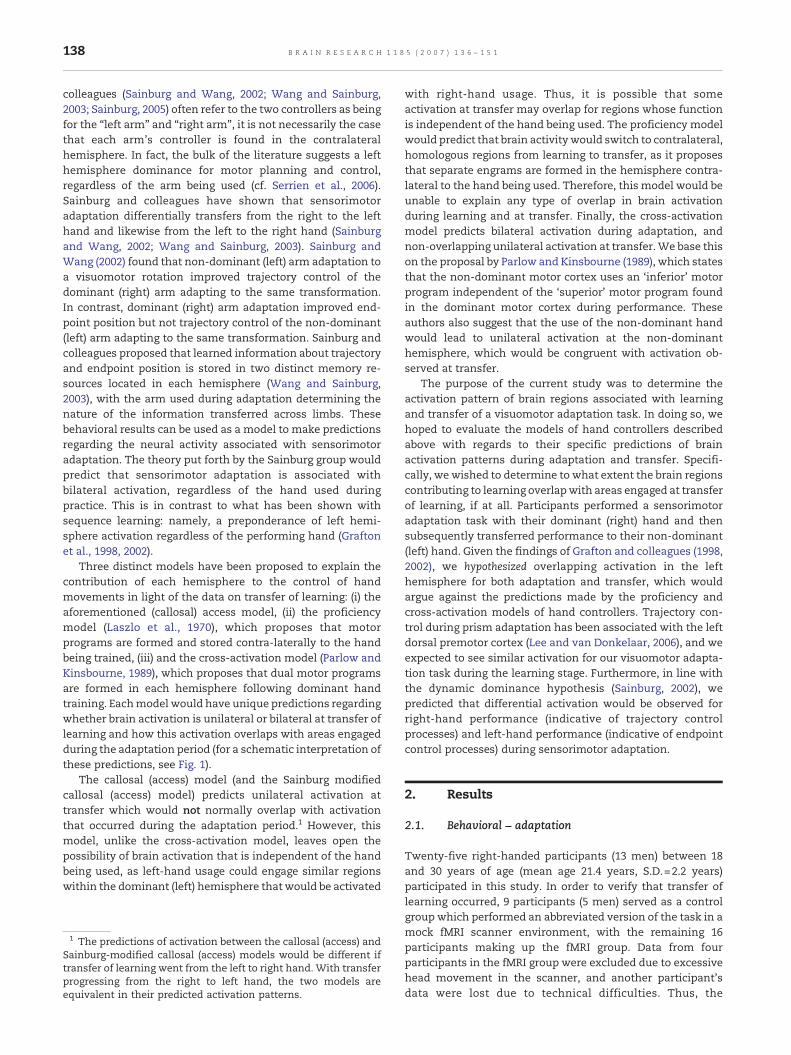
Fig. 2 – Data from a representative participant during adaptationunder the 30° feedback rotation condition early in adaptation. Ththe filled circles represent the target locations in joystick space.well (participants would view the cursor moving along this pathsingle trial spatial trajectories from the same participant performevidenced by the straighter trajectories compared to panel A. Paparticipant at the transfer block. Transfer is reflected through thepanel A indicates where direction error (DE) is calculated, and revelocity was achieved. DE is the angle between the dashed line frstart to the position at peak velocity. The arrow labeled #2 indicathe endpoint of the initial ballistic movement towards the target
spatial trajectories for a single participant are depicted in Fig. 2at the early stages of adaptation (panel A), late in adaptation(panel B), and at transfer (panel C). In this figure, the opencircles represent the location of the targets as viewed by theparticipant in real time, while the closed circles represent theshifted location of the targets. Adaptation to the rotatedfeedback is shown through the less distorted trajectoriesemployed in reaching the targets in panel B versus panel A.Representative speed profiles for a single participant from thefMRI group for each trial at the first adaptation block (panel a),last adaptation block (panel b), and at transfer (panel c) areshown in Fig. 3, as well as a representative speed profile fromthe control group at the transfer block (panel d). For the fMRIgroup, speed profiles at the transfer block better resembledlate adaptationwith respect to the number of secondary peaksobserved. However, the speed profile of the control group attransfer appeared more like the early adaptation block for thefMRI group versus late learning or transfer.
Two separate measures were used to assess learning (seeFig. 2 for illustration of these two variables): direction error(DE) and initial endpoint error (IEE). Fig. 4 illustrates perfor-mance for the fMRI group (diamond symbols) by block for DEand IEE, with the control group's performance at thecorresponding blocks (circular symbols). There was no differ-ence between the fMRI and control groups across the baselineblocks [DE: F(1,18)= .127, p=.726; IEE: F(1,18)= .208, p=.654].Withinthe fMRI group, repeated contrasts revealed that performancediffered for the fMRI group between P1 and P2 [DE: F(1,10)=6.53,p= .029; IEE: F(1,10) =12.70, p= .005], but not between anysubsequent baseline blocks (p>.05). A repeated-measuresANOVA (RM ANOVA) with block (16) and trial (24) for DE[F(10,100) =17.18, p< .001] and IEE [F(10,100) = 27.26, p< .001]resulted in significant main effects for block, so follow uptests were conducted. Performance differed between thebaseline and early adaptation period for the fMRI group (see
. Panel A depicts single trial spatial trajectories for two trialse open circles represent target location in visual space, whileThe spatial trajectory is presented in joystick coordinates asin real time, rotated clockwise by 30°). Panel B depictsing under the 30° rotation late in adaptation. Learning isnel C depicts single trial spatial trajectories from the samestraighter trajectories than in panel A. The arrow labeled #1 infers to the point along the spatial trajectory at which peakom the start to the target position, and a straight line from thetes where initial endpoint error (IEE) is calculated, which is at. IEE is the distance from this spatial location to the target.
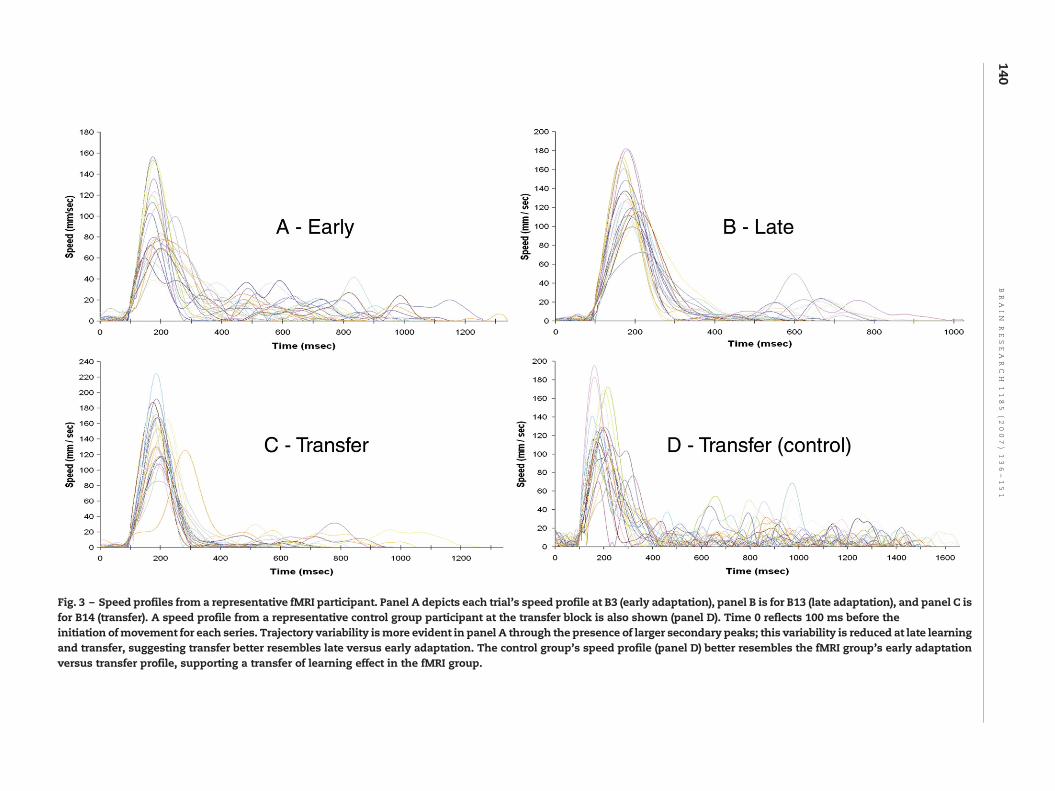
Fig. 3 – Speed profiles from a representative fMRI participant. Panel A depicts each trial's speed profile at B3 (early adaptation), panel B is for B13 (late adaptation), and panel C isfor B14 (transfer). A speed profile from a representative control group participant at the transfer block is also shown (panel D). Time 0 reflects 100 ms before theinitiation ofmovement for each series. Trajectory variability ismore evident in panel A through the presence of larger secondary peaks; this variability is reduced at late learningand transfer, suggesting transfer better resembles late versus early adaptation. The control group's speed profile (panel D) better resembles the fMRI group's early adaptationversus transfer profile, supporting a transfer of learning effect in the fMRI group.
140BR
AIN
RESEA
RC
H1185
(2007)
136–151
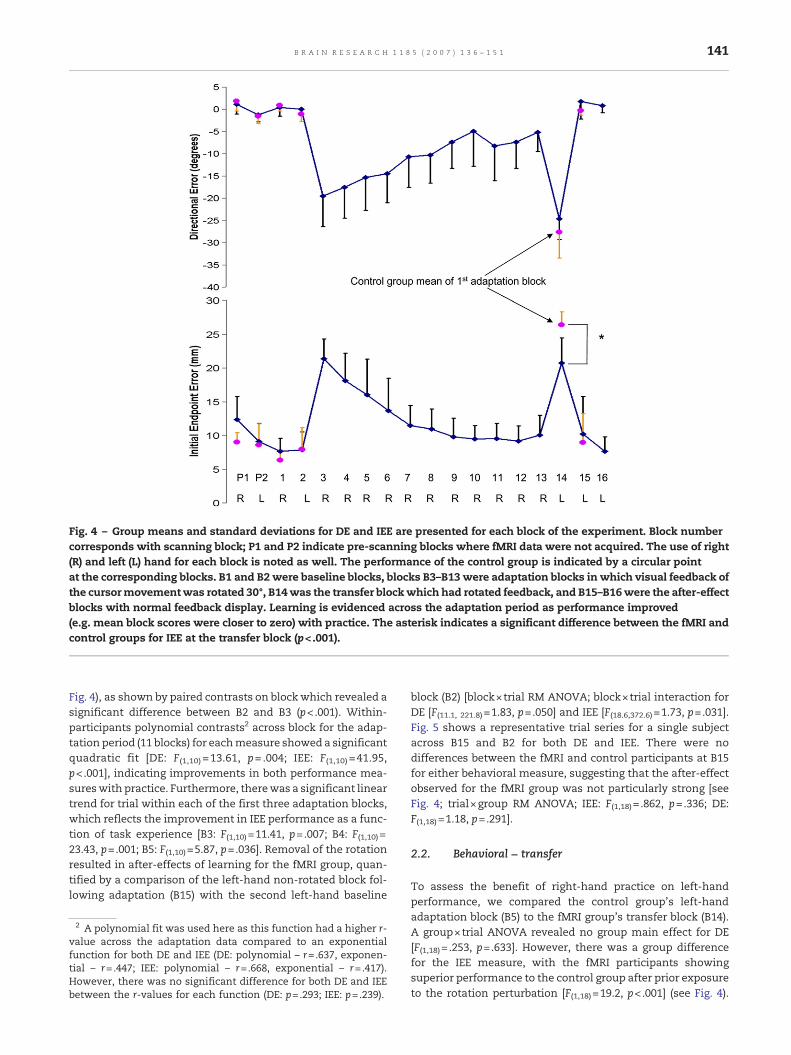
Fig. 4 – Group means and standard deviations for DE and IEE are presented for each block of the experiment. Block numbercorresponds with scanning block; P1 and P2 indicate pre-scanning blocks where fMRI data were not acquired. The use of right(R) and left (L) hand for each block is noted as well. The performance of the control group is indicated by a circular pointat the corresponding blocks. B1 and B2 were baseline blocks, blocks B3–B13 were adaptation blocks in which visual feedback ofthe cursormovementwas rotated 30°, B14was the transfer blockwhich had rotated feedback, and B15–B16were the after-effectblocks with normal feedback display. Learning is evidenced across the adaptation period as performance improved(e.g. mean block scores were closer to zero) with practice. The asterisk indicates a significant difference between the fMRI andcontrol groups for IEE at the transfer block (p<.001).
141B R A I N R E S E A R C H 1 1 8 5 ( 2 0 0 7 ) 1 3 6 – 1 5 1
Fig. 4), as shown by paired contrasts on block which revealed asignificant difference between B2 and B3 (p<.001). Within-participants polynomial contrasts2 across block for the adap-tation period (11 blocks) for eachmeasure showed a significantquadratic fit [DE: F(1,10) =13.61, p= .004; IEE: F(1,10) =41.95,p<.001], indicating improvements in both performance mea-sureswith practice. Furthermore, therewas a significant lineartrend for trial within each of the first three adaptation blocks,which reflects the improvement in IEE performance as a func-tion of task experience [B3: F(1,10)=11.41, p=.007; B4: F(1,10)=23.43, p=.001; B5: F(1,10)=5.87, p=.036]. Removal of the rotationresulted in after-effects of learning for the fMRI group, quan-tified by a comparison of the left-hand non-rotated block fol-lowing adaptation (B15) with the second left-hand baseline
2 A polynomial fit was used here as this function had a higher r-value across the adaptation data compared to an exponentialfunction for both DE and IEE (DE: polynomial – r=.637, exponen-tial – r=.447; IEE: polynomial – r=.668, exponential – r=.417).However, there was no significant difference for both DE and IEEbetween the r-values for each function (DE: p=.293; IEE: p=.239).
block (B2) [block×trial RM ANOVA; block×trial interaction forDE [F(11.1, 221.8)=1.83, p=.050] and IEE [F(18.6,372.6)=1.73, p=.031].Fig. 5 shows a representative trial series for a single subjectacross B15 and B2 for both DE and IEE. There were nodifferences between the fMRI and control participants at B15for either behavioral measure, suggesting that the after-effectobserved for the fMRI group was not particularly strong [seeFig. 4; trial×group RM ANOVA; IEE: F(1,18)= .862, p=.336; DE:F(1,18)=1.18, p=.291].
2.2. Behavioral – transfer
To assess the benefit of right-hand practice on left-handperformance, we compared the control group's left-handadaptation block (B5) to the fMRI group's transfer block (B14).A group×trial ANOVA revealed no group main effect for DE[F(1,18)= .253, p=.633]. However, there was a group differencefor the IEE measure, with the fMRI participants showingsuperior performance to the control group after prior exposureto the rotation perturbation [F(1,18)=19.2, p<.001] (see Fig. 4).
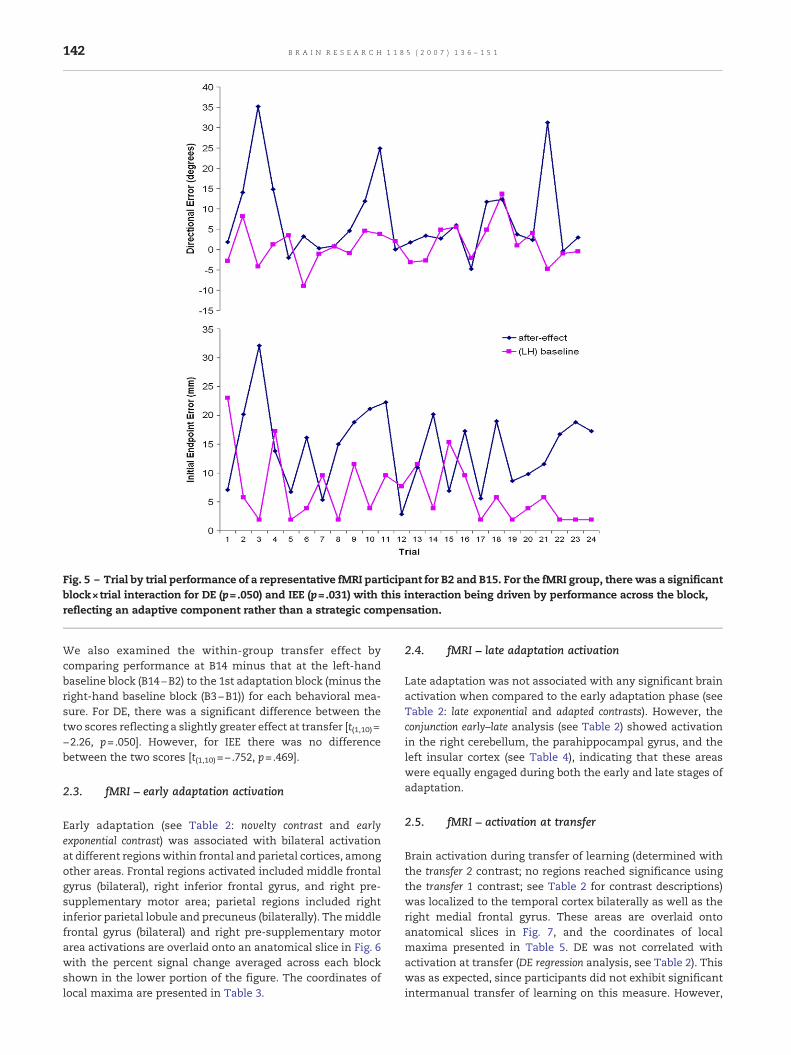
Fig. 5 – Trial by trial performance of a representative fMRI participant for B2 and B15. For the fMRI group, there was a significantblock×trial interaction for DE (p=.050) and IEE (p=.031) with this interaction being driven by performance across the block,reflecting an adaptive component rather than a strategic compensation.
142 B R A I N R E S E A R C H 1 1 8 5 ( 2 0 0 7 ) 1 3 6 – 1 5 1
We also examined the within-group transfer effect bycomparing performance at B14 minus that at the left-handbaseline block (B14−B2) to the 1st adaptation block (minus theright-hand baseline block (B3−B1)) for each behavioral mea-sure. For DE, there was a significant difference between thetwo scores reflecting a slightly greater effect at transfer [t(1,10)=−2.26, p=.050]. However, for IEE there was no differencebetween the two scores [t(1,10)=− .752, p=.469].
2.3. fMRI – early adaptation activation
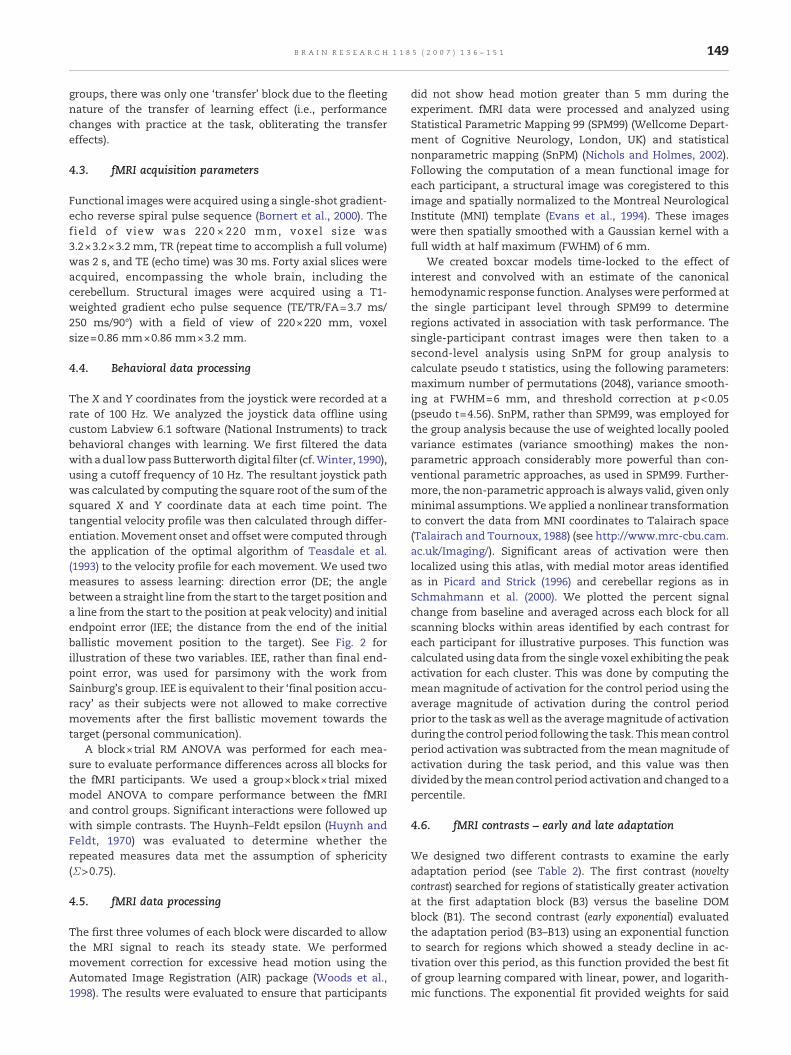
Early adaptation (see Table 2: novelty contrast and earlyexponential contrast) was associated with bilateral activationat different regionswithin frontal and parietal cortices, amongother areas. Frontal regions activated included middle frontalgyrus (bilateral), right inferior frontal gyrus, and right pre-supplementary motor area; parietal regions included rightinferior parietal lobule and precuneus (bilaterally). Themiddlefrontal gyrus (bilateral) and right pre-supplementary motorarea activations are overlaid onto an anatomical slice in Fig. 6with the percent signal change averaged across each blockshown in the lower portion of the figure. The coordinates oflocal maxima are presented in Table 3.
2.4. fMRI – late adaptation activation
Late adaptation was not associated with any significant brainactivation when compared to the early adaptation phase (seeTable 2: late exponential and adapted contrasts). However, theconjunction early–late analysis (see Table 2) showed activationin the right cerebellum, the parahippocampal gyrus, and theleft insular cortex (see Table 4), indicating that these areaswere equally engaged during both the early and late stages ofadaptation.
2.5. fMRI – activation at transfer
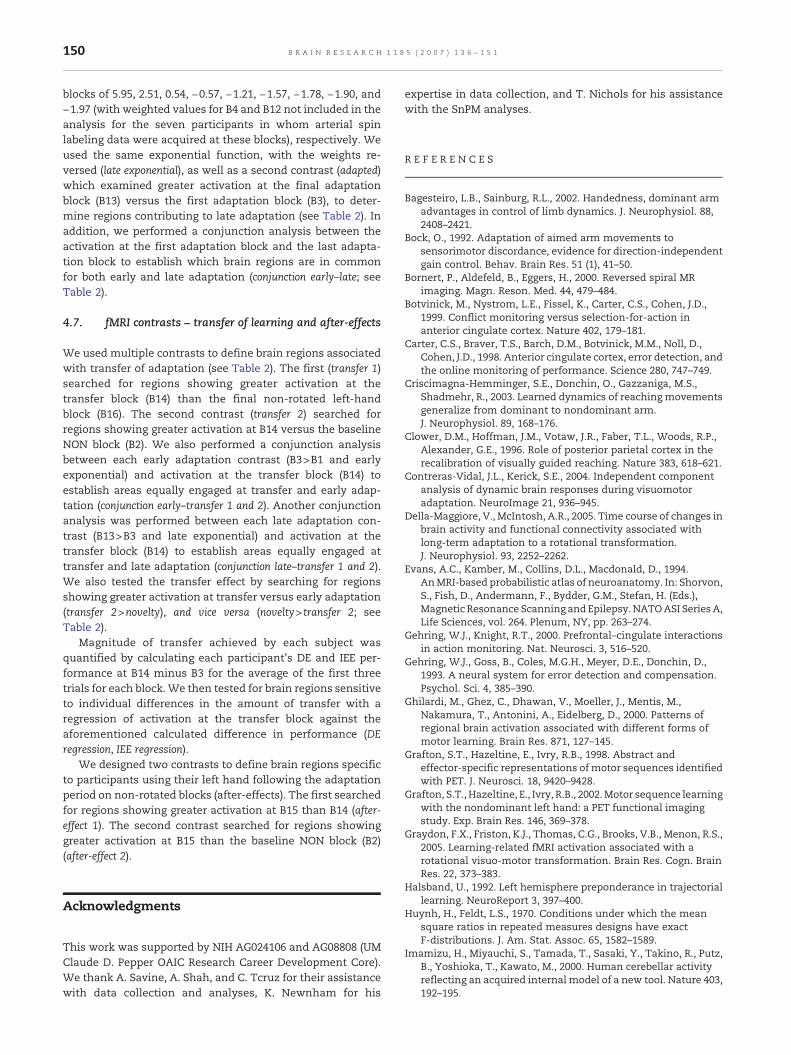
Brain activation during transfer of learning (determined withthe transfer 2 contrast; no regions reached significance usingthe transfer 1 contrast; see Table 2 for contrast descriptions)was localized to the temporal cortex bilaterally as well as theright medial frontal gyrus. These areas are overlaid ontoanatomical slices in Fig. 7, and the coordinates of localmaxima presented in Table 5. DE was not correlated withactivation at transfer (DE regression analysis, see Table 2). Thiswas as expected, since participants did not exhibit significantintermanual transfer of learning on this measure. However,
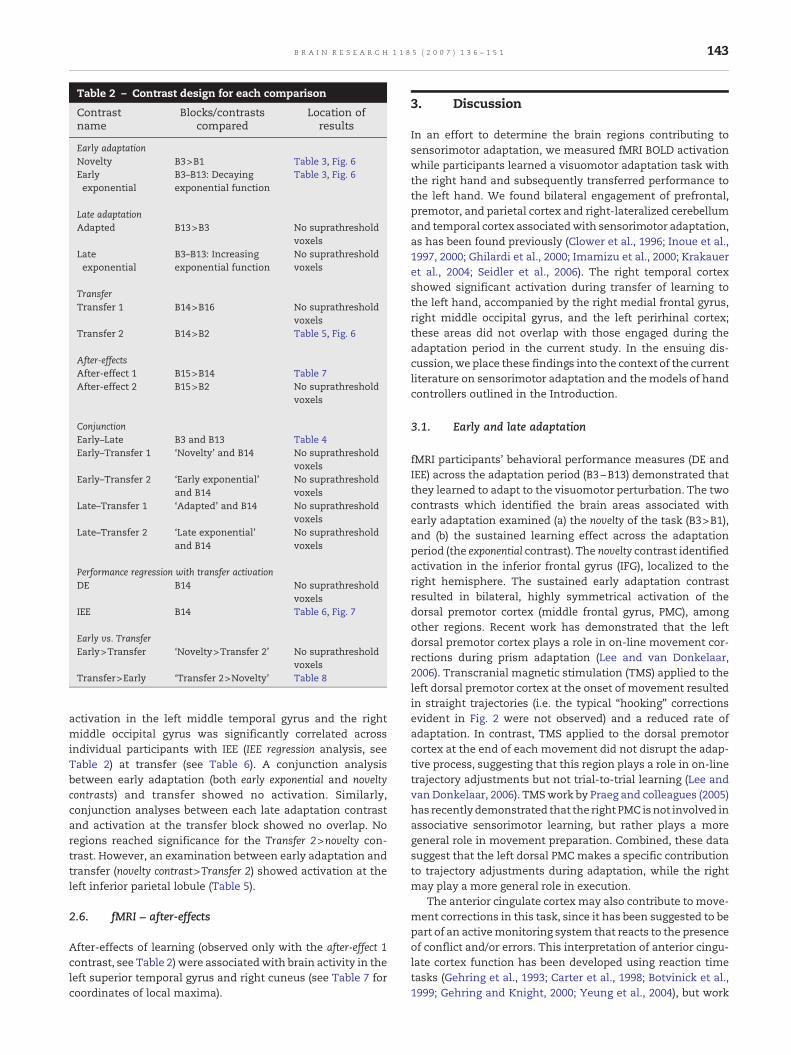
Table 2 – Contrast design for each comparison
Contrastname
Blocks/contrastscompared
Location ofresults
Early adaptationNovelty B3>B1 Table 3, Fig. 6Earlyexponential
B3–B13: Decayingexponential function
Table 3, Fig. 6
Late adaptationAdapted B13>B3 No suprathreshold
voxelsLateexponential
B3–B13: Increasingexponential function
No suprathresholdvoxels
TransferTransfer 1 B14>B16 No suprathreshold
voxelsTransfer 2 B14>B2 Table 5, Fig. 6
After-effectsAfter-effect 1 B15>B14 Table 7After-effect 2 B15>B2 No suprathreshold
voxels
ConjunctionEarly–Late B3 and B13 Table 4Early–Transfer 1 ‘Novelty’ and B14 No suprathreshold
voxelsEarly–Transfer 2 ‘Early exponential’
and B14No suprathresholdvoxels
Late–Transfer 1 ‘Adapted’ and B14 No suprathresholdvoxels
Late–Transfer 2 ‘Late exponential’and B14
No suprathresholdvoxels
Performance regression with transfer activationDE B14 No suprathreshold
voxelsIEE B14 Table 6, Fig. 7
Early vs. TransferEarly>Transfer ‘Novelty>Transfer 2’ No suprathreshold
voxelsTransfer>Early ‘Transfer 2>Novelty’ Table 8
143B R A I N R E S E A R C H 1 1 8 5 ( 2 0 0 7 ) 1 3 6 – 1 5 1
activation in the left middle temporal gyrus and the rightmiddle occipital gyrus was significantly correlated acrossindividual participants with IEE (IEE regression analysis, seeTable 2) at transfer (see Table 6). A conjunction analysisbetween early adaptation (both early exponential and noveltycontrasts) and transfer showed no activation. Similarly,conjunction analyses between each late adaptation contrastand activation at the transfer block showed no overlap. Noregions reached significance for the Transfer 2>novelty con-trast. However, an examination between early adaptation andtransfer (novelty contrast>Transfer 2) showed activation at theleft inferior parietal lobule (Table 5).
2.6. fMRI – after-effects
After-effects of learning (observed only with the after-effect 1contrast, see Table 2) were associatedwith brain activity in theleft superior temporal gyrus and right cuneus (see Table 7 forcoordinates of local maxima).
3. Discussion
In an effort to determine the brain regions contributing tosensorimotor adaptation, we measured fMRI BOLD activationwhile participants learned a visuomotor adaptation task withthe right hand and subsequently transferred performance tothe left hand. We found bilateral engagement of prefrontal,premotor, and parietal cortex and right-lateralized cerebellumand temporal cortex associatedwith sensorimotor adaptation,as has been found previously (Clower et al., 1996; Inoue et al.,1997, 2000; Ghilardi et al., 2000; Imamizu et al., 2000; Krakaueret al., 2004; Seidler et al., 2006). The right temporal cortexshowed significant activation during transfer of learning tothe left hand, accompanied by the right medial frontal gyrus,right middle occipital gyrus, and the left perirhinal cortex;these areas did not overlap with those engaged during theadaptation period in the current study. In the ensuing dis-cussion, we place these findings into the context of the currentliterature on sensorimotor adaptation and themodels of handcontrollers outlined in the Introduction.
3.1. Early and late adaptation
fMRI participants' behavioral performance measures (DE andIEE) across the adaptation period (B3−B13) demonstrated thatthey learned to adapt to the visuomotor perturbation. The twocontrasts which identified the brain areas associated withearly adaptation examined (a) the novelty of the task (B3>B1),and (b) the sustained learning effect across the adaptationperiod (the exponential contrast). The novelty contrast identifiedactivation in the inferior frontal gyrus (IFG), localized to theright hemisphere. The sustained early adaptation contrastresulted in bilateral, highly symmetrical activation of thedorsal premotor cortex (middle frontal gyrus, PMC), amongother regions. Recent work has demonstrated that the leftdorsal premotor cortex plays a role in on-line movement cor-rections during prism adaptation (Lee and van Donkelaar,2006). Transcranial magnetic stimulation (TMS) applied to theleft dorsal premotor cortex at the onset of movement resultedin straight trajectories (i.e. the typical “hooking” correctionsevident in Fig. 2 were not observed) and a reduced rate ofadaptation. In contrast, TMS applied to the dorsal premotorcortex at the end of each movement did not disrupt the adap-tive process, suggesting that this region plays a role in on-linetrajectory adjustments but not trial-to-trial learning (Lee andvan Donkelaar, 2006). TMSwork by Praeg and colleagues (2005)has recently demonstrated that the right PMC isnot involved inassociative sensorimotor learning, but rather plays a moregeneral role in movement preparation. Combined, these datasuggest that the left dorsal PMC makes a specific contributionto trajectory adjustments during adaptation, while the rightmay play a more general role in execution.
The anterior cingulate cortex may also contribute to move-ment corrections in this task, since it has been suggested to bepart of an activemonitoring system that reacts to the presenceof conflict and/or errors. This interpretation of anterior cingu-late cortex function has been developed using reaction timetasks (Gehring et al., 1993; Carter et al., 1998; Botvinick et al.,1999; Gehring and Knight, 2000; Yeung et al., 2004), but work
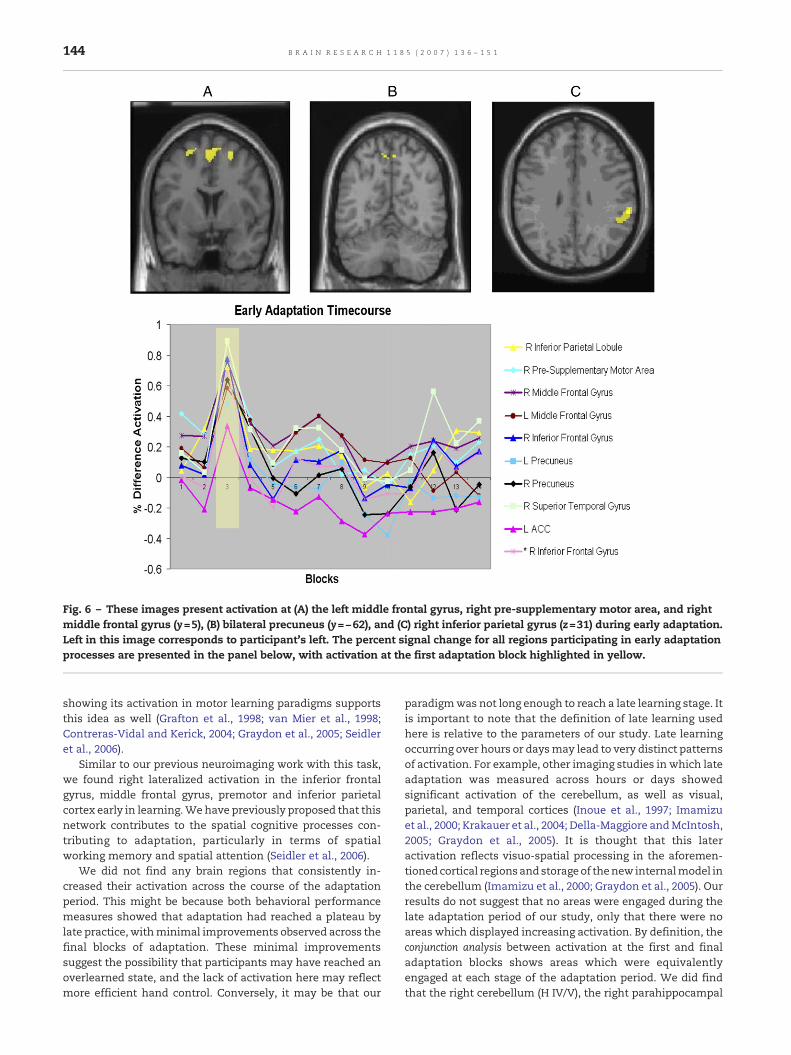
Fig. 6 – These images present activation at (A) the left middle frontal gyrus, right pre-supplementary motor area, and rightmiddle frontal gyrus (y=5), (B) bilateral precuneus (y=−62), and (C) right inferior parietal gyrus (z=31) during early adaptation.Left in this image corresponds to participant's left. The percent signal change for all regions participating in early adaptationprocesses are presented in the panel below, with activation at the first adaptation block highlighted in yellow.
144 B R A I N R E S E A R C H 1 1 8 5 ( 2 0 0 7 ) 1 3 6 – 1 5 1
showing its activation in motor learning paradigms supportsthis idea as well (Grafton et al., 1998; van Mier et al., 1998;Contreras-Vidal and Kerick, 2004; Graydon et al., 2005; Seidleret al., 2006).
Similar to our previous neuroimaging work with this task,we found right lateralized activation in the inferior frontalgyrus, middle frontal gyrus, premotor and inferior parietalcortex early in learning.Wehave previously proposed that thisnetwork contributes to the spatial cognitive processes con-tributing to adaptation, particularly in terms of spatialworking memory and spatial attention (Seidler et al., 2006).
We did not find any brain regions that consistently in-creased their activation across the course of the adaptationperiod. This might be because both behavioral performancemeasures showed that adaptation had reached a plateau bylate practice, withminimal improvements observed across thefinal blocks of adaptation. These minimal improvementssuggest the possibility that participants may have reached anoverlearned state, and the lack of activation here may reflectmore efficient hand control. Conversely, it may be that our
paradigmwas not long enough to reach a late learning stage. Itis important to note that the definition of late learning usedhere is relative to the parameters of our study. Late learningoccurring over hours or daysmay lead to very distinct patternsof activation. For example, other imaging studies in which lateadaptation was measured across hours or days showedsignificant activation of the cerebellum, as well as visual,parietal, and temporal cortices (Inoue et al., 1997; Imamizuet al., 2000; Krakauer et al., 2004; Della-Maggiore andMcIntosh,2005; Graydon et al., 2005). It is thought that this lateractivation reflects visuo-spatial processing in the aforemen-tionedcortical regionsandstorageof thenew internalmodel inthe cerebellum (Imamizu et al., 2000; Graydon et al., 2005). Ourresults do not suggest that no areas were engaged during thelate adaptation period of our study, only that there were noareas which displayed increasing activation. By definition, theconjunction analysis between activation at the first and finaladaptation blocks shows areas which were equivalentlyengaged at each stage of the adaptation period. We did findthat the right cerebellum (H IV/V), the right parahippocampal
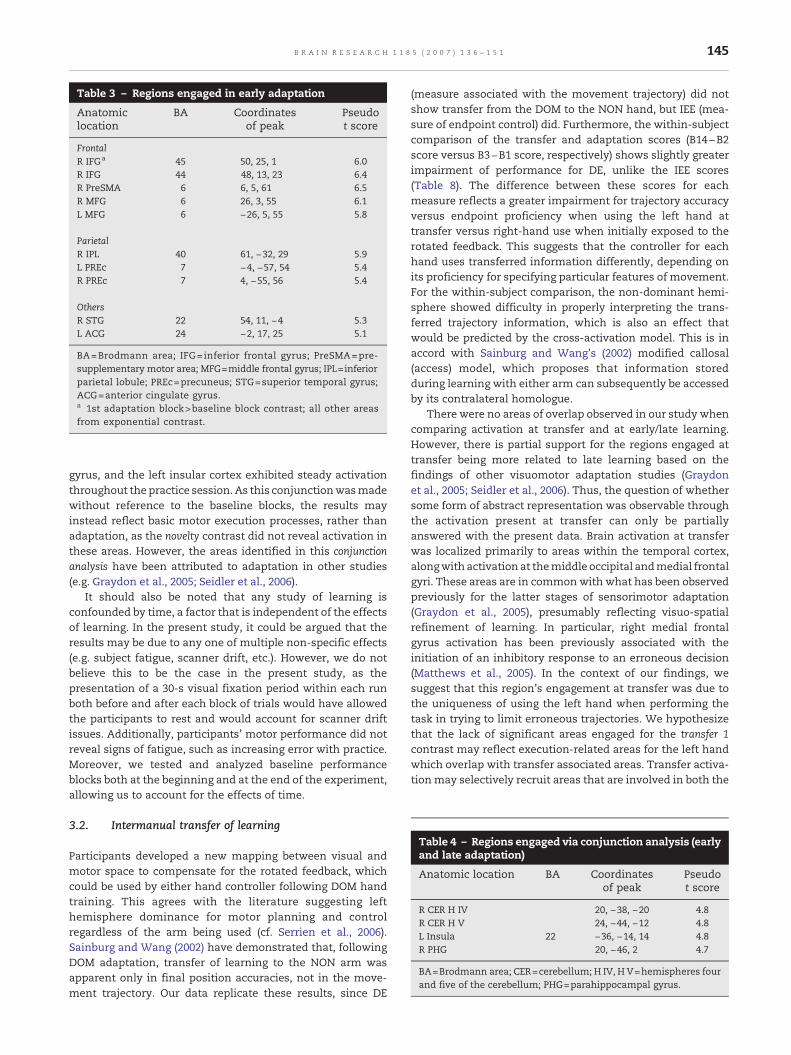
Table 3 – Regions engaged in early adaptation
Anatomiclocation
BA Coordinatesof peak
Pseudot score
FrontalR IFGa 45 50, 25, 1 6.0R IFG 44 48, 13, 23 6.4R PreSMA 6 6, 5, 61 6.5R MFG 6 26, 3, 55 6.1L MFG 6 −26, 5, 55 5.8
ParietalR IPL 40 61, −32, 29 5.9L PREc 7 −4, −57, 54 5.4R PREc 7 4, −55, 56 5.4
OthersR STG 22 54, 11, −4 5.3L ACG 24 −2, 17, 25 5.1
BA=Brodmann area; IFG= inferior frontal gyrus; PreSMA=pre-supplementary motor area; MFG=middle frontal gyrus; IPL=inferiorparietal lobule; PREc=precuneus; STG=superior temporal gyrus;ACG=anterior cingulate gyrus.a 1st adaptation block>baseline block contrast; all other areasfrom exponential contrast.
Table 4 – Regions engaged via conjunction analysis (earlyand late adaptation)
Anatomic location BA Coordinatesof peak
Pseudot score
R CER H IV 20, −38, −20 4.8R CER H V 24, −44, −12 4.8L Insula 22 −36, −14, 14 4.8R PHG 20, −46, 2 4.7
BA=Brodmann area; CER=cerebellum; H IV, H V=hemispheres fourand five of the cerebellum; PHG=parahippocampal gyrus.
145B R A I N R E S E A R C H 1 1 8 5 ( 2 0 0 7 ) 1 3 6 – 1 5 1
gyrus, and the left insular cortex exhibited steady activationthroughout the practice session. As this conjunctionwasmadewithout reference to the baseline blocks, the results mayinstead reflect basic motor execution processes, rather thanadaptation, as the novelty contrast did not reveal activation inthese areas. However, the areas identified in this conjunctionanalysis have been attributed to adaptation in other studies(e.g. Graydon et al., 2005; Seidler et al., 2006).
It should also be noted that any study of learning isconfounded by time, a factor that is independent of the effectsof learning. In the present study, it could be argued that theresults may be due to any one of multiple non-specific effects(e.g. subject fatigue, scanner drift, etc.). However, we do notbelieve this to be the case in the present study, as thepresentation of a 30-s visual fixation period within each runboth before and after each block of trials would have allowedthe participants to rest and would account for scanner driftissues. Additionally, participants' motor performance did notreveal signs of fatigue, such as increasing error with practice.Moreover, we tested and analyzed baseline performanceblocks both at the beginning and at the end of the experiment,allowing us to account for the effects of time.
3.2. Intermanual transfer of learning
Participants developed a new mapping between visual andmotor space to compensate for the rotated feedback, whichcould be used by either hand controller following DOM handtraining. This agrees with the literature suggesting lefthemisphere dominance for motor planning and controlregardless of the arm being used (cf. Serrien et al., 2006).Sainburg and Wang (2002) have demonstrated that, followingDOM adaptation, transfer of learning to the NON arm wasapparent only in final position accuracies, not in the move-ment trajectory. Our data replicate these results, since DE
(measure associated with the movement trajectory) did notshow transfer from the DOM to the NON hand, but IEE (mea-sure of endpoint control) did. Furthermore, the within-subjectcomparison of the transfer and adaptation scores (B14−B2score versus B3−B1 score, respectively) shows slightly greaterimpairment of performance for DE, unlike the IEE scores(Table 8). The difference between these scores for eachmeasure reflects a greater impairment for trajectory accuracyversus endpoint proficiency when using the left hand attransfer versus right-hand use when initially exposed to therotated feedback. This suggests that the controller for eachhand uses transferred information differently, depending onits proficiency for specifying particular features of movement.For the within-subject comparison, the non-dominant hemi-sphere showed difficulty in properly interpreting the trans-ferred trajectory information, which is also an effect thatwould be predicted by the cross-activation model. This is inaccord with Sainburg and Wang's (2002) modified callosal(access) model, which proposes that information storedduring learning with either arm can subsequently be accessedby its contralateral homologue.
There were no areas of overlap observed in our study whencomparing activation at transfer and at early/late learning.However, there is partial support for the regions engaged attransfer being more related to late learning based on thefindings of other visuomotor adaptation studies (Graydonet al., 2005; Seidler et al., 2006). Thus, the question of whethersome form of abstract representation was observable throughthe activation present at transfer can only be partiallyanswered with the present data. Brain activation at transferwas localized primarily to areas within the temporal cortex,alongwith activation at themiddle occipital andmedial frontalgyri. These areas are in commonwith what has been observedpreviously for the latter stages of sensorimotor adaptation(Graydon et al., 2005), presumably reflecting visuo-spatialrefinement of learning. In particular, right medial frontalgyrus activation has been previously associated with theinitiation of an inhibitory response to an erroneous decision(Matthews et al., 2005). In the context of our findings, wesuggest that this region's engagement at transfer was due tothe uniqueness of using the left hand when performing thetask in trying to limit erroneous trajectories. We hypothesizethat the lack of significant areas engaged for the transfer 1contrast may reflect execution-related areas for the left handwhich overlap with transfer associated areas. Transfer activa-tionmay selectively recruit areas that are involved in both the
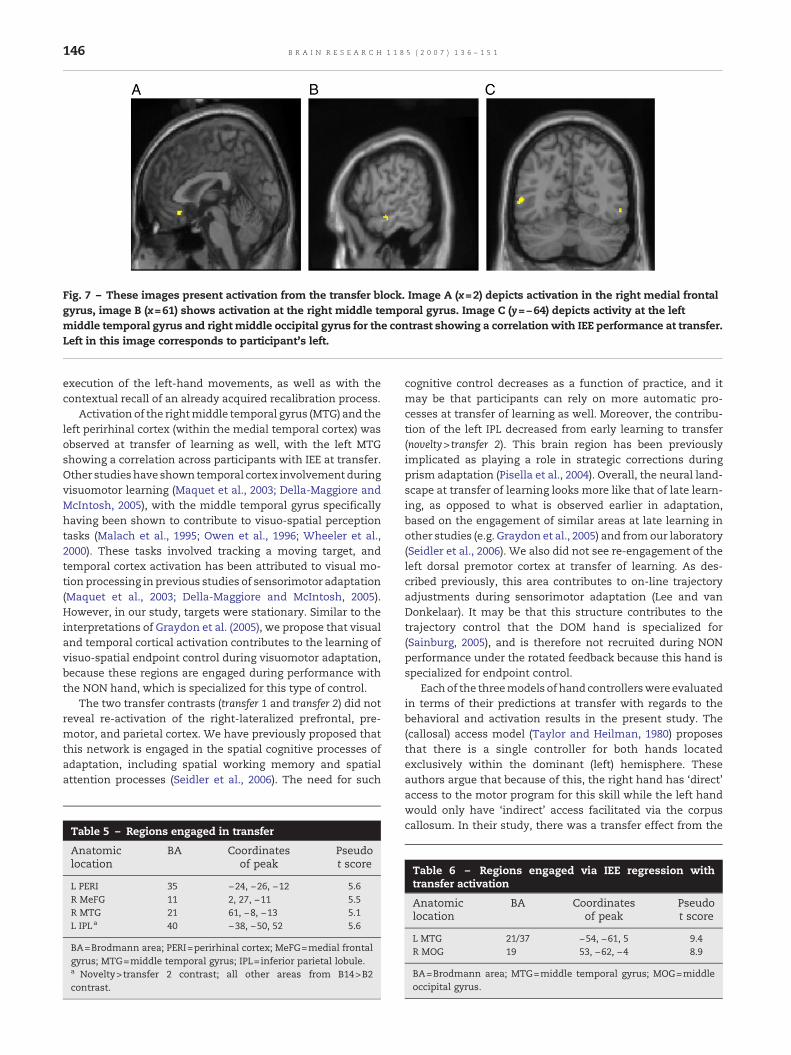
Fig. 7 – These images present activation from the transfer block. Image A (x=2) depicts activation in the right medial frontalgyrus, image B (x=61) shows activation at the right middle temporal gyrus. Image C (y=−64) depicts activity at the leftmiddle temporal gyrus and right middle occipital gyrus for the contrast showing a correlation with IEE performance at transfer.Left in this image corresponds to participant's left.
146 B R A I N R E S E A R C H 1 1 8 5 ( 2 0 0 7 ) 1 3 6 – 1 5 1
execution of the left-hand movements, as well as with thecontextual recall of an already acquired recalibration process.
Activation of the rightmiddle temporal gyrus (MTG) and theleft perirhinal cortex (within the medial temporal cortex) wasobserved at transfer of learning as well, with the left MTGshowing a correlation across participants with IEE at transfer.Other studieshave shown temporal cortex involvement duringvisuomotor learning (Maquet et al., 2003; Della-Maggiore andMcIntosh, 2005), with the middle temporal gyrus specificallyhaving been shown to contribute to visuo-spatial perceptiontasks (Malach et al., 1995; Owen et al., 1996; Wheeler et al.,2000). These tasks involved tracking a moving target, andtemporal cortex activation has been attributed to visual mo-tion processing in previous studies of sensorimotor adaptation(Maquet et al., 2003; Della-Maggiore and McIntosh, 2005).However, in our study, targets were stationary. Similar to theinterpretations of Graydon et al. (2005), we propose that visualand temporal cortical activation contributes to the learning ofvisuo-spatial endpoint control during visuomotor adaptation,because these regions are engaged during performance withthe NON hand, which is specialized for this type of control.
The two transfer contrasts (transfer 1 and transfer 2) did notreveal re-activation of the right-lateralized prefrontal, pre-motor, and parietal cortex. We have previously proposed thatthis network is engaged in the spatial cognitive processes ofadaptation, including spatial working memory and spatialattention processes (Seidler et al., 2006). The need for such
Table 5 – Regions engaged in transfer
Anatomiclocation
BA Coordinatesof peak
Pseudot score
L PERI 35 −24, −26, −12 5.6R MeFG 11 2, 27, −11 5.5R MTG 21 61, −8, −13 5.1L IPLa 40 −38, −50, 52 5.6
BA=Brodmann area; PERI=perirhinal cortex; MeFG=medial frontalgyrus; MTG=middle temporal gyrus; IPL=inferior parietal lobule.a Novelty>transfer 2 contrast; all other areas from B14>B2contrast.
cognitive control decreases as a function of practice, and itmay be that participants can rely on more automatic pro-cesses at transfer of learning as well. Moreover, the contribu-tion of the left IPL decreased from early learning to transfer(novelty> transfer 2). This brain region has been previouslyimplicated as playing a role in strategic corrections duringprism adaptation (Pisella et al., 2004). Overall, the neural land-scape at transfer of learning looks more like that of late learn-ing, as opposed to what is observed earlier in adaptation,based on the engagement of similar areas at late learning inother studies (e.g. Graydon et al., 2005) and fromour laboratory(Seidler et al., 2006). We also did not see re-engagement of theleft dorsal premotor cortex at transfer of learning. As des-cribed previously, this area contributes to on-line trajectoryadjustments during sensorimotor adaptation (Lee and vanDonkelaar). It may be that this structure contributes to thetrajectory control that the DOM hand is specialized for(Sainburg, 2005), and is therefore not recruited during NONperformance under the rotated feedback because this hand isspecialized for endpoint control.
Eachof the threemodels of hand controllerswere evaluatedin terms of their predictions at transfer with regards to thebehavioral and activation results in the present study. The(callosal) access model (Taylor and Heilman, 1980) proposesthat there is a single controller for both hands locatedexclusively within the dominant (left) hemisphere. Theseauthors argue that because of this, the right hand has ‘direct’access to the motor program for this skill while the left handwould only have ‘indirect’ access facilitated via the corpuscallosum. In their study, there was a transfer effect from the
Table 6 – Regions engaged via IEE regression withtransfer activation
Anatomiclocation
BA Coordinatesof peak
Pseudot score
L MTG 21/37 −54, −61, 5 9.4R MOG 19 53, −62, −4 8.9
BA=Brodmann area; MTG=middle temporal gyrus; MOG=middleoccipital gyrus.
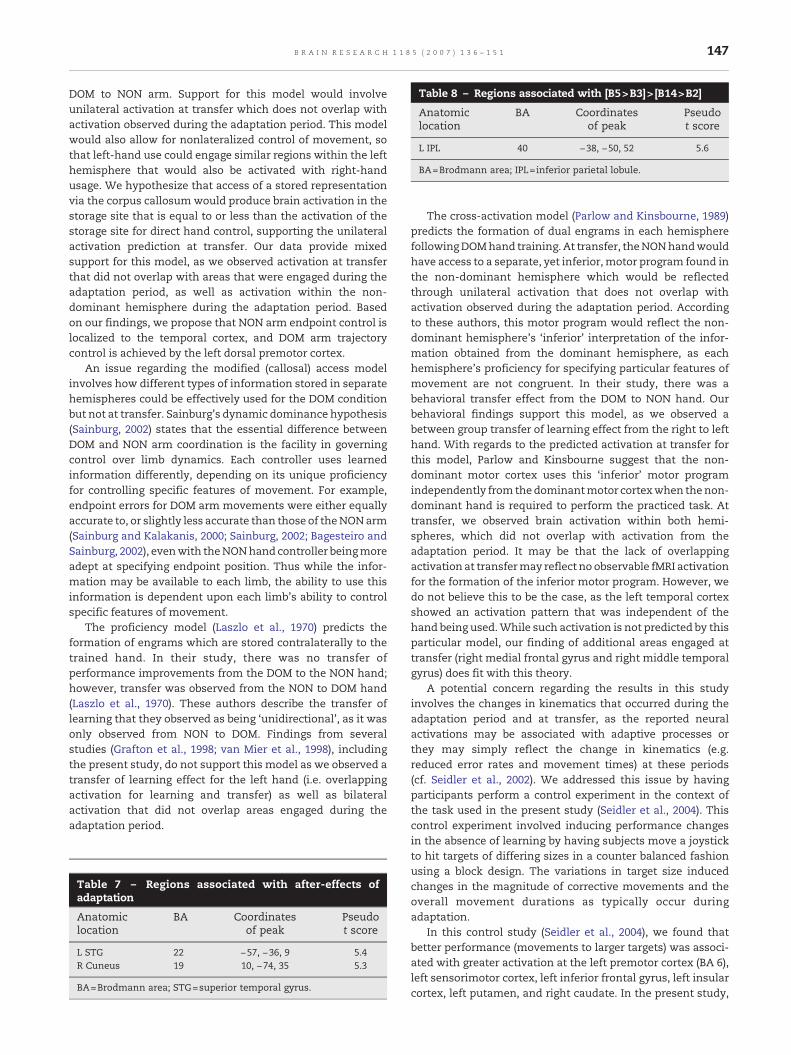
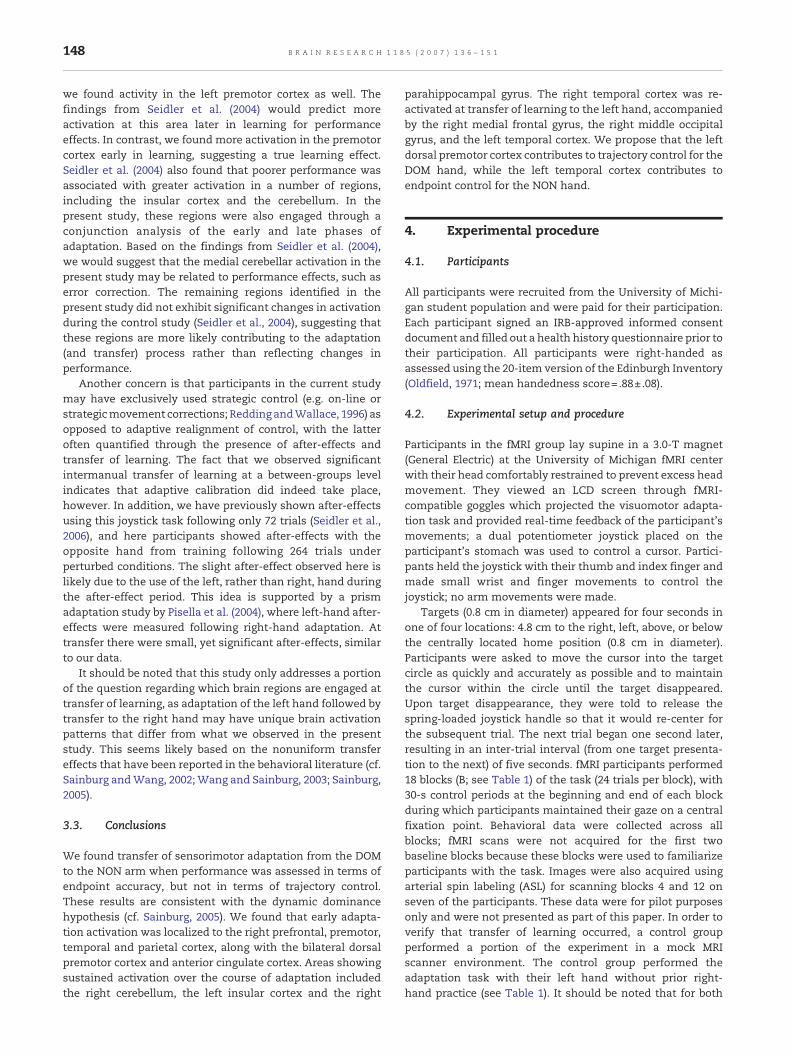
Table 8 – Regions associated with [B5>B3]>[B14>B2]
Anatomiclocation
BA Coordinatesof peak
Pseudot score
L IPL 40 −38, −50, 52 5.6
BA=Brodmann area; IPL=inferior parietal lobule.
147B R A I N R E S E A R C H 1 1 8 5 ( 2 0 0 7 ) 1 3 6 – 1 5 1
DOM to NON arm. Support for this model would involveunilateral activation at transfer which does not overlap withactivation observed during the adaptation period. This modelwould also allow for nonlateralized control of movement, sothat left-hand use could engage similar regions within the lefthemisphere that would also be activated with right-handusage. We hypothesize that access of a stored representationvia the corpus callosumwould produce brain activation in thestorage site that is equal to or less than the activation of thestorage site for direct hand control, supporting the unilateralactivation prediction at transfer. Our data provide mixedsupport for this model, as we observed activation at transferthat did not overlap with areas that were engaged during theadaptation period, as well as activation within the non-dominant hemisphere during the adaptation period. Basedon our findings, we propose that NON arm endpoint control islocalized to the temporal cortex, and DOM arm trajectorycontrol is achieved by the left dorsal premotor cortex.
An issue regarding the modified (callosal) access modelinvolves how different types of information stored in separatehemispheres could be effectively used for the DOM conditionbut not at transfer. Sainburg's dynamic dominance hypothesis(Sainburg, 2002) states that the essential difference betweenDOM and NON arm coordination is the facility in governingcontrol over limb dynamics. Each controller uses learnedinformation differently, depending on its unique proficiencyfor controlling specific features of movement. For example,endpoint errors for DOM arm movements were either equallyaccurate to, or slightly less accurate than those of theNONarm(Sainburg and Kalakanis, 2000; Sainburg, 2002; Bagesteiro andSainburg, 2002), evenwith theNONhand controller beingmoreadept at specifying endpoint position. Thus while the infor-mation may be available to each limb, the ability to use thisinformation is dependent upon each limb's ability to controlspecific features of movement.
The proficiency model (Laszlo et al., 1970) predicts theformation of engrams which are stored contralaterally to thetrained hand. In their study, there was no transfer ofperformance improvements from the DOM to the NON hand;however, transfer was observed from the NON to DOM hand(Laszlo et al., 1970). These authors describe the transfer oflearning that they observed as being ‘unidirectional’, as it wasonly observed from NON to DOM. Findings from severalstudies (Grafton et al., 1998; van Mier et al., 1998), includingthe present study, do not support this model as we observed atransfer of learning effect for the left hand (i.e. overlappingactivation for learning and transfer) as well as bilateralactivation that did not overlap areas engaged during theadaptation period.
Table 7 – Regions associated with after-effects ofadaptation
Anatomiclocation
BA Coordinatesof peak
Pseudot score
L STG 22 −57, −36, 9 5.4R Cuneus 19 10, −74, 35 5.3
BA=Brodmann area; STG=superior temporal gyrus.
The cross-activation model (Parlow and Kinsbourne, 1989)predicts the formation of dual engrams in each hemispherefollowingDOMhand training. At transfer, theNONhandwouldhave access to a separate, yet inferior,motor program found inthe non-dominant hemisphere which would be reflectedthrough unilateral activation that does not overlap withactivation observed during the adaptation period. Accordingto these authors, this motor program would reflect the non-dominant hemisphere's ‘inferior’ interpretation of the infor-mation obtained from the dominant hemisphere, as eachhemisphere's proficiency for specifying particular features ofmovement are not congruent. In their study, there was abehavioral transfer effect from the DOM to NON hand. Ourbehavioral findings support this model, as we observed abetween group transfer of learning effect from the right to lefthand. With regards to the predicted activation at transfer forthis model, Parlow and Kinsbourne suggest that the non-dominant motor cortex uses this ‘inferior’ motor programindependently from thedominantmotor cortexwhen thenon-dominant hand is required to perform the practiced task. Attransfer, we observed brain activation within both hemi-spheres, which did not overlap with activation from theadaptation period. It may be that the lack of overlappingactivation at transfermay reflect no observable fMRI activationfor the formation of the inferior motor program. However, wedo not believe this to be the case, as the left temporal cortexshowed an activation pattern that was independent of thehand being used.While such activation is not predicted by thisparticular model, our finding of additional areas engaged attransfer (right medial frontal gyrus and right middle temporalgyrus) does fit with this theory.
A potential concern regarding the results in this studyinvolves the changes in kinematics that occurred during theadaptation period and at transfer, as the reported neuralactivations may be associated with adaptive processes orthey may simply reflect the change in kinematics (e.g.reduced error rates and movement times) at these periods(cf. Seidler et al., 2002). We addressed this issue by havingparticipants perform a control experiment in the context ofthe task used in the present study (Seidler et al., 2004). Thiscontrol experiment involved inducing performance changesin the absence of learning by having subjects move a joystickto hit targets of differing sizes in a counter balanced fashionusing a block design. The variations in target size inducedchanges in the magnitude of corrective movements and theoverall movement durations as typically occur duringadaptation.
In this control study (Seidler et al., 2004), we found thatbetter performance (movements to larger targets) was associ-ated with greater activation at the left premotor cortex (BA 6),left sensorimotor cortex, left inferior frontal gyrus, left insularcortex, left putamen, and right caudate. In the present study,
148 B R A I N R E S E A R C H 1 1 8 5 ( 2 0 0 7 ) 1 3 6 – 1 5 1
we found activity in the left premotor cortex as well. Thefindings from Seidler et al. (2004) would predict moreactivation at this area later in learning for performanceeffects. In contrast, we found more activation in the premotorcortex early in learning, suggesting a true learning effect.Seidler et al. (2004) also found that poorer performance wasassociated with greater activation in a number of regions,including the insular cortex and the cerebellum. In thepresent study, these regions were also engaged through aconjunction analysis of the early and late phases ofadaptation. Based on the findings from Seidler et al. (2004),we would suggest that the medial cerebellar activation in thepresent study may be related to performance effects, such aserror correction. The remaining regions identified in thepresent study did not exhibit significant changes in activationduring the control study (Seidler et al., 2004), suggesting thatthese regions are more likely contributing to the adaptation(and transfer) process rather than reflecting changes inperformance.
Another concern is that participants in the current studymay have exclusively used strategic control (e.g. on-line orstrategicmovement corrections; Redding andWallace, 1996) asopposed to adaptive realignment of control, with the latteroften quantified through the presence of after-effects andtransfer of learning. The fact that we observed significantintermanual transfer of learning at a between-groups levelindicates that adaptive calibration did indeed take place,however. In addition, we have previously shown after-effectsusing this joystick task following only 72 trials (Seidler et al.,2006), and here participants showed after-effects with theopposite hand from training following 264 trials underperturbed conditions. The slight after-effect observed here islikely due to the use of the left, rather than right, hand duringthe after-effect period. This idea is supported by a prismadaptation study by Pisella et al. (2004), where left-hand after-effects were measured following right-hand adaptation. Attransfer there were small, yet significant after-effects, similarto our data.
It should be noted that this study only addresses a portionof the question regarding which brain regions are engaged attransfer of learning, as adaptation of the left hand followed bytransfer to the right hand may have unique brain activationpatterns that differ from what we observed in the presentstudy. This seems likely based on the nonuniform transfereffects that have been reported in the behavioral literature (cf.Sainburg andWang, 2002; Wang and Sainburg, 2003; Sainburg,2005).
3.3. Conclusions
We found transfer of sensorimotor adaptation from the DOMto the NON arm when performance was assessed in terms ofendpoint accuracy, but not in terms of trajectory control.These results are consistent with the dynamic dominancehypothesis (cf. Sainburg, 2005). We found that early adapta-tion activation was localized to the right prefrontal, premotor,temporal and parietal cortex, along with the bilateral dorsalpremotor cortex and anterior cingulate cortex. Areas showingsustained activation over the course of adaptation includedthe right cerebellum, the left insular cortex and the right
parahippocampal gyrus. The right temporal cortex was re-activated at transfer of learning to the left hand, accompaniedby the right medial frontal gyrus, the right middle occipitalgyrus, and the left temporal cortex. We propose that the leftdorsal premotor cortex contributes to trajectory control for theDOM hand, while the left temporal cortex contributes toendpoint control for the NON hand.
4. Experimental procedure
4.1. Participants
All participants were recruited from the University of Michi-gan student population and were paid for their participation.Each participant signed an IRB-approved informed consentdocument and filled out a health history questionnaire prior totheir participation. All participants were right-handed asassessed using the 20-item version of the Edinburgh Inventory(Oldfield, 1971; mean handedness score=.88±.08).
4.2. Experimental setup and procedure
Participants in the fMRI group lay supine in a 3.0-T magnet(General Electric) at the University of Michigan fMRI centerwith their head comfortably restrained to prevent excess headmovement. They viewed an LCD screen through fMRI-compatible goggles which projected the visuomotor adapta-tion task and provided real-time feedback of the participant'smovements; a dual potentiometer joystick placed on theparticipant's stomach was used to control a cursor. Partici-pants held the joystick with their thumb and index finger andmade small wrist and finger movements to control thejoystick; no arm movements were made.
Targets (0.8 cm in diameter) appeared for four seconds inone of four locations: 4.8 cm to the right, left, above, or belowthe centrally located home position (0.8 cm in diameter).Participants were asked to move the cursor into the targetcircle as quickly and accurately as possible and to maintainthe cursor within the circle until the target disappeared.Upon target disappearance, they were told to release thespring-loaded joystick handle so that it would re-center forthe subsequent trial. The next trial began one second later,resulting in an inter-trial interval (from one target presenta-tion to the next) of five seconds. fMRI participants performed18 blocks (B; see Table 1) of the task (24 trials per block), with30-s control periods at the beginning and end of each blockduring which participants maintained their gaze on a centralfixation point. Behavioral data were collected across allblocks; fMRI scans were not acquired for the first twobaseline blocks because these blocks were used to familiarizeparticipants with the task. Images were also acquired usingarterial spin labeling (ASL) for scanning blocks 4 and 12 onseven of the participants. These data were for pilot purposesonly and were not presented as part of this paper. In order toverify that transfer of learning occurred, a control groupperformed a portion of the experiment in a mock MRIscanner environment. The control group performed theadaptation task with their left hand without prior right-hand practice (see Table 1). It should be noted that for both
149B R A I N R E S E A R C H 1 1 8 5 ( 2 0 0 7 ) 1 3 6 – 1 5 1
groups, there was only one ‘transfer’ block due to the fleetingnature of the transfer of learning effect (i.e., performancechanges with practice at the task, obliterating the transfereffects).
4.3. fMRI acquisition parameters
Functional images were acquired using a single-shot gradient-echo reverse spiral pulse sequence (Bornert et al., 2000). Thefield of view was 220 × 220 mm, voxel size was3.2×3.2×3.2 mm, TR (repeat time to accomplish a full volume)was 2 s, and TE (echo time) was 30 ms. Forty axial slices wereacquired, encompassing the whole brain, including thecerebellum. Structural images were acquired using a T1-weighted gradient echo pulse sequence (TE/TR/FA=3.7 ms/250 ms/90°) with a field of view of 220×220 mm, voxelsize=0.86 mm×0.86 mm×3.2 mm.
4.4. Behavioral data processing
The X and Y coordinates from the joystick were recorded at arate of 100 Hz. We analyzed the joystick data offline usingcustom Labview 6.1 software (National Instruments) to trackbehavioral changes with learning. We first filtered the datawith a dual lowpass Butterworth digital filter (cf.Winter, 1990),using a cutoff frequency of 10 Hz. The resultant joystick pathwas calculated by computing the square root of the sum of thesquared X and Y coordinate data at each time point. Thetangential velocity profile was then calculated through differ-entiation. Movement onset and offset were computed throughthe application of the optimal algorithm of Teasdale et al.(1993) to the velocity profile for each movement. We used twomeasures to assess learning: direction error (DE; the anglebetween a straight line from the start to the target position anda line from the start to the position at peak velocity) and initialendpoint error (IEE; the distance from the end of the initialballistic movement position to the target). See Fig. 2 forillustration of these two variables. IEE, rather than final end-point error, was used for parsimony with the work fromSainburg's group. IEE is equivalent to their ‘final position accu-racy’ as their subjects were not allowed to make correctivemovements after the first ballistic movement towards thetarget (personal communication).
A block×trial RM ANOVA was performed for each mea-sure to evaluate performance differences across all blocks forthe fMRI participants. We used a group×block×trial mixedmodel ANOVA to compare performance between the fMRIand control groups. Significant interactions were followed upwith simple contrasts. The Huynh–Feldt epsilon (Huynh andFeldt, 1970) was evaluated to determine whether therepeated measures data met the assumption of sphericity(Σ>0.75).
4.5. fMRI data processing
The first three volumes of each block were discarded to allowthe MRI signal to reach its steady state. We performedmovement correction for excessive head motion using theAutomated Image Registration (AIR) package (Woods et al.,1998). The results were evaluated to ensure that participants
did not show head motion greater than 5 mm during theexperiment. fMRI data were processed and analyzed usingStatistical Parametric Mapping 99 (SPM99) (Wellcome Depart-ment of Cognitive Neurology, London, UK) and statisticalnonparametric mapping (SnPM) (Nichols and Holmes, 2002).Following the computation of a mean functional image foreach participant, a structural image was coregistered to thisimage and spatially normalized to the Montreal NeurologicalInstitute (MNI) template (Evans et al., 1994). These imageswere then spatially smoothed with a Gaussian kernel with afull width at half maximum (FWHM) of 6 mm.
We created boxcar models time-locked to the effect ofinterest and convolved with an estimate of the canonicalhemodynamic response function. Analyseswere performed atthe single participant level through SPM99 to determineregions activated in association with task performance. Thesingle-participant contrast images were then taken to asecond-level analysis using SnPM for group analysis tocalculate pseudo t statistics, using the following parameters:maximum number of permutations (2048), variance smooth-ing at FWHM=6 mm, and threshold correction at p<0.05(pseudo t=4.56). SnPM, rather than SPM99, was employed forthe group analysis because the use of weighted locally pooledvariance estimates (variance smoothing) makes the non-parametric approach considerably more powerful than con-ventional parametric approaches, as used in SPM99. Further-more, the non-parametric approach is always valid, given onlyminimal assumptions.We applied a nonlinear transformationto convert the data from MNI coordinates to Talairach space(Talairach and Tournoux, 1988) (see http://www.mrc-cbu.cam.ac.uk/Imaging/). Significant areas of activation were thenlocalized using this atlas, with medial motor areas identifiedas in Picard and Strick (1996) and cerebellar regions as inSchmahmann et al. (2000). We plotted the percent signalchange from baseline and averaged across each block for allscanning blocks within areas identified by each contrast foreach participant for illustrative purposes. This function wascalculated using data from the single voxel exhibiting the peakactivation for each cluster. This was done by computing themeanmagnitude of activation for the control period using theaverage magnitude of activation during the control periodprior to the task aswell as the averagemagnitude of activationduring the control period following the task. Thismean controlperiod activation was subtracted from themeanmagnitude ofactivation during the task period, and this value was thendivided by themean control period activation and changed to apercentile.
4.6. fMRI contrasts – early and late adaptation
We designed two different contrasts to examine the earlyadaptation period (see Table 2). The first contrast (noveltycontrast) searched for regions of statistically greater activationat the first adaptation block (B3) versus the baseline DOMblock (B1). The second contrast (early exponential) evaluatedthe adaptation period (B3–B13) using an exponential functionto search for regions which showed a steady decline in ac-tivation over this period, as this function provided the best fitof group learning compared with linear, power, and logarith-mic functions. The exponential fit provided weights for said
150 B R A I N R E S E A R C H 1 1 8 5 ( 2 0 0 7 ) 1 3 6 – 1 5 1
blocks of 5.95, 2.51, 0.54, −0.57, −1.21, −1.57, −1.78, −1.90, and−1.97 (with weighted values for B4 and B12 not included in theanalysis for the seven participants in whom arterial spinlabeling data were acquired at these blocks), respectively. Weused the same exponential function, with the weights re-versed (late exponential), as well as a second contrast (adapted)which examined greater activation at the final adaptationblock (B13) versus the first adaptation block (B3), to deter-mine regions contributing to late adaptation (see Table 2). Inaddition, we performed a conjunction analysis between theactivation at the first adaptation block and the last adapta-tion block to establish which brain regions are in commonfor both early and late adaptation (conjunction early–late; seeTable 2).
4.7. fMRI contrasts – transfer of learning and after-effects
We used multiple contrasts to define brain regions associatedwith transfer of adaptation (see Table 2). The first (transfer 1)searched for regions showing greater activation at thetransfer block (B14) than the final non-rotated left-handblock (B16). The second contrast (transfer 2) searched forregions showing greater activation at B14 versus the baselineNON block (B2). We also performed a conjunction analysisbetween each early adaptation contrast (B3>B1 and earlyexponential) and activation at the transfer block (B14) toestablish areas equally engaged at transfer and early adap-tation (conjunction early–transfer 1 and 2). Another conjunctionanalysis was performed between each late adaptation con-trast (B13>B3 and late exponential) and activation at thetransfer block (B14) to establish areas equally engaged attransfer and late adaptation (conjunction late–transfer 1 and 2).We also tested the transfer effect by searching for regionsshowing greater activation at transfer versus early adaptation(transfer 2>novelty), and vice versa (novelty> transfer 2; seeTable 2).
Magnitude of transfer achieved by each subject wasquantified by calculating each participant's DE and IEE per-formance at B14 minus B3 for the average of the first threetrials for each block.We then tested for brain regions sensitiveto individual differences in the amount of transfer with aregression of activation at the transfer block against theaforementioned calculated difference in performance (DEregression, IEE regression).
We designed two contrasts to define brain regions specificto participants using their left hand following the adaptationperiod on non-rotated blocks (after-effects). The first searchedfor regions showing greater activation at B15 than B14 (after-effect 1). The second contrast searched for regions showinggreater activation at B15 than the baseline NON block (B2)(after-effect 2).
Acknowledgments
This work was supported by NIH AG024106 and AG08808 (UMClaude D. Pepper OAIC Research Career Development Core).We thank A. Savine, A. Shah, and C. Tcruz for their assistancewith data collection and analyses, K. Newnham for his
expertise in data collection, and T. Nichols for his assistancewith the SnPM analyses.
R E F E R E N C E S
Bagesteiro, L.B., Sainburg, R.L., 2002. Handedness, dominant armadvantages in control of limb dynamics. J. Neurophysiol. 88,2408–2421.
Bock, O., 1992. Adaptation of aimed arm movements tosensorimotor discordance, evidence for direction-independentgain control. Behav. Brain Res. 51 (1), 41–50.
Bornert, P., Aldefeld, B., Eggers, H., 2000. Reversed spiral MRimaging. Magn. Reson. Med. 44, 479–484.
Botvinick, M., Nystrom, L.E., Fissel, K., Carter, C.S., Cohen, J.D.,1999. Conflict monitoring versus selection-for-action inanterior cingulate cortex. Nature 402, 179–181.
Carter, C.S., Braver, T.S., Barch, D.M., Botvinick, M.M., Noll, D.,Cohen, J.D., 1998. Anterior cingulate cortex, error detection, andthe online monitoring of performance. Science 280, 747–749.
Criscimagna-Hemminger, S.E., Donchin, O., Gazzaniga, M.S.,Shadmehr, R., 2003. Learned dynamics of reaching movementsgeneralize from dominant to nondominant arm.J. Neurophysiol. 89, 168–176.
Clower, D.M., Hoffman, J.M., Votaw, J.R., Faber, T.L., Woods, R.P.,Alexander, G.E., 1996. Role of posterior parietal cortex in therecalibration of visually guided reaching. Nature 383, 618–621.
Contreras-Vidal, J.L., Kerick, S.E., 2004. Independent componentanalysis of dynamic brain responses during visuomotoradaptation. NeuroImage 21, 936–945.
Della-Maggiore, V., McIntosh, A.R., 2005. Time course of changes inbrain activity and functional connectivity associated withlong-term adaptation to a rotational transformation.J. Neurophysiol. 93, 2252–2262.
Evans, A.C., Kamber, M., Collins, D.L., Macdonald, D., 1994.AnMRI-based probabilistic atlas of neuroanatomy. In: Shorvon,S., Fish, D., Andermann, F., Bydder, G.M., Stefan, H. (Eds.),Magnetic Resonance Scanning andEpilepsy. NATOASI SeriesA,Life Sciences, vol. 264. Plenum, NY, pp. 263–274.
Gehring, W.J., Knight, R.T., 2000. Prefrontal–cingulate interactionsin action monitoring. Nat. Neurosci. 3, 516–520.
Gehring, W.J., Goss, B., Coles, M.G.H., Meyer, D.E., Donchin, D.,1993. A neural system for error detection and compensation.Psychol. Sci. 4, 385–390.
Ghilardi, M., Ghez, C., Dhawan, V., Moeller, J., Mentis, M.,Nakamura, T., Antonini, A., Eidelberg, D., 2000. Patterns ofregional brain activation associated with different forms ofmotor learning. Brain Res. 871, 127–145.
Grafton, S.T., Hazeltine, E., Ivry, R.B., 1998. Abstract andeffector-specific representations ofmotor sequences identifiedwith PET. J. Neurosci. 18, 9420–9428.
Grafton, S.T., Hazeltine, E., Ivry, R.B., 2002.Motor sequence learningwith the nondominant left hand: a PET functional imagingstudy. Exp. Brain Res. 146, 369–378.
Graydon, F.X., Friston, K.J., Thomas, C.G., Brooks, V.B., Menon, R.S.,2005. Learning-related fMRI activation associated with arotational visuo-motor transformation. Brain Res. Cogn. BrainRes. 22, 373–383.
Halsband, U., 1992. Left hemisphere preponderance in trajectoriallearning. NeuroReport 3, 397–400.
Huynh, H., Feldt, L.S., 1970. Conditions under which the meansquare ratios in repeated measures designs have exactF-distributions. J. Am. Stat. Assoc. 65, 1582–1589.
Imamizu, H., Miyauchi, S., Tamada, T., Sasaki, Y., Takino, R., Putz,B., Yoshioka, T., Kawato, M., 2000. Human cerebellar activityreflecting an acquired internal model of a new tool. Nature 403,192–195.
151B R A I N R E S E A R C H 1 1 8 5 ( 2 0 0 7 ) 1 3 6 – 1 5 1
Inoue, K., Kawashima, R., Satoh, K., Kinomura, S., Goto, R., Sugiura,M., Ito, M., Fukuda, H., 1997. Activity in the parietal area duringvisuomotor learning with optical rotation. NeuroReport 18,3979–3983.
Inoue, K., Kawashima, R., Satoh, K., Kinomura, S., Sugiura, M.,Goto, R., Ito, M., Fukuda, H., 2000. A PET study of visuomotorlearning under optical rotation. NeuroImage 11, 505–516.
Krakauer, J.W., Ghilardi, M.F., Mentis, M., Barnes, A.,Veytsman, M., Eidelberg, D., Ghez, C., 2004. Differentialcortical and subcortical activations in learning rotations andgains for reaching, a PET study. J. Neurophysiol. 91,924–933.
Laszlo, J.I., Baguley, R.A., Bairstow, P.J., 1970. Bilateral transfer intapping skill in the absence of peripheral information. J. Mot.Behav. 2, 261–271.
Lee, J.H., van Donkelaar, P., 2006. The human dorsal premotorcortex generates on-line error corrections during sensorimotoradaptation. J. Neurosci. 26 (12), 3330–3334.
Liepmann, H., 1905. Die linke Hemisphäre und das Handeln.Münch. Med. Wochenschr. 49, 2375–2378.
Malach, R., Reppas, J.B., Benson, R.R., Kwong, K.K., Jiang, H.,Kennedy, W.A., Ledden, P.J., Brady, T.J., Rosen, P.R., Tootell,R.B.H., 1995. Object-related activity revealed by functionalmagnetic resonance imaging in the human occipital cortex.Proc. Natl. Acad. Sci. U. S. A. 92, 8135–8139.
Maquet, P., Schwartz, S., Passingham, R., Frith, C., 2003.Sleep-related consolidation of a visuomotor skill, brainmechanisms as assessed by functional magnetic resonanceimaging. J. Neurosci. 23, 1432–1440.
Matthews, S.C., Simmons, A.N., Arce, E., Paulus, M.P., 2005.Dissociation of inhibition from error processing using aparametric inhibitory task during functional magneticresonance imaging. NeuroReport 16 (7), 755–760.
Miall, R.C., Reckess, G.Z., Imamizu, H., 2001. The cerebellumcoordinates eye and hand tracking movements. Nat. Neurosci.4, 638–644.
Nezafat, R., Shadmehr, R., Holcomb, H.H., 2001. Long-termadaptation to dynamics of reaching movements, a PET study.Exp. Brain Res. 140 (1), 66–76.
Nichols, T.E., Holmes, A.P., 2002. Nonparametric permutation testsfor functional neuroimaging, a primer with examples.Hum. Brain Mapp. 15, 1–25.
Oldfield, R.C., 1971. The assessment and analysis of handedness,the Edinburgh Inventory. Neuropsychologia 9, 97–113.
Owen, A.M., Milner, B., Petrides, M., Evans, A.C., 1996. Memoryfor object features versus memory for object location,a positron-emission tomography study of encoding andretrieval processes. Proc. Natl. Acad. Sci. U. S. A. 93,9212–9217.
Parlow, S.E., Dewey, D., 1991. The temporal locus of transfer oftraining between hands, an interference study. Behav. BrainRes. 46, 1–8.
Parlow, S.E., Kinsbourne, M., 1989. Asymmetrical transfer oftraining between hands, implications for interhemisphericcommunication in normal brain. Brain Cogn. 11, 98–113.
Picard, N., Strick, P.L., 1996. Motor areas of the medial wall, areview of their location and functional activation. Cereb.Cortex 6, 342–353.
Pisella, L., Michel, C., Grea, H., Tilikete, C., Vighetto, A., Rossetti, Y.,2004. Preserved prism adaptation in bilateral optic ataxia:strategic versus adaptive reaction to prisms. Exp. Brain Res. 156(4), 399–408.
Pine, Z.M., Krakauer, J.W., Gordon, J., Ghez, C., 1996. Learning ofscaling factors and reference axes for reaching movements.NeuroReport 7, 2357–2361.
Praeg, E., Herwig, U., Lutz, K., Jancke, L., 2005. The role of theright dorsal premotor cortex in visuomotor learning: atranscranial magnetic stimulation study. NeuroReport 16 (15),1715–1718.
Redding, G.M., Wallace, B., 1996. Adaptive spatial alignment andstrategic perceptual–motor control. J. Exp. Psychol. Hum.Percept. Perform. 22 (2), 379–394.
Sainburg, R.L., 2002. Evidence for a dynamic-dominancehypothesis of handedness. Exp. Brain Res. 142, 241–258.
Sainburg, R.L., 2005. Handedness, differential specializations forcontrol of trajectory and position. Exerc. Sport Sci. Rev. 33,206–213.
Sainburg, R.L., Kalakanis, D., 2000. Differences in control of limbdynamics during dominant and nondominant arm reaching.J. Neurophysiol. 83, 2661–2675.
Sainburg, R.L., Wang, J., 2002. Interlimb transfer of visuomotorrotations, independence of direction and final error positioninformation. Exp. Brain Res. 145, 437–447.
Schmahmann, J.D., Doyon, J., Toga, A., Evans, A., Petrides, M., 2000.MRI Atlas of the Human Cerebellum. Academic Press, San Diego.
Schulze, K., Luders, E., Jancke, L., 2002. Intermanual transfer in asimple motor task. Cortex 38, 805–815.
Serrien, D.J., Ivry, R.B., Swinnen, S., 2006. Dynamics of hemisphericspecialization and integration in the context of motor control.Nat. Neurosci. 7, 160–167.
Seidler, R.D., Purushotham, A., Kim, S.G., Ugurbil, K., Willingham,D., Ashe, J., 2002. Cerebellum activation associated withperformance change but not motor learning. Science 296(5575), 2043–2046.
Seidler, R.D., Noll, D.C., Thiers, G., 2004. Feedforward andfeedback processes in motor control. NeuroImage 22 (4),1775–1783.
Seidler, R.D., Noll, D.C., Chintalapati, P., 2006. Bilateral basalganglia activation associated with sensorimotor adaptation.Exp. Brain Res. 175 (3), 544–555.
Shadmehr, R., Mussa-Ivaldi, F.A., 1994. Adaptive representation ofdynamics during learning of a motor task. J. Neurosci. 14,3208–3224.
Talairach, J., Tournoux, P., 1988. Co-Planar Stereotaxic Atlas of theHuman Brain. 3-Dimensional Proportional System, AnApproach to Cerebral Imaging (Translated by Mark Rayport).Thieme, NY.
Taylor, H.G., Heilman, K.M., 1980. Left-hemisphere motordominance in right-handers. Cortex 16, 587–603.
Teasdale, N., Bard, C., Fleury, M., Young, D., Proteau, L., 1993.Determining movement onsets from temporal series. J. Mot.Behav. 25, 97–106.
Teixeira, L.A., 2000. Timing and force components in bilateraltransfer of learning. Brain Cogn. 44 (3), 455–469.
van Mier, H., Tempel, L.W., Perlmutter, J.S., Raichle, M.E., Petersen,S.E., 1998. Changes in brain activity during motor learningmeasured with PET, effects of hand of performance andpractice. J. Neurophysiol. 80, 2177–2199.
Wang, J., Sainburg, R.L., 2003. Mechanisms underlying interlimbtransfer of visuomotor rotations. Exp. Brain Res. 149 (4),520–526.
Wang, J., Sainburg, R.L., 2004. Interlimb transfer of novel inertialdynamics is asymmetrical. J. Neurophysiol. 92, 349–360.
Welch, R.B., Choe, C.S., Heinrich, D.R., 1974. Evidence for athree-component model of prism adaptation. J. Exp.Psychol. 103 (4), 700–705.
Wheeler, M.E., Petersen, S.E., Buckner, R.L., 2000. Memory's echo,vivid remembering reactivates sensory-specific cortex. Proc.Natl. Acad. Sci. U. S. A. 97, 11125–11129.
Winter, D.A., 1990. Biomechanics and Motor Control of HumanMovement, 2nd ed. John Wiley & Sons.
Woods, R.P., Grafton, S.T., Holmes, C.J., Cherry, S.R., Mazziotta, J.C.,1998. Automated image registration: I. General methods andintraparticipant registration. J. Comput. Assist. Tomogr. 22,139–152.
Yeung, N., Cohen, J.D., Botvinick, M.M., 2004. The neural basis oferror detection: conflict monitoring and error-relatednegativity. Psychol. Rev. 111, 931–959.