Embed Size (px)
Citation preview
Electronic copy available at: http://ssrn.com/abstract=958158
Networks, Information and Brokerage: The Diversity–Bandwidth Tradeoff
Sinan Aral, New York University, Stern School of Business
Marshall Van Alstyne, Boston University, School of Management
Draft Version: September 15, 2010 First Draft: December 15, 2006
DRAFT – COMMENTS WELCOME
* We are grateful to Lada Adamic, Wayne Baker, Erik Brynjolfsson, Ron Burt, Paul Carlile, Emilio Castilla, Jerry Davis, Stine Grodal, Michael Macy, Erol Pekoz, Damon Phillips, Arun Sundararajan, Ezra Zuckerman and seminar participants at the Workshop on Information Systems Economics, the Sunbelt Social Networks Conference, the International Conference on Network Science, the Academy of Management Conference, Harvard, NYU, MIT, Stanford and the University of Chicago for valuable comments, and to the National Science Foundation (Career Awards IIS-9876233 and IIS-0953832 and grant IIS-0085725), Microsoft, Cisco Systems, France Telecom and the MIT Center for Digital Business for generous funding. We thank Tim Choe, Petch Manoharn, Lev Muchnik, Cyrus-Charles Weaver and Jun Zhang for their tireless research assistance.
Electronic copy available at: http://ssrn.com/abstract=958158
1
Networks, Information and Brokerage: The Diversity–Bandwidth Tradeoff
Abstract
The authors propose that a tradeoff between network diversity and communications bandwidth
regulates the degree to which social networks deliver non-redundant information to actors in bro-
kerage positions. As the structural diversity of a network increases, the bandwidth of the commu-
nication channels in that network decrease, creating countervailing effects on the receipt of novel
information. This tradeoff occurs because more diverse networks, presumed to provide more in-
formation novelty, typically contain weaker ties across which less novel information flows due to
limited interaction. Information advantages to brokerage positions then depend on (a) whether the
information overlap among alters is small enough to justify bridging structural holes, (b) whether
the size of the topic space known to alters is large enough to consistently provide novelty, and (c)
whether the knowledge stock of alters refreshes enough over time to justify updating what was
previously known. The authors test these arguments by combining social network and perform-
ance data with direct observation of the information content flowing through email at a medium
sized executive recruiting firm. They find that brokers with bridging ties to disparate parts of a
social network can have disadvantaged access to novel information because their lower band-
width communication curbs the total volume of novelty they receive. These analyses unpack the
mechanisms that enable information advantages in networks and serve as ‘proof-of-concept’ for
using email content data to analyze relationships among information flows, networks and social
capital.
Keywords: Social Networks, Social Capital, Information Content, Information Diversity, Network Size, Network Diversity, Performance, Productivity, Information Work.
Electronic copy available at: http://ssrn.com/abstract=958158
2
Where does one find novel information? Most modern sociological theory suggests that we find
novelty through weak ties that span structural holes. A more precise question, however, is where does
anyone find the most novel information per unit time? That is, at what rate do we receive novelty from
our different social contacts? We should get information with greater novelty from across a structural hole
but at a slower rate because interactions with bridging ties are weak, infrequent, and lower bandwidth. On
the other hand, we should get information with less novelty from a cohesive embedded tie but at a faster
rate because the tie is stronger, the interaction more frequent, and the bandwidth higher. Contrary to con-
ventional wisdom, the second tie could provide greater total novelty over time than the first. Since strong
high bandwidth ties are more likely in cohesive networks, while weak low bandwidth ties are more likely
in sparse networks, the two factors affecting the rate at which we find novel information – structural di-
versity and channel bandwidth – are likely to tradeoff, creating countervailing effects on access to novel
information. We develop a theory of this tradeoff and contingencies of social structure and information
environments that affect access to novelty. We then test this theory on observed information content flow-
ing through organizational email networks. Results suggest that information benefits to brokerage depend
on the information environments in which brokers find themselves and that sociology should embrace a
more nuanced view of how information flows in social networks.
THE DIVERISTY-BANDWIDTH TRADEOFF
The assumption that network structure influences the distribution of information and knowledge
in social groups (and thus characteristics of the information to which individuals have access) underpins a
significant amount of theory linking social structure to a variety of outcomes such as wages, job place-
ment, promotion, creativity, innovation, political success, social support, productivity and performance
(Simmel 1922 (1955), Moreno 1940, Granovetter 1973, Baker 1990, Burt 1992, 2004, Padgett and Ansell
1993, Uzzi 1996, 1997, Podolny 2001, Reagans and Zuckerman 2001, Hansen 1999, 2002, Aral et. al.
2006, 2007). The central argument in this body of theory is that structurally diverse networks – networks
low in cohesion and structural equivalence and rich in structural holes – provide access to diverse, novel

3
information. Contacts maintained through weak ties are typically unconnected to other contacts and there-
fore more likely to “move in circles different from our own and thus [to] have access to information dif-
ferent from that which we receive…” (Granovetter 1973: 1371) These ties are “the channels through
which ideas, influence, or information socially distant from ego may reach him.” (Granovetter 1973:
1371) As Burt (1992: 16) argues “everything else constant, a large, diverse network is the best guarantee
of having a contact present where useful information is aired…” Since information in local network
neighborhoods tends to be redundant, structurally diverse contacts that reach across structural holes
should provide channels through which novel information flows to individuals from distinct pools of so-
cial activity (Burt 1992).
Networks rich in structural diversity are thought to confer “information benefits” or “vision ad-
vantages” by providing access to diverse and novel perspectives, ideas and information (Burt 1992).
Novel information is thought to be valuable due to its local scarcity. Actors with scarce, novel informa-
tion in a given network neighborhood are better positioned to broker opportunities, make better decisions,
or apply information to problems that are intractable given local knowledge. Exposure to diverse ideas,
perspectives, and solutions is thought to enable arbitrage, innovation, and access to opportunity (e.g. Har-
gadon and Sutton 1997, Reagans and Zuckerman 2001, Burt 2004a, Rodan and Gallunic 2004, Van Al-
styne and Brynjolfsson 2005, Lazer and Friedman 2007). Hargadon and Sutton (1997) describe how en-
gineers use their structural positions between diverse engineering and scientific disciplines to broker the
flow of information from unconnected industrial sectors, creating novel design solutions. As Burt (2004b)
puts it, “creativity is an import-export game,… not a creation game.” Access to novel information should
increase the breadth of individuals’ absorptive capacity, strengthen the ability to communicate ideas
across a broader range of topics to a broader audience, and improve persuasion and the ability to generate
broader support from subject matter experts (Cohen and Levinthal 1990, Simon 1991, Reagans and McE-
vily 2003, Rodan and Galunic 2004). The value of information in a network stems from its uneven distri-
bution across actors and resides in pockets of distinct and diverse pools of information and expertise in
socially distant network neighborhoods. Actors with access to these diverse pools “benefit from dispari-

4
ties in the level and value of particular knowledge held by different groups…” (Hargadon and Sutton
1997: 717), and one of the key mechanisms through which diverse network structures are theorized to
improve performance is through access to novel information (Burt 1992).
These are the central inferences on which structural theories of brokerage and the strength of
weak ties rest, and it is therefore intuitive to expect that having structurally diverse networks – networks
low in cohesion and structural equivalence and rich in structural holes – is positively associated with re-
ceiving more diverse information and more total non-redundant information, and that access to more di-
verse information and more total non-redundant information is positively associated with individual per-
formance.1 Over the last four decades, these two inferences have guided the way sociologists think about
information flow in networks and motivated and informed thousands of empirical studies examining in-
novation (Hargadon and Sutton 1997, Burt 2004), academic output (Swedberg 1990), team performance
(Regans and Zuckerman 2001), the formation of industry structures (Kogut, Walker and Shan 1997), the
success of social movements (Centola and Macy 2007), labor market outcomes (Montgomery 1991) and
beyond.
However, theoretical arguments linking network diversity to novel information have thus far fo-
cused almost exclusively on the relative diversity of the information received across different alters in a
network, rather than the diversity and volume of novel information flowing within each tie or channel
over time. Although dense, cohesive networks tend to deliver information that is redundant across chan-
nels (each alter providing the same or similar information), relationships in such networks are also typi-
cally stronger (Granovetter 1973, Burt 1992), implying greater frequency of interaction and richer infor-
mation flows. Metaphorically, such ties have greater channel bandwidth. In contrast, weak ties offer less
communication (Granovetter 1973, Burt 1992), and information should flow less frequently (Granovetter
1973), and with lower complexity and detail through them (Hansen 1999, Uzzi 1997).2 Two mechanisms
explain why socially distant weak ties should interact and communicate less – exposure and motivation.
As contacts interact more frequently, they are more likely to be exposed to and to spend time with each
others’ contacts in cohesive embedded networks (Granovetter 1973). This exposure creates opportunities

5
for interaction that are less likely if the individuals do not have contacts in common. Embeddedness also
creates motivation to interact with contacts that are closely connected to others we are connected to. So-
cial pressure, cognitive balance and the development of cooperative norms in embedded relationships in-
spire us to devote time and energy to communicating with embedded ties (Heider 1958, Newcomb 1961,
Granovetter 1973, 1985, 1992, Coleman 1988).3 In relationships among firms in New York’s apparel in-
dustry for example Uzzi (1997) reports that these types of ties were “non-repeated … one shot deals,” in
which communication occurred much less frequently, while embedded ties were characterized by “con-
stant communication.” Similar evidence has been found in R&D organizations (Allen 1977, Reagans and
Zuckerman 2001, Reagans and McEvily 2003), innovation labs (Hargadon and Sutton 1997), job seeking
(Granovetter 1973), familial relations (Coleman 1988) and in relationships between firms’ business units
(Hansen 1999) and across firms (Helper et al 2000). Given evidence on the prevalence of weak ties in
structurally diverse networks and the likelihood of increased information flow in cohesive networks due
to motivation and exposure, the bandwidth of communication channels should be lower in diverse net-
works. Thus, network diversity and channel bandwidth should tradeoff such that greater network diversity
is associated with lower channel bandwidth.
----- FIGURE 1 -----
All else equal, greater channel bandwidth should also provide access to more diverse information
and more total non-redundant information because interaction through rich high bandwidth channels tends
to be more detailed, to cover more topics, and to address more complex, interdependent concepts. While
unconnected alters may have different information, the amount of useful novel information delivered to
ego should increase as the volume of the information flow between contacts and the motivation to share
relevant novel information increase in cohesive networks. As Reagans and McEvily (2003: 262) argue, "it
is easier to transfer all kinds of knowledge [codified and tacit, simple and complex] in a strong tie and
more difficult to transfer all kinds … in a weak tie." If many interdependent ideas must be applied to-
gether, then throughput must increase to transfer them all. Perhaps most tellingly, the seminal work favor-
ing weak ties as a source of novel information foreshadows in a footnote that "one possible model would

6
expect information to flow through ties in proportion to time expended in interaction; this model would
predict much more information via strong ties." (Granovetter 1973: 1372) We consider how just such a
model can reform conventional wisdom regarding the relationship between social structure and access to
novel information.
SOCIAL PROCESSES AND ACCESS TO NOVEL INFORMATION
To carefully qualify the central inferences of brokerage theory and the strength of weak ties, we
examine the social processes that deliver novel information. While most current theories describe net-
works as channels, pipes, bridges or conduits (e.g. Podolny 2001, Centola and Macy 2007), characterize
content as mere "attributes of nodes" (e.g. Rodan & Galunic 2004), and implicitly assume that informa-
tion flows in proportion to the distribution of information in the network (e.g. Granovetter 1978, Schel-
ling 1978, Kleinberg, Kempe & Tardros 2003),4 information exchange is fundamentally a social process
and knowledge transfer is a discretionary activity (Reagans & McEvily 2003, Wu et. al. 2004). A connec-
tion to any individual affords the possibility of receiving their information, but by no means guarantees it.
As Wu et. al. (2004: 328) point out: “There are … differences between information flows and the spread
of viruses. While viruses tend to be indiscriminate, infecting any susceptible individual, information is
selective and passed by its host only to individuals the host thinks would be interested in it.” In competi-
tive settings, information is often withheld even when it is known to be of interest to others. Networks are
not simply pipes into different pools of information; they reflect the nature of the relationships, interac-
tions and information exchanges taking place among those they connect.
Although the channel, pipe, bridge or conduit metaphor is common in sociology, we do not mean
for terminology to hide restrictive assumptions about network structure preceding flow. Human interac-
tions define social network structure. So, to avoid problems with channel metaphors we argue first from
social processes, using the perspective of social distance as synecdoche for less frequent interaction,
lower mutual commitment, and limited understanding. Speaking metaphorically, social distance is inverse

7
bandwidth. Five social mechanisms, summarized in Table 1, then explain why greater channel bandwidth
and lower social distance should increase access to novel information.
----- TABLE 1 -----
Social Capital. In relationships characterized by strong cohesive ties, contacts are likely to be
more willing to share information. Diverse, low bandwidth ties are typically opportunistic, functional and
generally only selfishly cooperative (Granovetter 1973, Uzzi 1997). Cohesive, embedded ties on the other
hand are typically characterized by greater intimacy, trust, emotional intensity and mutual confiding
(Coleman 1988, Uzzi 1996, 1997). Social cohesion motivates individuals to devote time and effort to
communicating with and assisting one another (Granovetter 1985, Coleman 1988). The development of
cooperative norms (Granovetter 1992) and the subsequent reduction in competition in cohesive networks
are likely to increase knowledge transfer between individuals (Szulanski 1996, Argote 1999, Reagans and
McEvily 2003). Social capital in strong high bandwidth relationships gives ego the standing to seek in-
formation and alter the comfort to offer information. Such motivation enables ego to overcome two im-
portant hurdles in accessing novel information – sensitivity and effort costs. Trust makes contacts more
willing to share sensitive information. If the set of all novel information known to alters consists of two
subsets, sensitive and non-sensitive, a weak tie relationship will only provide access to the subset which is
non-sensitive, decreasing the total amount of novel information alter will share. In parallel, if alters are
unwilling to devote time and effort to information exchanges with ego, then ego will receive less total
novel information and will get less in return for placing burdensome requests. In the context of job seek-
ing, Granovetter (1973: 1371) nicely sets up the open empirical question we seek to address: “A natural a
priori idea is that those with whom one has strong ties are motivated to help with job information. Op-
posed to this greater motivation are the structural arguments I have been making: those to whom we are
weakly tied… will have access to information different from that which we receive.” Whether strong or
weak ties deliver more novel information remains a critical open question. Social capital, developed
through prior information sharing, enables ego to seek and alters to share more novel information in high
bandwidth relationships.

8
Transactive Memory. To ask for new information on a particular subject, one must know whom
to ask. Access to remote information is more likely when ego has prior knowledge of where it is (Wegner
1987) and stronger ties are more familiar with each other’s catalog of knowledge inspiring information
exchanges on a larger number and a wider variety of topics. The greater the social distance between two
people – the longer the metaphorical bridge across a structural hole – the lower the likelihood that ego
knows what an alter knows and vice versa, limiting ego’s ability to seek information effectively and al-
ters’ ability to proactively offer relevant novel information to ego. Knowing who knows about job oppor-
tunities or where to seek funding helps facilitate the search process even if the information to be trans-
ferred is itself not known a priori. For example, information on a potential job may be novel even if the
catalogue of who knows about job opportunities is known. In Uzzi’s study of the fashion industry, know-
ing who knows where to get the best price for wool precedes discovery of that price and where it is of-
fered. Building catalogues of expertise requires prior shared experience and an ego seeks less effectively
from the stored knowledge of socially disconnected alters without knowing who knows what (Wegner
1987, Liang et. al. 1995, Cramton 2001). More frequent interaction also gives alters a broader catalog of
ego's knowledge and interests, making it easier for them to volunteer non-redundant information relevant
to ego. For example, alters may not volunteer information about potentially relevant job opportunities if
they do not know that ego is looking for a job or in which industry ego is interested in working.
Of substantial relevance for the diversity-bandwidth tradeoff, Wegner (1987) introduced the no-
tion of "transactive memory" to describe intimate relationships in which individuals have organized into
mutually determined and understood domains of expertise. Although developing a relationship can be
understood "as a process of mutual … disclosure … it can also be [understood] as a necessary precursor
to transactive memory." (Wenger 1987: 200) As relationships develop, contacts become more familiar
with the types of things each other knows. Knowing who knows what makes embedded relationships with
high bandwidth communication channels a more likely source of novel information both from the per-
spective of ego seeking information and alters volunteering it.

9
Search-Transfer. While discovery of simple news might be efficient in weak ties, transfer of
complex know-how can be constrained by an inability of weak tie relationships to deliver complex infor-
mation on multiple interdependent topics. Weak ties are inherently limited in the set of novel information
they can transfer to the subset of ‘simple’ novel information (Hansen 1999). As Reagans and McEvily
(2003: 242) demonstrate, strong embedded ties create a favorable social environment for information
transfer: “Cohesion around a relationship can ease knowledge transfer by decreasing the competitive and
motivational impediments that arise, specifically the fact that knowledge transfer is typically beneficial
for the recipient but can be costly for the source.” Awareness of a previously unknown software module
can pass easily via an infrequent social contact. But, transferring that module together with interdependent
instructions and contextual information requires a level of expert assistance that implies a helping rela-
tionship (Hansen 1999).
Information exchanges in embedded relationships are likely to be more detailed, and also more
holistic in the sense that they not only convey discrete bits of information but also meta information about
how each discrete idea connects with others, as well as discussion of the conceptual implications of each
idea. Transfers of this richer set of information involve a greater number of novel pieces of information
passing between contacts. Structurally diverse bridging ties on the other hand are usually formed for a
particular purpose and in order to deliver information on a single or a limited number of dimensions. Such
information is likely to be more discrete, summarizing a number of dimensions in a single signal such as
the price of goods in an economic relationship (Uzzi 1997). For example, Uzzi (1997) describes how rep-
resentatives of firms engaged in embedded relationships go beyond exchanging price information to also
discussing more detailed implications concerning profit margins, fashion sense, and strategy. People can
absorb ideas more easily on topics matching their expertise (Cohen & Levinthal 1990), and cohesive em-
bedded ties, in effect those with high bandwidth, have been shown to produce higher rates of complex
knowledge transfer in contract R&D (Reagans & McEvily, 2003) and product innovation firms (Hansen
1999). Bandwidth therefore affects the ability to share complex forms of novelty.

10
Knowledge Creation. Creating new knowledge also injects more novelty into the network and of-
ten requires rich interaction through thick communication channels. Songwriters and artists benefit from
community embeddedness as their ideas feed on one another. Creative works, such as Broadway musi-
cals, combine initially separate ideas from which teams brainstorm, problem solve, collaborate and thus
create new ideas altogether (Uzzi & Spiro 2005). These idea generating collaborations are rarely socially
remote. Rather, they more commonly arise in apprenticeship relationships between professors and gradu-
ate students or between colleagues interacting based on common interests (Lave and Wenger 1991).
Obstfeld (2005) finds that brokers who bring together disconnected alters, in effect increasing the fre-
quency of their interactions, promote innovation more than those who keep their contacts separated. Suc-
cessful innovation teams coordinate their knowledge and actions, and intentionally push new knowledge
to all team members. Initiating new design changes requires collaborators to update team members
quickly and often. These updates to one’s social network bring people together and coordinate group ac-
tion, representing a “union” strategy (Obstfeld 2005). In the context of an automotive engineering firm,
this strategy was more conducive to trust, cooperation, transfers of complex knowledge, and ultimately to
idea generation than “disunion” strategies that kept contacts apart. In Obstfeld’s setting, new social
knowledge generated from prolonged contact between engineers helped create innovation and for this
reason dense cohesive social networks outperformed sparse networks with structural holes.5
Homophily. Homophily among those in cohesive embedded networks also makes them more
likely to have mutual interest across a wider variety of topics due to similarities across a greater number
of distinct social dimensions (Blau 1986, McPherson et. al. 2001). Ironically, overlapping interests across
a greater number of dimensions, which have been theorized to create redundancy, can inspire more multi-
faceted communication creating opportunities for high bandwidth channels to deliver more of the differ-
ent dimensions of information known to one’s contacts. We are more likely to be inspired to cover more
topical ground in conversation with those with whom we share a greater number of common interests. As
alters connected by cohesive ties are more likely to engage each other more deeply and to participate in
cooperative activities such as joint problem solving, they are more likely to discover topics of mutual in-

11
terest in their discussions and to subsequently continue to both generate and exchange information on
those additional dimensions (Uzzi 1997, Helper et al 2000).
In summary, these five social phenomena imply that as the bandwidth of a channel increases, the
topical diversity of information and the total volume of novel information flowing through it should also
increase as recipients experience more chances to encounter novel information on a greater number of
dimensions. Greater social capital, transactive memory, homophily and knowledge creation and transfer
effectiveness make it likely that a greater volume of novel information is exchanged through socially
proximate, high bandwidth relationships. We therefore expect that channel bandwidth is positively asso-
ciated with receiving more diverse information and more total non-redundant information.
INFORMATION ENVIRONMENTS AND THE CONTINGENCY OF VISION ADVANTAGES
If network diversity and channel bandwidth tradeoff and both provide access to novel informa-
tion, then information advantages to brokerage positions will depend on the information environments in
which brokers find themselves. Although a diverse network of weak, low bandwidth ties (“diverse-low
bandwidth”) can provide access to more novel information than a cohesive network of strong, high band-
width ties (“cohesive-high bandwidth”), the converse is also possible and in many cases more likely.
Three characteristics of information environments should affect the degree to which diverse-low band-
width or cohesive-high bandwidth networks deliver more novel information to ego. First, the more infor-
mation overlaps among people in the network, the less structural diversity should confer information ad-
vantages. Second, the larger the total size of the topic space, the more important bandwidth should be for
receiving novel information. Third, the more information changes over time, the more cohesive-high
bandwidth networks should deliver novel information.
In what follows, we translate our theory into probabilistic expectations of access to novel infor-
mation in different information environments. Social motivations to exchange more information and the
likelihood of greater redundancy in densely connected groups are expressed in probabilistic terms that
describe the likelihood of sampling novel information in diverse-low bandwidth and cohesive-high band-
12
width networks respectively. Each alter has information on certain topics, represented by numbers, which
together comprise the set of topics or ideas that exist in the network. The numbers of arrows between ac-
tors represent the bandwidths of communication channels (which parallels tie strength).
Consider two actors Alex (A) and Beth (B) depicted in Figure 3, Panel 1. Alex has two weak, low
bandwidth ties to two unconnected alters Isaac (i) and Jake (j), while Beth has two strong, high bandwidth
ties to alters Kim (k) and Lauren (l), who connect to each other via strong ties. This scenario captures
classic arguments about network structure and information access as well as the diversity-bandwidth
tradeoff. Alex's weak tie contacts, being separated by a structural hole, have no redundant information,
while Beth's strong tie contacts, being strongly connected, have redundant information. To demonstrate
the importance of the diversity-bandwidth tradeoff in even extreme settings that are least favorable to our
theory, we invoke the most conservative version of Granovetter's original forbidden triad argument. Al-
though, according to Granovetter, the strong ties connecting B-k and B-l imply the k-l tie “is always pre-
sent (whether strong or weak)” (Granovetter 1973: 1363), we represent the k-l tie as a strong connection
and assume complete information homogeneity between Kim (k) and Lauren (l). This same basic scenario
holds across all Panels 1-6, yet Kim and Lauren frequently provide more novel information to Beth than
Isaac and Jake provide to Alex because they furnish a greater overall volume of information. Due to the
high bandwidth nature of their relationships, they provide more samples of their respective information
spaces. In social terms, whether this extra volume contains extra novelty per unit of information is a
tradeoff that depends on (i) how much the information of alters overlaps with one another (ii) the total
number of topics in alters’ catalog of knowledge, and (iii) the rate at which information in the network
refreshes or updates.
----- FIGURE 2 -----
The classic weak-tie, structural hole argument sets the baseline in Panel 1, which represents two
tie strengths, weak and strong, by two arrows and three arrows respectively. Each alter has information on
four topics (i, k, l = {1, 2, 3, 4} and j = {5, 6, 7, 8}), but only Alex's contacts have no overlap in their in-
formation. Alex’s weak, low bandwidth ties to Isaac and Jake provide two samples each from their topic

13
spaces. Assuming alters do not repeat themselves (i.e. Alex samples information from Isaac and Jake
without replacement, as does Beth from Kim and Lauren), Alex samples two non-redundant items from
Isaac and two non-redundant items from Jake, receiving four total novel pieces of information overall.
Beth on the other hand will receive three novel pieces of information from her first contact Kim, and will
subsequently receive a novel bit of news in her first exchange with Lauren with probability ¼. If Beth's
first draw from Lauren is novel, Lauren has no more non-redundant information to share.6 Assuming re-
dundant information on her first exchange (which occurs with probability ¾), Beth then has a one in three
chance of receiving non-redundant information on her second exchange with Lauren. Over these two ex-
changes, Beth receives novel information with cumulative probability ½ (as given by ¼ + (¾)*(1/3) = ½).
If Beth has not received new information by the third exchange (which occurs with probability ½), she
retains a ½ chance of receiving non-redundant information in her last exchange. The total chance of Beth
receiving novel information over three exchanges is ¾ (given by ¼ + (¾)*(1/3) + ½(½) = ¾). The total
number of non-redundant pieces of information Beth expects to receive is thus 3 and ¾ given that she
started by receiving 3 non-redundant items from Kim.
If each bit of novel information represents a job opening, then Alex's social network spans eight
different opportunities and he expects to receive news about four of them. In contrast, Beth's social net-
work spans as many people but only four opportunities and she can expect, on average, to receive news of
fewer non-overlapping opportunities. Her cohesive network contains redundant information. This demon-
strates the value of structural diversity in delivering novel information, which arises from the heterogene-
ity of the information among Alex’s contacts Isaac and Jake. Even though Alex receives fewer draws of
his contacts’ respective topic spaces, he still expects to receive more novel information than Beth because
his social network bridges non-overlapping information pools separated by structural holes.
In Panel 2, we examine the same scenario but raise the bandwidth of Beth's ties by one and re-
duce the bandwidth of Alex's ties by one. The power of bandwidth becomes immediately apparent. While
we maintain the same conservative assumptions about the distribution of information across alters (Kim
and Lauren have completely redundant information, while Isaac and Jake have completely non-redundant
14
information), the increased bandwidth of Beth's ties is enough to provide her with more expected novel
information. In fact, the example is trivial. While Alex expects to receive two pieces of non-redundant
information (one each from Isaac and Jake), Beth expects to receive four pieces of novel information
simply because the bandwidth of her communication channels with Kim and Lauren is higher. In fact, the
relative benefit of bandwidth is based on a model that is socially conservative. In their study of R&D
transfer, Reagans and McEvily (2003) found that cohesion improves the willingness and ability to transfer
information by reducing competition and costs of sharing. Here, Isaac and Jake might have preferred to
hoard their unique information either to use themselves or because alters in their positions are more likely
to compete, while Kim has less incentive to keep from Beth what Lauren can also share.
In Panel 3, we relax the conservative assumption of complete information heterogeneity between
Isaac and Jake by introducing partial overlap in their information sets.7 Although Kim and Lauren con-
tinue to have completely homogeneous information, the scenario again tips in favor of channel bandwidth
– the cohesive-high bandwidth ties yield more novel information. The only difference in this panel is that
Jake’s information overlaps with Isaac’s information by 50%. Alex still receives two novel pieces of in-
formation from Isaac but then on contact with Jake, only receives novel information with probability ½.
Assuming Alex receives no novel information during his first interaction with Jake (which occurs with
symmetric probability ½) he will receive novel information during his second interaction with probability
2/3rds as two of the three remaining information items available from Jake are novel. If however, he does
receive novel information in his first interaction, the chance of receiving novel information on his second
interaction falls to 1/3rd. The total probability of Alex receiving novel information over both draws from
Jake is 1 (based on interaction one: ½ + interaction two: ½ (1/3) + ½ (2/3)). So, Alex expects to receive
three total items of novel information, one from Jake and two from Isaac. As Beth's likelihood of receiv-
ing novel information has not changed relative to Panel 1 (3 and 3/4ths from Kim and Lauren respec-
tively), Beth expects to receive novel information with greater likelihood and than Alex in Panel 3. This
example demonstrates the value of channel bandwidth in delivering novel information even when one’s
alters have completely overlapping information, which arises from the ability to exchange a greater vol-
15
ume of information with each contact. Panels 1-3 imply the following: All else equal, we expect that the
greater the information overlap among alters, the less valuable structural diversity will be in providing
access to novel information.8
In Panel 4 we illustrate the effect of a complex or high dimensional information environment by
broadening the overall topic space. Now, alters are aware of twelve topics instead of four. The band-
widths of ties are as they were in Panel 1. Alex’s contacts Isaac and Jake again have non-redundant in-
formation sets and Beth’s contacts Kim and Lauren have redundant information sets. As in Panel 1, Alex
expects four items of novel information, but in this case, because Beth’s high-bandwidth ties sample from
a broader information space with less chance of collision, she expects more novel information overall. In
her first three interactions with Kim, Beth receives three novel items of information, but it is apparent af-
ter only her second interaction with Lauren that Beth’s total expected novel information exceeds that of
Alex. The chain can be established by summing the probabilities of receiving novel information from
each of the three interactions. Reduce the denominator once for each draw; reduce the numerator once for
each success.9 On average, receiving 3 pieces of novel information from Kim and 2¼ from Lauren, Beth
expects to do better than Alex based on a larger topic space. The difficulty of transferring complex infor-
mation makes bandwidth even more important in this case. If three units of interdependent information
need to be transferred together to be useful, then Beth’s benefit of bandwidth is understated. Alex may not
be able use the two pieces of novel information he receives from Isaac and Jake if he has insufficient con-
text to understand them. Likewise, social capital theory also predicts Beth is better off. It is easier to ask
for one item than ten. Alex must be willing to ask for more and his contacts must be willing to share but
Beth is better positioned to both ask and receive. Further, creativity is often higher when there are more
ideas to work with (Weitzman 1998), implying the value of novel information is higher in the presence of
a greater volume of novelty. Panel 4 implies that, all else equal, the broader the topic space, the more
valuable channel bandwidth will be in providing access to novel information.
Thus far, the diversity-bandwidth tradeoff appears in a purely static context where colleagues’ in-
formation endowments do not change. A more realistic scenario involves dynamic updating. We learn

16
daily and constantly revise our understanding of basic facts as well as complex know-how. We become
aware of news concerning our workplaces, our friends, and changes in the world around us. The advance
of internet technologies, mobile service applications for personalized news and the ‘always on’ nature of
online social networks can in fact accelerate the pace at which our knowledge of the world refreshes. In-
formation simultaneously obsolesces as it updates. Environmental turbulence inspires adaptation
(Galbraith 1974, March 1991) and changing information makes learning from experience more difficult
(Weick 1979). As prior knowledge becomes obsolete more quickly, accessing timely information requires
gathering news more frequently.
Reinterpreting a classic example (Granovetter 1973), suppose that highly desirable job openings
fill quickly but that undesirable jobs remain open longer. Then inquiring of weak ties what jobs currently
remain open can sample disproportionately from undesirable jobs. By the time a weak tie can deliver in-
formation about a desirable job, information about that job is already well known to competing alters
whose strong ties update them more quickly. If information about jobs refreshes often or if information
obsolesces quickly, frequent communication is essential to getting news before others. This speaks di-
rectly to the issue of the information refresh rate relative to channel bandwidth. High bandwidth ties will
encounter time critical information with greater probability than low bandwidth ties and thus will be more
likely to deliver non-redundant information in turbulent information environments. Panels 5 and 6 there-
fore introduce time.
To reestablish the weak-tie/structural-hole baseline, Panel 5 shows that diverse low-bandwidth
ties can provide more novel information. In both Panels 1 and 5, Beth’s contacts’ knowledge overlaps
while Alex’s does not; Beth has bandwidth three while Alex has bandwidth two; and endowment sets
span a topic space of four. But, in Panel 5, information refreshes. Dashed lines separate changes in infor-
mation. Since Panel 5 spans two periods (T1 and T2), expected access to novel information exactly dou-
bles that of Panel 1. Panel 6, however, shows a more turbulent environment. Updates occur twice per pe-
riod as shown for example by the fact that Isaac’s information set changes from {1, 2, 3, 4} to {5, 6, 7, 8}
within period T1. Although Beth might learn of three news items (among 1, 2, 3 or 4) from Kim, by the

17
time she checks with Lauren, the context has already changed such that she learns three new items (from
among 5, 6, 7 or 8). This gives her news of six novel pieces of information per period, a full dozen across
both periods.10 High bandwidth ties can therefore provide more access to new information in more turbu-
lent information environments despite being more constrained structurally.
In slow moving environments, such as roof repairs which are needed once every twenty years, a
roofer’s network of weak ties is sufficient to deliver information about potential jobs (Podolny 2001). In
contrast, in turbulent environments such as stock market arbitrage, minute advantages can be critical and
people must shift from exploiting what they know to exploring what they do not know (March 1991). In
communications terms, this means interacting more frequently. It means increasing communication chan-
nel bandwidth. For transactive memory systems, change renders the catalog of others’ knowledge obso-
lete so that a person searches less effectively without updates. In the creativity literature, the chance at
Schumpeterian recombination of ideas rises as individuals are exposed to change and design changes
must be shared with team mates more quickly for projects to be successful (Obstfeld 2005). Constantly
changing information implies that ego does not need to change channels to receive incremental novelty
because what their contacts have to tell them is itself changing, refreshing or updating. The greater the
bandwidth of communication channels, the more of this newly updated information will be passed on to
ego in a timely manner. We therefore expect, all else equal, that the higher the refresh rate, the more
valuable channel bandwidth will be in providing access to novel information.
Since stylized examples depend heavily on assumptions and initial conditions we extend these il-
lustrations by developing a more general analytical model of our arguments in Appendix A. We formally
prove there that each of these factors can make either a diverse-low bandwidth network or a cohesive-
high bandwidth network more attractive in terms of access to novel information. The key intuition is con-
veyed by representing “bias” as the tendency of cohesive ties to share the same redundant elements from
a topic vector. When the disadvantage of bias swamps the advantage of bandwidth, an ego always prefers
the diverse-low bandwidth tie to the constrained-high bandwidth tie to increase chances of encountering
novel information. But, when the advantage of bandwidth swamps the disadvantage of bias, an ego pre-
18
fers the opposite. While a range of intermediate cases span these extremes, conditions exist when a person
will always prefer one or the other type of link depending on bias, bandwidth, and the number of links
already present.
----- TABLE 2 -----
The diversity-bandwidth tradeoff implies that vision advantages are contingent on the different
social settings and information environments in which brokers are situated. In turbulent social settings or
intellectual domains where conditions change rapidly and news, ideas and methods are frequently up-
dated, greater structural diversity is less useful for delivering novel information than greater channel
bandwidth because high bandwidth ties provide frequent, high volume access to changing pools of infor-
mation. On the other hand, if information possessed by alters is relatively static, bandwidth becomes less
important in terms of access to novel information. In highly heterogeneous information environments in
which local network neighborhoods possess distinct, non-overlapping information, bandwidth is less
beneficial than structural diversity. But, when the overlap of information among alters is more pro-
nounced the opposite is true. In environments with multiple complex ideas, bandwidth delivers greater
novelty, but when the topic space is limited, structural diversity trumps bandwidth. These contingencies
are critical for our understanding of brokerage because the configurations that produce them are among
the most prevalent in human social networks. Since structurally diverse strong ties and cohesive embed-
ded weak ties are both relatively rare (Granovetter 1973, Burt 1992, Watts and Strogatz 1998, Watts
1999, Centola and Macy 2007), the contingent scenarios are likely to be the most useful for explaining
relationships among networks, information flow and performance outcomes in a variety of social con-
texts.
----- FIGURE 3 -----
Unfortunately, the vast majority of empirical work on networks and information advantage is
“content agnostic” (Hansen 1999: 83). While there is abundant evidence linking social structure to per-
formance (e.g. Burt 1992, 2004a, 2007, Reagans and Zuckerman 2001, Sparrowe et al. 2001, Cummings
and Cross 2003, Cummings 2004, Aral et. al. 2006, 2007), direct evidence on information flowing
19
through networked relationships is rarely used to validate information-based theories of brokerage and the
strength of weak ties. As Burt (2008: 253) has recently noted: “Empirical success in predicting perform-
ance with network models has far outstripped our understanding of the way information flow in networks
is responsible for network effects. A cluster of network concepts emerged in the 1970s on the idea that
advantage results from connections with multiple, otherwise disconnected, groups and individuals. The
hubs in a social network were argued to have advantaged access to information and control over its distri-
bution… However, the substance of advantage, information, is almost never observed.” “The next phase
of work is to understand the information-arbitrage mechanisms by which people harvest the value buried
in structural holes … More generally, the sociology of information will be central in the work …” (Burt
2005: 60)11 We therefore test our arguments by combining social network and performance data with di-
rect observation of the information content flowing through email communication.
DATA AND METHODS
Research Setting
We studied an executive recruiting firm with fourteen offices across the United States and col-
lected and analyzed the topical content of email messages to determine the relative heterogeneity and
novelty of the information passed between individuals in the organization. Previous research by Wu et. al.
(2004) and Kossinets and Watts (2006, 2009) has validated the usefulness of email data in characterizing
and analyzing social networks in firms and academic institutions. We extend this research by combining
analysis of the social structure of email communication with an evaluation of the information content of
messages. We argue that combining analysis of message content and communication topology can open
new avenues for answering questions at the heart of the sociology of information. Although information
flow can be documented in a limited way with ethnographic and survey data (Baker 1984, Obsfeldt 2005,
Reagans and McEvily 2003), direct observation of information content and its variation across and
movement through communication channels in networks is critical to accurately testing information based
theories of social capital (Burt 2008).

20
By analyzing email communication patterns and message content, we are not only able to match
network structures to the subject matter of the content flowing through them, but also to avoid inaccuracy
in respondents’ recall of their social networks and communication. Most research elicits network data
from respondents who have difficulty recalling their networks (e.g. Bernard et. al 1981), especially among
individuals socially distant to themselves (Krackhardt and Kilduff 1999). The inaccuracy of respondent
recall and the bias associated with recall at social distance creates inaccurate estimates of network vari-
ables (Kumbasar, Romney and Batchelder 1994), forcing most empirical studies to artificially limit the
boundary of estimated networks to local areas around respondents (e.g. Reagans and McEvily 2003).
Such artificial boundaries create estimation challenges due to the sensitivity of network metrics to the
completeness of data (Marsden 1990). If important areas of the network are not captured, estimates of
network positions can be biased. We therefore took several steps to ensure a high level of participation in
the study (described below). As 87% of eligible employees agreed to participate we collected email net-
work and content data with nearly full coverage of the firm. There are no statistical differences between
participants and those who opted out of the study on dimensions of relevance to the analysis.12
As work was geographically dispersed and as instant messaging was rarely used, recruiters relied
on email as their primary means of communication.13 As one recruiter put it “[s]taff spend an enormous
amount of time coordinating. We are big users of email.” The email network of the firm displays a hub
and spoke structure, with a dense core of thirty four recruiters at the firm’s headquarters and spokes in
thirteen other offices located across the United States. This structure offers a unique window onto the
value of network and information diversity as measured in email data for two reasons. First, geographic
dispersion makes email an even more important source of information because it reduces the number of
face to face meetings recruiters can engage in (Hinds and Keisler 2002). Second, redundant information
and expertise tends to pool in each dispersed geographic location, enabling recruiters with diverse net-
works to reach across structural holes into distinct pools of information, making this setting particularly
well suited to analyzing the information benefits of brokerage.
----- FIGURE 4 -----

21
The core of executive recruiters’ work involves matching job candidates to clients’ requirements
– a process which is information-intensive and requires activities geared toward assembling, analyzing,
and making decisions based on information gathered from team members, other firm employees, and con-
tacts outside the firm. Access to information enables higher quality decisions in this setting. Recruiters
report being more effective when they receive rich information from their colleagues about candidate
qualifications, client idiosyncrasies, methods for circumventing secretarial screens or handling difficult
placements, and team coordination.14
Diverse and novel information is particularly useful in executive recruiting because recruiters are
quintessential brokers. They broker the market between candidate characteristics (skills, experience and
personality) and client requirements. Qualitative studies have shown that recruiters fill “brokerage posi-
tions” between clients and candidates and rely heavily on information flows to complete their work effec-
tively (Finlay and Coverdill 2000). Information about a diverse pool of candidates, diverse markets and
diverse client firms improves a recruiter’s ability to generate high quality matches by improving the fit
between candidates’ characteristics and clients’ requirements. Better information reduces time wasted
interviewing unsuitable candidates and increasing the quality of placements (Aral et. al. 2006). Different
clients have different needs, so when a new search begins, having access to a wide variety of leads on
candidates of different types in different markets and salary ranges makes it more likely that a recruiter
will be successful in filling the position quickly. Sharing procedural information can also improve effi-
ciency and effectiveness (Szulanski 1996). For example, information exchanged through social communi-
cation helps recruiters navigate entry into client firms and candidate pools. One recruiter told us that
“[c]all penetration can be really hard into private companies so researchers and consultants swap informa-
tion to get through.” Having different information on how to ‘penetrate’ different private companies can
make recruiters more effective at gathering the information and contacts they need to match candidates to
clients. Information sharing also enables coordination and eliminates the need for recruiters to ‘reinvent
the wheel’ when they are searching for similar candidates or clients. As one recruiter told us “communi-
cation within and across teams is a big success factor. It eliminates double work.”

22
In these ways, diverse information helps recruiters fill different types of positions and perform
complex matching of candidate strengths and weaknesses to client needs. Recruiters report that tapping
diverse information pools helps them do their work effectively. They emphasize the need for diverse con-
tacts and report that “[d]iversity means more and better contacts” because “[s]kill sets are complementary
and not perfectly overlapping.” While interviewing recruiters, we also talked with several executive re-
cruiter trainers. One trainer, who describes her job as ‘helping recruiters learn to be better recruiters,’ told
us that “[To be a successful recruiter one should] develop relationships with people you don’t know…
Some folks join groups for their prestige but you should join clubs for their diversity. Whom do you want
to know? Go there. Neophytes hang out on their own.” For these reasons we expect diverse and novel
information is particularly important for explaining variance in recruiter performance.
Data
Our data come from four sources: (i) detailed accounting records of individual project assign-
ments and performance, (ii) email data captured directly from the corporate server, (iii) survey data on
demographic characteristics, human capital, and information seeking behaviors, and (iv) data from the
web site Wikipedia.org used to validate our analytical models of information diversity. The firm gave us
access to their complete internal accounting and project databases for records spanning 2000 to 2005. In-
ternal accounting project data describe: revenues generated by individual recruiters, contract start and stop
dates, projects handled simultaneously by each recruiter, project team composition, and job levels of re-
cruiters and placed candidates. These provide excellent performance measures that can be normalized for
quality. Email data cover 10 months of complete email history at the firm. The data were captured from
the corporate mail server during two equal periods from October 1, 2002 to March 1, 2003 and from Oc-
tober 1, 2003 to March 1, 2004. Participants received $100 in exchange for permitting use of their data,
resulting in 87% coverage of eligible recruiters and more than 125,000 email messages captured. 15 De-
tails of email data collection are described by (redacted to de-identify authors). The third data set contains
survey responses on demographic and human capital variables such as age, education, industry experi-

23
ence, and information-seeking behaviors. Survey questions were generated from a review of relevant lit-
erature and interviews with recruiters. Experts in survey methods at the Inter-University Consortium for
Political and Social Science Research vetted the survey instrument, which was then pre-tested for com-
prehension and ease-of-use. Individual participants received $25 for completed surveys and participation
exceeded 85%. The fourth dataset represents 291 entries collected from Wikipedia.org, which we describe
in detail in the section pertaining to the validity of our information diversity metrics (see Appendix C).
Descriptive statistics and correlations of all variables are provided in Tables 3 and 4 (we detail construc-
tion of each variable in the next section). An observation is one person-month.
----- TABLES 3 & 4 -----
Variable Construction
Dependent Variables
Recruiters in this firm measure success by the number of job openings filled and the amount of
revenue generated per unit time. We therefore assess individual recruiters’ performance by measuring the
number of projects completed per month and revenues generated per month recorded in the firm’s ac-
counting records. In addition to revenues and project completions, the speed with which vacancies are
filled is also an important intermediate measure of workers’ productivity. Contract completion implies
that recruiters have met a client’s minimum thresholds of candidate fit and quality. Faster project comple-
tion implies that recruiters are creating high quality matches in a shorter period of time and project dura-
tion can therefore be interpreted as a quality controlled measure of productivity. As one recruiter told us:
“[t]he longer a client delays, the lower the probability of job acceptance.” We therefore also measure av-
erage project duration.
Network Variables
Network Size. The size of i’s network (Si) is simply the number of contacts with whom i ex-
changes at least one message. Size is the most familiar network characteristic related to information bene-
fits and is a good proxy for a variety of characteristics, like degree centrality, betweenness centrality and
24
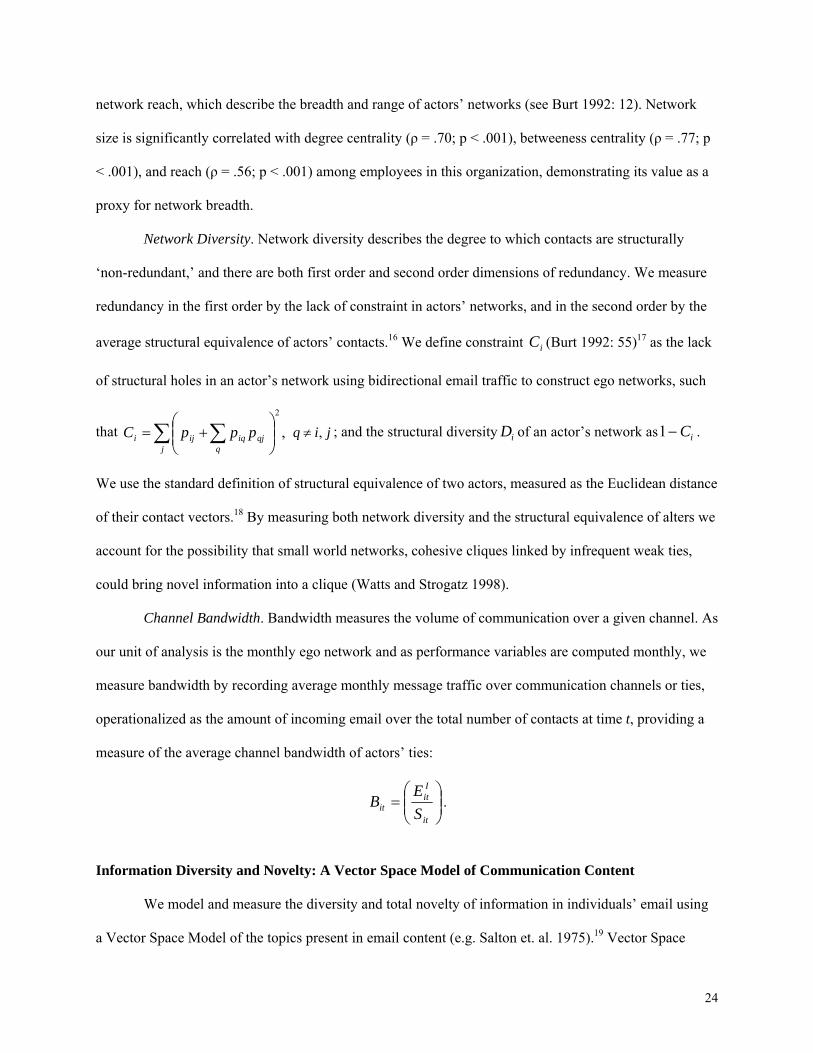
network reach, which describe the breadth and range of actors’ networks (see Burt 1992: 12). Network
size is significantly correlated with degree centrality (ρ = .70; p < .001), betweeness centrality (ρ = .77; p
< .001), and reach (ρ = .56; p < .001) among employees in this organization, demonstrating its value as a
proxy for network breadth.
Network Diversity. Network diversity describes the degree to which contacts are structurally
‘non-redundant,’ and there are both first order and second order dimensions of redundancy. We measure
redundancy in the first order by the lack of constraint in actors’ networks, and in the second order by the
average structural equivalence of actors’ contacts.16 We define constraint iC (Burt 1992: 55)17 as the lack
of structural holes in an actor’s network using bidirectional email traffic to construct ego networks, such
that ,2
∑ ∑ ⎟⎟⎠
⎞⎜⎜⎝
⎛+=
j qqjiqiji pppC jiq ,≠ ; and the structural diversity iD of an actor’s network as iC−1 .
We use the standard definition of structural equivalence of two actors, measured as the Euclidean distance
of their contact vectors.18 By measuring both network diversity and the structural equivalence of alters we
account for the possibility that small world networks, cohesive cliques linked by infrequent weak ties,
could bring novel information into a clique (Watts and Strogatz 1998).
Channel Bandwidth. Bandwidth measures the volume of communication over a given channel. As
our unit of analysis is the monthly ego network and as performance variables are computed monthly, we
measure bandwidth by recording average monthly message traffic over communication channels or ties,
operationalized as the amount of incoming email over the total number of contacts at time t, providing a
measure of the average channel bandwidth of actors’ ties:
⎟⎟⎠
⎞⎜⎜⎝
⎛=
it
Iit
it SE
B .
Information Diversity and Novelty: A Vector Space Model of Communication Content
We model and measure the diversity and total novelty of information in individuals’ email using
a Vector Space Model of the topics present in email content (e.g. Salton et. al. 1975).19 Vector Space

25
Models represent textual content as vectors of topics in multidimensional space based on the relative
prevalence of topic keywords. They are widely used in information retrieval and search query optimiza-
tion algorithms to identify similar documents or to find topics identified by search terms. In our model,
each email is represented as a multidimensional ‘topic vector’ whose elements are the frequencies of
keywords in the email. The prevalence of certain keywords indicates that a topic that corresponds to those
keywords is being discussed. For example, an email about pets might include frequent mentions of the
words “dog,” “cat,” and “veterinarian;” while an email about statistics might mention the words “vari-
ance,” “specification,” and “heteroskedasticity.” We evaluated the relative topical similarity of two emails
by topic vector convergence or divergence – the degree to which their vectors point in the same or or-
thogonal directions in multidimensional topic space.20 Emails about similar topics contain similar lan-
guage on average and vectors used to represent them are therefore closer in multidimensional space, re-
ducing their collective variance or spread. We therefore measured email content diversity by characteriz-
ing all emails as topic vectors and measuring the variance or spread of topic vectors in individuals’ in-
boxes and outboxes as described below.
Construction of Topic Vectors and Keyword Selection. Our Vector Space Model represents each
email ilD (where i indexes emails and l indexes recruiters) as a vector of keyword frequencies ink . Each
email is therefore represented as an n-dimensional vector of keyword frequencies in topic space,
),...,,( 21 iniiil kkkD = ,
where ink represents the frequency of the nth keyword that appears in the ith email. As terms that
appear frequently in an email are more likely to be thematic and to relate to the email’s subject matter, we
used the ‘term frequency’ of keywords in email as weights to construct topic vectors. An example of the
vector construction process is shown in Figure 5.
----- FIGURE 5 -----
The choice of keywords is an important step in the process. Rather than imposing exogenous
keywords on the topic space based on our own thinking, we chose keywords likely to characterize useful,
26
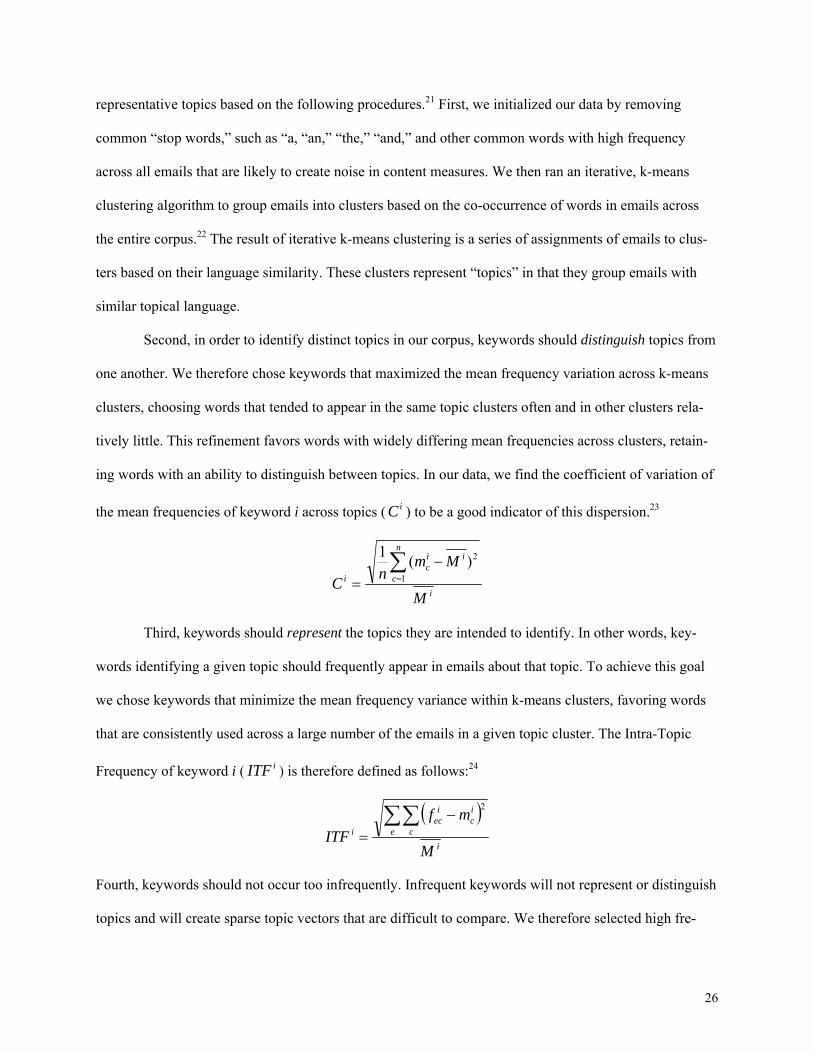
representative topics based on the following procedures.21 First, we initialized our data by removing
common “stop words,” such as “a, “an,” “the,” “and,” and other common words with high frequency
across all emails that are likely to create noise in content measures. We then ran an iterative, k-means
clustering algorithm to group emails into clusters based on the co-occurrence of words in emails across
the entire corpus.22 The result of iterative k-means clustering is a series of assignments of emails to clus-
ters based on their language similarity. These clusters represent “topics” in that they group emails with
similar topical language.
Second, in order to identify distinct topics in our corpus, keywords should distinguish topics from
one another. We therefore chose keywords that maximized the mean frequency variation across k-means
clusters, choosing words that tended to appear in the same topic clusters often and in other clusters rela-
tively little. This refinement favors words with widely differing mean frequencies across clusters, retain-
ing words with an ability to distinguish between topics. In our data, we find the coefficient of variation of
the mean frequencies of keyword i across topics ( iC ) to be a good indicator of this dispersion.23
i
n
c
iic
i
M
MmnC∑=
−= 1
2)(1
Third, keywords should represent the topics they are intended to identify. In other words, key-
words identifying a given topic should frequently appear in emails about that topic. To achieve this goal
we chose keywords that minimize the mean frequency variance within k-means clusters, favoring words
that are consistently used across a large number of the emails in a given topic cluster. The Intra-Topic
Frequency of keyword i ( iITF ) is therefore defined as follows:24
( )i
e c
ic
iec
i
M
mfITF
2∑∑ −=
Fourth, keywords should not occur too infrequently. Infrequent keywords will not represent or distinguish
topics and will create sparse topic vectors that are difficult to compare. We therefore selected high fre-
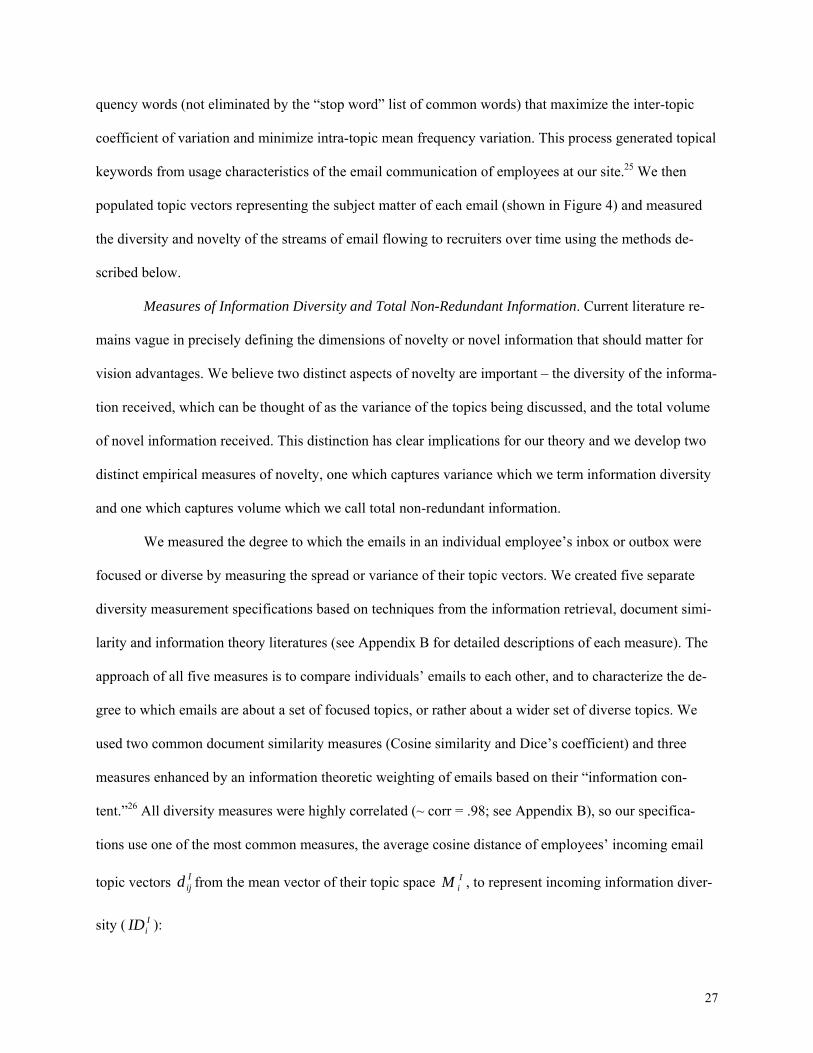
27
quency words (not eliminated by the “stop word” list of common words) that maximize the inter-topic
coefficient of variation and minimize intra-topic mean frequency variation. This process generated topical
keywords from usage characteristics of the email communication of employees at our site.25 We then
populated topic vectors representing the subject matter of each email (shown in Figure 4) and measured
the diversity and novelty of the streams of email flowing to recruiters over time using the methods de-
scribed below.
Measures of Information Diversity and Total Non-Redundant Information. Current literature re-
mains vague in precisely defining the dimensions of novelty or novel information that should matter for
vision advantages. We believe two distinct aspects of novelty are important – the diversity of the informa-
tion received, which can be thought of as the variance of the topics being discussed, and the total volume
of novel information received. This distinction has clear implications for our theory and we develop two
distinct empirical measures of novelty, one which captures variance which we term information diversity
and one which captures volume which we call total non-redundant information.
We measured the degree to which the emails in an individual employee’s inbox or outbox were
focused or diverse by measuring the spread or variance of their topic vectors. We created five separate
diversity measurement specifications based on techniques from the information retrieval, document simi-
larity and information theory literatures (see Appendix B for detailed descriptions of each measure). The
approach of all five measures is to compare individuals’ emails to each other, and to characterize the de-
gree to which emails are about a set of focused topics, or rather about a wider set of diverse topics. We
used two common document similarity measures (Cosine similarity and Dice’s coefficient) and three
measures enhanced by an information theoretic weighting of emails based on their “information con-
tent.”26 All diversity measures were highly correlated (~ corr = .98; see Appendix B), so our specifica-
tions use one of the most common measures, the average cosine distance of employees’ incoming email
topic vectors Iijd from the mean vector of their topic space I
iM , to represent incoming information diver-
sity ( IiID ):

28
( )( )N
MdCosID
N
j
Ii
Iij
Ii
∑=
−= 1
2,1, where:
∑∑∑ ×
=•
=22
),(Mjij
j Mjij
ii
iiij
ww
ww
MdMd
MdCos , such that 10 ≤≤ IiID .
This measure aggregates the cosine distance of email vectors in an inbox from the mean topic vector of
that inbox, approximating the spread or variance of topics in incoming email for a given individual. We
measure the total amount of i’s incoming email communication as a count of incoming email messages,
∑= j jiIi mE , where mji represents a message sent from j to i; and the total amount of non-redundant
information flowing to each actor i as diversity ( IiID ) times total incoming email: )*( I
iIi
Ii IDENRI = .
We performed extensive validation tests of our diversity measures by creating simulated email inboxes
that ranged from sets containing highly diverse emails about different topics to sets containing highly fo-
cused emails about a limited number of similar topics using an independent dataset from Wikipedia.com.
Our measures performed very well in accurately labeling the diverse sets as containing diverse informa-
tion and vice versa (see Appendix C). A three dimensional Vector Space Model of five email vectors and
their mean vector is shown in Figure 6.
----- FIGURE 6 -----
Refresh Rate of Alters’ Information (Refresh Rate). The information refresh rate of an alter j in
month t ( jtRR ) is defined as the cosine distance between every pair of j’s daily mean email vectors in that
month, including both incoming and outgoing email.27 In other words, to calculate the degree to which j’s
information changed from day 1 to day 2 in month t, we calculated the mean vector of j’s emails on day 1,
and the mean vector of j’s emails on day 2 and computed the cosine distance between them:
),(121 ττ jj MMCos− . We then repeated this procedure for the mean vectors between day 1 and day 3,
day 1 and day 4 and so on until we had dyadic comparisons between each pair of days in month t. We

29
considered only measuring the cosine distance between contiguous days (day 1 and day 2, day 2 and day
3), but rejected this approach as topics of conversation may simply alternate or switch over days in the
week. For example two contacts may email about topic 1 on Monday, topic 2 on Tuesday, go back to
topic 1 on Wednesday, and again talk about topic 2 on Thursday. Switching may not only exist on strictly
alternating days but rather may alternate over larger numbers of days. For example, topics might be re-
peated every third day, fourth day or every seventh day if there are recurring weekly meetings about par-
ticular projects or topics that inspire email exchanges about those topics. Measuring information dissimi-
larity only among contiguous days would not capture this potential topic switching and would incorrectly
measure these patterns as being very diverse although a limited number of topics are being discussed and
repeated. We therefore measure the information refresh rate of i's local network itP as a sum of informa-
tion refresh rates ( jtRR ) of i's immediate neighbors j in month t, weighted by the strength of ties between
i and j. We use the number of messages jitm sent from j to i during month t as a proxy for the strength of
incoming ties. Formally, we define the information refresh rate of a node j in month t as:
),(121 21∑ <−=
ττ ττ jjjt MMCosRR , where 1τj
M is the mean vector of j’s emails on day 1τ , and where
2τjM is the mean vector of j’s emails on day 2τ . The information refresh rates of i’s contacts are then
aggregated by summing the refresh rates of i’s alters j weighted by the strength of i’s incoming tie from
each alter: ∑= j jitjtit mRRP * .
Topic Space of Alters (Topic Space). We measure the overall size of the topic space in ego’s local
network by measuring the total amount of non-redundant information i’s alters j exchange with their re-
spective contacts ∑= k jkjkj IDENRI )*( . If the amount of total non-redundant information i’s alters
receive and distribute is high, we expect i to be able to sample from a larger topic space. We therefore
define the overall Topic Space of i’s network in month t ( itTS ) as the sum the of non-redundant informa-
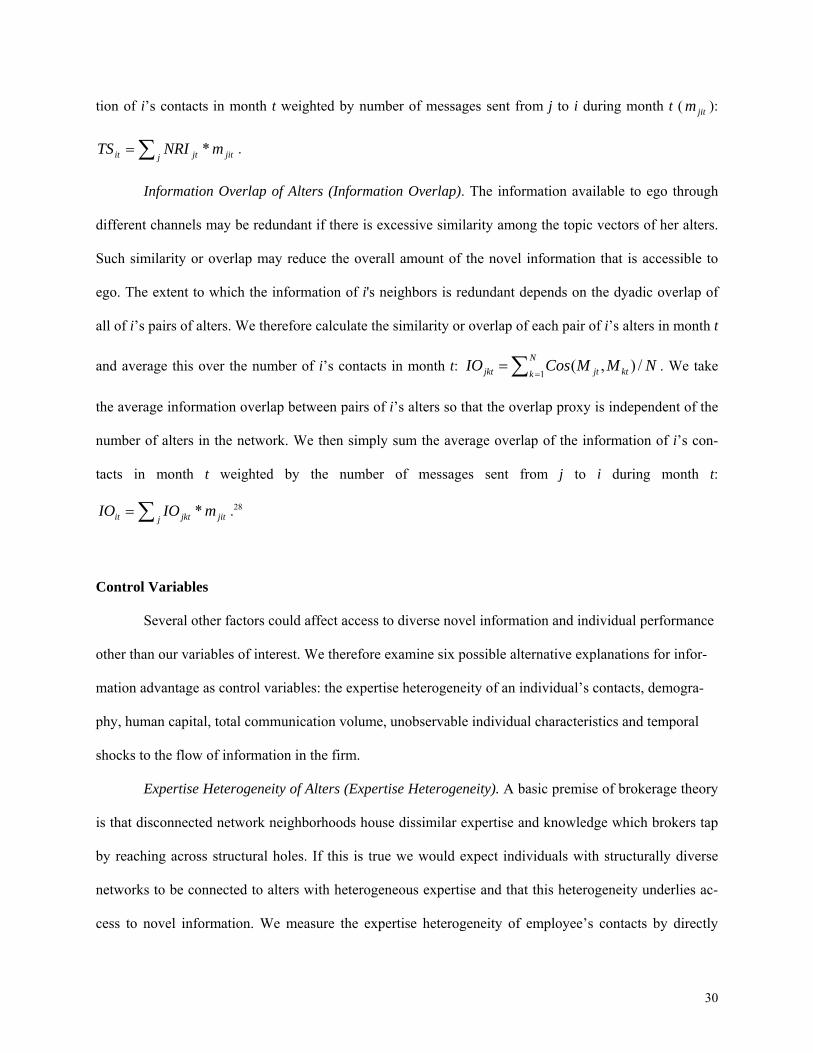
30
tion of i’s contacts in month t weighted by number of messages sent from j to i during month t ( jitm ):
∑= j jitjtit mNRITS * .
Information Overlap of Alters (Information Overlap). The information available to ego through
different channels may be redundant if there is excessive similarity among the topic vectors of her alters.
Such similarity or overlap may reduce the overall amount of the novel information that is accessible to
ego. The extent to which the information of i's neighbors is redundant depends on the dyadic overlap of
all of i’s pairs of alters. We therefore calculate the similarity or overlap of each pair of i’s alters in month t
and average this over the number of i’s contacts in month t: NMMCosIO N
k ktjtjkt /),(1∑ =
= . We take
the average information overlap between pairs of i’s alters so that the overlap proxy is independent of the
number of alters in the network. We then simply sum the average overlap of the information of i’s con-
tacts in month t weighted by the number of messages sent from j to i during month t:
∑= j jitjktit mIOIO * .28
Control Variables
Several other factors could affect access to diverse novel information and individual performance
other than our variables of interest. We therefore examine six possible alternative explanations for infor-
mation advantage as control variables: the expertise heterogeneity of an individual’s contacts, demogra-
phy, human capital, total communication volume, unobservable individual characteristics and temporal
shocks to the flow of information in the firm.
Expertise Heterogeneity of Alters (Expertise Heterogeneity). A basic premise of brokerage theory
is that disconnected network neighborhoods house dissimilar expertise and knowledge which brokers tap
by reaching across structural holes. If this is true we would expect individuals with structurally diverse
networks to be connected to alters with heterogeneous expertise and that this heterogeneity underlies ac-
cess to novel information. We measure the expertise heterogeneity of employee’s contacts by directly

31
evaluating the diversity of their expertise accumulated through the history of the projects they have
worked on in the past. In this setting recruiters’ develop expertise as they complete projects of different
types. As there is little in the way of formal training to become an executive recruiter, we do not use re-
cruiters’ educational backgrounds but rather the distributions of their prior project experience over project
types to measure expertise heterogeneity. The firm categorizes projects into the following categories:
CEO, COO, CIO, Medical Executive, Human Resources Executive, Business Development Executive,
Nurse and ‘Other.’ We use these categories as the relevant areas of recruiters’ expertise.29 The Expertise
Heterogeneity variable is constructed using a Herfindahl Index of the expertise of an actor’s contacts in
each month, weighted by the strength of the tie to each alter. As the firm records each employee’s effort
share on each project, the expertise of a recruiter is share weighted by the amount of effort they recorded
against any given project in the accounting data. The measure is constructed as fol-
lows: ∑=
⎟⎟⎠
⎞⎜⎜⎝
⎛−=
8
1
2
1k i
ikit q
qEH .
In this measure, ∑=
=n
jjkijik Pwq
1represents the total amount of prior experience in i’s network in
project class k, weighted by the strength of the tie to each of i’s contacts ijw (the number of messages
exchanged between i and j) and summed over all of i’s contacts j. jkP represents j’s prior experience in
job class k, where P is an effort share weighted count of the number of projects of class k that j has com-
pleted. The denominator, ∑=
=8
1kiki qq represents the total project experience in i’s network summed over
all project classes. Thus, the ratio ⎟⎟⎠
⎞⎜⎜⎝
⎛
i
ik
is the share of prior experience in project class k over the total
project experience in i’s network. We then construct a Herfindahl Index of this ratio measuring the con-
centration of expertise across job classes among i’s contacts. To measure heterogeneity rather than con-
centration we subtract this measure of project experience concentration from one. As the expertise in i’s
32
network becomes more concentrated in a few project classes, the knowledge heterogeneity measure de-
creases.30 Reagans and McEvily (2003) construct a similar measure of ‘expertise overlap,’ although our
measure uses accounting records to record project experience (rather than self reports of expertise), and
weights the expertise in an employee’s network by the strength of their tie and the effort share of each
alter on each project. Our measure of experience heterogeneity also changes over time as recruiters com-
plete more projects of different types.
Demography. That demography could influence performance, learning capabilities and the vari-
ety of ideas to which individuals have access has been well documented (e.g. Pfeffer 1983, Ancona and
Caldwell 1992, Reagans and Zuckerman 2001). Older employees may have prior related knowledge on a
wider variety of topics or may be more aware of experts in the organization. Employment discrimination
and interpersonal differences could also impact the relative performance and information seeking and
sharing habits of men and women. We therefore control for the age and gender of employees.
Human Capital. Greater industry experience, education or individuals’ organizational status could
also create variation in access to diverse and novel information and performance. As individuals gain ex-
perience, they may collect expertise across several domains, reflected in communications across multiple
subjects or topics. It could also be that as individuals gain experience, they specialize and focus their
work and their communication on a limited number of topics. We therefore control for the level of educa-
tion, industry experience measured by the number of years employees have worked in executive recruit-
ing, and organizational position. As employees occupy one of three positions in the firm – partner, con-
sultant or researcher – we include dummy variables for each of these positions to account for authority
and status differentials that could explain variation in both access to information and performance.
Total Communication Volume. We are interested both in the total amount of novel information
and the importance of network structure holding communication volume constant. Other studies have
demonstrated the importance of controlling for communication volume to isolate the effects of structural
variables (e.g. Cummings and Cross 2003). We therefore control for total email communication.

33
Individual Characteristics and Temporal Shocks. Some employees may simply be more social or
more ambitious, creating variation in information seeking habits and performance. To control for unob-
servable individual characteristics we test fixed effects specifications of each of our hypotheses. At the
same time, temporal shocks could affect demand for the firm’s services and subsequent information seek-
ing activities associated with more work. In our data, business exhibits seasonal variation. Demand for the
firm’s services picks up sharply in January and declines steadily through the next eight months. These
exogenous shocks to demand could drive simultaneous increases in project workload, information seeking
and revenue generation creating a spurious correlation between information flows and output. There could
also be non-seasonal transitory shocks to demand in a given year or a given month of a given year. For
this reason, we control for both seasonal and transitory variation in our data with dummy variables for
each month and year. Figure 7 displays visualizations of the expertise heterogeneity and information di-
versity variables by showing the distributions of past project experience over job classes and emails as-
signed to topics for five different recruiters.31
----- FIGURE 7 -----
Model Specification
We estimate relationships between network structure and information access, and between infor-
mation access and performance using panel data. We are interested in how variation in network structure
explains performance differentials across different individuals, and also in how changes in actors’ net-
works explain variation in their own information and performance over time. If network structure gener-
ates social capital by influencing information access, actors with larger, more diverse networks with
higher channel bandwidth should receive more novel information and perform better than their counter-
parts. However, evidence of variation between individuals cannot exclude the possibility that unobserved
heterogeneity in employees’ personal characteristics, such as ambition, gregariousness or social intelli-
gence, could simultaneously drive variation in network structure and performance. If unobserved charac-
teristics of individuals are correlated with the error terms in our models, pooled OLS estimation will pro-

34
duce biased parameter estimates. We therefore examine variation within and across individuals over time
using both fixed effects and random effects models to control for bias created by this unobserved hetero-
geneity and to examine variation within and across observations of individuals over time. As observations
in network data are not independent, we estimate a model of network autocorrelation of disturbances
which provides consistent estimates of coefficients and standard errors that are robust to both network and
temporal autocorrelation in panel data. Full details of our model specifications and estimation procedures
are provided in Appendix D.
RESULTS
THE DIVERSITY-BANDWIDTH TRADEOFF
By correlating changes in network diversity, structural equivalence and channel bandwidth with
changes in the diversity and novelty of incoming email over time, we were able to observe how changes
in recruiters’ network structure were associated with changes in the type of information they received. If
the diversity-bandwidth tradeoff regulates the receipt of novel information we should observe two phe-
nomena in our data. First, as recruiters’ networks become more diverse, we should see the bandwidth of
their communication channels contract. Second, we should observe increases in the receipt of novel in-
formation both as networks become more structurally diverse and as channel bandwidth expands. If these
conditions hold then a tradeoff between network diversity and channel bandwidth is creating countervail-
ing effects on the receipt of novel information.
We found strong evidence confirming the diversity-bandwidth tradeoff. As recruiters’ communi-
cated with contacts who were less well connected to each other and who occupied less structurally
equivalent positions in the network, the bandwidth of their communication channels to those contacts
contracted quite rapidly. For instance, we estimated that a one standard deviation increase in the structural
diversity of a recruiter’s network over time was associated on average with a 21% reduction in the band-
width of their communication channels (Models 1-3, Table 5, p < .01). As recruiters communicated more
with contacts who were themselves densely connected and structurally equivalent the bandwidth of their
35
communication channels expanded. There was a strong negative relationship between network diversity
and channel bandwidth (Table 5, Model 1:β = -.314, p < .01) and a strong positive relationship between
structural equivalence and channel bandwidth (Table 5, Model 1:β = .107, p < .05), indicating that as
networks became more diverse the thickness of communication channels narrowed. These results held
even when we controlled for network size and expertise heterogeneity in fixed effects models that also
hold constant time invariant heterogeneity across recruiters (Table 5, Models 1-3). We also found that
both greater network diversity and greater channel bandwidth were strongly associated with the receipt of
more diverse information and more total non-redundant information (Network Diversity: Table 6, Models
2 and 9, p <.01; Channel Bandwidth: Table 6, Models 4, p < .05 and 10, p < .01). These primary results
confirm that the diversity-bandwidth tradeoff regulates access to novel information. In secondary results
that follow we examine the conditions under which this tradeoff affects vision advantages.
----- TABLE 5 -----
In this organization, work is organized by geographic regions and knowledge domains. Recruiters
with diverse networks communicated with contacts whose prior experience and knowledge were hetero-
geneous, providing evidence of one mechanism through which diverse networks deliver diverse informa-
tion – by providing access to pools of heterogeneous expertise. This is reflected in the strong positive as-
sociation between expertise heterogeneity and network diversity in Models 6-10 in Table 5. In order to
contact peers with varied expertise, recruiters diversified their communication networks (communicated
with structurally distant alters) to reach across structural holes into local network neighborhoods that were
less well connected with their own. This confirms findings of prior work on the diversity of expertise in
networks rich in structural holes (Reagans and McEvily 2003, Rodan and Gallunic 2004) and lends sup-
port to a basic premise of brokerage theory - that disconnected network neighborhoods house dissimilar
expertise and knowledge which brokers tap by reaching across structural holes. However, as recruiters
began to reach into diverse, unconnected network neighborhoods seeking advice, information or support
from those who were unconnected to those they already communicated with, the bandwidth of their

36
communication channels decreased (Table 5, Models 1-5 and 8-10). That expertise heterogeneity was
negatively associated with channel bandwidth in pair wise correlations ( ρ = - .25 p < .05), random effects
models ( β = -.21 p < .01, Model 5) and in the more conservative fixed effects models ( β = -.095 p <
.10, Model 3) further corroborates this explanation of why diverse networks are associated with lower
channel bandwidth. Individuals whose contacts had diverse knowledge and experience communicated
more infrequently and with lower volume per channel with their contacts. This finding is consistent with
prior characterizations of the nature of weak tie relationships (Granovetter 1973, Uzzi 1996) and provides
new evidence about how information tends to flow through them.
It could be that to create more diverse networks, recruiters must cultivate new structurally distant
contacts (increasing their network size) and that limited time, energy and attention necessitate weaker,
more infrequent and therefore lower bandwidth communication with these contacts, an argument consis-
tent with the notion of network maintenance costs (Burt 1992). Interestingly however, reductions in chan-
nel bandwidth associated with greater network diversity do not seem to be driven solely by time and ef-
fort costs of network maintenance, but also by the nature of the relationships in sparse networks. The
positive parameter estimate on the network size variable in bandwidth regressions (Table 5, Models 4-5)
indicates that as recruiters cultivated more contacts the bandwidth of their communication channels wid-
ened rather than narrowing. If constraints on time and effort devoted to relationship maintenance alone
were driving channel bandwidth we would expect bandwidth to strictly decrease as size increased. On the
contrary, as recruiters communicated with more people, they also exchange more messages per contact.
Eventually however the expected constraints of actors’ finite time, energy and attention were ac-
tualized. The network size squared estimate on channel bandwidth is negative and significant in random
effects specifications indicating that the marginal increase in channel bandwidth was decreasing in net-
work size. The non-linear relationship between network size and channel bandwidth suggests that there
are simultaneous increases in network size and channel bandwidth in smaller networks, but that as net-
work size exceeds the normalized population mean, time and effort costs and the nature of weak tie rela-

37
tionships necessitate reductions in channel bandwidth (see Figure 8). Evidence concerning the mainte-
nance cost mechanism is not recognizable in fixed effects models which analyze variation within observa-
tions of recruiters over time, but rather only in random effects models that also consider variation between
recruiters. In our setting, the size of recruiters’ networks did not change enough from month to month to
observe the effects of changes in network size on recruiters’ own bandwidth. These differences are how-
ever visible between recruiters with networks of different sizes – recruiters with larger networks tended to
have greater channel bandwidth, but at a diminishing rate. Given these results do not hold in fixed effects
models, it is likely that unobserved heterogeneity between recruiters explains this difference. For instance,
more social or gregarious recruiters could have larger networks and could communicate more with each
contact on average and up to a certain network size.
Models 7-10 in Table 5 also show a strong positive, but non-linear relationship between network
size and network diversity: structural diversity was increasing in network size, but at a diminishing rate.
These results suggest that information benefits to larger networks are constrained in bounded organiza-
tional networks. As recruiters contacted more colleagues, the contribution of a marginal contact to the
structural diversity of a focal actor’s network was increasing, but at a diminishing rate. As individuals in
organizations meet more of their colleagues, the structural diversity offered by each new contact is less
than that of the last. Growth in ego network size is limited in terms of its ability to deliver access to di-
verse regions of the whole network. The implications of this tradeoff between size and structural diversity
complement Burt’s (1992: 167) concepts of “effective size” and “efficiency.”32 Figure 8 graphs the rela-
tionships among network size, network diversity and information diversity, clearly showing the positive,
non-linear relationships.
----- FIGURE 8 -----
Demographic variables had no effect on channel bandwidth in Models 4-5, while education had a
consistently negative relationship, perhaps indicating an ability of more educated employees to communi-
cate more efficiently with fewer messages per channel. Fixed and random effects models are relatively
consistent, except that network size and expertise heterogeneity variables only affected channel band-
38
width in random effects models, indicating that persistent variation in network size and expertise hetero-
geneity between individuals explained variation in channel bandwidth while changes in individuals’ net-
work size and network expertise heterogeneity over time did not. Changes in network diversity on the
other hand did explain changes in bandwidth over time. As recruiters’ networks became more structurally
diverse, the bandwidth of their communication channels contracted. Taken together, these results confirm
the tradeoff between diversity and bandwidth in our data.
THE DIVERSITY-BANDWIDTH TRADEOFF AND ACCESS TO NOVEL INFORMATION
If vision advantages exist and are regulated by the diversity-bandwidth tradeoff, we should ob-
serve positive effects of both network diversity and channel bandwidth on the receipt of diverse novel
information. Analyses estimating whether network diversity and channel bandwidth predict incoming in-
formation diversity ( IitID ) and total non-redundant information received ( I
itNRI ) are shown in Table 6.33
----- TABLE 6 -----
We found strong support for the basic argument that information benefits explain returns to struc-
tural diversity and brokerage. Network diversity was positively and significantly associated with greater
information diversity in incoming email. The first order diversity variable which measures the lack of
constraint in recruiters’ networks was highly significant in all specifications, while the average structural
equivalence of recruiters’ contacts did not influence access to diverse information controlling for network
size and first order structural diversity. A one standard deviation increase in network diversity was associ-
ated with ~ .15 standard deviation increase in incoming information diversity. These results demonstrate
that large diverse networks provide access to diverse information. The expertise heterogeneity of recruit-
ers’ contacts was positively correlated with the diversity of the information recruiters received in both
pair wise correlations (.23 p < .05, Table 4) and regression results (Table 6 Model 1). Controlling for total
communication volume, a one standard deviation increase in the expertise heterogeneity of recruiters’
contacts was associated with a .28 standard deviation increase in incoming information diversity (Model
39
1, p < .01). When the network diversity and structural equivalence terms were added to the estimation
(Model 2), the positive contribution of expertise heterogeneity to incoming information diversity was re-
duced by 75%, implying that network diversity and expertise heterogeneity are positively correlated and
that network diversity is a stronger predictor of access to diverse information than the expertise heteroge-
neity of recruiters’ contacts. As recruiters reached across structural holes they were not only communicat-
ing with those who had more diverse sets of expertise, but they were also receiving more diverse informa-
tion from their contacts as a result. This corroborates the story that network diversity in part provides di-
verse information by providing access to diverse pools of expertise. But it also confirms that variation in
network structure is a stronger predictor of access to diverse information than the expertise heterogeneity
of ego’s contacts.
As recruiters added network contacts, they received a greater diversity of information, but the
contribution to information diversity lessened with each additional contact, implying that there are dimin-
ishing marginal information benefits to larger networks. A one standard deviation increase in the size of
recruiters’ networks (approximately 8 additional contacts) was associated with a .5 standard deviation
increase in information diversity (Models 3-7, p < .01); while the coefficient on network size squared was
negative and significant indicating that there are diminishing marginal information benefits to network
size (Models 3-7, p < .01).34
Finally, channel bandwidth was also associated with access to more diverse information, confirm-
ing that the diversity-bandwidth tradeoff was regulating access to diverse information. A one standard
deviation increase in channel bandwidth was associated with a .085 standard deviation increase in infor-
mation diversity (Model 4, p < .05). When channel bandwidth was added to the specification, the magni-
tude of the estimated relationship between network diversity and information diversity increased implying
a negative correlation between network diversity and channel bandwidth – providing additional corrobo-
rating evidence of the tradeoff between the two.
While Models 1-7 in Table 6 estimate correlates of information diversity, Models 9-13 show that
the total volume of novel information flowing to recruiters was increasing in their network size, network

40
diversity and channel bandwidth. Expertise heterogeneity had a strong positive relationship with total
non-redundant information (Model 8, p < .01), until the network diversity and structural equivalence vari-
ables were added to the specification (Model 9), again demonstrating that recruiters accessed novel in-
formation by reaching across structural holes into diverse pools of expertise. Network diversity and chan-
nel bandwidth both had strong positive relationships with the total amount of novel information flowing
into actors’ inboxes (Model 10, p < .01), with a one standard deviation increase in bandwidth associated
with a .35 standard deviation increase in total novel information received (p < .01). As network size and
the thickness of channels increased, the total volume of novel information flowing into recruiters’ inboxes
also increased. These results demonstrate the importance of considering channel bandwidth, and the di-
versity-bandwidth tradeoff, when estimating relationships between network structure and access to di-
verse novel information. Bandwidth trades off with network diversity and has a strong positive relation-
ship with incoming information diversity and total non-redundant information, creating countervailing
effects on the information benefits to brokerage.
Although network diversity predicts both the diversity and the total amount of novel information
actors receive, the coefficient on network diversity drops by 66% when network size and channel band-
width are added to the specification. A one standard deviation increase in channel bandwidth was associ-
ated with a .35 standard deviation increase in total non-redundant information received, while a one stan-
dard deviation increase in network diversity was only associated with a .07 standard deviation increase in
total non-redundant information. These results imply that while structural diversity and channel band-
width both have a strong impact on the diversity of the information actors receive (per unit of informa-
tion), variation in the total amount of novel information received is determined mostly by the size of re-
cruiters’ contact networks and their channel bandwidth, drawing attention to the importance of the thick-
ness of communication channels and the number of contacts in providing larger total volumes of novel
information.
We also investigated how the diversity-bandwidth tradeoff behaved in different information envi-
ronments by examining the effects of the refresh rate, the size of the topic space and information overlap
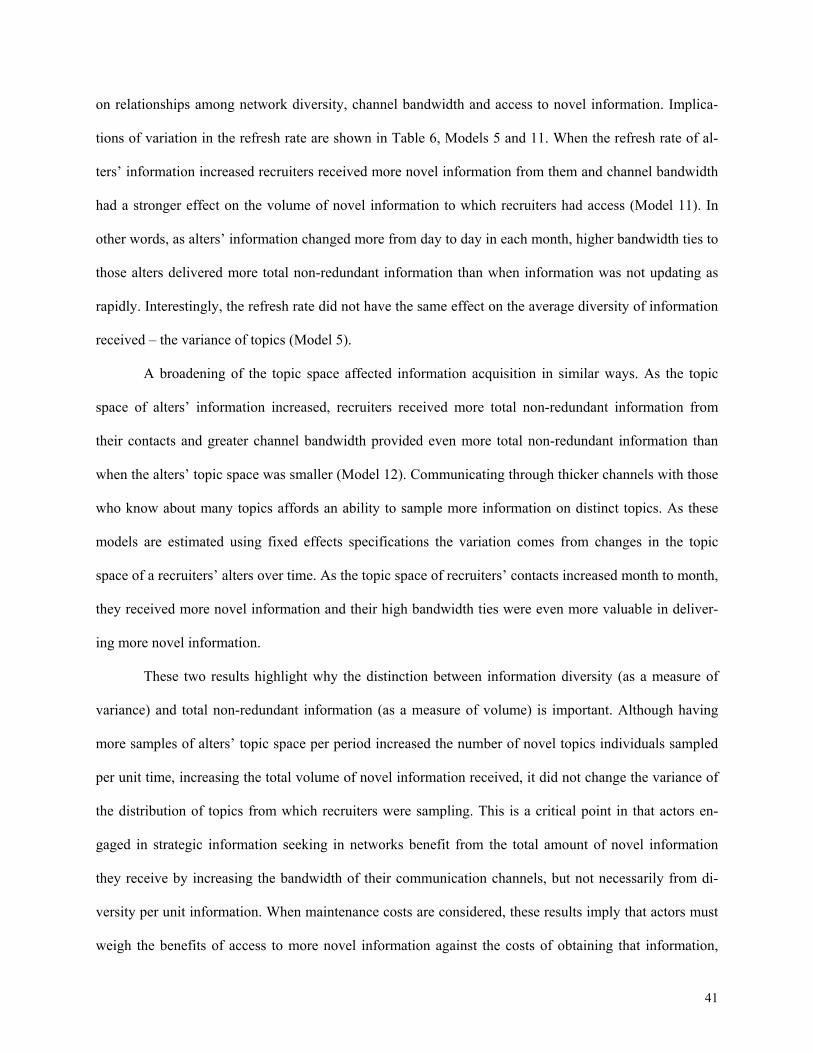
41
on relationships among network diversity, channel bandwidth and access to novel information. Implica-
tions of variation in the refresh rate are shown in Table 6, Models 5 and 11. When the refresh rate of al-
ters’ information increased recruiters received more novel information from them and channel bandwidth
had a stronger effect on the volume of novel information to which recruiters had access (Model 11). In
other words, as alters’ information changed more from day to day in each month, higher bandwidth ties to
those alters delivered more total non-redundant information than when information was not updating as
rapidly. Interestingly, the refresh rate did not have the same effect on the average diversity of information
received – the variance of topics (Model 5).
A broadening of the topic space affected information acquisition in similar ways. As the topic
space of alters’ information increased, recruiters received more total non-redundant information from
their contacts and greater channel bandwidth provided even more total non-redundant information than
when the alters’ topic space was smaller (Model 12). Communicating through thicker channels with those
who know about many topics affords an ability to sample more information on distinct topics. As these
models are estimated using fixed effects specifications the variation comes from changes in the topic
space of a recruiters’ alters over time. As the topic space of recruiters’ contacts increased month to month,
they received more novel information and their high bandwidth ties were even more valuable in deliver-
ing more novel information.
These two results highlight why the distinction between information diversity (as a measure of
variance) and total non-redundant information (as a measure of volume) is important. Although having
more samples of alters’ topic space per period increased the number of novel topics individuals sampled
per unit time, increasing the total volume of novel information received, it did not change the variance of
the distribution of topics from which recruiters were sampling. This is a critical point in that actors en-
gaged in strategic information seeking in networks benefit from the total amount of novel information
they receive by increasing the bandwidth of their communication channels, but not necessarily from di-
versity per unit information. When maintenance costs are considered, these results imply that actors must
weigh the benefits of access to more novel information against the costs of obtaining that information,

42
which makes the functional form of the relationship between novel information and performance particu-
larly salient – a relationship we consider in more detail below.
Finally, as the overlap of alters’ information topic spaces increased network diversity was less
useful for delivering more total non-redundant information (Table 6, Model 13). Perhaps counter intui-
tively however, greater information overlap in an ego network was associated with greater access to non-
redundant information. Upon reflection however, it is clear why this relationship is positive. As the topic
spaces of alters grew larger they were more likely to overlap but also more likely contain more total novel
information and thus to offer more novel topics to ego. This is confirmed by the fact that when topic
space was added to the specification in Model 13, the information overlap variable did not significantly
predict total non-redundant information.
In summary, network diversity and channel bandwidth both predict access to more diverse infor-
mation diversity and more total non-redundant information, although bandwidth is a more powerful pre-
dictor of the total volume of novel information received. As alters’ topic spaces grew larger and changed
more rapidly, bandwidth became more important for delivering novel information. In addition, the more
alters’ information overlapped, the less network diversity delivered novel information.
PERFORMANCE EFFECTS
Table 6 displays strong evidence of a positive relationship between access to non-redundant in-
formation and performance measured by revenues generated per month, projects completed per month,
and average project duration.35 We estimated both random effects and fixed effects specifications, but in
the interests of space only provide the more conservative fixed effects results in the text. Random effects
estimates were all in the same direction and stronger than the fixed effects results.
----- TABLE 7 -----
As recruiters’ structural diversity and channel bandwidth increased, they fulfilled contracts more quickly,
fulfilled more contracts per unit time and generated more revenue. 36 For example, a one standard devia-
tion increase in the bandwidth of communication channels was associated with just over $1,500 more
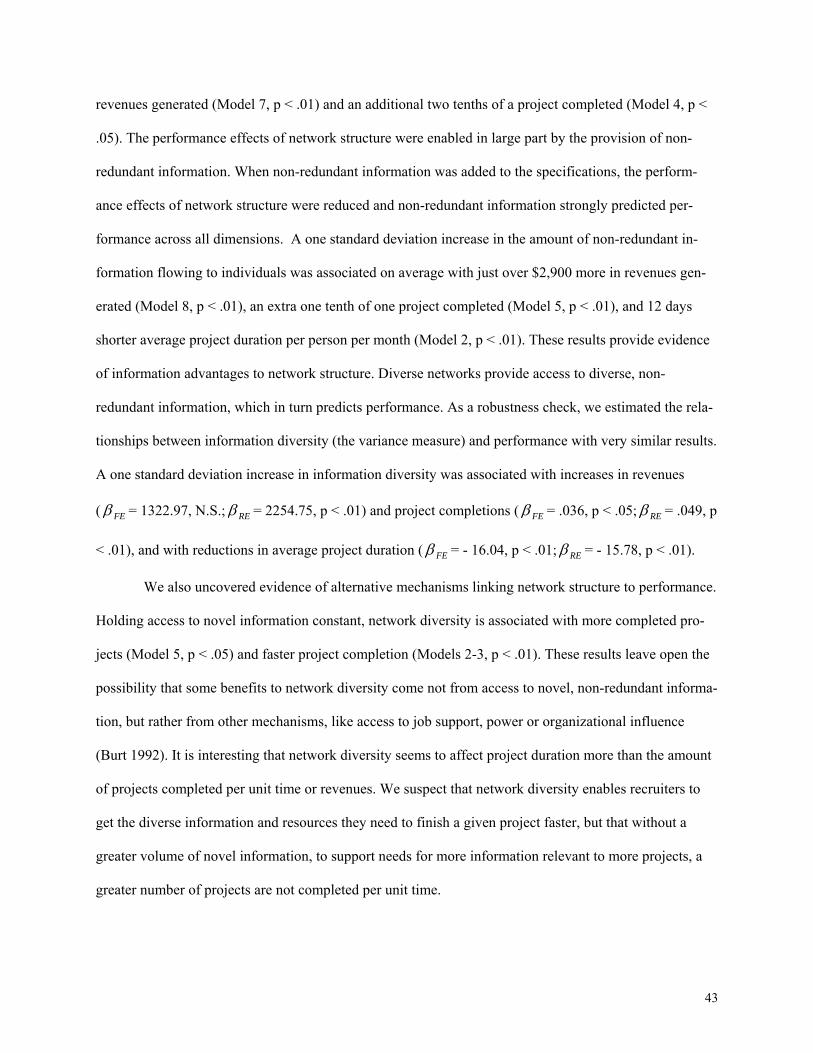
43
revenues generated (Model 7, p < .01) and an additional two tenths of a project completed (Model 4, p <
.05). The performance effects of network structure were enabled in large part by the provision of non-
redundant information. When non-redundant information was added to the specifications, the perform-
ance effects of network structure were reduced and non-redundant information strongly predicted per-
formance across all dimensions. A one standard deviation increase in the amount of non-redundant in-
formation flowing to individuals was associated on average with just over $2,900 more in revenues gen-
erated (Model 8, p < .01), an extra one tenth of one project completed (Model 5, p < .01), and 12 days
shorter average project duration per person per month (Model 2, p < .01). These results provide evidence
of information advantages to network structure. Diverse networks provide access to diverse, non-
redundant information, which in turn predicts performance. As a robustness check, we estimated the rela-
tionships between information diversity (the variance measure) and performance with very similar results.
A one standard deviation increase in information diversity was associated with increases in revenues
( FEβ = 1322.97, N.S.; REβ = 2254.75, p < .01) and project completions ( FEβ = .036, p < .05; REβ = .049, p
< .01), and with reductions in average project duration ( FEβ = - 16.04, p < .01; REβ = - 15.78, p < .01).
We also uncovered evidence of alternative mechanisms linking network structure to performance.
Holding access to novel information constant, network diversity is associated with more completed pro-
jects (Model 5, p < .05) and faster project completion (Models 2-3, p < .01). These results leave open the
possibility that some benefits to network diversity come not from access to novel, non-redundant informa-
tion, but rather from other mechanisms, like access to job support, power or organizational influence
(Burt 1992). It is interesting that network diversity seems to affect project duration more than the amount
of projects completed per unit time or revenues. We suspect that network diversity enables recruiters to
get the diverse information and resources they need to finish a given project faster, but that without a
greater volume of novel information, to support needs for more information relevant to more projects, a
greater number of projects are not completed per unit time.

44
Across the board, access to non-redundant information had diminishing marginal performance re-
turns for each of our performance measures (Models 3, 6 and 9). These parameter estimates suggest that
the marginal performance impacts of novel information are lower when employees already have access to
significant amounts of novel information. In fact, as the graphs in Figure 9 demonstrate, there seem to be
negative returns to more novel information beyond the normalized mean.37 These non-linearities in the
value of novel information likely arise for at least two reasons. First, beyond the threshold for decision
relevance, new information adds no value. Second, employees’ capacity to process new information can
be constrained as excess novel information becomes burdensome or distracting. These explanations are
consistent with theories of bounded rationality, limited cognitive capacity, and information overload.
----- FIGURE 9 -----
DISCUSSION
Structural theories of social capital and brokerage have developed to a significant extent around
intuitions and anecdotal evidence about the relationship between social structure and information flow.
This body of theory makes intuitively appealing arguments about how information is likely to be distrib-
uted in networks and how different types of information are likely to accrue to individuals in different
structural positions (Simmel 1922 (1955), Moreno 1940, Granovetter 1973, Baker 1990, Burt 1992,
Padgett and Ansell 1993, Uzzi 1996, 1997, Podolny 2001, Reagans and Zuckerman 2001, Hansen 1999,
2002, Zuckerman and Reagans 2008a, b, Burt 2008). However, the actual information flowing between
individuals is rarely observed (Burt 2008), and we lack detailed dynamic theories of how social groups
access, share and distribute information under different network and environmental conditions.
This article develops a theory of how social actors gain access to novel information that accounts
for how stocks of information are distributed in a network as well as how information flows between con-
tacts. Specifically, we propose that a tradeoff exists between gathering novel information through more
diverse network structure versus gathering it through higher bandwidth communication channels. As di-
versity and bandwidth counterbalance one another, it is difficult to increase both simultaneously. More
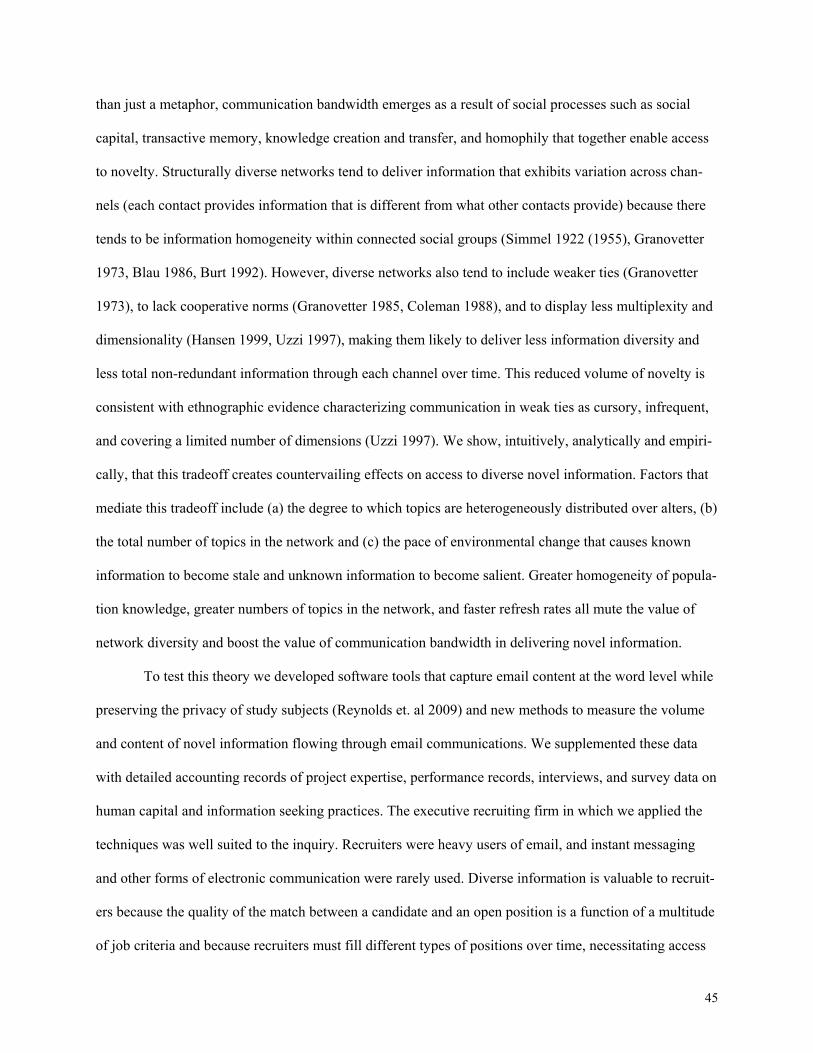
45
than just a metaphor, communication bandwidth emerges as a result of social processes such as social
capital, transactive memory, knowledge creation and transfer, and homophily that together enable access
to novelty. Structurally diverse networks tend to deliver information that exhibits variation across chan-
nels (each contact provides information that is different from what other contacts provide) because there
tends to be information homogeneity within connected social groups (Simmel 1922 (1955), Granovetter
1973, Blau 1986, Burt 1992). However, diverse networks also tend to include weaker ties (Granovetter
1973), to lack cooperative norms (Granovetter 1985, Coleman 1988), and to display less multiplexity and
dimensionality (Hansen 1999, Uzzi 1997), making them likely to deliver less information diversity and
less total non-redundant information through each channel over time. This reduced volume of novelty is
consistent with ethnographic evidence characterizing communication in weak ties as cursory, infrequent,
and covering a limited number of dimensions (Uzzi 1997). We show, intuitively, analytically and empiri-
cally, that this tradeoff creates countervailing effects on access to diverse novel information. Factors that
mediate this tradeoff include (a) the degree to which topics are heterogeneously distributed over alters, (b)
the total number of topics in the network and (c) the pace of environmental change that causes known
information to become stale and unknown information to become salient. Greater homogeneity of popula-
tion knowledge, greater numbers of topics in the network, and faster refresh rates all mute the value of
network diversity and boost the value of communication bandwidth in delivering novel information.
To test this theory we developed software tools that capture email content at the word level while
preserving the privacy of study subjects (Reynolds et. al 2009) and new methods to measure the volume
and content of novel information flowing through email communications. We supplemented these data
with detailed accounting records of project expertise, performance records, interviews, and survey data on
human capital and information seeking practices. The executive recruiting firm in which we applied the
techniques was well suited to the inquiry. Recruiters were heavy users of email, and instant messaging
and other forms of electronic communication were rarely used. Diverse information is valuable to recruit-
ers because the quality of the match between a candidate and an open position is a function of a multitude
of job criteria and because recruiters must fill different types of positions over time, necessitating access

46
to different types of information on different criteria. The information on whether a candidate is a good
colleague, for example, is not the same in source or in kind as the information on where she attended col-
lege. Having more information about a variety of candidates and jobs makes matching the two easier. The
results of statistical analyses demonstrate this point and bring empirical evidence to bear on both the value
of information and the information based mechanisms through which social networks create value.
We found strong evidence of a diversity-bandwidth tradeoff. As network diversity increased
channel bandwidth fell, and both diversity and bandwidth delivered novel information. These results,
which held across multiple models controlling for multiple factors, provide both empirical validation and
additional nuance to the original vision advantage argument. In accordance with existing theory, reaching
across structural holes matters for the acquisition of novel information. As recruiters communicated
across structural holes, they tended to tap contacts with varied expertise and to receive more diverse in-
formation from them. However, they paid for this diversification by foregoing communication bandwidth
which, all else equal, reduced the total volume of novel information they were receiving through thicker
bandwidth channels. Our characterization of novelty gave us further insight into this mechanism. We con-
sidered both the diversity of the information received (the variance of topics) as well as the total amount
of non-redundant information received (the volume of novel topics). While structural diversity and chan-
nel bandwidth both strongly predicted greater information variance and the total volume of non-redundant
information, bandwidth was a stronger predictor of the volume of novel information. While reaching
across structural holes tended to widen the variance of the topics received, the overall volume of novel
information tended to wane due to a contraction in the bandwidth of communication channels. These re-
sults imply that the likely outcome of structural diversification depends on the strength of the diversity-
bandwidth tradeoff and the environment in which diversification takes place.
We also found support for each of the three main environmental conditions hypothesized to mod-
erate the effects of the diversity-bandwidth tradeoff. When the information of recruiters’ contacts changed
more rapidly from day to day and when they were aware of a larger number of topics, bandwidth was
even more influential in providing access to novel information. On the other hand, when the information

47
overlap between recruiters’ contacts was higher, network diversity had a greater impact on access to novel
information. These findings suggest that information benefits, vision advantages, and returns to brokerage
are contingent on the information environments in which brokers find themselves. The prevailing wisdom
among sociologists over the last forty years has been that the strength of weak ties and information advan-
tages to brokerage operate with a fair degree of regularity across contexts (Centola and Macy 2007). In
contrast, our analysis shows that context matters. In certain information environments, brokers with many
bridging ties to disparate parts of a social network can have disadvantaged access to novel information
because their lower bandwidth communication constrains the volume of novelty they receive.
High bandwidth channels are more important in turbulent environments in which information is
changing rapidly. Several critical implications follow from this result. First, the prevailing view that in-
formation redundancy exists in dense cohesive networks ignores the fact that the information each actor
has may be rapidly changing at the same time, even when holding constant changes created by informa-
tion coming to them from social contacts. A densely connected group of arbitrageurs in New York might
all know each other well but may also constantly get new information from one another because what
each person knows moment by moment changes. Second, weak, structurally diverse ties provide informa-
tion at a lower rate, with less frequency, less complexity, and more delay. Weak ties are more likely to
deliver obsolete information. By the time it gets to ego, the information is less actionable. In the classic
case of job market opportunities or other time sensitive settings such as stock traders exchanging tips, the
number of relevant and useful opportunities delivered by diverse-low bandwidth ties is likely to be lower
than that delivered by cohesive-high bandwidth ties. This is compounded by the fact that our high fre-
quency ties are more likely to know what we need than our infrequent contacts and are therefore more
likely to volunteer relevant information in a timely manner. Such thinking highlights the need to consider
timely access to novel information rather than simply considering information access in general.
Two important questions follow from the dependence of vision advantages on information turbu-
lence: which social environments are more turbulent, and is society moving toward more information tur-
bulence overall? The implications for brokerage are clear – if turbulence makes high bandwidth channels

48
more important for access to novel information, then vision advantages from brokerage positions are less
likely in social and economic sectors where the general stock of knowledge changes rapidly. If turbulence
increases population heterogeneity, then diverse structure can remain salient. But if society is moving
toward greater information turbulence with similar heterogeneity then, over time, brokerage positions
may become less useful for vision advantages than leadership positions in cohesive cliques. Turbulent
environments in which key environmental variables change quickly or a large number of new events oc-
cur within a given period of time have been described as post-industrial (Bell 1973, Huber 1984), high-
velocity (Eisenhardt 1989) or time sensitive (Glazer and Weiss 1993) and are typically associated with
markets where information technology plays a critical role (Glazer 1991). Incorporating the rate of envi-
ronmental change and information turbulence into brokerage theory could explain why brokerage is sali-
ent in some industries but not others.
High bandwidth channels also deliver more non-redundant information in high dimensional in-
formation environments in which knowledge is complex and comprised of many distinct topics. It is not
surprising that evidence contradicting the predictions of brokerage theory typically emerges in R&D
(Reagans and McEvily 2003), innovation (Obsfeld 2005) and the creative arts (Uzzi & Spiro 2005). In
these settings new novelty is produced by exploiting interactions between complex complementary ideas.
In high dimensional information environments, innovation is born of union strategies that connect alters
rather than disunion strategies that keep them apart (Obsfeld 2005). Prior work describes these effects as
resulting from complex interactions, collaborations and brainstorming that are more likely to occur in
dense cohesive networks in which strong ties are prevalent. Our work provides an additional underlying
mechanism supporting this argument: increasing the volume of novel information flowing between col-
laborators supports innovation even more in high dimensional information environments. In contrast,
when efficiency rather than innovation matters, weaker ties are sufficient. Ideas from supply chain man-
agers, who were asked to provide “the one thing you would change to improve [the company’s] supply
chain management” in 2000 characters or less, were rated higher in peer evaluations when their networks
were rich in structural holes (Burt 2004). We speculate that these contrasting results can be explained by
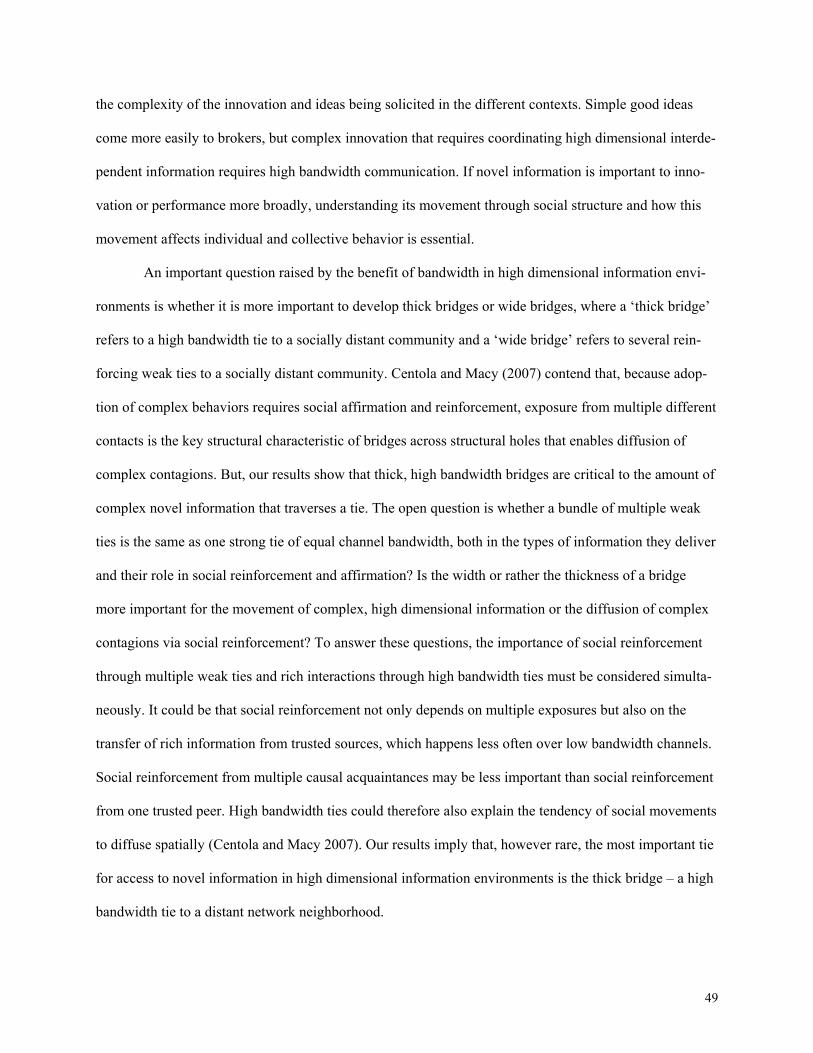
49
the complexity of the innovation and ideas being solicited in the different contexts. Simple good ideas
come more easily to brokers, but complex innovation that requires coordinating high dimensional interde-
pendent information requires high bandwidth communication. If novel information is important to inno-
vation or performance more broadly, understanding its movement through social structure and how this
movement affects individual and collective behavior is essential.
An important question raised by the benefit of bandwidth in high dimensional information envi-
ronments is whether it is more important to develop thick bridges or wide bridges, where a ‘thick bridge’
refers to a high bandwidth tie to a socially distant community and a ‘wide bridge’ refers to several rein-
forcing weak ties to a socially distant community. Centola and Macy (2007) contend that, because adop-
tion of complex behaviors requires social affirmation and reinforcement, exposure from multiple different
contacts is the key structural characteristic of bridges across structural holes that enables diffusion of
complex contagions. But, our results show that thick, high bandwidth bridges are critical to the amount of
complex novel information that traverses a tie. The open question is whether a bundle of multiple weak
ties is the same as one strong tie of equal channel bandwidth, both in the types of information they deliver
and their role in social reinforcement and affirmation? Is the width or rather the thickness of a bridge
more important for the movement of complex, high dimensional information or the diffusion of complex
contagions via social reinforcement? To answer these questions, the importance of social reinforcement
through multiple weak ties and rich interactions through high bandwidth ties must be considered simulta-
neously. It could be that social reinforcement not only depends on multiple exposures but also on the
transfer of rich information from trusted sources, which happens less often over low bandwidth channels.
Social reinforcement from multiple causal acquaintances may be less important than social reinforcement
from one trusted peer. High bandwidth ties could therefore also explain the tendency of social movements
to diffuse spatially (Centola and Macy 2007). Our results imply that, however rare, the most important tie
for access to novel information in high dimensional information environments is the thick bridge – a high
bandwidth tie to a distant network neighborhood.
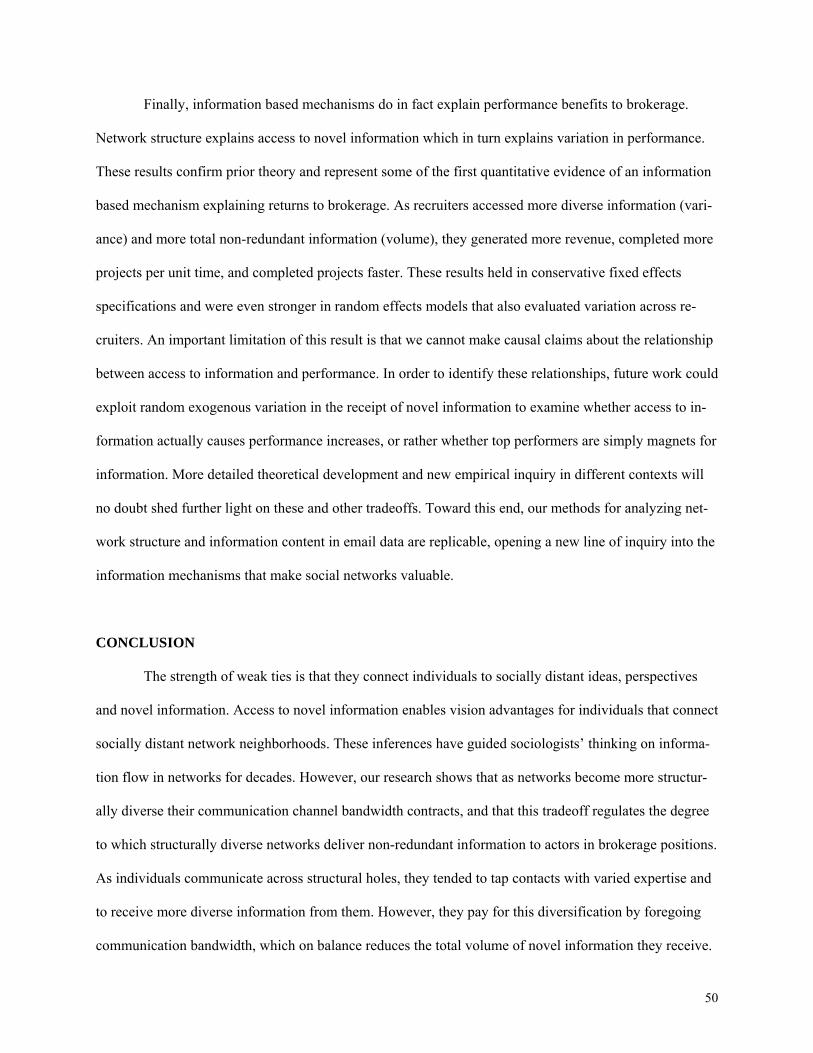
50
Finally, information based mechanisms do in fact explain performance benefits to brokerage.
Network structure explains access to novel information which in turn explains variation in performance.
These results confirm prior theory and represent some of the first quantitative evidence of an information
based mechanism explaining returns to brokerage. As recruiters accessed more diverse information (vari-
ance) and more total non-redundant information (volume), they generated more revenue, completed more
projects per unit time, and completed projects faster. These results held in conservative fixed effects
specifications and were even stronger in random effects models that also evaluated variation across re-
cruiters. An important limitation of this result is that we cannot make causal claims about the relationship
between access to information and performance. In order to identify these relationships, future work could
exploit random exogenous variation in the receipt of novel information to examine whether access to in-
formation actually causes performance increases, or rather whether top performers are simply magnets for
information. More detailed theoretical development and new empirical inquiry in different contexts will
no doubt shed further light on these and other tradeoffs. Toward this end, our methods for analyzing net-
work structure and information content in email data are replicable, opening a new line of inquiry into the
information mechanisms that make social networks valuable.
CONCLUSION
The strength of weak ties is that they connect individuals to socially distant ideas, perspectives
and novel information. Access to novel information enables vision advantages for individuals that connect
socially distant network neighborhoods. These inferences have guided sociologists’ thinking on informa-
tion flow in networks for decades. However, our research shows that as networks become more structur-
ally diverse their communication channel bandwidth contracts, and that this tradeoff regulates the degree
to which structurally diverse networks deliver non-redundant information to actors in brokerage positions.
As individuals communicate across structural holes, they tended to tap contacts with varied expertise and
to receive more diverse information from them. However, they pay for this diversification by foregoing
communication bandwidth, which on balance reduces the total volume of novel information they receive.

51
In turbulent and high dimensional information environments, the diversity-bandwidth tradeoff implies
that brokers with bridging ties to disparate parts of a social network may actually have disadvantaged ac-
cess to novel information because their lower bandwidth communication curbs the total volume of re-
ceived novelty. These findings suggest that information advantages to brokerage are contingent on the
information environments in which brokers find themselves.
References Allen, T.J. 1977. Managing the Flow of Technology. MIT Press, Cambridge, MA. Ancona, D.G. and Caldwell, D.F. 1992. “Demography and Design: Predictors of new Product Team Per-
formance.” Organization Science, 3(3): 321-341. Aral, S., Brynjolfsson, E., and Van Alstyne, M. 2006. “Information, Technology and Information Worker
Productivity: Task Level Evidence.” Proceedings of the 27th Annual International Conference on In-formation Systems, Milwaukee, WI.
Aral, S., Brynjolfsson, E., and Van Alstyne, M. 2007. “Productivity Effects of Information Diffusion in Networks.” Proceedings of the 28th Annual International Conference on Information Systems, Mont-real, CA.
Argote, L. 1999. Organizational Learning: Creating, Retraining and Transferring Knowledge. Kluwer Academic, Boston, MA.
Baker, Wayne E. 1984. "The Social Structure of a National Securities Market." American Journal of So-ciology 89:775-811.
Baker, W. 1990. "Market Networks and Corporate Behavior." American Journal of Sociology 96:589-625.
Baum, J.A.C., and Oliver, C. 1992. “Institutional Embeddedness and the Dynamics of Organizational Populations. American Sociological Review, (57:4): 540-559.
Bell, D. 1973. The Coming of Post-Industrial Society. Basic Books, New York. Bernard, H.R., Killworth, P., and Sailor, L. 1981. “Summary of research on informant accuracy in net-
work data and the reverse small world problem.” Connections, (4:2): 11-25. Blau, PM. 1986. Exchange and Power in Social Life. Transaction Publishers. London, UK. Bulkley, N. and Van Alstyne, M. 2004. “Why Information Influence Should Productivity” The Network
Society: A Global Perspective; Manuel Castells (ed.). Edward Elgar Publishers. pp: 145-173. Burt, R. 1987. “Social Contagion and Innovation: Cohesion versus Structural Equivalence.” American
Journal of Sociology, 92: 1287-1335. Burt, R. 1992. Structural Holes: The Social Structure of Competition. Harvard University Press, Cam-
bridge, MA. Burt, R. 2000. “The network structure of social capital” In B. Staw, and Sutton, R. (Ed.), Research in or-
ganizational behavior (Vol. 22). New York, NY, JAI Press. Burt, R. 2004a. “Structural Holes and Good Ideas” American Journal of Sociology, (110): 349-99. Burt, R. 2004b. “Where to get a good idea: Steal it outside your group.” As quoted by Michael Erard in
The New York Times, May. Burt, R. 2005. Brokerage and Closure: An Introduction to Social Capital. Oxford University Press. New
York, NY. Burt, R. 2008. “Information and structural holes: comment on Reagans and Zuckerman.” Industrial and
Corporate Change, 17(5): 953-969.

52
Centola, D., and Macy, M. 2007. “Complex Contagions and the Weakness of Long Ties.” American Journal of Sociology. 113 (3) (November): 702–34.
Coleman, J.S. 1988. “Social Capital in the Creation of Human Capital” American Journal of Sociology, (94): S95-S120.
Cohen, W.M. and D.A. Levinthal. 1990. “Absorptive Capacity: A New Perspective on Learning and In-novation.” Administrative Science Quarterly (35:1): 128-152.
Cramton, C.D. 2001. “The Mutual Knowledge Problem and its Consequences for Dispersed Collabora-tion.” Organization Science, 12(3), 346-371.
Cummings, J., and Cross, R. 2003. “Structural properties of work groups and their consequences for per-formance.” Social Networks, 25(3):197-210.
Cummings, J. 2004. “Work groups, structural diversity, and knowledge sharing in a global organization." Management Science, 50(3), 352-364.
Currarini, S., Jackson, M.O., and Pin, P. 2009. “An Economic Model of Friendship: Homophily, Minori-ties and Segregation,” Econometrica, 77(4): 1003-1045.
Currarini, S., Jackson, M.O., and Pin, P. 2010. “Identifying the roles of race-based choice and chance in high school friendship network formation,” Proceedings of the National Academy of Sciences, 107(11): 4857-4861.
Drew, P. and J. Heritage. 1992. Talk at Work: Interaction in Institutional Settings. Paul Drew and John Heritage editors. Cambridge University Press. Cambridge, UK.
Eliasoph, N. 1996. “Making a Fragile Public: A Talk-Centered Study of Citizenship and Power.” Socio-logical Theory, (14): 262-289.
Eisenhardt, K. 1989. “Making Fast Strategic Decisions in High Velocity Environments,” Academy of Management Journal, 32: 543-76.
Finlay, W. and Coverdill, J.E. 2000. “Risk, Opportunism and Structural Holes: How headhunters manage clients and earn fees.” Work and Occupations, (27): 377-405.
Friedkin, N.E. 1984. “Structural Cohesion and Equivalence Explanations of Social Homogeneity.” Socio-logical Methods and Research 12: 235-261.
Gibson, D.R. 2005. “Taking Turns and Talking Ties: Networks and Conversational Interaction.” Ameri-can Journal of Sociology, 110(6): 1561-1597.
Glazer, R. 1991. “Marketing in Information-Intensive Environments: Strategic Implications of Knowl-edge as an Asset,” Journal of Marketing, 55: 1-19.
Glazer, R. and Weiss, A.M. 1993. “Marketing in Turbulent Environments: Decision Processes and the Time-Sensitivity of Information,” Journal of Marketing Research, 30(4): 509-521.
Goffman, E. 1961. Encounters. Bobbs-Merrill, New York. Granovetter, M. 1973. “The strength of weak ties.” American Journal of Sociology (78):1360-80. Granovetter, M. 1978. “Threshold models of collective behavior.” American Journal of Sociology
(83:6):1420-1443. Granovetter, M. 1985. “Economic Action and Social Structure: The Problem of Embeddedness.” Ameri-
can Journal of Sociology (91):1420-1443. Granovetter, M. 1992. “Problems of Explanation in Economic Sociology.” In N. Nohria and R.G. Eccles
(eds.), Networks and Organizations: 25-56. Harvard Business School Press, Boston. Hansen, M. 1999. "The search-transfer problem: The role of weak ties in sharing knowledge across or-
ganization subunits." Administrative Science Quarterly (44:1): 82-111. Hansen, M. 2002. "Knowledge networks: Explaining effective knowledge sharing in multiunit compa-
nies." Organization Science (13:3): 232-248. Hargadon, A. and R, Sutton. 1997. “Technology brokering and innovation in a product development
firm.” Administrative Science Quarterly, (42): 716-49.
53
Heider, F. 1958. The Psychology of Interpersonal Relations. Wiley. New York. Helper, S. MacDuffie, J.P., and C. Sabel. (2000). “Pragmatic Collaborations: Advancing Knowledge
While Controlling Opportunism.” Industrial and Corporate Change, 9(3): 443-488. Hinds, P. and Kiesler, S. 2002. Distributed Work. MIT Press. Cambridge, MA. Huber, G. 1984. “The Nature and Design of Post-Industrial Organizations,” Management Science, 30:
928-51. Lave, J. and Wenger, E. 1991. Situated Learning: Legitimate Peripheral Participation. Cambridge Univer-
sity Press, New York. Lazer, D. and Friedman, A. 2007. The Network Structure of Exploration and Exploitation. Administrative
Sciences Quarterly, 52: 667-694. Liang, D.W., Moreland, R. and Argote, L. 1995. “Group Versus Individual Training and Group Perform-
ance: The Mediating Role of Transactive Memory.” Personality and Social Psychology Bulletin, 21(4): 384-393.
Lichterman, P. 1996. The Search for Political Community: American Activists Reinventing Commitment. University of Cambridge Press, Cambridge, UK.
Lin, N. 2002. Social Capital: A Theory of Social Structure and Action. Cambridge University Press, Cambridge.
Kempe, D., Kleinberg, J., and E. Tardos. 2003. “Maximizing the spread of influence through a social network” Proceedings of the 9th ACM SIGKDD, Washington, D.C.: 137-146.
Krackhardt, D. 1987. “Cognitive Social Structures.” Social Networks, 9(2): 109-134. Krackhardt, D. 1990. “Assessing the Political Landscape: Structure, Cognition and Power in Organiza-
tions.” Administrative Science Quarterly, 35: 342-369. Krackhardt, D. and Kilduff, M. 1999. “Whether close or far: Social distance effects on perceived balance
in friendship networks.” Journal of personality and social psychology, (76) 770-82. Kossinets, G. and D. Watts. 2006. “Empirical Analysis of an Evolving Social Network.” Science
(311:5757): 88-90. Kossinets, G. and D. Watts. 2009. “Origins of Homophily in an Evolving Social Network.” American
Journal of Sociology, 115(2): 405-50. Kumbasar, E., Romney, A.K., and Batchelder, W.H. 1994. “Systematic biases in social perception.”
American Journal of Sociology, (100): 477-505. March, J.G. 1991. “Exploration and exploitation in organizational learning.” Organization Science 2(1):
71-87. Marsden, P. 1990. “Network Data and Measurement.” Annual Review of Sociology (16): 435-463. McLean, P. 1998. “A Frame Analysis of Favor Seeking in the Renaissance: Agency, Networks, and Po-
litical Culture.” American Journal of Sociology, (104): 51-91. McPherson, M., L. Smith-Lovin and J. Cook. 2001. “Birds of a Feather: Homophily in Social Networks.”
Annual Review of Sociology 27: 415-444. Mische, A. and H.C. White. 1998. “Between Conversation and Situation: Public Switching Dynamics
Across Network Domains.” Social Research, 65(3): 695-724. Mische, A. 2000. “Cross-Talk in Movements: Reconceiving the Culture-Network Link.” Conference on
Social Movement Analysis: The Network Perspective, Ross Priory, Loch Lomond, Scotland. Montgomery, J.D. 1991. “Social Networks and Labor-Market Outcomes: Towards and Economic Analy-
sis.” American Economic Review. 81(5): 1408-1418. Newcomb, T.M. 1961. The Acquaintance Process. Holt, Rinehart and Winston. New York. Obstfeld, D. 2005. “Social networks, the tertius iungens orientation, and involvement in innovation.” Ad-
ministrative Science Quarterly, 50, 100–130.

54
Padgett, J.F., and C.K. Ansell. 1993. “Robust Action and the Rise of the Medici.” American Journal of Sociology, (98:6): 1259-1319.
Podolny, J. 1993. “A Status-Based Model of Market Competition.” American Journal of Sociology, (98:4): 829-872.
Podolny, J. 2001. “Networks as the Pipes and Prisms of the Market.” American Journal of Sociology, (107:1): 33-60.
Podolny, J., Baron, J. 1997. "Resources and relationships: Social networks and mobility in the work-place." American Sociological Review (62:5): 673-693.
Putnam, R.D. 1995. “Bowling Alone: America’s Declining Social Capital,” Journal of Democracy: 65-78. Reagans, R. and McEvily, B. 2003. “Network Structure and Knowledge Transfer: The Effects of Cohe-
sion and Range.” Administrative Science Quarterly, (48): 240-67. Reagans, R. and Zuckerman, E. 2001. "Networks, diversity, and productivity: The social capital of corpo-
rate R&D teams." Organization Science (12:4): 502-517. Reagans, R. and Zuckerman, E. 2008a. "Why Knowledge Does Not Equal Power: The Network Redun-
dancy Tradeoff." Industrial and Corporate Change, 17(5): 903-944. Reagans, R. and Zuckerman, E. 2008b. "All in the family: reply to Burt, Podolny, van de Rijt, Ban, and
Sarkar." Industrial and Corporate Change, 17(5): 979-999. Reynolds, M., Van Alstyne, M. Aral, S. 2009. “Privacy Preservation of Measurement Functions on
Hashed Text” Annual Security Conference. Dhillon, G. “Discourses in Security Assurance & Pri-vacy," Las Vegas, NV. April 15-16, 2009: Information Institute Publishing. p 41-45.
Rodan, S. and D. Galunic. 2004. “More Than Network Structure: How Knowledge Heterogeneity Influ-ences Managerial Performance and Innovativeness.” Strategic Management Journal (25): 541-562.
Rogers, E. 1995. The Diffusion of Innovation. Free Press. New York, NY. Salton, G., Wong, A., and Yang, C. S. 1975. “A Vector Space Model for Automatic Indexing.” Commu-
nications of the ACM, 18(11): 613-620. Schelling, T.C. 1978. Micromotives and Macrobehavior. George J. McLeod Ltd. Toronto, CA. Simmel, G. (1922) 1955. Conflict and the Web of Group Affiliation. Free Press. New York, NY. Simon, H. 1991. “Bounded Rationality and Organizational Learning.” Organization Science. (2:1): 125-
134. Sparrowe, R., Liden, R., Wayne, S., and Kraimer, M. 2001. “Social networks and the performance of in-
dividuals and groups.” Academy of Management Journal, 44(2): 316-325. Steinberg, M.W. 1999. “The talk and Back Talk of Collective Action: A Dialogic Analysis of Repertoires
of Discourse among Nineteenth-Century English Cotton Spinners.” American Journal of Sociology, (105): 736-780.
Swedberg, R. 1990. Economics and Sociology. Princeton, NJ: Princeton University Press. Szulanski, G. 1996. “Exploring internal stickiness: Impediments to the transfer of best practice within the
firm.” Strategic Management Journal (17): 27-43. Tsai, W. and Ghoshal, S. 1998. “Social Capital and Value Creation: The Role of Intrafirm Networks,”
Academy of Management Journal, 41(4): 464-476. Uzzi, B. 1996. “The Sources and Consequences of Embeddedness for the Economic Performance of Or-
ganizations: The Network Effect.” American Sociological Review, (61):674-98. Uzzi, B. 1997. “Social Structure and Competition in Interfirm Networks: The Paradox of Embeddedness.”
Administrative Science Quarterly, 42: 35-67. Uzzi, B & Spiro J. 2005. “Collaboration and Creativity: The Small World Problem” American Journal of
Sociology 111(2): 447-504. Van Alstyne, M. and Brynjolfsson, E “Global Village or CyberBalkans? Measuring and Modeling the
Integration of Electronic Communities”. Management Science; 51 (6) (June 2005): pp. 851-868

55
Van Alstyne, M. and Zhang, J. 2003. “EmailNet: A System for Automatically Mining Social Networks from Organizational Email Communication,” NAACSOS.
Walker, G., Kogut, B. and Shan, W. “Social Capital, Structural Holes and the Formation of an Industry Network.” Organization Science; 8(2): 109-125.
Watts, D. and S. Strogatz. 1998. “Collective Dynamics of ‘Small-World’ Networks.” Nature, 393: 440-442.
Watts, D. 1999. “Networks, Dynamics and the Small World Phenomenon.” American Journal of Sociol-ogy, 105(2):493-527.
Weick, K. 1979. The social psychology of organizing. Addison-Wesley, Reading, MA. Weitzman, M. 1998 “Recombinant Growth.” Quarterly Journal of Economics, 113(2): 331-360. Wenger, E. 1987. "Transactive Memory: A Contemporary Analysis of the Group Mind" Chapter 9 in
Theories of Group Behavior, B Mullen & G Goethals (eds): 185-208. White, H. 1980. “A heteroscedasticity-consistent covariance matrix estimator and a direct test for hetero-
scedasticity." Econometrica (48:4): 817-838. White, H. C. 1995. “Network Switchings and Bayesian Forks: Reconstructing the Social and Behavioral
Sciences.” Social Research. (62): 1035-1063. White, H. C. 2000. “Modeling Discourse in and around Markets.” Poetics. (27): 117-135. Wu, F., Huberman, B., Adamic, L., and J. Tyler. 2004. “Information Flow in Social Groups.” Physica A,
337: 327-335.

56
Tables
Table 1. Implications of the Diversity-Bandwidth Tradeoff for Access to Novel Information Theory Ego’s Perspective Alter’s Perspective Social Capital (e.g. Putnam 1995, Burt 1992, Tsai & Ghoshal 1998, Lin 2002)
Greater intimacy, trust, reciprocity and cooperation in cohesive-high bandwidth
networks makes ego more willing to request novel information from alter.
Greater intimacy, trust, reciprocity and cooperation in cohesive-high bandwidth
networks makes alter more willing to share novel information with ego.
Transactive Memory (e.g. Wegner 1987, Liang et. al. 1995)
Awareness of whom to ask and what to ask for in cohesive-high bandwidth net-works enables ego to request novel in-formation more effectively from alter.
Awareness of what to volunteer in cohe-sive-high bandwidth networks enables
alter to volunteer relevant novel informa-tion more effectively to ego.
Search-Transfer (e.g. Hansen 1999)
Close, frequent interaction and tight coupling in cohesive-high bandwidth
networks makes ego better able to com-prehend and thus receive novel informa-
tion from alter.
Close, frequent interaction and tight coupling in cohesive-high bandwidth
networks makes alter able to express and thus transfer novel information to ego.
Knowledge Creation (e.g. Uzzi 1996, 1997, Uzzi & Spiro 2005, Obstfeld 2005)
Embeddedness and cohesion enable ego to find synergies and connections be-
tween her information and alter’s infor-mation in order to generate new ideas
and new novel information.
Embeddedness and cohesion enable alter to find synergies and connections be-
tween her information and ego’s infor-mation in order to generate new ideas
and new novel information.
Homophily (e.g. McPherson et. al. 2001, Blau 1986, Uzzi 1997, Helper et. al. 2000)
Alters are more likely to have mutual interests with ego across a wider variety of topics inspiring multifaceted commu-nication and access to more of the differ-
ent dimensions of alters’ information.
Ego is more likely to have mutual inter-ests with alters across a wider variety of
topics inspiring alter to communicate more of the different dimensions of their
information.
Table 2. Summary of Hypotheses Domain Hypothesis Hypothesized Relationship
H1a Network diversity is positively associated with receiving more diverse information and more total non-redundant information.
H1b Network diversity is associated with lower channel bandwidth.
H1c Channel bandwidth is positively associated with receiving more diverse information and more total non-redundant information.
H2a The greater the information overlap among alters, the less valu-able structural diversity will be in providing access to novel in-formation.
H2b The broader the topic space, the more valuable channel band-width will be in providing access to novel information.
The Diversity-Bandwidth Tradeoff
H2c The higher the information refresh rate, the more valuable chan-nel bandwidth will be in providing access to novel information.
Performance Effects H3 Access to non-redundant and diverse information is positively associated with individual performance.
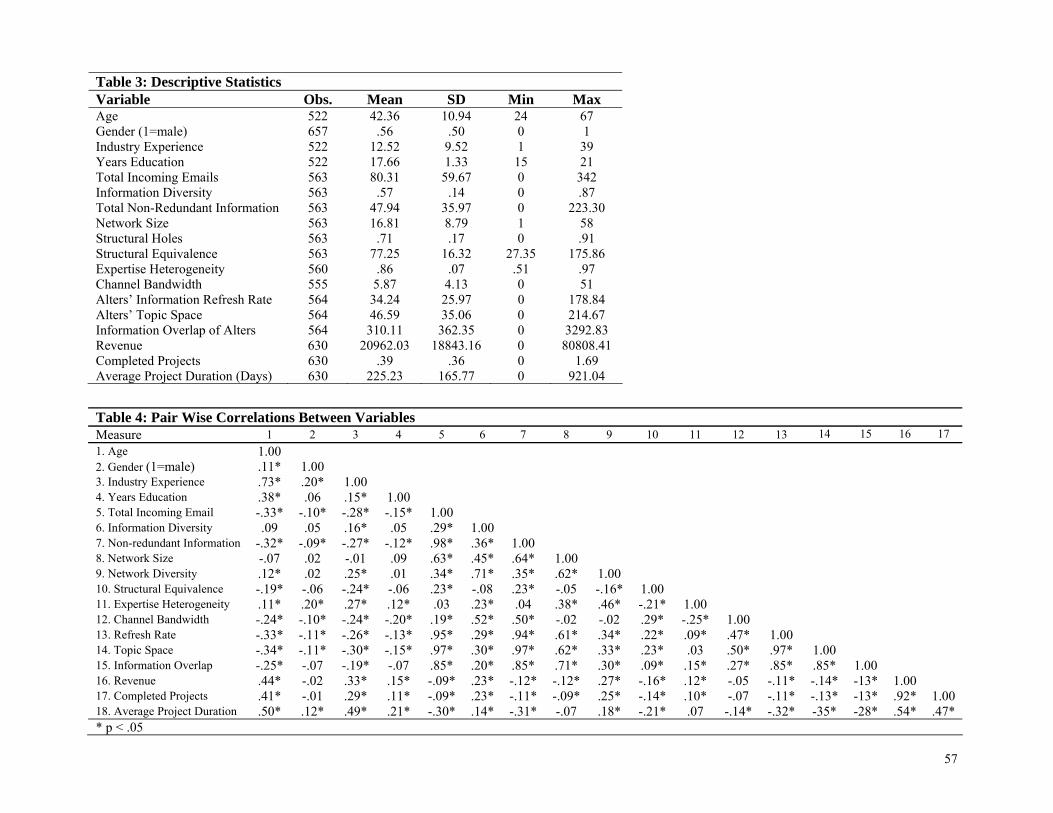
57
Table 4: Pair Wise Correlations Between Variables Measure 1 2 3 4 5 6 7 8 9 10 11 12 13 14 15 16 17 1. Age 1.00 2. Gender (1=male) .11* 1.00 3. Industry Experience .73* .20* 1.00 4. Years Education .38* .06 .15* 1.00 5. Total Incoming Email -.33* -.10* -.28* -.15* 1.00 6. Information Diversity .09 .05 .16* .05 .29* 1.00 7. Non-redundant Information -.32* -.09* -.27* -.12* .98* .36* 1.00 8. Network Size -.07 .02 -.01 .09 .63* .45* .64* 1.00 9. Network Diversity .12* .02 .25* .01 .34* .71* .35* .62* 1.00 10. Structural Equivalence -.19* -.06 -.24* -.06 .23* -.08 .23* -.05 -.16* 1.00 11. Expertise Heterogeneity .11* .20* .27* .12* .03 .23* .04 .38* .46* -.21* 1.00 12. Channel Bandwidth -.24* -.10* -.24* -.20* .19* .52* .50* -.02 -.02 .29* -.25* 1.00 13. Refresh Rate -.33* -.11* -.26* -.13* .95* .29* .94* .61* .34* .22* .09* .47* 1.00 14. Topic Space -.34* -.11* -.30* -.15* .97* .30* .97* .62* .33* .23* .03 .50* .97* 1.00 15. Information Overlap -.25* -.07 -.19* -.07 .85* .20* .85* .71* .30* .09* .15* .27* .85* .85* 1.00 16. Revenue .44* -.02 .33* .15* -.09* .23* -.12* -.12* .27* -.16* .12* -.05 -.11* -.14* -13* 1.00 17. Completed Projects .41* -.01 .29* .11* -.09* .23* -.11* -.09* .25* -.14* .10* -.07 -.11* -.13* -13* .92* 1.00 18. Average Project Duration .50* .12* .49* .21* -.30* .14* -.31* -.07 .18* -.21* .07 -.14* -.32* -35* -28* .54* .47* * p < .05
Table 3: Descriptive Statistics Variable Obs. Mean SD Min Max Age 522 42.36 10.94 24 67 Gender (1=male) 657 .56 .50 0 1 Industry Experience 522 12.52 9.52 1 39 Years Education 522 17.66 1.33 15 21 Total Incoming Emails 563 80.31 59.67 0 342 Information Diversity 563 .57 .14 0 .87 Total Non-Redundant Information 563 47.94 35.97 0 223.30 Network Size 563 16.81 8.79 1 58 Structural Holes 563 .71 .17 0 .91 Structural Equivalence 563 77.25 16.32 27.35 175.86 Expertise Heterogeneity 560 .86 .07 .51 .97 Channel Bandwidth 555 5.87 4.13 0 51 Alters’ Information Refresh Rate 564 34.24 25.97 0 178.84 Alters’ Topic Space 564 46.59 35.06 0 214.67 Information Overlap of Alters 564 310.11 362.35 0 3292.83 Revenue 630 20962.03 18843.16 0 80808.41 Completed Projects 630 .39 .36 0 1.69 Average Project Duration (Days) 630 225.23 165.77 0 921.04
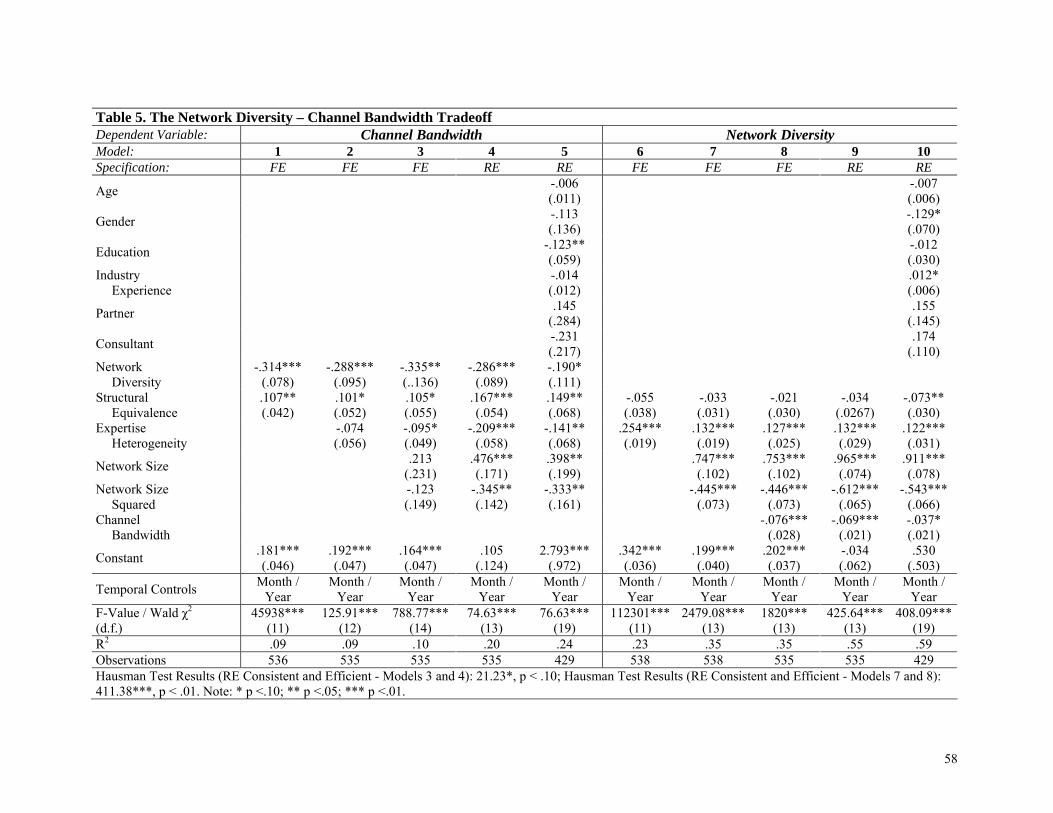
58
Table 5. The Network Diversity – Channel Bandwidth Tradeoff Dependent Variable: Channel Bandwidth Network Diversity Model: 1 2 3 4 5 6 7 8 9 10 Specification: FE FE FE RE RE FE FE FE RE RE
Age -.006 (.011) -.007
(.006)
Gender -.113 (.136) -.129*
(.070)
Education -.123** (.059) -.012
(.030) Industry
Experience -.014 (.012) .012*
(.006)
Partner .145 (.284) .155
(.145)
Consultant -.231 (.217) .174
(.110) Network
Diversity -.314***
(.078) -.288***
(.095) -.335** (..136)
-.286*** (.089)
-.190* (.111)
Structural Equivalence
.107** (.042)
.101* (.052)
.105* (.055)
.167*** (.054)
.149** (.068)
-.055 (.038)
-.033 (.031)
-.021 (.030)
-.034 (.0267)
-.073** (.030)
Expertise Heterogeneity -.074
(.056) -.095* (.049)
-.209*** (.058)
-.141** (.068)
.254*** (.019)
.132*** (.019)
.127*** (.025)
.132*** (.029)
.122*** (.031)
Network Size .213 (.231)
.476*** (.171)
.398** (.199) .747***
(.102) .753*** (.102)
.965*** (.074)
.911*** (.078)
Network Size Squared -.123
(.149) -.345** (.142)
-.333** (.161) -.445***
(.073) -.446***
(.073) -.612***
(.065) -.543***
(.066) Channel
Bandwidth -.076*** (.028)
-.069*** (.021)
-.037* (.021)
Constant .181*** (.046)
.192*** (.047)
.164*** (.047)
.105 (.124)
2.793*** (.972)
.342*** (.036)
.199*** (.040)
.202*** (.037)
-.034 (.062)
.530 (.503)
Temporal Controls Month / Year
Month / Year
Month / Year
Month / Year
Month / Year
Month / Year
Month / Year
Month / Year
Month / Year
Month / Year
F-Value / Wald χ2
(d.f.) 45938***
(11) 125.91***
(12) 788.77***
(14) 74.63***
(13) 76.63***
(19) 112301***
(11) 2479.08***
(13) 1820***
(13) 425.64***
(13) 408.09***
(19) R2 .09 .09 .10 .20 .24 .23 .35 .35 .55 .59 Observations 536 535 535 535 429 538 538 535 535 429 Hausman Test Results (RE Consistent and Efficient - Models 3 and 4): 21.23*, p < .10; Hausman Test Results (RE Consistent and Efficient - Models 7 and 8): 411.38***, p < .01. Note: * p <.10; ** p <.05; *** p <.01.

59
Table 6. Effects of Network Diversity and Channel Bandwidth on Access to Diverse, Novel Information Dependent Variable: Information Diversity Non-Redundant Information Model 1 2 3 4 5 6 7 8 9 10 11 12 13 Specification FE FE FE FE FE FE FE FE FE FE FE FE FE
Total Email Incoming .002** (.001)
.000 (.001)
-.001 (.001)
-.002* (.001)
-.002** (.001)
-.005***(.001)
-.002 (.001)
Expertise Heterogeneity .281*** (.054)
.073***(.023)
.028 (.019)
.037* (.021)
.035* (.019)
.032 (.020)
.037* (.021)
.181***(.026)
.099***(.030)
-.011 (.016)
-.010 (.019)
.0002 (.018)
-.007 (.023)
Network Diversity .232***(.062)
.145* (.083)
.155* (.083)
.161** (.075)
.165** (.071)
.139** (.095) .206***
(.072) .066** (.032)
.016 (.016)
.045** (.016)
-.036 (.043)
Structural Equivalence .012 (.042)
.019 (.045)
.021 (.036)
.024 (.040)
.027 (.040)
.017 (.035) -.032
(.041) -.007 (.049)
.012 (.007)
.007 (.004)
.008 (.033)
Network Size .439***(.102)
.505***(.105)
.485***(.069)
.488***(.069)
.468*** (.091) .668***
(.102) .231***(.030)
.115***(.019)
.161** (.050)
Network Size-Squared -.250***(.065)
-.259***(.054)
-.257***(.051)
-.256***(.053)
-.216*** (.067)
Channel Bandwidth .085** (.041)
.081** (.033)
.084** (.032)
.080** (.040) .352***
(.067) .120***(.030)
.060***(.011)
.201***(.051)
Refresh Rate .028 (.070) .642***
(.040)
Channel Bandwidth x Refresh Rate -.016
(.037) .077***(.009)
Topic Space .210 (.146) .832***
(.044)
Channel Bandwidth x Topic Space -.009
(.036) .037** (.017)
Information Overlap -.003 (.037) .638***
(.079) Network Diversity x
Information Overlap -.038 (.043) -.230**
(.076)
Constant -.456*** (.068)
.004 (.088)
.064 (.077)
.165 (.111)
.248** (.106)
.408***(.093)
.152 (.107)
-.172***(.021)
.371***(.041)
-.131***(.037)
-.012 (.017)
-.045***(.014)
.215***(.033)
Temporal Controls Month / Year
Month / Year
Month / Year
Month / Year
Month / Year
Month / Year
Month / Year
Month /Year
Month / Year
Month / Year
Month / Year
Month / Year
Month / Year
F-Value / Wald χ2
(d.f.) 6.6e4***
(11) 6994***
(13) 492.8***
(15) 97.32***
(16) 80.06***
(18) 374.1***
(18) 269.9***
(18) 4.6e5***
(10) 1.0e5***
(12) 333.5***
(14) 9845***
(16) 2976***
(16) 27960***
(16) R2 .14 .11 .14 .16 .16 .16 .16 .18 .19 .56 .86 .91 .75 Observations 556 538 538 535 535 535 535 556 538 535 535 535 535 * p <.10; ** p <.05; *** p <.01.

60
Table 7. Performance Effects of Network Diversity, Channel Bandwidth and Non-Redundant Information Dependent Variable: Project Duration Projects Completed Revenues Generated Model: 1 2 3 4 5 6 7 8 9 Specification FE FE FE FE FE FE FE FE FE Network Diversity
-16.02*** (3.90)
-14.15*** (3.39)
-12.28*** (3.53)
.037*** (.010)
.02** (.01)
.01 (.01)
802.2 (520.15)
365.44 (544.69)
-420.4 (479.47)
Bandwidth -5.35 (2.92)
-2.41 (4.22)
-1.57 (4.05)
.023** (.009)
.002 (.01)
-.01 (.01)
1585.3*** (493.79)
899.25* (467.81)
544.47 (517.18)
NRI -12.64*** (4.72)
-19.00*** (5.19) .10***
(.02) .16*** (.02) 2947.46***
(617.80) 5626.2*** (933.27)
NRI Squared 7.70*** (1.91) -.07***
(.01) -6858.8*** (1545.01)
Constant 307.96*** (.287)
305.04*** (1.17)
302.62*** (2.74)
.64*** (.004)
.66*** (.004)
.60*** (.01)
27865*** (276.15)
28545*** (227.28)
27447*** (438.83)
Temporal Controls
Month / Year
Month / Year
Month / Year
Month / Year
Month / Year
Month / Year
Month / Year
Month/ Year
Month / Year
F-Value
(d.f.) 1.8e6***
(11) 4.6e3***
(12) 4.3e3***
(13) 1.29e7***
(11) 1.4e5***
(12) 5.2e4***
(14) 1.78e6*
(11) 2.6e4**
(12) 3.2e4***
(13) R2 .08 .09 .10 .05 .08 .14 .05 .06 .10 Obs. 416 416 416 416 416 416 416 416 416 * p <.10; ** p <.05; *** p <.01

61
Figures
Figure 1. The Diversity – Bandwidth Tradeoff: As structural diversity increases, channel
bandwidth decreases.
Channel BandwidthLowHigh
Network DiversityLow High
Network of Strong, High Bandwidth
Ties
A Diverse Network of Weak, Low Bandwidth
Ties
Channel BandwidthLowHigh
Network DiversityLow High
A Cohesive Network of
Strong, High Bandwidth
Ties
A Diverse Network of Weak, Low Bandwidth
Ties

62
A’s greater structural diversity provides greater access to novel information when the information profiles of unconnected alters are heterogeneous.
The Traditional Weak Tie, Structural Hole Scenario:Diverse-Low Bandwidth Ties Are Preferred
Panel (1)
E[A] = 4 E[B] = 3¾>
A B
k
l
1, 2, 3, 4
j 5, 6, 7, 8 1, 2, 3, 4
i1, 2, 3, 4
B’s greater bandwidth overwhelms A’s advantage of bridging pools of novel information.
As the Diversity-Bandwidth Tradeoff Increases:Constrained-High Bandwidth Ties Are Preferred
Panel (2)
A B
k
l
1, 2, 3, 4
j 5, 6, 7, 8 1, 2, 3, 4
i1, 2, 3, 4
E[A] = 2 E[B] = 4<
B’s greater channel bandwidth can provide greater access to novel information when the information profiles of unconnected alters are less heterogeneous. Greater bandwidth provides more opportunities to receive novel information from contacts.
As Information Overlap Increases:Constrained-High Bandwidth Ties Are Preferred
A B
k
l
1, 2, 3, 4
j 1, 2, 7, 8 1, 2, 3, 4
i1, 2, 3, 4
Panel (3)
E[A] = 3 E[B] = 3¾<As topic space increases to twelve topics, B’s higher bandwidth provides greater potential access to novel information. Her contacts have more to cover and are less likely to mirror each other.
Panel (4)
E[A] = 4 E[B] = 5¼<
As the Topic Space Increases:Constrained-High Bandwidth Ties Are Preferred
1, 2, 3, 4,5, 6, 7, 8,9, 10, 11, 12
13, 14, 14, 16,17, 18, 19, 20,21, 22, 23, 24
A B
k
lj
i1, 2, 3, 4,5, 6, 7, 8,9, 10, 11, 12
1, 2, 3, 4,5, 6, 7, 8,9, 10, 11, 12
This panel simply updates Panel (1) over two periods. The environment refreshes only once per period. Expected novel information is therefore double. Diverse weak ties are preferred when populations are heterogeneous and environments are stable.
In Low Refresh Rate Environments: Diverse-Low Bandwidth Ties Are Preferred
Panel (5)
E[A |T1,T2] = 8 E[ B |T1,T2] = 7½>
B
k
l
T1 : 1, 2, 3, 4
T2 : 5, 6, 7, 8
T1 : 1, 2, 3, 4
T2 : 5, 6, 7, 8
A
j
iT1 : 1, 2, 3, 4
T2 : 5, 6, 7, 8
T1 : 9, 10, 11, 12:
T2 : 13, 14, 15, 16
Here, the environment updates twice each period. Shifting from person k to person l, B gets the full value of higher bandwidth because redundant information has already been refreshed. Cohesive strong times are preferred when environments are unstable.
Panel (6)
A
j
i
T1 : 1, 2, 3, 45, 6, 7, 8
T2 : 9, 10, 11, 1213, 14, 15, 16
In High Refresh Rate Environments: Constrained-High Bandwidth Ties Are Preferred
B
k
l
E[A |T1,T2] = 8 E[ B |T1,T2] = 12<
T1 : 17, 18, 19, 20 21, 22, 23, 24
T2 : 25, 26, 27, 2829, 30, 31, 32
T1 : 1, 2, 3, 45, 6, 7, 8
T2 : 9, 10, 11, 1213, 14, 15, 16
T1 : 1, 2, 3, 45, 6, 7, 8
T2 : 9, 10, 11, 1213, 14, 15, 16
A’s greater structural diversity provides greater access to novel information when the information profiles of unconnected alters are heterogeneous.
The Traditional Weak Tie, Structural Hole Scenario:Diverse-Low Bandwidth Ties Are Preferred
Panel (1)
E[A] = 4 E[B] = 3¾>
A B
k
l
1, 2, 3, 4
j 5, 6, 7, 8 1, 2, 3, 4
i1, 2, 3, 4
A’s greater structural diversity provides greater access to novel information when the information profiles of unconnected alters are heterogeneous.
The Traditional Weak Tie, Structural Hole Scenario:Diverse-Low Bandwidth Ties Are Preferred
Panel (1)
E[A] = 4 E[B] = 3¾>E[A] = 4 E[B] = 3¾>
A B
k
l
1, 2, 3, 4
j 5, 6, 7, 8 1, 2, 3, 4
i1, 2, 3, 4
A B
k
l
1, 2, 3, 4
j 5, 6, 7, 8j 5, 6, 7, 8 1, 2, 3, 4
i1, 2, 3, 4
B’s greater bandwidth overwhelms A’s advantage of bridging pools of novel information.
As the Diversity-Bandwidth Tradeoff Increases:Constrained-High Bandwidth Ties Are Preferred
Panel (2)
A B
k
l
1, 2, 3, 4
j 5, 6, 7, 8 1, 2, 3, 4
i1, 2, 3, 4
E[A] = 2 E[B] = 4<B’s greater bandwidth overwhelms A’s advantage of bridging pools of novel information.
As the Diversity-Bandwidth Tradeoff Increases:Constrained-High Bandwidth Ties Are Preferred
Panel (2)
A B
k
l
1, 2, 3, 4
j 5, 6, 7, 8 1, 2, 3, 4
i1, 2, 3, 4
A B
k
l
1, 2, 3, 4
j 5, 6, 7, 8j 5, 6, 7, 8 1, 2, 3, 4
i1, 2, 3, 4
E[A] = 2 E[B] = 4<E[A] = 2 E[B] = 4<
B’s greater channel bandwidth can provide greater access to novel information when the information profiles of unconnected alters are less heterogeneous. Greater bandwidth provides more opportunities to receive novel information from contacts.
As Information Overlap Increases:Constrained-High Bandwidth Ties Are Preferred
A B
k
l
1, 2, 3, 4
j 1, 2, 7, 8 1, 2, 3, 4
i1, 2, 3, 4
Panel (3)
E[A] = 3 E[B] = 3¾<B’s greater channel bandwidth can provide greater access to novel information when the information profiles of unconnected alters are less heterogeneous. Greater bandwidth provides more opportunities to receive novel information from contacts.
As Information Overlap Increases:Constrained-High Bandwidth Ties Are Preferred
A B
k
l
1, 2, 3, 4
j 1, 2, 7, 8 1, 2, 3, 4
i1, 2, 3, 4
A B
k
l
1, 2, 3, 4
j 1, 2, 7, 8j 1, 2, 7, 8 1, 2, 3, 4
i1, 2, 3, 4
Panel (3)
E[A] = 3 E[B] = 3¾<E[A] = 3 E[B] = 3¾<As topic space increases to twelve topics, B’s higher bandwidth provides greater potential access to novel information. Her contacts have more to cover and are less likely to mirror each other.
Panel (4)
E[A] = 4 E[B] = 5¼<
As the Topic Space Increases:Constrained-High Bandwidth Ties Are Preferred
1, 2, 3, 4,5, 6, 7, 8,9, 10, 11, 12
13, 14, 14, 16,17, 18, 19, 20,21, 22, 23, 24
A B
k
lj
i1, 2, 3, 4,5, 6, 7, 8,9, 10, 11, 12
1, 2, 3, 4,5, 6, 7, 8,9, 10, 11, 12
As topic space increases to twelve topics, B’s higher bandwidth provides greater potential access to novel information. Her contacts have more to cover and are less likely to mirror each other.
Panel (4)
E[A] = 4 E[B] = 5¼<E[A] = 4 E[B] = 5¼<
As the Topic Space Increases:Constrained-High Bandwidth Ties Are Preferred
1, 2, 3, 4,5, 6, 7, 8,9, 10, 11, 12
13, 14, 14, 16,17, 18, 19, 20,21, 22, 23, 24
A B
k
lj
i1, 2, 3, 4,5, 6, 7, 8,9, 10, 11, 12
1, 2, 3, 4,5, 6, 7, 8,9, 10, 11, 12
1, 2, 3, 4,5, 6, 7, 8,9, 10, 11, 12
13, 14, 14, 16,17, 18, 19, 20,21, 22, 23, 24
A B
k
lj
i1, 2, 3, 4,5, 6, 7, 8,9, 10, 11, 12
1, 2, 3, 4,5, 6, 7, 8,9, 10, 11, 12
This panel simply updates Panel (1) over two periods. The environment refreshes only once per period. Expected novel information is therefore double. Diverse weak ties are preferred when populations are heterogeneous and environments are stable.
In Low Refresh Rate Environments: Diverse-Low Bandwidth Ties Are Preferred
Panel (5)
E[A |T1,T2] = 8 E[ B |T1,T2] = 7½>
B
k
l
T1 : 1, 2, 3, 4
T2 : 5, 6, 7, 8
T1 : 1, 2, 3, 4
T2 : 5, 6, 7, 8
A
j
iT1 : 1, 2, 3, 4
T2 : 5, 6, 7, 8
T1 : 9, 10, 11, 12:
T2 : 13, 14, 15, 16
This panel simply updates Panel (1) over two periods. The environment refreshes only once per period. Expected novel information is therefore double. Diverse weak ties are preferred when populations are heterogeneous and environments are stable.
In Low Refresh Rate Environments: Diverse-Low Bandwidth Ties Are Preferred
Panel (5)
E[A |T1,T2] = 8 E[ B |T1,T2] = 7½>E[A |T1,T2] = 8 E[ B |T1,T2] = 7½>
B
k
l
T1 : 1, 2, 3, 4
T2 : 5, 6, 7, 8
T1 : 1, 2, 3, 4
T2 : 5, 6, 7, 8
A
j
iT1 : 1, 2, 3, 4
T2 : 5, 6, 7, 8
T1 : 9, 10, 11, 12:
T2 : 13, 14, 15, 16
B
k
l
T1 : 1, 2, 3, 4
T2 : 5, 6, 7, 8
T1 : 1, 2, 3, 4
T2 : 5, 6, 7, 8
A
j
iT1 : 1, 2, 3, 4
T2 : 5, 6, 7, 8
T1 : 9, 10, 11, 12:
T2 : 13, 14, 15, 16
Here, the environment updates twice each period. Shifting from person k to person l, B gets the full value of higher bandwidth because redundant information has already been refreshed. Cohesive strong times are preferred when environments are unstable.
Panel (6)
A
j
i
T1 : 1, 2, 3, 45, 6, 7, 8
T2 : 9, 10, 11, 1213, 14, 15, 16
In High Refresh Rate Environments: Constrained-High Bandwidth Ties Are Preferred
B
k
l
E[A |T1,T2] = 8 E[ B |T1,T2] = 12<
T1 : 17, 18, 19, 20 21, 22, 23, 24
T2 : 25, 26, 27, 2829, 30, 31, 32
T1 : 1, 2, 3, 45, 6, 7, 8
T2 : 9, 10, 11, 1213, 14, 15, 16
T1 : 1, 2, 3, 45, 6, 7, 8
T2 : 9, 10, 11, 1213, 14, 15, 16
Here, the environment updates twice each period. Shifting from person k to person l, B gets the full value of higher bandwidth because redundant information has already been refreshed. Cohesive strong times are preferred when environments are unstable.
Panel (6)
A
j
i
T1 : 1, 2, 3, 45, 6, 7, 8
T2 : 9, 10, 11, 1213, 14, 15, 16
In High Refresh Rate Environments: Constrained-High Bandwidth Ties Are Preferred
B
k
l
E[A |T1,T2] = 8 E[ B |T1,T2] = 12<E[A |T1,T2] = 8 E[ B |T1,T2] = 12<
T1 : 17, 18, 19, 20 21, 22, 23, 24
T2 : 25, 26, 27, 2829, 30, 31, 32
T1 : 1, 2, 3, 45, 6, 7, 8
T2 : 9, 10, 11, 1213, 14, 15, 16
T1 : 1, 2, 3, 45, 6, 7, 8
T2 : 9, 10, 11, 1213, 14, 15, 16
Figure 2. The Diversity – Bandwidth Tradeoff under varying information environments: 1) a base case, 2) as the strength of the tradeoff increases, 3) as the information overlap of alters increases, 4) as the topic space increases and in panels 5) and 6) as the refresh rate of alters’ information increases.

63
BA
ND
WID
THSTRUCTURAL DIVERSITY
COHESIVE DIVERSELO
WH
IGH
<Contingent>
Most Novelty When:Refresh Rate is HighTopic Space is Large
Overlap is High
<Contingent>
Most Novelty When:Refresh Rate is LowTopic Space is Small
Overlap is Low
Least Novelty
Most Novelty
Unlikely Network
Likely Network
Granovetter’s (1973) original forbidden triad argument implies that the two configurations that most strongly predict access to novel information are also the least likely to be observed in real social settings, making the contingent scenarios most relevant.
Tradeoff
Tradeoff
Figure 3. Granovetter’s (1973) original forbidden triad argument implies that the two configurations that most strongly predict access to novel information (Diverse High Bandwidth ties and Cohesive Low Bandwidth Ties) are also the least likely to be observed in real social settings, making the contingent scenarios the most relevant. Cohe-sive-High Bandwidth networks deliver the most novel information when the refresh rate of information is high, when the topic space is large and when information overlap between alters is low.
Firm Communication Network
Communication Network:Firm Headquarters
.55 (.15).32 (.20)Researcher
InformationDiversity
NetworkConstraint
.55 (.14).30 (.18)Consultant
11.02 (32.44)5.41 (19.08)AverageDensity
.59 (.12).24 (.14)Partner
.57 (.14).29 (.17)Mean
3473Recruiters
HQFIRM
Firm Communication Network
Communication Network:Firm Headquarters
.55 (.15).32 (.20)Researcher
InformationDiversity
NetworkConstraint
.55 (.14).30 (.18)Consultant
11.02 (32.44)5.41 (19.08)AverageDensity
.59 (.12).24 (.14)Partner
.57 (.14).29 (.17)Mean
3473Recruiters
HQFIRM
Figure 4. The email network of the firm displays a hub and spoke structure, with a dense core in the firm headquar-ters and spokes in various offices located across the U.S.
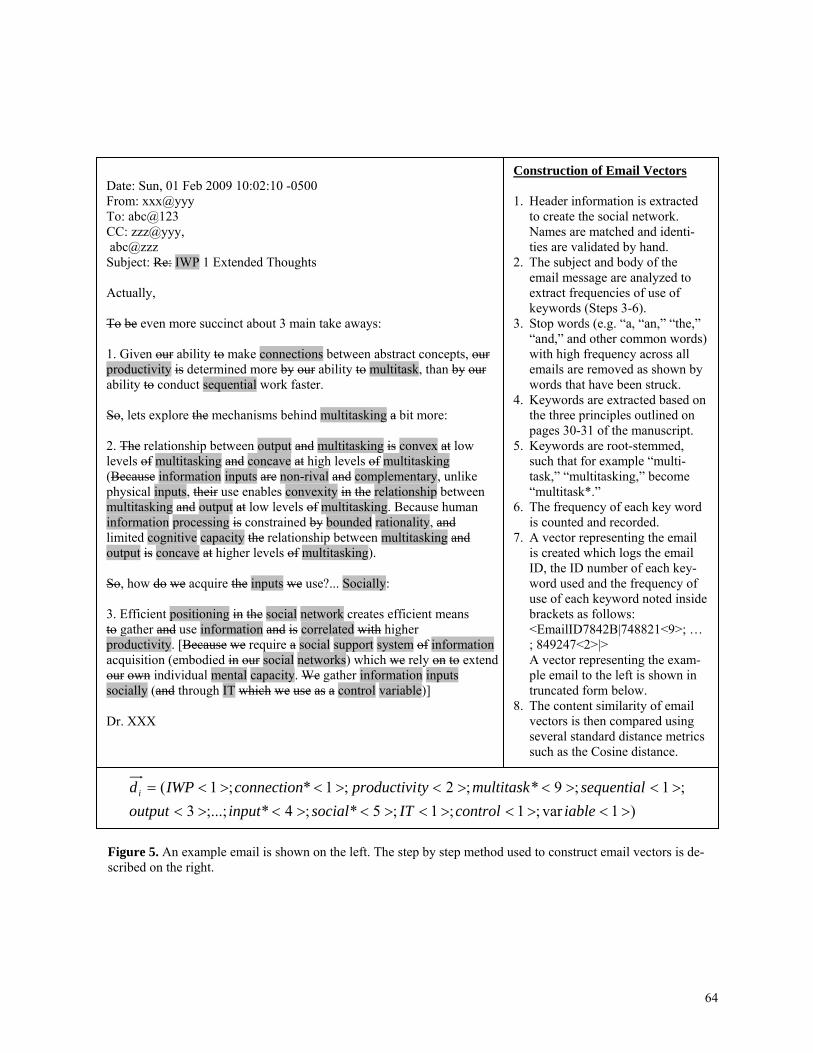
64
Figure 5. An example email is shown on the left. The step by step method used to construct email vectors is de-scribed on the right.
Date: Sun, 01 Feb 2009 10:02:10 -0500 From: xxx@yyy To: abc@123 CC: zzz@yyy, abc@zzz Subject: Re: IWP 1 Extended Thoughts Actually, To be even more succinct about 3 main take aways: 1. Given our ability to make connections between abstract concepts, our productivity is determined more by our ability to multitask, than by our ability to conduct sequential work faster. So, lets explore the mechanisms behind multitasking a bit more: 2. The relationship between output and multitasking is convex at low levels of multitasking and concave at high levels of multitasking (Because information inputs are non-rival and complementary, unlike physical inputs, their use enables convexity in the relationship between multitasking and output at low levels of multitasking. Because human information processing is constrained by bounded rationality, and limited cognitive capacity the relationship between multitasking and output is concave at higher levels of multitasking). So, how do we acquire the inputs we use?... Socially: 3. Efficient positioning in the social network creates efficient means to gather and use information and is correlated with higher productivity. [Because we require a social support system of information acquisition (embodied in our social networks) which we rely on to extend our own individual mental capacity. We gather information inputs socially (and through IT which we use as a control variable)] Dr. XXX
Construction of Email Vectors 1. Header information is extracted
to create the social network. Names are matched and identi-ties are validated by hand.
2. The subject and body of the email message are analyzed to extract frequencies of use of keywords (Steps 3-6).
3. Stop words (e.g. “a, “an,” “the,” “and,” and other common words) with high frequency across all emails are removed as shown by words that have been struck.
4. Keywords are extracted based on the three principles outlined on pages 30-31 of the manuscript.
5. Keywords are root-stemmed, such that for example “multi-task,” “multitasking,” become “multitask*.”
6. The frequency of each key word is counted and recorded.
7. A vector representing the email is created which logs the email ID, the ID number of each key-word used and the frequency of use of each keyword noted inside brackets as follows: <EmailID7842B|748821<9>; … ; 849247<2>|> A vector representing the exam-ple email to the left is shown in truncated form below.
8. The content similarity of email vectors is then compared using several standard distance metrics such as the Cosine distance.
)1var;1;1;5*;4*;...;3;1;9*;2;1*;1(
><><><><><><><><><><><=
iablecontrolITsocialinputoutputsequentialmultitasktyproductiviconnectionIWPdi

65
Recruiter 1 Recruiter 2 Recruiter 3 Recruiter 4 Recruiter 5
Recruiter 1 Recruiter 2 Recruiter 3 Recruiter 4 Recruiter 5
a
b
Recruiter 1 Recruiter 2 Recruiter 3 Recruiter 4 Recruiter 5
Recruiter 1 Recruiter 2 Recruiter 3 Recruiter 4 Recruiter 5
Recruiter 1 Recruiter 2 Recruiter 3 Recruiter 4 Recruiter 5
Recruiter 1 Recruiter 2 Recruiter 3 Recruiter 4 Recruiter 5
a
b
Figure 7. Distributions of Project Expertise and Topics in Incoming Email. Panel (a) displays histograms of the number of projects each of five recruiters has worked on over the eight project categories recognized by the firm. The pie charts represent the proportions of expertise of each of the five recruiters over the 8 project categories. Panel (b) displays histograms of the number of incoming emails that discuss each of eight topics A though H (an email can contain reference to more than one topic) for each of five recruiters. The pie charts represent the pro-portions of topics in incoming email for each of the five recruiters over the 8 topics.

66
1K
2K
3K
)( 3,2,11 kkkdi ′′′=
),( 32,12 kkkdi ′′′′′′=
),,( 321 kkkM i =
1K
2K
3K
)( 3,2,11 kkkdi ′′′=
),( 32,12 kkkdi ′′′′′′=
),,( 321 kkkM i =
The diversity of the information in an email inbox or outbox is measured by calculating the Cosine Distance of each email vector to the mean vector of that inbox or outbox, and then summing and averaging across all emails:
( )I
iIij MdCosCosDist ,1−=
( )( )N
MdCosID
N
j
Ii
Iij
Ii
∑=
−= 1
2,1.
Figure 6. A three dimensional Vector Space Model of five email vectors and their mean vector is shown on the left. A summary of how information diversity was calculated is shown on the right.
-20
24
6
0 20 40 60
Network Size
Cha
nnel
Ban
dwid
th-2
02
46
0 20 40 60
Network Size
Cha
nnel
Ban
dwid
th
Figure 8. Relationships between network size, bandwidth, network diversity and information diversity.
Figure 9. Graphs of the relationships between novel information, completed projects and revenue.
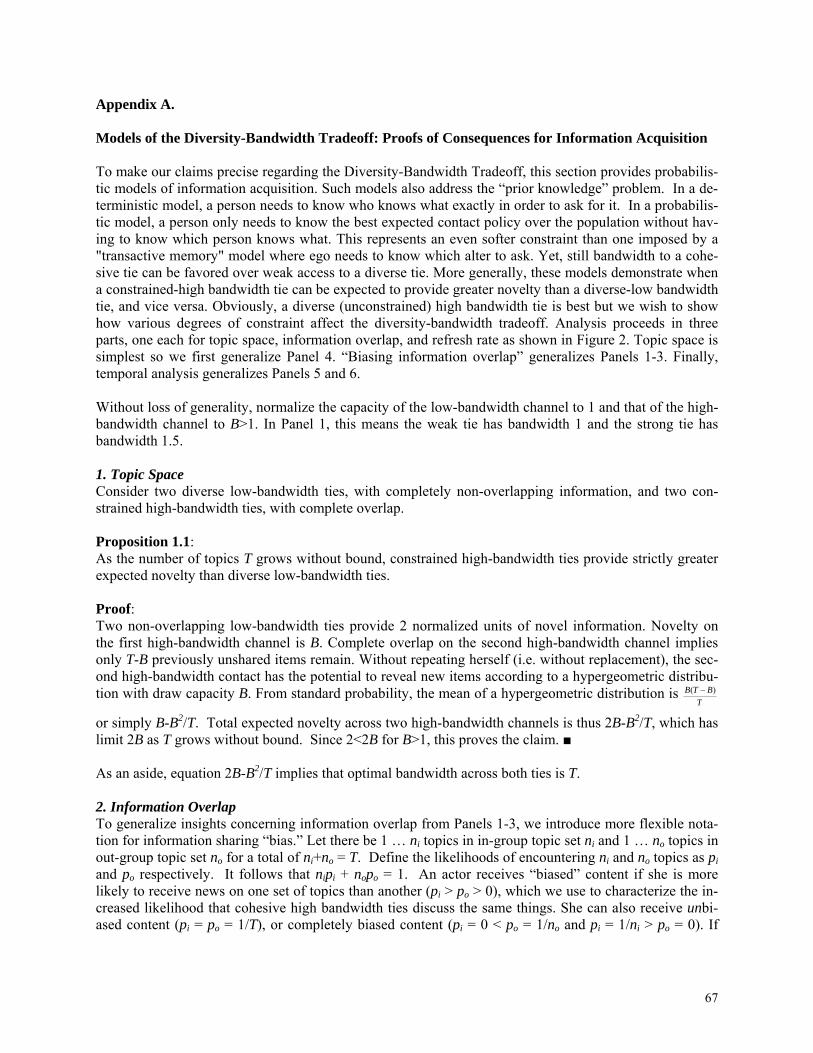
67
Appendix A.
Models of the Diversity-Bandwidth Tradeoff: Proofs of Consequences for Information Acquisition
To make our claims precise regarding the Diversity-Bandwidth Tradeoff, this section provides probabilis-tic models of information acquisition. Such models also address the “prior knowledge” problem. In a de-terministic model, a person needs to know who knows what exactly in order to ask for it. In a probabilis-tic model, a person only needs to know the best expected contact policy over the population without hav-ing to know which person knows what. This represents an even softer constraint than one imposed by a "transactive memory" model where ego needs to know which alter to ask. Yet, still bandwidth to a cohe-sive tie can be favored over weak access to a diverse tie. More generally, these models demonstrate when a constrained-high bandwidth tie can be expected to provide greater novelty than a diverse-low bandwidth tie, and vice versa. Obviously, a diverse (unconstrained) high bandwidth tie is best but we wish to show how various degrees of constraint affect the diversity-bandwidth tradeoff. Analysis proceeds in three parts, one each for topic space, information overlap, and refresh rate as shown in Figure 2. Topic space is simplest so we first generalize Panel 4. “Biasing information overlap” generalizes Panels 1-3. Finally, temporal analysis generalizes Panels 5 and 6. Without loss of generality, normalize the capacity of the low-bandwidth channel to 1 and that of the high-bandwidth channel to B>1. In Panel 1, this means the weak tie has bandwidth 1 and the strong tie has bandwidth 1.5. 1. Topic Space Consider two diverse low-bandwidth ties, with completely non-overlapping information, and two con-strained high-bandwidth ties, with complete overlap. Proposition 1.1: As the number of topics T grows without bound, constrained high-bandwidth ties provide strictly greater expected novelty than diverse low-bandwidth ties. Proof: Two non-overlapping low-bandwidth ties provide 2 normalized units of novel information. Novelty on the first high-bandwidth channel is B. Complete overlap on the second high-bandwidth channel implies only T-B previously unshared items remain. Without repeating herself (i.e. without replacement), the sec-ond high-bandwidth contact has the potential to reveal new items according to a hypergeometric distribu-tion with draw capacity B. From standard probability, the mean of a hypergeometric distribution is
TBTB )( −
or simply B-B2/T. Total expected novelty across two high-bandwidth channels is thus 2B-B2/T, which has limit 2B as T grows without bound. Since 2<2B for B>1, this proves the claim. ■ As an aside, equation 2B-B2/T implies that optimal bandwidth across both ties is T. 2. Information Overlap To generalize insights concerning information overlap from Panels 1-3, we introduce more flexible nota-tion for information sharing “bias.” Let there be 1 … ni topics in in-group topic set ni and 1 … no topics in out-group topic set no for a total of ni+no = T. Define the likelihoods of encountering ni and no topics as pi and po respectively. It follows that nipi + nopo = 1. An actor receives “biased” content if she is more likely to receive news on one set of topics than another (pi > po > 0), which we use to characterize the in-creased likelihood that cohesive high bandwidth ties discuss the same things. She can also receive unbi-ased content (pi = po = 1/T), or completely biased content (pi = 0 < po = 1/no and pi = 1/ni > po = 0). If

68
ideas in ni become x times more likely to appear among in-group communications, then pi=x/T (which implies that po=
1
11
nTT
xn
−
− with ni < T, x<T, and xni ≤ T).
With this terminology, we can derive P(Ψbiased), the probability of encountering a new idea given that there are k ideas remaining to be seen, allowing differences in pi and po. Let E represent the event that a person encounters new information through a new link. Since novelty depends on what one has learned from prior links, let L represent links. Then, define the following:
1=lkI if link l connects to idea k, 0 otherwise.
⎪⎭
⎪⎬⎫
⎪⎩
⎪⎨⎧
== ∑=
otherwise
IifJL
llk
k
0
011
Ψ = {Event that link L+1 connects to a new idea} Here, Jk indicates whether idea k has failed to appear among the information provided by any of the social links 1 … L. P(Ψ) can then be constructed as follows.
)]...|([)( 1 kJJPEP Ψ=Ψ
][11 1
∑∑+==
+=T
nhoh
n
lil pJpJE
i
][][ hoolii JEpnJEpn +=
L
oooL
iii ppnppn )1()1( −+−= [1] The last step arises because an idea that occurs with probability p must not have occurred in any of the previous L draws. It is useful to note three properties of P(Ψbiased). First, unbiased information implies pi= po=1/T. Because unbiased ties provide equal access across all topics, unbiased chances of encountering a new idea simplify to P(Ψunbiased)=(1-1/T)L. Second, having no prior links L=0 implies that a new idea is encountered with certainty. Third, increasing links without bound L→∞ implies the chances of encounter-ing a new idea approach 0. The likelihood of encountering novel information (for both biased and unbi-ased ties) decreases strictly and asymptotically toward 0 with each additional tie L. This theoretical model exactly mirrors the pattern we observe empirically as shown in Figure 8. Proposition 2.1: When the advantage of bandwidth swamps the disadvantage of bias, an ego prefers the constrained-high bandwidth tie to the diverse-low bandwidth tie to increase the chances of encountering novel information.
Proposition 2.2: When the disadvantage of bias swamps the advantage of bandwidth, an ego prefers the diverse-low bandwidth tie to the constrained-high bandwidth tie to increase the chances of encountering novel infor-mation. Proof: Let P[Ec]= P(Ψbiased) and P[ED]= P(Ψunbiased), where Ec and ED represent the events of forging a con-strained and a diverse link and getting new information with a single unit of bandwidth. To model the more frequent communication of the higher bandwidth tie, let B represent additional chances to cover new material over the constrained link during a given interval. Simplifying with no=T-ni gives total accumu-lated probability of:

69
( ) ( ) ( ) ( ) BLBLLL
BL
Ll
cC pnppnppnppnpEPEP +++
=
−+−+−+−== ∑ 222111222111 11...11][][ [2]
To see that a constrained-strong tie could offer more novel information, let p1 = p2 + ε implying negligible bias so that P[Ec] ≈ P[ED]. Then choose any B large enough such that the following inequality is strict:
][][...][][][...][][ 11DL
DBL
DL
DL
cBL
cL
cL EPEPEPEPEPEPEP >++≈++ ++++ [3]
This demonstrates the first claim that a constrained-high bandwidth tie can supply a greater volume of novel information than a diverse-low bandwidth tie provides. To see when a diverse-low bandwidth tie could be preferred, consider when extreme bias results in topic heterogeneity. The subset of ni topics oc-curs with probability pi=B/T (such bias necessarily constrains po ≈ ε). For ease of simplification, let ni = T/B. Then algebra reduces relative probabilities to:
][111][ DL
LLcL EP
TTBEP =⎟
⎠⎞
⎜⎝⎛ −<⎟
⎠⎞
⎜⎝⎛ −= [4]
This alternative case demonstrates the counterclaim, that a diverse-low bandwidth tie can supply a greater volume of novel information than a constrained high bandwidth tie provides. Although
][...][][ cBL
cL
CL EPEPEP ++= and increasing B adds more terms to ][ C
LEP and none to ][ DLEP , it also
causes each term to approach 0 faster. No matter how large the bandwidth of constrained ties, there al-ways exists a fixed number of links L such that link L+1 should be an unconstrained tie. This establishes the second claim. ■ While a range of intermediate cases span these two extremes, conditions exist when a person will always prefer one or the other type of link depending on bias, bandwidth, and the number of links already pre-sent. 3. Refresh Rate To model information renewal, we consider a standard Poisson process. Let mn be the average time be-tween samples in a subset of n topics and r be the average time until news is refreshed.
newold
mn r
newold
mn r The chance a given sample produces new information is the ratio of average time between samples over
the total time until information renews rmn
mn+
. Note also, if m is average time between samples, then
gives the number of samples per unit time. Consider non-overlapping in-group and out-group topic subsets ni and no with shorter sampling times for the higher bandwidth in-group. Proposition 3.1: Let high bandwidth ties provide more frequent updates mi < mo (so sample times are shorter) but let low bandwidth ties provide access to distinct topics no not included in ni. Then among ties balanced to provide optimal access to news, an increase in the refresh rate favors an increase in high bandwidth ties. Proof:

70
We first find the optimal balance between in-group and out-group ties then show the proportion of in-group ties grows in refresh rate. Since the number of ties is finite, the sum of samples per unit time is bounded by the number of social links Lmm oi ≤+11 . To get the most news, a person chooses:
)(*)()(*)(max SuccessoutGroupPSamplesoutGroupSuccessinGroupPSamplesinGroup +=π
)(1)(1max ,ooo
oo
oiii
ii
imm rnm
nmmrnm
nmmoi +
++
=π
such that: Lmm oi ≤+11 Use boundary condition io mLm /1/1 −= to substitute for mo. Since refresh occurs sooner in higher
bandwidth ties, substitute for out-group refresh rate using io rr δ= , 1≥δ . Solving 0=∂∂
imπ
produces a
quadratic equation with two roots, of which the second is out of bounds.
})(
)2(,{1
iio
ioi
io
i
i rnnLrnn
nnnL
m δδ
δδ
−+
−+
=
Based on the first root, the absolute time to spend on in-group ties rises in the number of ties L, the rela-tive refresh delay on out-group topics δ , and the number of in-group topics ni. It falls in the number of out-group topics no. The proportion of time to spend on high bandwidth ties is
io
i
oi
i
nnn
mm
mδ
δ+
=+ 11
1
which increases strictly toward 1 as the refresh delay of out-group topics increases. Higher refresh rates strictly favor a higher proportion of high bandwidth ties. ■

71
Appendix B.
Descriptions and Correlations of Information Diversity Metrics
1. Cosine Distance Variance Variance based on cosine distance (cosine similarity):
( )( )N
MdCosID
N
j
Ii
Iij
Ii
∑=
−= 1
2,1, where
∑∑∑ ×
=•
=22
),(Mjij
j Mjij
ii
iiij
ww
ww
MdMd
MdCos
We measure the variance of deviation of email topic vectors from the mean topics vector and average the deviation across emails in a given inbox or outbox. The distance measurement is derived from a well-known document simi-larity measure – the cosine similarity of two topic vectors. 2. Dice’s Coefficient Variance
Variance based on Dice’s Distance and Dice’s Coefficient: ( )( )
N
dDistDiceVarDice
N
j
Iij
Ii
∑== 1
2
, where
),(1),()( MdDiceMdDiceDistdDistDice −== , and where
∑ ∑
∑
= =
=
+
×= T
i
T
ijDjD
T
ijDjD
tt
ttDDDice
1 121
121 )(2
)2,1(
Similar to VarCos, variance is used to reflect the deviation of the topic vectors from the mean topic vector. Dice’s coefficient is used as an alternative measure of the similarity of two email topic vectors. 3. Average Common Cluster AvgCommon measures the level to which the documents in the document set reside in different k-means clusters produced by the eClassifier algorithm:
( )( )N
ddCommonDistAvgCommon
N
j
Ij
Ij
Ii
∑== 1
21 ,,
where ),( 21I
jIj dd represents a given pair of documents (1 and 2) in an inbox and j indexes all pairs of documents in
an inbox, and where:
( ) ( )Ij
Ij
Ij
Ij ddCommonSimddCommonDist 2121 ,1, −=
( )∑
∑=Iterations
clustersameinIterationsddCommonSim I
jIj
___, 21
AvgCommon is derived from the concept that documents are similar if they are clustered together by k-means clus-tering and dissimilar if they are not clustered together. The k-means clustering procedure is repeated several times, creating several clustering results with 5, 10, 20, 30, 40 … 200 clusters. This measures counts the number of times during this iterative process two emails were clustered together divided by the number of clustering iterations. There-fore, every two emails in an inbox and outbox that are placed in separate clusters contribute to higher diversity val-ues. 4. Average Common Cluster with Information Content AvgCommonIC uses a measure of the “information content” of a cluster to weight in which different emails reside.

72
AvgCommonIC extends the AvgCommon concept by compensating for the different amount of information provided in the fact that an email resides in the same bucket for either highly diverse or tightly clustered clusters. For exam-ple, the fact that two emails are both in a cluster with low intra-cluster diversity is likely to imply more similarity between the two emails than the fact that two emails reside in a cluster with high intra-cluster diversity.
( )levelsbucketofnumbertotal
DDmCommonICSi bucketsameinDDdocumentsall
buckettheindocuments
documentsall ____
log
)log(1),( __,
____
_121
21
∑⋅=
),(1),( 2121 DDmCommonICSiDDstCommonICDi −=
{ }),( 21, 21
ddstCommonICDiaverageCAvgCommonIdocumentsdd ∈
=
5. Average Cluster Distance AvgBucDiff measures diversity using the similarity/distance between the clusters that contain the emails:
{ }),( 21, 21
ddDocBucDistaverageAvgBucDiffdocumentsdd ∈
= , where
( )∑∈
==⋅=iterationsclusteri
DiiterationDiiteration BBBucketDistiterationscluster
DDistDocBucketD_
,,21 ),(_
1),(21
, and:
),(),(2121 BB mmCosDistBBBucketDist = .
AvgBucDiff extends the concept of AvgCommon by using the similarity/distance between clusters. While AvgCommon only differentiates whether two emails are in the same cluster, AvgBucDiff also considers the distance between the clusters that contain the emails.
Correlations Between the Five Measures of Information Diversity Measure 1 2 3 4 5
1. VarCosSim 1.0000
2. VarDiceSim 0.9999 1.0000
3. AvgCommon 0.9855 0.9845 1.0000
4. AvgCommonIC 0.9943 0.9937 0.9973 1.0000
5. AvgClusterDist 0.9790 0.9778 0.9993 0.9939 1.0000

73
Appendix C: External Validation of Diversity Measures We validated our diversity measurement using an independent, publicly available corpus of documents from Wikipedia.org. Wikipedia.org, the user created online encyclopedia, stores entries according to a hierarchy of topics representing successively fine-grained classifications. For example, the page describ-ing “genetic algorithms,” is assigned to the “Genetic Algorithms” category, found under “Evolutionary Algorithms,” “Machine Learning,” “Artificial Intelligence,” and subsequently under “Technology and Applied Sciences.” This hierarchical structure enables us to construct clusters of entries on diverse and focused subjects and to test whether our diversity measurement can successfully characterize diverse and focused clusters accurately.
We created a range of high to low diversity clusters of Wikipedia entries by selecting entries from either the same sub-category in the topic hierarchy to create focused clusters, or from a diverse set of unrelated subtopics to create diverse clusters. For example, we created a minimum diversity cluster (Type-0) using a fixed number of documents from the same third level sub-category of the topic hierarchy, and a maxi-mum diversity cluster (Type-9) using documents from unrelated third level sub-categories. We then con-structed a series of document clusters (Type-0 to Type-9) ranging from low to high topic diversity from 291 individual entries as shown in Figure C1.38 The topic hierarchy from which documents were selected appears at the end of this section.
If our measurement is robust, our diversity measures should identify Type-0 clusters as the least diverse and Type-9 clusters as the most diverse. We expect diversity will increase relatively monotonically from Type-0 to Type-9 clusters, although there could be debate for example about whether Type-4 clusters are more diverse than Type-3 clusters.39 After creating this independent dataset, we used the Wikipedia en-tries to generate keywords and measure diversity using the methods described above. Our methods were very successful in characterizing diversity and ranking clusters from low to high diversity. Figure C1 dis-plays cosine similarity metrics for Type-0 to Type-9 clusters using 30, 60, and 90 documents to populate clusters. All five diversity measures return increasing diversity scores for clusters selected from succes-sively more diverse topics.40 Overall, these results give us confidence in the ability of our diversity meas-urement to characterize the subject diversity of groups of text documents of varying sizes.
Document clusters selected from Wikipedia.org
Diversity measurement validation results
0.3
0.35
0.4
0.45
0.5
0.55
0.6
0.65
0 1 2 3 4 5 6 7 8 9
Type
Div
ersi
ty Variance of CosineDistances (30Documents)
Variance of CosineDistances (60Documents)
Variance of CosineDistances (90Documents)
Figure C1. Wikipedia.org Document Clusters and Diversity Measurement Validation Results.
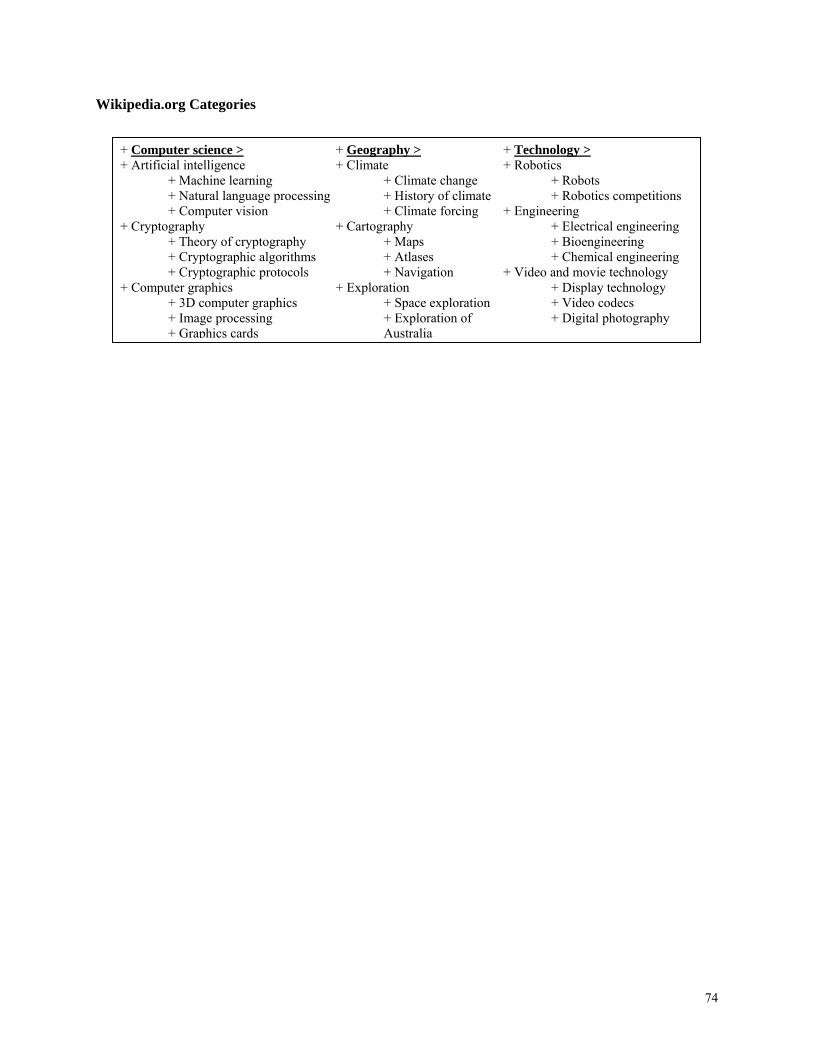
74
Wikipedia.org Categories
+ Computer science > + Artificial intelligence + Machine learning + Natural language processing + Computer vision + Cryptography + Theory of cryptography + Cryptographic algorithms + Cryptographic protocols + Computer graphics + 3D computer graphics + Image processing + Graphics cards
+ Geography > + Climate + Climate change + History of climate + Climate forcing + Cartography + Maps + Atlases + Navigation + Exploration + Space exploration + Exploration of
Australia
+ Technology > + Robotics + Robots + Robotics competitions + Engineering + Electrical engineering + Bioengineering + Chemical engineering + Video and movie technology + Display technology + Video codecs + Digital photography

75
Appendix D: Model Specifications and Estimation Procedures
Model Specifications To explore the mechanisms driving the creation and appropriation of information advantages from network
structure we first explicitly considered the tradeoff between network diversity and channel bandwidth by estimating the two following specifications:
itm
itmjij
jitititititiit MBHCBNSNSEHSENDB εβββββγ ++++++++= ∑∑254321 [1]
itm
itmjij
jitititititiit MBHCBBNSNSEHSEND εβββββγ ++++++++= ∑∑52
4321 [2]
where itB represents channel bandwidth, itND represents network diversity (measured by one minus constraint),
itSE represents average structural equivalence, itEH represents the knowledge heterogeneity of i’s contacts, itNS
represents the size of i’s network, 2itNS represents network size squared, ji
jj HC∑β represents controls for human
capital and demographic variables (Age, Gender, Education, Industry Experience, and Managerial Level), and
itm
mM∑β represents temporal controls for each month/year. If network diversity and channel bandwidth tradeoff,
network diversity should be associated with lower channel bandwidth, and we would expect to observe parameter estimates such that 01 <β and 02 >β in equation 1 and 05 <β in equation 2.
We then examined the structural correlates of access to diverse and novel information. We first estimated an equation relating network structure to the diversity of information flowing into actors’ email inboxes.1 The esti-mating equation is specified as follows:
itm
itmjij
jititititititIiti
Iit MHCBNSNSSENDEHEID εβββββββββγ ++++++++++= ∑∑7
2654321 [3]
where IitID represents the diversity of the information in a given individual’s inbox, I
itE represents the total number of incoming messages received by i. We then examined the relationship between network structure and the total amount of novel information flowing into actors’ email inboxes ( I
itNRI ) using the following model:2
itm
itmjij
jitititititiIit MHCBNSSENDEHNRI εβββββββγ ++++++++= ∑∑54321 [4]
Finally, we tested the relationship between non-redundant information ( IitNRI ) and performance ( itP ),
and included our measures of network diversity ( itND ) and bandwidth ( itB ) in the specification.
( ) itm
mjij
jIit
Iitititiit MonthBHCBNRINRIBNDP εββββγ +++++++= ∑∑2
4321 [5]
If information benefits to network diversity and channel bandwidth exist, they should be positively associ-ated with access to diverse and non-redundant information, and non-redundant information should be positively as-sociated with performance. If network structure confers additional benefits beyond information advantage (such as power or favorable trading conditions) network diversity and channel bandwidth should contribute to performance beyond their contribution through information diversity.3 Finally, if there are diminishing returns to novel informa-
1 We focus in this paper on incoming information for two reasons. First, we expect network structure to influence incoming information more than outgoing information. Second, the theory we intend to test is about the information to which individuals have access as a result of their net-work structure, not the information individuals send. These dimensions are highly correlated.
2 We did not include the network sized squared term because it had no explanatory power. The relationship between network size and total non-redundant information is linear and positive.
3 We were unable to reject the hypothesis of no heteroskedasticity and report standard errors according to the White correction (White 1980). White’s approach is conservative. Estimated coefficients are unbiased but not efficient. In small samples, we may observe low t-statistics even when variables exert a real influence. As there may be idiosyncratic error at the level of individuals, for OLS analyses we report robust standard
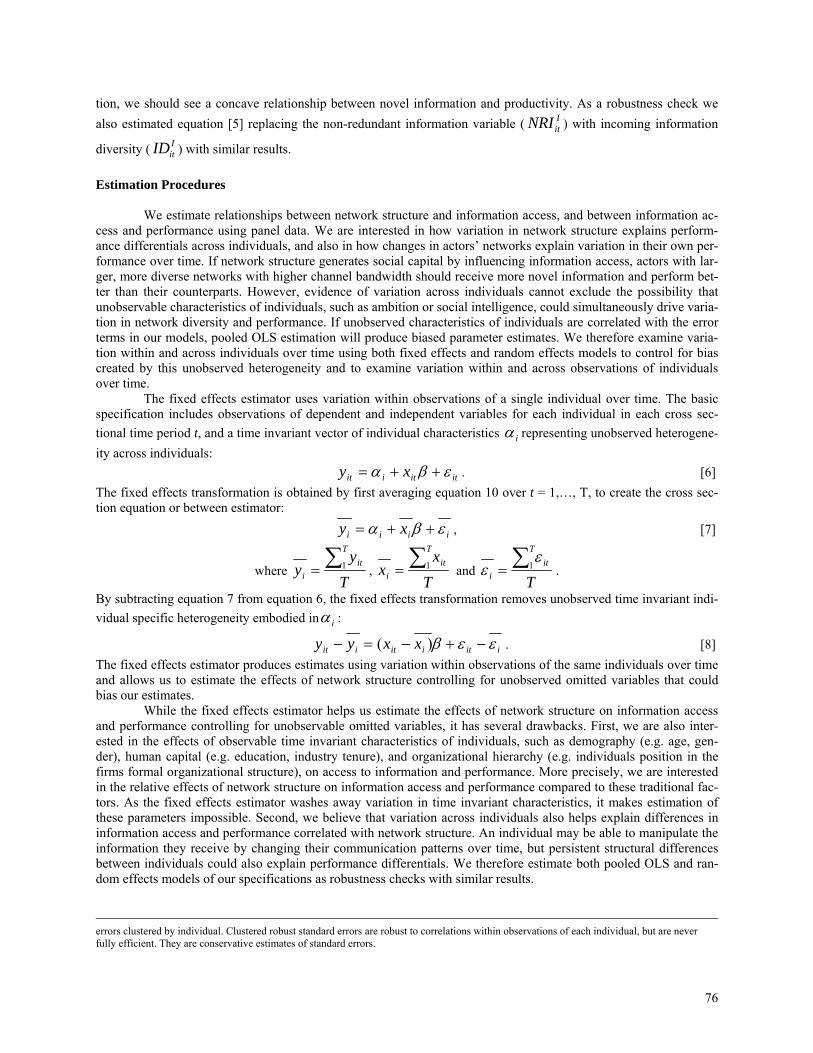
76
tion, we should see a concave relationship between novel information and productivity. As a robustness check we also estimated equation [5] replacing the non-redundant information variable ( I
itNRI ) with incoming information
diversity ( IitID ) with similar results.
Estimation Procedures
We estimate relationships between network structure and information access, and between information ac-
cess and performance using panel data. We are interested in how variation in network structure explains perform-ance differentials across individuals, and also in how changes in actors’ networks explain variation in their own per-formance over time. If network structure generates social capital by influencing information access, actors with lar-ger, more diverse networks with higher channel bandwidth should receive more novel information and perform bet-ter than their counterparts. However, evidence of variation across individuals cannot exclude the possibility that unobservable characteristics of individuals, such as ambition or social intelligence, could simultaneously drive varia-tion in network diversity and performance. If unobserved characteristics of individuals are correlated with the error terms in our models, pooled OLS estimation will produce biased parameter estimates. We therefore examine varia-tion within and across individuals over time using both fixed effects and random effects models to control for bias created by this unobserved heterogeneity and to examine variation within and across observations of individuals over time. The fixed effects estimator uses variation within observations of a single individual over time. The basic specification includes observations of dependent and independent variables for each individual in each cross sec-tional time period t, and a time invariant vector of individual characteristics iα representing unobserved heterogene-ity across individuals:
ititiit xy εβα ++= . [6] The fixed effects transformation is obtained by first averaging equation 10 over t = 1,…, T, to create the cross sec-tion equation or between estimator:
iiii xy εβα ++= , [7]
where T
yy
Tit
i∑= 1 ,
Tx
xT
iti∑= 1 and
T
Tit
i∑= 1
εε .
By subtracting equation 7 from equation 6, the fixed effects transformation removes unobserved time invariant indi-vidual specific heterogeneity embodied in iα :
iitiitiit xxyy εεβ −+−=− )( . [8] The fixed effects estimator produces estimates using variation within observations of the same individuals over time and allows us to estimate the effects of network structure controlling for unobserved omitted variables that could bias our estimates. While the fixed effects estimator helps us estimate the effects of network structure on information access and performance controlling for unobservable omitted variables, it has several drawbacks. First, we are also inter-ested in the effects of observable time invariant characteristics of individuals, such as demography (e.g. age, gen-der), human capital (e.g. education, industry tenure), and organizational hierarchy (e.g. individuals position in the firms formal organizational structure), on access to information and performance. More precisely, we are interested in the relative effects of network structure on information access and performance compared to these traditional fac-tors. As the fixed effects estimator washes away variation in time invariant characteristics, it makes estimation of these parameters impossible. Second, we believe that variation across individuals also helps explain differences in information access and performance correlated with network structure. An individual may be able to manipulate the information they receive by changing their communication patterns over time, but persistent structural differences between individuals could also explain performance differentials. We therefore estimate both pooled OLS and ran-dom effects models of our specifications as robustness checks with similar results.
errors clustered by individual. Clustered robust standard errors are robust to correlations within observations of each individual, but are never fully efficient. They are conservative estimates of standard errors.
77
The OLS estimator on pooled data estimates an unweighted average of the within and between estimators. Although we do not report these results in the tables, we produced pooled OLS estimates of our specifications with very similar results, which most closely resembled the random effects estimates we report. We estimated the pooled OLS specifications with robust clustered standard errors in order to control for the fact that repeated observations of the same individuals over time in panel data may artificially constrict the standard errors. Clustered robust standard errors treat each individual as a super-observation for part of its contribution to the variance estimate (e.g. cicci υηε += , where cη is an individual effect and ciυ the idiosyncratic error). They are robust to correlations within the observations of each individual, but are never fully efficient. They represent conservative estimates of standard errors.
When variables of interest do not vary much over time, fixed effects methods can produce imprecise esti-mates. In our case, we are not only interested in estimating the impact of time invariant characteristics of individuals on access to information and performance (e.g. age, gender, education), but we also know that certain aspects of network structure change relatively little over time. We therefore estimate both fixed effects and random effects specifications. The random effects model estimates a matrix weighted average of the between [11] and within [12] estimators where the weighting matrixλ accounts for correlation across observations in the residuals, as follows:
iitiitiit xxyy λεεβλλ −+−=− )( . [9]
We estimateλ as a function of the idiosyncratic error variance and the group specific error variance. When 0=λ , the procedure is equivalent to estimating OLS, and when 1=λ we are estimating fixed effects. The random effects model brings efficiency gains and the ability to estimate parameters of time invariant covariates at the risk of incon-sistency. To test the consistency of the random effects estimator, we conduct Hausman tests (Hausman 1978) com-paring fixed and random effects models and report our results in the table notes for each set of results. To adjust for non-independence of observations in network panel data, we employ a consistent covariance matrix estimator which is robust to very general forms of network, spatial and temporal dependence (Driscoll and Kraay 1998). This approach is similar to common network autocorrelation models considered in the literature (e.g. Ord 1975, Doreian 1980, 1989, Dow et al 1982, Loftin and Ward 1983, Marsden and Friedkin 1993) but also takes into account temporal dependence across panels in longitudinal data as well as both cross sectional and time de-pendent network autocorrelation. The estimator assumes a data generating process with both contemporaneous and lagged cross-sectional dependence across observations as follows:
ititit xy εβ += ; where [10]
ittiit f νλε += ; and
ittt uff += −1ρ ;
where itu and itv are mutually independent normal random variables with mean zero and contemporaneous and
lagged cross-sectional dependence in disturbances is modeled through the presence of the unobserved factor tf . The extent of dependence between two observations i and j depends of the strength of the network autocorrelation terms
iλ and jλ and the degree of temporal persistence in the factor ρ .
78
Endnotes 1 We define the “structural diversity” or “network diversity” of an ego network as the extent to which it is low in “constraint” as defined by Burt (1992: 55), low in the average structural equivalence of alters and rich in structural holes. We define the “structural cohesion” or “network cohe-sion” of an ego network as the extent to which it is high in “constraint” as defined by Burt (1992: 55), low in structural holes and high in the average structural equivalence of alters. Various phrases have been used in the literature to describe analogous concepts including ego density (or sparseness) and network embeddedness. These definitions and their measures are highly correlated with and change in proportion to network diversity and network cohesion. We chose to use the phrases network diversity and network cohesion because they are the ones most commonly used in the literatures to which we refer (e.g. Burt 1992, 2004, 2005, Reagans and McEvily 2003). At times we also use the terms embeddedness and constraint to highlight that our arguments draw from and contribute to literatures that also use those terms (e.g. Granovetter 1985, Uzzi 1996, 1997, Burt 1992).
2 We use the phrase relationship “channel bandwidth” carefully, and in preference to the more inclusive “strong tie” to draw attention to the volume of literal communication shared among people. In general, stronger ties imply greater bandwidth but the added precision allows us to also handle unusual cases. For example, individuals may have strong ties to parents based on emotional affinity, trust, or care-giving, yet be ob-served to communicate more frequently with co-workers who are less emotionally significant in their lives. We draw out the importance of focus-ing on information diversity and volume, observed over actual communications channels, in developing the theories that follow. The strength of a tie may be a noisy reflection of the bandwidth of the channel. More detailed empirical work on the relationship between the strength of ties and the bandwidth of channels may provide evidence on how the social function of relationships (Podolny and Barron 1997, Burt 2000) is associated with the nature of the conduits of information flow they enable. We encourage this work although we do not focus on it here.
3 As Granovetter (1973: 1362) notes, homophily could also explain closure without a causal relationship between the strength of ties and closure, breaking the causal relationship between structural diversity and the rate and volume of interaction (if individuals interact more with similar others because they are similar and not because they are connected in embedded relationships). However, prior empirical work on friendship formation demonstrates that exposure and preferences both play highly significant roles in tie formation (see Currarini et al 2009, 2010). The diversity bandwidth tradeoff can therefore be viewed to a significant extent as a causal theory, with structure driving the rate and volume of inter-action. Exposure and motivation are likely to play an even bigger role in our setting because we study work relationships in which, as we explain in our empirical analyses, recruiters seek diversity constrained by exposure in order to perform well at work.
4 Two core models have emerged to explain the diffusion of influence and contagion. Threshold models posit that individuals adopt innovations (or receive information) after surpassing their own private “threshold” (e.g. Granovetter 1978, Schelling 1978). Cascade models posit that each time an adjacent individual adopts, the focal actor adopts with some probability that is a function of their relationship (e.g. Kempe, Kleinberg, Tardos 2003). While both models assume information transmission between adopters and non-adopters, they rarely specify the nature of the information or the conditions under which exchanges take place. Rather, the diffusion process is typically tested under various assumptions about the distribution of thresholds or dyadic adoption probabilities in the population. In fact, as Kempe, Kleinberg, Tardos (2003: 2) explain “the fact that [thresholds] are randomly selected is intended to model our lack of knowledge of their values.”
5 We are indebted to one of our reviewers for this helpful insight.
6 Since social people talk, it could be the case that Beth tells Lauren what she learned from Kim in order that Lauren shares her non-redundant information in a single draw. But then Beth would already have used her three units of bandwidth. Allowing more targeted requests in a transac-tive memory sense (Wegner 1987) complicates the analysis but in no way invalidates the basic bandwidth tradeoff.
7 The same insight follows exactly if we instead decrease the overlap of Kim and Lauren rather than increase that of Isaac and Jake. 8 In the appendix, we formally prove an even stronger claim. If a weak tie can access all topics in S and a strong time can only access in-group subset ni ⊆ S, then the strong tie can still provide more access to novel information than the weak tie, provided bandwidth exceeds a specific threshold.
9 The complete chain is given as: (9/12)+(9/12)(8/11)+(9/12)(8/11)(7/10)+(9/12)(3/11)(8/10)+(3/12)(9/11)+(3/12)(9/11)(8/10) +(3/12)(2/11)(9/10) = (9/4). As shown in Appendix A, a more straightforward approach is to use the mean of the hypergeometric distribution which gives equivalently (3)(12-3)/12=(9/4).
10 Although this assumes sequential attention across alters in a given period, the main insights do not change assuming ego attends simultaneously to all alters. To model simultaneous draws without replacement on a given alter, use a hypergeometric distribution, then estimate expected non-overlap. Given complete non-overlap, the numbers for ego A are unchanged across all six panels. For B in panel 1, total expected novelty from each alter is 15/8 for a total of 15/4 over both alters. In the sequential draw, Lauren had much higher novelty than Kim, by virtue of getting attention first, namely 3 versus 3/4. In Panel 6, simultaneous draws over each alter provides 39/8 for a total of 9.75. This is lower than the sequential calculation but higher bandwidth still provides 1.75 more expected novel units of information than structural diversity. Thus, whether using simultaneous or sequential draws, primary intuitions do not change in these examples. 11 A significant body of related work in political sociology, research on social movements and on cognition and network structure has developed around networks and language. Some of this work examines discourse in markets (White 2000), dialogic processes (Steinberg 1999), framing practices (McLean 1998), civic talk (Eliasoph 1996), and commitment styles (Lichterman 1996) in social movements, as well as sociolinguistic approaches to conversational dynamics in social movements (see the work of Harrison White and Ann Mische, e.g. White 1995, Mische and White 1998, and Mische 2000). Work on cognition in networks (e.g. Krackhardt 1987, 1990) has examined content from the perspective of what is perceived in and through social networks, and conversation-analytic approaches have been used to examine the structure of interaction (e.g. Goffman 1961, Drew and Heritage 1992, Gibson 2005). We build on this related work by focusing specifically on the diversity and total novelty of information exchanged between actors in networks over time in order to examine the information mechanisms that explain returns to broker-age.

79
12 F-tests comparing performance levels of those who opted out with those who remained did not show statistically significant differences. F (Sig): Rev02 2.295 (.136), Comp02 .837 (.365), Multitasking .386 (.538). We also calculated the indegrees of missing nodes based on the choices of the non-missing nodes. We found that the indegrees (insize) of missing nodes were lower than those of non-missing nodes (average monthly mean indegree non-missing = 14.7; average monthly mean indegree missing = 10.7), however t-tests reveal no statistically significant differences between the two (t-statistic = -1.38; p < .172). Size is the raw number of contacts while degree is weighted by message counts. We thank an anonymous reviewer for this suggested robustness check.
13 Most employees we talked to reported that email was their primary means of communication. Although we did not collect phone conversation data or face to face information exchanges, email provides the best means of assessing codified communications between employees at this firm. That said, we took several steps to investigate whether use of the phone and use of email were similar in the organization. First, our survey had asked employees to report “the number of people they communicated with on a typical day a) by phone and b) by email.” A Pearson correlation returned a .31 correlation which was significant at the p < .001 level, indicating the size of email networks and phone networks was likely to be similar. However, this did not give us insight into network structure, so we went further. Second, we found three reasonable proxies for phone communication between two people. First, our interviews indicated that recruiters most often spoke with their project team members (more than other recruiters in the firm) both by email and by phone. We therefore decided that if two people worked on the same project together, that it would be reasonable to expect they would talk on the phone. In fact, the more projects they worked on together, the more likely they would ex-change a greater volume of phone traffic. We therefore constructed a network of “project co-work” which measured as the strength of a tie the number of projects two individuals in the firm had worked on together. Our interviews also indicated that work was frequently regionally clus-tered (in other words candidates typically looked for jobs in the same region that they were currently working). We therefore conjectured that if two recruiters worked in the same region they would be more likely to seek information from one another over the phone about candidates that might be interested in a specific job in that region. Similarly, if they worked in the same office, they may have reasons specific to the social work-ings of the office to exchange a higher volume of phone communication. We therefore also created two new matrices in which dyads shared a tie if they ‘worked in the same region’ or ‘worked in the same office.’ We took these three new matrices “Project Co-Work,” “Same Region,” and “Same Office” and used Quadratic Assignment Procedure (QAP) to assess QAP correlations and to analyze correlations via MRQAP with a pooled matrix of the total email exchanged between these same individuals (a single pooled matrix of email traffic over all 10 months of data). If these proxies for greater phone traffic (Project Co-Work, Same Region, and Same Office) were highly correlated with the email adjacency ma-trix, then the email network should approximate the phone network. The email network was significantly correlated with the project co-work network (.426; p < .001) and with the same region network (.359, p < .001) which makes it likely that the email network mirrors the phone net-work relatively well given that our interviews indicated recruiters talked more frequently via phone and email to others on the same project or in the same region. Correlation with the ‘same office’ network was slightly lower (.148, p < .001) perhaps because it is less necessary to talk via phone with those in the same office, but also and perhaps most tellingly, because the co-work network and the same office network had the low-est correlation (.079, p < .005) reflecting the fact that project teams were typically geographically dispersed across different offices – again lend-ing credibility to the argument that project co-work should be a better proxy for phone communication than simply being in the same office. These results mirror the MRQAP results which indicate that the project co-work network is the strongest predictor of the email network (.339, p < .01) and the same region network is also a strong predictor (.225, p < .01), while the same office network was correlated but was not as strong a predictor (.084, p < .05). As our interviews revealed that recruiters talked on the phone most often with those who were on the same projects and in the same regions, the results of the QAP correlations and MRQAP analysis indicate that the email network should mirror the phone network relatively well. A separate question is whether the same type of information is exchanged over the phone and over email. However, the interview evidence that email was the communication medium of choice in this setting gives us confidence that our results of email analyses are the most important in this study with regard to access to information and the role of information in performance. Perhaps more importantly, phone com-munication data, if we had it, would likely only support our claims rather than detract from them. If the phone is a richer communication medium through which high bandwidth, high novelty information is likely to flow, then the social microprocesses arguments that predict high bandwidth communication in socially proximate relationships would simply be magnified in the telephone context. For example, we are less likely to have the social capital standing to ‘cold call’ a weak tie to ask for a significant amount of their time to give us detailed novel information, nor would such a tie likely call us out of the blue to volunteer such information. Several of the other social microprocesses operate in the same way in that they predict that social proximity enables high bandwidth exchanges which are likely to occur over the phone as well as over email. However, future work should assess the differences between phone and email networks.
14 We conducted interviews over the course of a year beginning in October 2001.
15 We wrote and developed email capture software specific to this project and took multiple steps to maximize data integrity. New code was tested at Microsoft Research Labs for server load, accuracy and completeness of message capture, and security exposure. To account for differ-ences in user deletion patterns, we set administrative controls to prevent data expunging for 24 hours. The project went through nine months of human subjects review and content was masked using cryptographic techniques to preserve privacy (see Van Alstyne and Zhang 2003 and Rey-nolds, Van Alstyne and Aral 2009 for more detail). Spam messages were excluded by eliminating external contacts who did not receive at least one message from someone inside the firm.
16 By measuring both first and second order network diversity we account for the possibility that small world networks (Watts and Strogatz 1998, Watts 1999), clustered cliques linked by infrequent weak ties, could bring novel information into a cohesive clique from contacts two steps removed from ego.
17 Where pij +∑piqpqj measures the proportion of i’s bidirectional communication with network contacts that directly or indirectly involve j and Ci sums this across all of i’s contacts.
18 Euclidean distance measures the square root of the sum of squared distances between two contact vectors, or the degree to which contacts are connected to the same people. We measure the average structural equivalence of actors’ direct contacts.
19 While email is not the only source of employees’ communication, it is one of the most pervasive media that preserves content. It is also a good proxy for other social sources of information in organizations where email is widely used. In our data, the average number of contacts by phone (ρ= .31, p < .001) are positively and significantly correlated with email contacts. Our interviews indicate that in our firm, email is a primary communication media.

80
20 Each email may pertain to multiple topics based on keyword prevalence, and topic vectors representing emails can emphasize one topic more than another based on the relative frequencies of keywords associated with different topics. In this way, our framework captures nuances of emails that may pertain to several topics of differing emphasis.
21 Another common weighting scheme is the ‘term-frequency/inverse-document frequency.’ However, we use a more sophisticated keyword selection refinement method described in detail in the text.
22 K-means clustering generates clusters by locally optimizing the mean squared distance of all documents in a corpus. The algorithm first cre-ates an initial set of clusters based on language similarities, computes the ‘centriod’ of each cluster, and then reassigns documents to clusters whose centriod is the closest to that document in topic space. The algorithm stops iterating when no reassignment is performed or when the objec-tive function falls below a pre-specified threshold.
23 The coefficient of variation is particularly useful due to its scale invariance, enabling comparisons of datasets, like ours, with heterogeneous mean values (Ancona and Caldwell 1992). To ease computation we use the square of the coefficient of variation, which produces a monotonic transformation of the coefficient without affecting our keyword selection. iC refers to the coefficient of variation of keyword i, i
cm is the mean
frequency of keyword i in emails in topic cluster c, and iM is the mean frequency of keyword i across all topics.
24 i indexes keywords and c indexes k-means clusters of emails which represent topics. iecf is the frequency of keyword i in email e in topic
cluster c, icm is the mean frequency of keyword i in emails in topic cluster c, and iM is the mean frequency of keyword i across all topics. We
squared the variation to ease computation as in footnote 22.
25 We conducted sensitivity analysis of our keyword selection process by choosing different thresholds at which to select words based on our criteria and found results were robust to all specifications and generated keyword sets more precise than those used in traditional term frequency/inverse document frequency weighted vector space models that do not refine keyword selection.
26 Information Content is used to describe how informative a word or phrase is based on its level of abstraction. Formally, the information content of a concept c is quantified as its negative log likelihood –log p(c).
27 We measure the refresh rate of alters using both incoming and outgoing email vectors to capture the degree to which information being received was changing and the degree to which alters changed the topics they sent information about over time. Both are likely to affect the effective refresh rate in ego’s network. However, an argument could be made for only considering the refresh rate of information received by alters as a proxy for information they are privy to. We therefore created an alternative refresh rate measure that only considered alters’ incoming email. Use of that variable did not change the results significantly.
28 We exclude each alter’s overlap with themselves, which would only add a constant to the measure as the cosine similarity of j to j, ),( jtjt MMCos is always 1.
29 We also ran specifications controlling for other categorization schemes and sub-categories of ‘Other’ jobs clustered by their project descriptions, which returned similar results. We therefore retained the firm’s original classification.
30 To normalize the Expertise Heterogeneity measure so that its values range from zero to one, we scale the measure by multiplying the final
metric by (8/7), creating this final metric: ⎥⎥⎦
⎤
⎢⎢⎣
⎡⎟⎟⎠
⎞⎜⎜⎝
⎛−= ∑
=
8
1
2
178
k i
iki q
qKH
. This scaling does not affect the distribution of the measure or the outcome of any of our analyses. It simply allows the measure to range from zero to one easing interpretation.
31 Multicollinearity is not a significant issue in our study for several reasons. First, we never include any of the variables with a high correlation in the same model making multicollinearity due to their simultaneous inclusion in an estimating equation unlikely. Second, we conducted Variance Inflation Factor (VIF) analysis, which provides a measure of the degree to which the variance of an estimated regression coefficient is increased due to multicollinearity, to quantify the severity of the effects of multicollinearity in our models. We examined the VIF for all coefficients in all of our specifications. None of the variables listed above ever generated a VIF greater than 5, which is well below the acceptable threshold of 10 noted by Kutner et al. (2004). The only two variables that ever recorded VIFs greater than 5 were the Network Size and Network Size Squared variables when they were simultaneously entered into regressions, which is common for non-linear terms. We therefore estimated these regressions with the Network Size Squared term removed, which created no qualitative change in the parameter estimates or the significance of any of the variables in the models. We choose to include the Size Squared term however if it was significant in order to document the non-linear effects of Size and to remove it in cases where it contributed no explanatory power. Third, the real danger of multicollinearity is to bias parameter estimates toward zero by inflating the variance of an estimated regression coefficient. As such, any variance inflation due to collinearity should only serve to make our estimates more conservative (by making confidence intervals wider) and to therefore make it more difficult to estimate statistically significant results. The parameters of interest are significant even if there is variance inflation due to collinearity. Fourth, aside from statistical concerns such as variance inflation due to multicolinearity, we also considered the theoretical implications of these constructs being highly correlated. The measures we have devised are theoretically and conceptually distinct and produce different results in our analyses which are theoretically interesting and make sense from the perspective of our theory. For example, in the case of Total Non-Redundant Information and Information Diversity, we discuss in the paper how these variables are conceptually related in that the first is a proxy for the “volume” of novel information while the second is a proxy for the “variance” of information or topics. We discuss in some depth why these distinctions are important, and why we believe they are significant in some models but not in others. We have also added to and clarified this discussion to bring it to the fore. Furthermore, the raw correlation is particularly uninformative summary statistic in this case. When we consider the correlation of these two variables over their joint distributions, we find that they are highly uncorrelated in particular regions and highly correlated in others. In particular, when the volume of novel information is low the diversity of information is low as well and they are highly correlated. However, they only display a correlation of .12 for values of information diversity greater than one standard deviation less than the

81
normalized mean. The zero order correlation is driven by their high correlation at low levels which makes sense. In the limit, when you receive no email, you receive no novel information and the diversity of your incoming information is also zero. Epsilon perturbations from this limit exhibit similar high correlations. However, as we get into more interesting regions of the distributions, the correlation of these variables decreases significantly as expected and described above. The other variables you list exhibit similar behavior.
32 In fact, Burt (1992: 169) finds stronger evidence of hole effects with the constraint measures we employ than with effective size, demonstrating “exclusive access is a critical quality of relations that span structural holes.”
33 We focus in this paper on incoming information for two reasons. First, we expect network structure to influence incoming information more than outgoing information. Second, the theory we intend to test is about the information to which individuals have access as a result of their network structure, not the information individuals send. These dimensions are correlated.
34 We also tested a negative exponential specification of this relationship with very similar results. Both models fit well.
35 As there are some employees who do not take on projects or who are not involved in any projects in a given month, we only estimate equa-tions for individuals with non-zero revenues in a given month.
36 Given the core-periphery structure of the email network of this firm (displayed in Figure 4), we compared the effects of network diversity on performance for those employees physically located at the headquarters to those who worked in peripheral offices. Our estimates of pooled OLS regressions provide evidence that being in a peripheral office is associated with lower performance, and that the interaction effect of being in a peripheral office and having a diverse network is positive, implying the potential for network diversity to be even more important for the geographically isolated. We do not report these results in this paper due to space and focus considerations and because estimated relationships are not robust to panel data procedures given geographic isolation is a time invariant binary characteristic. However, these results indicate that future work on the importance of network diversity for the geographically isolated may be fruitful.
37 For novel information greater than the normalized mean, coefficients in revenue regressions are negative and significant (βFE = -3340.33, p < .05; βRE = - 3207.06, p < .05) and in completed projects regressions are negative, though not significant (βFE = -.04, N.S.; βRE=-.04, N.S.).
38 We created several sets of clusters for each type and averaged diversity scores for clusters of like type. We repeated the process using 3, 6 and 9 document samples per cluster type to control for the effects of the number of documents on diversity measures.
39 Whether Type-3 or Type-4 clusters are more diverse depends on whether the similarity of two documents in the same third level sub category is greater or less than the difference of similarities between documents in the same second level sub category as compared to documents in categories from the first hierarchical layer onwards. This is, to some extent, an empirical question.
40 The measures produce remarkably consistent diversity scores for each cluster type and the diversity scores increase relatively monotonically from Type-0 to Type-9 clusters. The diversity measures are not monotonically increasing for all successive sets, such as Type-4, and it is likely that the information contained in Type-4 clusters are less diverse than Type-3 clusters due simply to the fact that two Type-4 documents are taken from the same third level sub category.