Embed Size (px)
DESCRIPTION
Network Visualization Software. a few examples Sarah Koo stats 319 - 2.8.11. “Facebook5” Dataset. Caltech (769 Nodes, 16656 Edges) Princeton (6596 Nodes, 293,320 Edges) UNC Chapel Hill (18163 Nodes, 766,800 Edges) Oklahoma Georgetown. Tulip. Can handle up to 1 million nodes - PowerPoint PPT Presentation
Citation preview
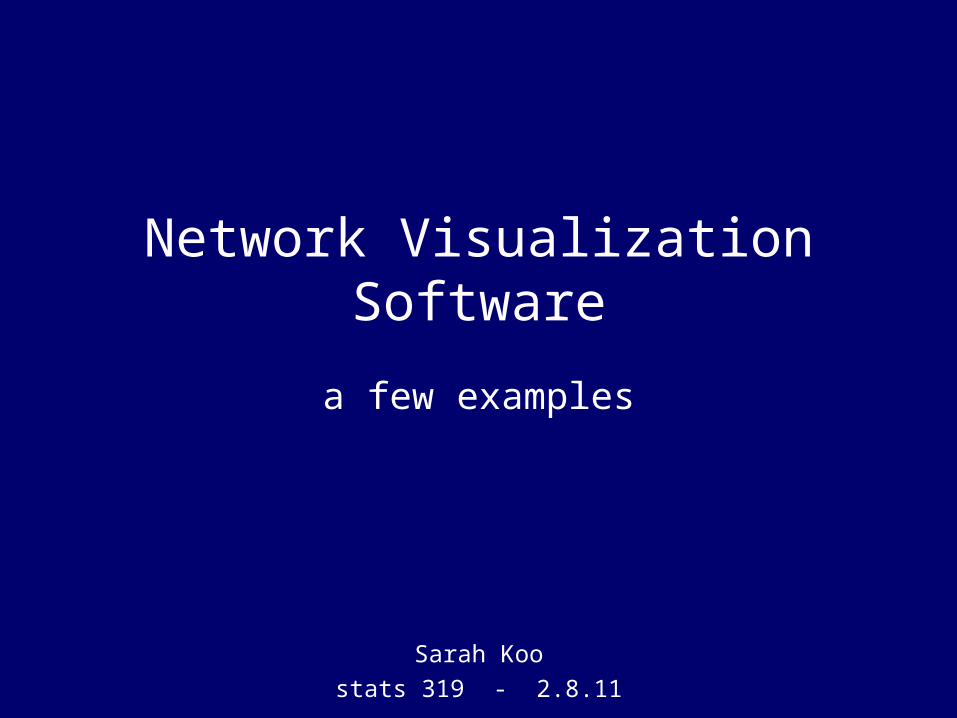
Network Visualization Software
a few examples
Sarah Koo
stats 319 - 2.8.11
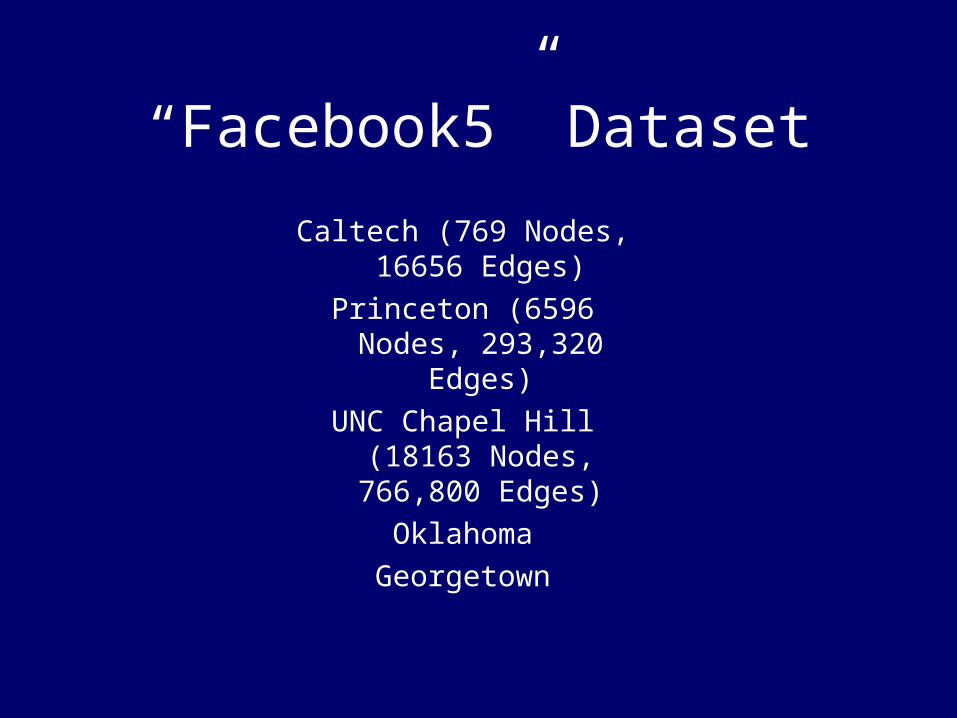
“Facebook5” Dataset
Caltech (769 Nodes, 16656 Edges)
Princeton (6596 Nodes, 293,320
Edges)
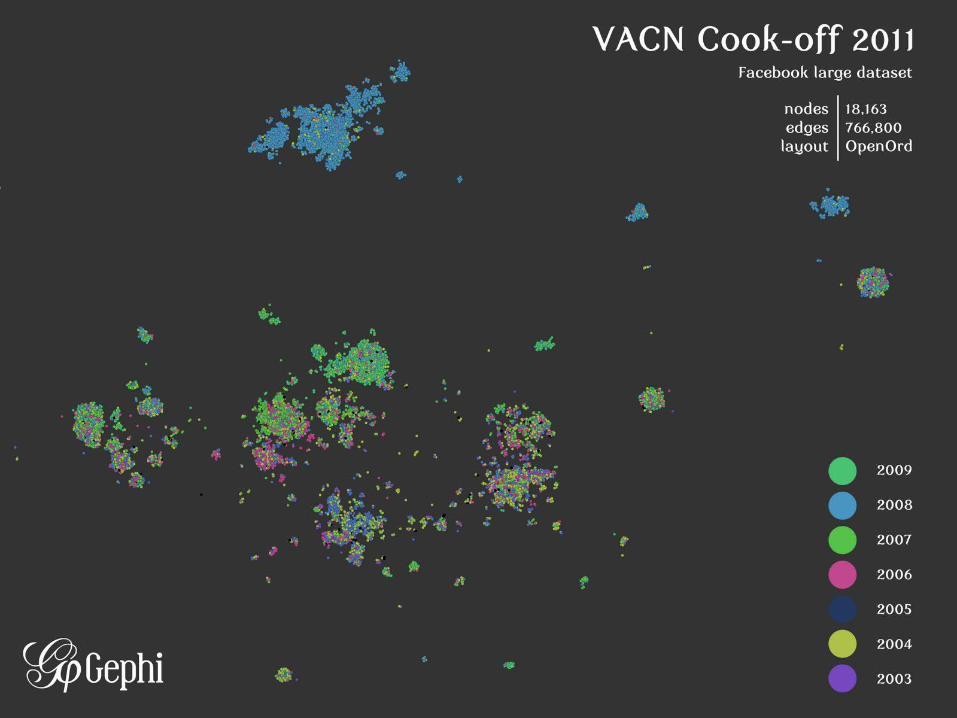
UNC Chapel Hill (18163 Nodes, 766,800 Edges)
Oklahoma
Georgetown
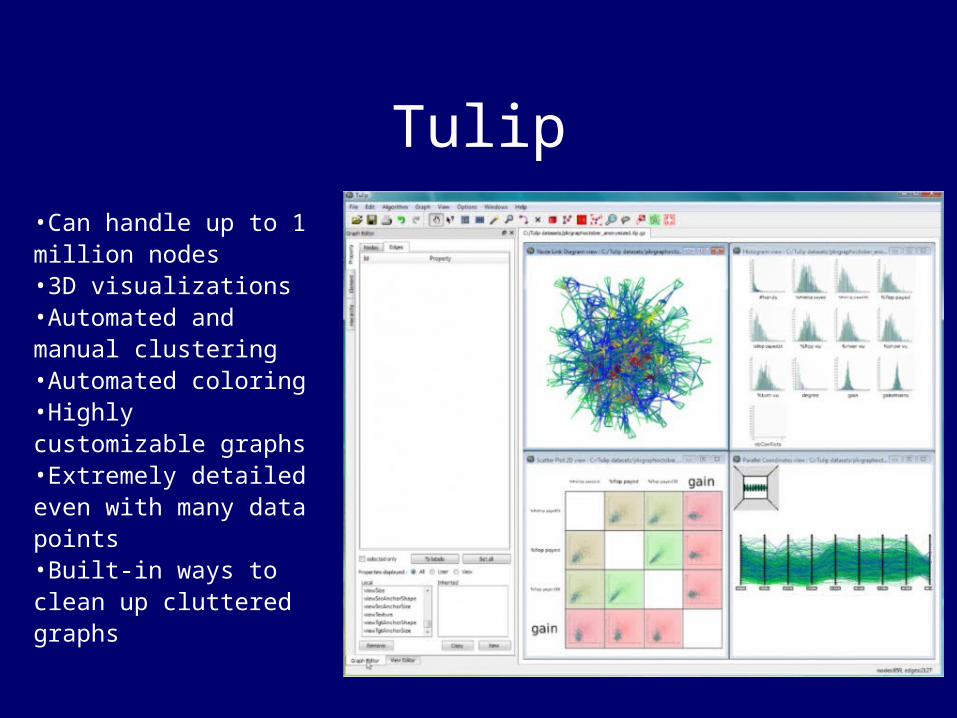
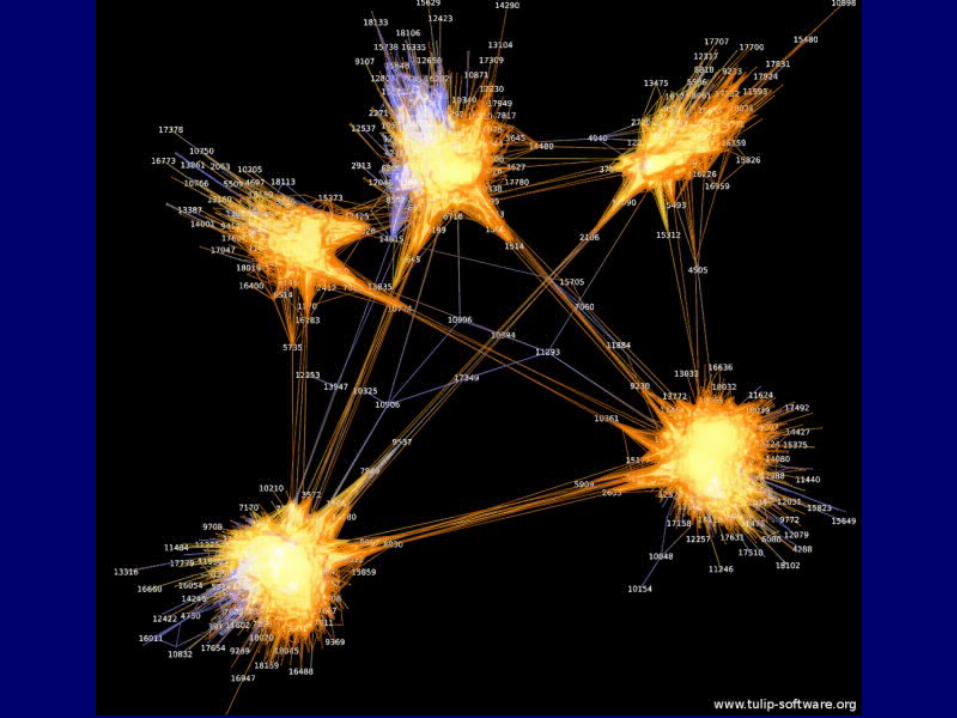
Tulip•Can handle up to 1 million nodes•3D visualizations•Automated and manual clustering•Automated coloring•Highly customizable graphs•Extremely detailed even with many data points•Built-in ways to clean up cluttered graphs
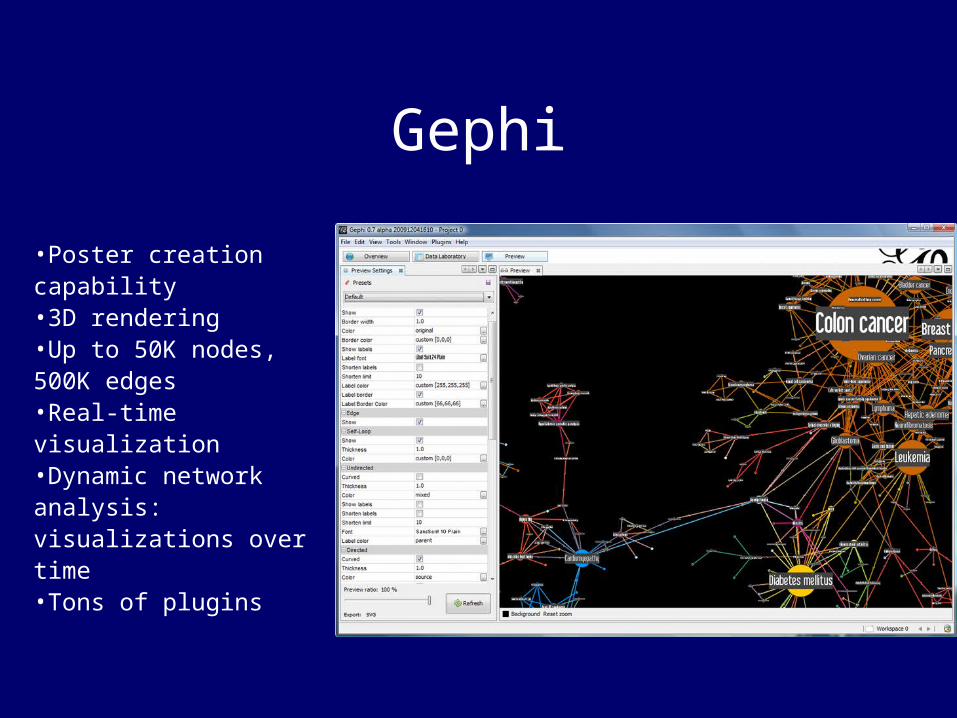
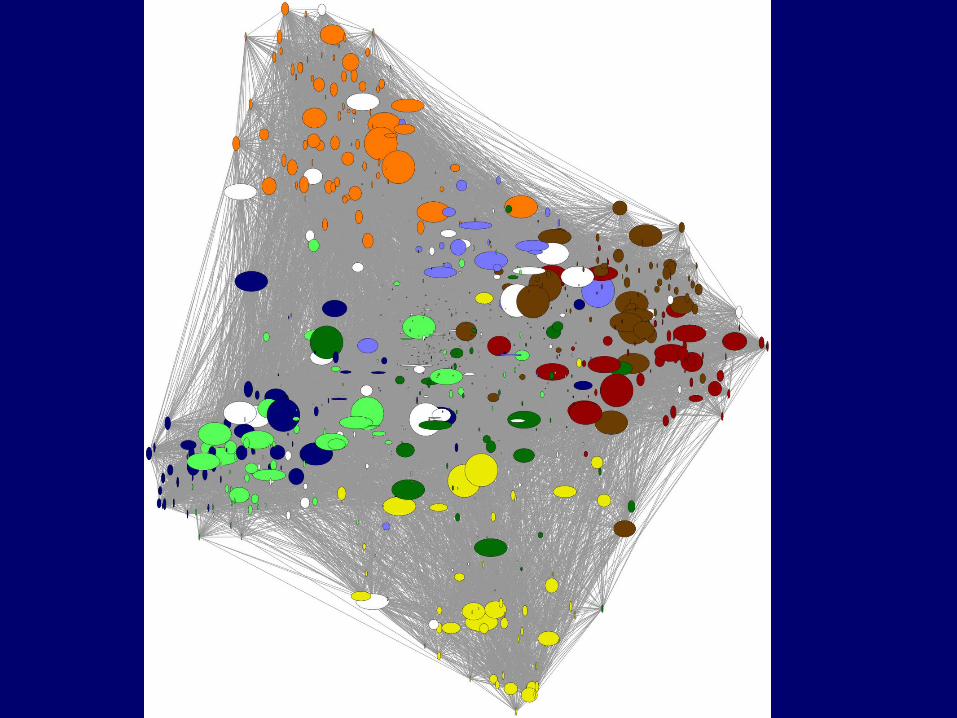
Gephi
•Poster creation capability•3D rendering•Up to 50K nodes, 500K edges•Real-time visualization•Dynamic network analysis: visualizations over time•Tons of plugins
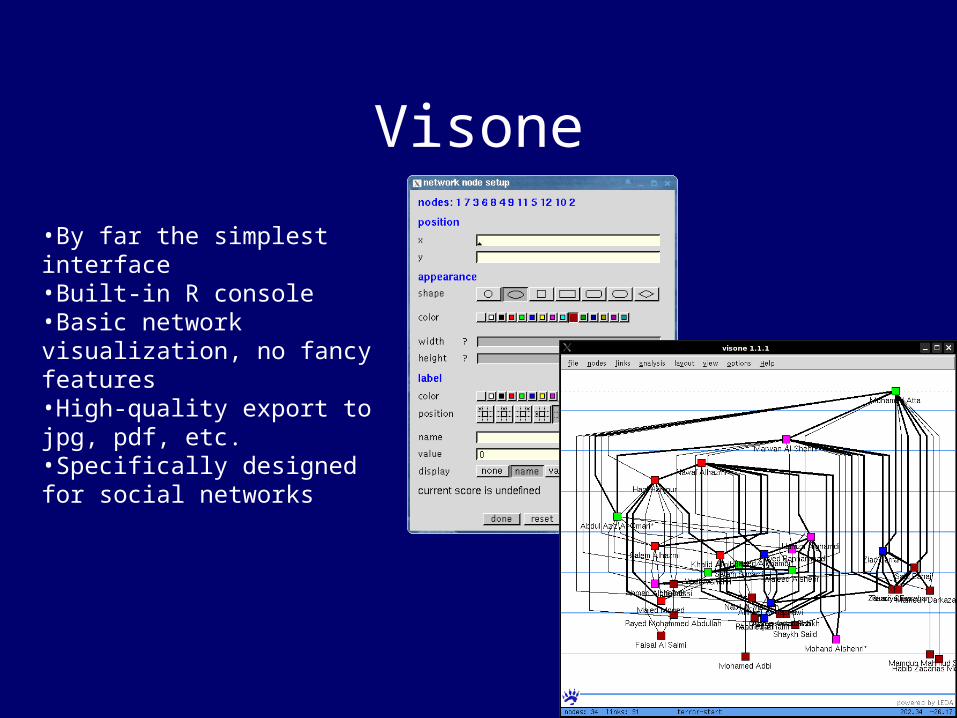
Visone
•By far the simplest interface•Built-in R console•Basic network visualization, no fancy features•High-quality export to jpg, pdf, etc. •Specifically designed for social networks