Embed Size (px)
Citation preview
Appl. Math. Inf. Sci.7, No. 5, 1755-1766 (2013) 1755
Applied Mathematics & Information SciencesAn International Journal
http://dx.doi.org/10.12785/amis/070513
Network and Economic Trade-Off Performance Regionsof Cognitive Radio Systems with Power Control
Ramiro Samano-Robles1,∗ and Atılio Gameiro2
1 Instituto de Telecomunicacoes, Campus Universitario, Aveiro, 3810-193, Portugal2 Departamento de Electronica, Universidade de Aveiro, Aveiro, Portugal
Received: 5 Jan. 2013, Revised: 7 May 2013, Accepted: 9 May 2013Published online: 1 Sep. 2013
Abstract: Cognitive radio will enable terminals with access to licensed and unlicensed portions of the spectrum. This feature isexpected to solve bandwidth scarcity problems in future wireless networks. However, different parts of the spectrum will be subject notonly to different propagation conditions, but also to different licensing and billing agreements. Therefore, in order to obtain the majorprofit and spectrum efficiency, resource allocation algorithms must now target both network and economic performance metrics. Thisproblem can be conveniently expressed as a multi-objective portfolio optimization problem, which has been studied in detail in thefield of economics. This paper addresses the study of network and economic Pareto optimal trade-off performance regions of cognitiveradio systems under average transmit power control policies. Each packet transmission in primary and secondary mode is regarded asa financial asset whose average transmit power is optimized so as to simultaneously maximize return and minimize risk, where risk isthe variance of the return. This paper studies three types of Pareto optimal trade-off regions: primary vs. secondary throughput, returnvs. risk, and sum-throughput vs. fairness, where fairness is evaluated by means of the Gini index. The boundaries of these trade-offregions are derived in parametric closed-form expressions. A power control policy is further proposed that maximizes return whilesimultaneously controlling risk and ensuring a level of quality of service for primary and secondary users. This means that operatorscan maximize revenue and network efficiency, while simultaneously minimizing risk and also ensuring fairness between primary andsecondary users.
Keywords: Cognitive radio, multi-objective portfolio optimization, spectrum aggregation/selection.
1 Introduction
1.1 Cognitive Radio (background)
The increasing demand for higher data rates means thatlarger amounts of bandwidth are required toaccommodate all traffic requests. Unfortunately, thecurrent spectrum licensing paradigm has proved highlyinefficient, as most of the licensed spectrum bands remainlargely underutilized for long periods of time. This issuehas led to spectrum scarcity problems for futureapplications [1].
A solution to this problem can be found in the area ofcognitive radio, where smart, highly adaptive and efficientsensing and radio transmission devices are expected toopportunistically access different frequency bandswithout significantly disturbing licensed or primaryusers [2]- [4].
1.2 Motivation
Cognitive radio promises an adaptive and opportunisticaccess to different portions of the spectrum, therebyimproving end-user satisfaction and partially solvingbandwidth scarcity problems. However, different parts ofthe spectrum will be subject not only to differentpropagation and load conditions, but also to differentlicensing and billing agreements. For example, considerthe terminal licensed to operate in LTE (long termevolution) in Fig.1. With the help of cognitive radio, thisterminal can opportunistically access an unlicensedfrequency band such as the ISM band (industrial,scientific, and medic), which is commonly used for WiFi.Whenever the LTE service is degraded due to load orfading, and the ISM band is sensed as available, then theuser can be handed over to WiFi without losingconnectivity.
∗ Corresponding author e-mail:[email protected]
c© 2013 NSPNatural Sciences Publishing Cor.

1756 R. Samano-Robles , A. Gameiro: Network and Economic Trade-Off...
LTE
(licensed)
ISM
(opportunistic)
ISM primaryuser
Fig. 1 Example of opportunistic spectrum access with cognitiveradio.
In LTE, radio resources are usually allocated by thecentral scheduler in a dedicated fashion, thereby ensuringa good level of quality of service. By contrast, in the ISMband the availability of such resources is less reliable dueto the contention process with all other users in contiguousWiFi networks or other ISM services (e.g., Bluetooth).
Regarding the billing of services, in the licensed LTEband the user can be charged according to the amount ofdata exchanged over the connection. This is because theoperator has invested a considerable amount of money inspectrum licences and needs a return for its investment aswell as a margin profit. By contrast, in the ISM band thereare no fees for spectrum licenses. Therefore, if theconnection is by means of WiFi, the user can be chargedin terms of the duration of the connection with a feerelatively lower than in LTE. Conversely, it is alsopossible that the LTE operator does not owe ISMtransmission technology, but instead it is provided by athird party operator that charges for hot-spot services overdifferent geographical areas. In this case, the LTEoperator might charge users with an additional fee foropportunistic services in the ISM band to cover for thecost of the third-party networking services.
As it can be observed with this simple example, thelicensing and billing agreements of different portions ofspectrum, as well as their radio resource managementrequirements can be considerably different and complex.In this heterogeneous landscape, operators face thefollowing problems with cognitive radio networks:
1.How to allocate spectrum resources so as to obtain themaximum network and spectral efficiencies?
2.How to allocate spectrum resources in order tomaximize the return of investment and margin profit,while simultaneously reducing risk or variations ofthe return?, and
3.How to bill the users for the licensed andopportunistic services so that the prices arecompetitive and attractive in the market and the returnand network resource efficiency are kept at anacceptable level?
This paper aims to partially answer these questions bymerging economic and networking optimization tools inthe analysis of cognitive radio networks with averagetransmit power control.
1.3 Paper contributions
The allocation of radio resources in a cognitive radionetwork with heterogeneous licensing/billing agreements,as well as different network and radio propagationconditions must reflect the complex trade-off between thenetwork and economic worlds. This problem can beconveniently expressed as a multi-objective portfoliooptimization problem, which has been investigated indetail in the fields of economics and financetheory [5]- [8]. This paper attempts to partially addressthis issue by optimizing the transmit power for primaryand secondary transmissions in terms of economicindicators, such as return and risk, in addition to theconventional network performance metrics such asthroughput and load.
This paper proposes a multi-objective function thatattempts to optimize the average transmit power on eachavailable resource of each frequency band such that thetotal return is maximized and the risk (or variance of thereturn) is minimized or controlled. Thiseconomic-optimum average transmit power policy iscompared to the policy that maximizes the throughputregion of the system. In this work, it is assumed that bothprimary and secondary transmissions transmitsimultaneously all the time, thereby interfering with eachother. Our aim is to explore spatial reuse in the context ofcognitive radio. The extension to more complex multipleaccess and cognitive sensing schemes is straightforward.To facilitate analysis, a packet reception model forRayleigh channels is also proposed that allows for thecalculation of correct packet reception statistics inclosed-form expressions in the presence of interferencebetween primary and secondary users.
The boundaries of three types of Pareto optimaltrade-off performance regions are here derived inparametric closed-form expressions: primary vs.secondary throughput, risk vs. return, and sum throughputvs fairness. By inspection and by analytical work,conditions are derived for simultaneously achievingmaximum throughput and maximum economicperformance. This means that operators cansimultaneously maximize revenue and network resourceefficiency. A transmit power control policy is furtherproposed that maximizes return while, simultaneously,controlling risk and ensuring a level of quality of servicefor primary and secondary users. This means thatoperators can maximize economic and network efficiencywhile ensuring a given level of fairness between primaryand secondary users. The trade-off performance regionsof this transmission policy are characterized anddiscussed. The results in this paper also give someindication of the economic parameters in terms of returnand risk that will provide operators with optimumnetwork and revenue performances, which can be alsouseful in the design of billing schemes.
c© 2013 NSPNatural Sciences Publishing Cor.

Appl. Math. Inf. Sci.7, No. 5, 1755-1766 (2013) /www.naturalspublishing.com/Journals.asp 1757
1.4 Related works and comparison
Techno-economic analysis and study of wireless networkshas been addressed before in the literature. Theconventional approach was the use of a techno-economicmodel to evaluate the revenue of an operator under agiven set of resource allocation assumptions. The mainobjective was to find the optimum resource allocation thatprovides the largest revenue and that satisfies users of thenetwork [9]. In the context of cognitive radio, research inthis area has been intensive due to the relevance ofunderstanding the potential gains of opportunisticspectrum usage. A review of different approaches for theuse of economic optimization tools in cognitive radio canbe found in [10], where the authors have proposed amarket equilibrium approach where primary andsecondary users implement a learning algorithm so thatthey can adapt the amount of spectrum used, the pricingand the optimum demand that achieve equilibrium. Mostof the existing works are based on game theoreticconcepts (see [11]- [15]). The work in [14] has used anatomic congestion game theoretic approach in a wirelessnetwork with spatial reuse and inter-user interference.The work in [15] addresses the problem of calculating theoptimum spectrum pricing in a dynamic market spectrum.Another related approach for the use of economics incognitive radio can be found in works such as [16]and [17] and references therein, which are based on theconcepts of auction theory.
This paper addresses the optimization of cognitiveradio networks under a slightly different approach. Weuse multi-objective portfolio optimization under theassumption that each packet transmission is a financialasset. Our work explicitly introduces the concept of riskin the resource allocation problem and derives relevantexpressions that allow for an interpretation of the resourceallocation problem as a financial stock market problem.The work in [18] has used the concept of return andvariance of the return but in the context of spectrumpricing and copyright. The work in [7] has used amulti-objective criteria optimization in the problem ofradio access technology selection. Our approach isdifferent from these previous works regarding the explicituse of multi-objective optimization and the exploration ofthe boundaries of different Pareto optimal trade-offregions. This allows us to visualize geometrical attributesand the potential trade-off between network and economicperformance metrics. In other words, instead of deriving aresource allocation policy that achieves a Nash or marketequilibrium between primary and secondary users as inprevious works, here we explicitly explore the boundariesof different trade-off performance regions, and from theirstudy we propose a policy that achieves a good trade-offin terms of network and economic performance. In thissense, our approach complements previous works in theliterature by providing a framework for trade-off analysisand explicit interpretation of financial market stock toolsin cognitive wireless networks.
This paper is organized as follows. Section2describes the system and signal models. Section3presents the packet reception model for primary andsecondary user transmissions. Section4 describes theperformance metrics (network and economic) includingthe definition of throughput, return vs. risk andsum-throughput vs. fairness trade-off performanceregions. Section5 proposes the transmission policies thatachieve the boundaries of the three types of trade-offperformance region, as well as an additional policy thatensures a level of fairness between primary and secondaryusers. Section6 presents the results by means of sketchesof the three types of region under different network andeconomic conditions, and finally Section7 presents theconclusions.
2 System and signal model
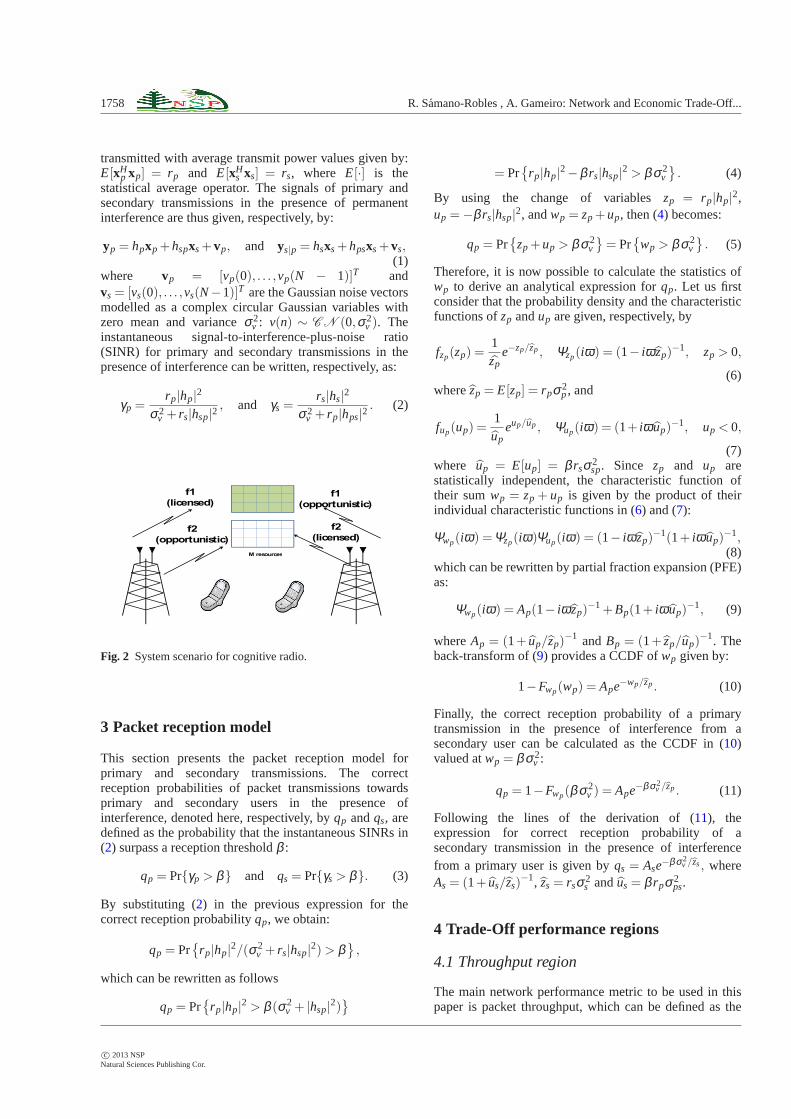
Consider the deployment scenario in Fig.2 with L = 2networks, operating inK = 2 different frequency bandsf1and f2, respectively. The two networks are assumed tohave a total ofM orthogonal radio resources available forallocation on each of the frequency bands, one forprimary (licensed) transmissions, and the other one forsecondary (opportunistic) transmissions. Networkl = 1uses frequencyf1 for licensed transmissions andf2 foropportunistic transmissions. By contrast, networkl = 2uses frequencyf2 for licensed and f1 for secondarytransmissions. For simplicity, we consider all theresources to be statistically identical.
Let us focus on a single radio resource: a primary userwill experience a channel with its serving base stationdenoted byhp and a channel with the potential source ofinterference given by a secondary transmission denotedby hsp. Similarly, a secondary user will experience achannel with its serving base station denoted byhs and achannel with the potential source of interference from aprimary transmission denoted byhps. All channels will bemodelled as circular complex Gaussian random variableswith zero mean and variances denoted, respectively, by:σ2
p, σ2s , σ2
sp, andσ2ps. It is assumed that both BSs always
have information ready to be transmitted to the two typesof user (full queue), which means that they permanentlyinterfere with each other. The extension to more complexmedium access control schemes with interference orcollision avoidance is straightforward. Each BS attemptsto control the transmit power of primary and secondarytransmissions based on the information collected duringthe sensing and cognitive phases. The aim of this powercontrol scheme is to achieve a good trade-off performancein terms of different metrics that will be defined later inthis paper.
Now, consider that primary and secondary usersreceive packets with N symbols, denoted here,respectively, by xp = [xp(0), . . . ,xp(N − 1)]T , andxs = [xs(0), . . . ,xs(N − 1)]T , where (·)T is the vectortranspose operator. Let us assume that packets are
c© 2013 NSPNatural Sciences Publishing Cor.
1758 R. Samano-Robles , A. Gameiro: Network and Economic Trade-Off...
transmitted with average transmit power values given by:E[xH
p xp] = rp and E[xHs xs] = rs, where E[·] is the
statistical average operator. The signals of primary andsecondary transmissions in the presence of permanentinterference are thus given, respectively, by:
yp = hpxp+hspxs+vp, and ys|p = hsxs+hpsxs+vs,(1)
where vp = [vp(0), . . . ,vp(N − 1)]T andvs = [vs(0), . . . ,vs(N−1)]T are the Gaussian noise vectorsmodelled as a complex circular Gaussian variables withzero mean and varianceσ2
v : v(n) ∼ C N (0,σ2v ). The
instantaneous signal-to-interference-plus-noise ratio(SINR) for primary and secondary transmissions in thepresence of interference can be written, respectively, as:
γp =rp|hp|
2
σ2v + rs|hsp|2
, and γs =rs|hs|
2
σ2v + rp|hps|2
. (2)
f1
(licensed)
f2
(opportunistic)
f1
(opportunistic)
f2
(licensed)
M resourcesM resources
Fig. 2 System scenario for cognitive radio.
3 Packet reception model
This section presents the packet reception model forprimary and secondary transmissions. The correctreception probabilities of packet transmissions towardsprimary and secondary users in the presence ofinterference, denoted here, respectively, byqp andqs, aredefined as the probability that the instantaneous SINRs in(2) surpass a reception thresholdβ :
qp = Pr{γp > β} and qs = Pr{γs > β}. (3)
By substituting (2) in the previous expression for thecorrect reception probabilityqp, we obtain:
qp = Pr{
rp|hp|2/(σ2
v + rs|hsp|2)> β
},
which can be rewritten as follows
qp = Pr{
rp|hp|2 > β (σ2
v + |hsp|2)}
= Pr{
rp|hp|2−β rs|hsp|
2 > βσ2v
}. (4)
By using the change of variableszp = rp|hp|2,
up =−β rs|hsp|2, andwp = zp+up, then (4) becomes:
qp = Pr{
zp+up > βσ2v
}= Pr
{wp > βσ2
v
}. (5)
Therefore, it is now possible to calculate the statistics ofwp to derive an analytical expression forqp. Let us firstconsider that the probability density and the characteristicfunctions ofzp andup are given, respectively, by
fzp(zp) =1zp
e−zp/zp, Ψzp(iω) = (1− iω zp)−1, zp > 0,
(6)wherezp = E[zp] = rpσ2
p, and
fup(up) =1up
eup/up, Ψup(iω) = (1+ iωup)−1, up < 0,
(7)where up = E[up] = β rsσ2
sp. Since zp and up arestatistically independent, the characteristic function oftheir sumwp = zp + up is given by the product of theirindividual characteristic functions in (6) and (7):
Ψwp(iω) =Ψzp(iω)Ψup(iω) = (1− iω zp)−1(1+ iωup)
−1,(8)
which can be rewritten by partial fraction expansion (PFE)as:
Ψwp(iω) = Ap(1− iω zp)−1+Bp(1+ iωup)
−1, (9)
whereAp = (1+ up/zp)−1 andBp = (1+ zp/up)
−1. Theback-transform of (9) provides a CCDF ofwp given by:
1−Fwp(wp) = Ape−wp/zp. (10)
Finally, the correct reception probability of a primarytransmission in the presence of interference from asecondary user can be calculated as the CCDF in (10)valued atwp = βσ2
v :
qp = 1−Fwp(βσ2v ) = Ape−βσ2
v /zp. (11)
Following the lines of the derivation of (11), theexpression for correct reception probability of asecondary transmission in the presence of interferencefrom a primary user is given byqs = Ase−βσ2
v /zs, whereAs = (1+ us/zs)
−1, zs = rsσ2s andus = β rpσ2
ps.
4 Trade-Off performance regions
4.1 Throughput region
The main network performance metric to be used in thispaper is packet throughput, which can be defined as the
c© 2013 NSPNatural Sciences Publishing Cor.
Appl. Math. Inf. Sci.7, No. 5, 1755-1766 (2013) /www.naturalspublishing.com/Journals.asp 1759
long-term ratio of total number of correctly transmittedpackets to the total number of time-slots used in themeasurement. The packet throughput of primary userscan be related to the correct packet transmissionprobability as follows:
Tp = (1−η)qp, (12)
whereη is the block error rate (BLER) of the modulationand coding scheme being used for the transmission,qp = Pr{γp > β} is the packet reception probability in(11), and β is the reception threshold for the givenmodulation and coding scheme and for the given BLERη . In this paper, we will assume all packet transmissionswill use the same modulation and coding scheme andtherefore for simplicity the throughput will be consideredas equal to the reception probability:
Tp = qp and Ts = qs. (13)
Let us now define the concept of throughput regionfollowing the concepts found in [19]. For this purpose, letT = [Tp Ts]
T be the vector of stacked throughput valuesof primary and secondary users, andr = [rp rs]
T be thevector of stacked average transmit power levels. Thethroughput regionCT is the union over all possiblerealizations of transmit power values:
CT = {T|Tp = Tp(r), Ts = Ts(r),0≤ rp, rs ≤ rmax}, (14)
where rmax is the transmit power constraint. Thethroughput region can be also considered as the regionwhere all the possible values of primary/secondary userthroughput exist.
4.2 Sum-throughput vs. fairness trade-off region
The sum throughput of primary and secondary users canbe simply defined as:
T = Tp+Ts. (15)
The metric for fairness to be used in this paper is the Giniindex, which is commonly used in the field of economics.The Gini index takes value between zero and one: a valueof one means that one user takes all the throughput (worstfairness) while the value of zero means complete fairnesswhen all users get identical performances [21]. In oursetting the fairness Gini indicator is defined as a minorvariation of the definition in [21]:
FG =|Tp−Ts|
Tp+Ts, (16)
where| · | is the absolute value operator. Let us now definethe concept of sum-throughput vs. fairness trade-offregion. For this purpose, letF = [T FG]
T be the vectorof stacked values of sum-throughput and fairness. The
sum-throughput vs. fairness trade-off regionCF is theunion over all possible realizations of transmit powervalues:
CF = {F|T = T(r), F = F(r),0≤ rp, rs ≤ rmax}. (17)
The sum-throughput vs. fairness trade-off region can bealso considered as the region where all the possible valuesof sum-throughput and fairness exist.
4.3 Return-risk region
The main objective of this paper is to optimize thetransmission parameters of primary and secondary usersaccording to network and economic metrics. To achievethis goal, we will borrow concepts from the theory ofmulti-objective portfolio optimization, which iscommonly used in the fields of economics and financetheory [6]. In a financial portfolio optimization problem, aportion of each financial asset from a given set of assetshas to be optimized so as to maximize revenue or returnand simultaneously control or minimize the risk orvariance of the return [6]. In this paper, we will considereach correct packet transmission as a financial asset.Therefore, we will attempt to optimize the transmit powerlevels of primary and secondary transmissions in the sameway as optimum allocation weights for the different assetsare calculated in a financial portfolio optimizationproblem. For this purpose, let us define some economicmetrics such as the instantaneous return per correctlytransmitted packet in primary mode aspp, and insecondary mode asps. Since packet reception is a randomprocess, let us define the instantaneous return of aprimary user as follows:
Instantaneous return primary =
Rp = pptp, (18)
wheretp is a binary random variable that takes the valueof tp = 1 if the packet was correctly transmitted and thevalue oftp = 0 if the packet was incorrectly transmitted.By averaging the previous expression we obtain:
Average return primary = E[Rp]
= Rp = E[pp]Pr{tp = 1}= ppPr{γp > β}= ppqp. (19)
Following the lines of the previous derivation, theexpressions for average return of secondary packettransmissions can be written as follows:
Rs = psqs. (20)
Let us now calculate the risk of a primary packettransmission as the variance of (18):
Risk primary = Sp = E[(Rp− Rp)2]
c© 2013 NSPNatural Sciences Publishing Cor.

1760 R. Samano-Robles , A. Gameiro: Network and Economic Trade-Off...
= E[R2p]− R2
p = E[p2p]Pr{tp = 1}− (ppqp)
2 =
= E[p2p]Pr{γp > β}− (ppqp)
2 = E[p2p]qp− (ppqp)
2.(21)
Note that the termsE[p2p] andE[pp] = pp are related to
the financial fluctuations of the transmissions in theprimary band, whereas the termsqp andq2
p are related tothe fluctuations of the channel conditions. Now, bothtypes of fluctuations usually occur in differenttime-scales. Since we are interested in short-termfluctuations, particularly in the time scale of radioresource allocation schemes, it would be possible toignore the terms related to financial fluctuations.However, in this paper these terms will not be dropped asthey will be used for assigning different priority levels toprimary and/or secondary transmissions. This will allowus to control in a better manner the proposed short-termradio resource allocation schemes. Following the lines ofthe derivation of (21), the expression for the risk ofsecondary packet transmissions is given by:
Ss = E[p2s]qs− (psqs)
2. (22)
Finally, the total average return combining primary andsecondary transmissions, denoted here byR, can becalculated as:
Total average return = R
= Rp+ Rs, (23)
Following the lines of the derivation of the previousexpression, the total risk, denoted here byS, can becalculated as follows:
Total Risk = S= Sp+ Ss, (24)
Having defined the total average return and the total risk,let us now define the concept of return-risk region. For thispurpose, letM = [R S]T be the vector of stacked returnand risk values. The return-risk regionCM is the union overall possible realizations of transmission power levels:
CM = {M|R= R(r), S= S(r),0≤ rp, rs ≤ rmax}, (25)
which can be simply considered as the region where all thepossible values of return and risk exist.
5 Optimum power control policies
5.1 Throughput-region optimum
To derive the boundaries or envelope of the throughputregion, a multi-objective optimization is here proposed,where allT ’s can be simultaneously optimized:
ropt = argmaxr
[ Tp, Ts ] subject to rp, rs< rmax.
(26)
This multi-objective optimization problem can bereformulated by using the method of scalarization [6]:
ropt = argmaxr
Tp+µTTs, subject to rp, rs < rmax
(27)where µT is the trade-off weight between primary andsecondary throughput functions. By solving this problemfor different values ofµT it is possible to obtain theboundaries of the throughput region, which can also beregarded as the Pareto optimal trade-off curve of themulti-objective optimization problem [6]. Since thethroughput expressions for both primary and secondaryusers increase monotonically with the transmit powerlevels, their global maxima are given when one or bothpower levels are set to be equal to the maximum transmitpower constraintrmax. Therefore, the boundaries of thethroughput region are given by the following set ofcurves:
Tp = Tp(rp = rmax, rs ∈ {0, rmax}) (28)
andTs = Ts(rp = rmax, rs ∈ {0, rmax}) (29)
for the case whenrp = rmax, and
Tp = Tp(rp =∈ {0, rmax}, rs = rmax) (30)
andTs = Ts(rp =∈ {0, rmax}, rs = rmax) (31)
for the case whenrs = rmax.
5.2 Sum-throughput vs. fairness region optimum
To derive the boundaries of the sum-throughput vs.fairness trade-off region, a multi-objective optimizationscheme is here proposed, where both the sum-throughputand fairness can be simultaneously optimized:
ropt = argmaxr
[ T, FG ] s.t. rp, rs < rmax.
(32)This multi-objective optimization problem can bereformulated by using the method of scalarization:
ropt = argmaxr
T +µFFG, subject to rp, rs < rmax
(33)where µF is the trade-off weight between primary andsecondary throughput functions. Since the throughput andfairness expressions increase monotonically with thetransmit power levels, their global maxima are givenwhen one or both power levels are set to be equal to themaximum transmit power constraintrmax. To derive theboundaries of this trade-off region, let us focus on twoextreme cases. The worst fairness performance with thehighest value of sum throughput occurs when the userwith best channel conditions is allocated with themaximum power constraint. By contrast, the best fairnessperformance with the highest sum-throughput occurs
c© 2013 NSPNatural Sciences Publishing Cor.

Appl. Math. Inf. Sci.7, No. 5, 1755-1766 (2013) /www.naturalspublishing.com/Journals.asp 1761
when both primary and secondary users achieve the samethroughput given the user with the worst channel isallocated with the maximum transmit power constraint.The boundaries of the sum-throughput vs. fairness regioncan then be simply obtained by extending theperformance metrics from these two extreme points andby changing the value of the power of the user that wasnot initially allocated with the maximum powerconstraint. Therefore, the boundaries of thesum-throughput vs. fairness trade-off region when theprimary user experiences better channel conditions thanthe secondary user are given by the following set ofcurves:
T = T(rp = rmax, rs ∈ {0, rmax}) (34)
andFG = FG(rp = rmax, rs ∈ {0, rmax}) (35)
whenrp = rmax, and
T = T(rp ∈ {r∗p, rmax}, rs = rmax) (36)
andFG = FG(rp ∈ {r∗p, rmax}, rs = rmax) (37)
whenrs = rmax. The termrp∗ denotes the value of powerfor which the throughput of primary and secondary usersis identical givenrs = rmax. Similar expressions can bederived for the case when the secondary user experiencesbetter channel conditions than the primary user.
5.3 Return-risk optimum: Financial Portfoliooptimization
To derive the boundaries of the return-risk region, amulti-objective portfolio optimization is here proposed,where both return and risk functions can besimultaneously optimized:
ropt = argmaxr
[ R, S ] subject to rp, rs< rmax.
(38)This multi-objective optimization problem can bereformulated by using the method of scalarization:
ropt = argmaxr
R−µr S, subject to rp, rs < rmax (39)
whereµr is the trade-off weight between return and riskfunctions. By differentiating the objective function withrespect torp andrs we obtain:
∂ R∂ rp
+µr∂ S∂ rs
= 0
and∂ R∂ rs
+µr∂ S∂ rs
= 0.
By obtaining the parameterµr from any of the equationsand substituting it back in the other expression we obtain:
∂ R∂ rp
∂ S∂ rs
−∂ S∂ rs
∂ R∂ rs
= 0,
which can be also expressed as:
|Je|=
∣∣∣∣∣
( ∂ R∂ rp
∂ R∂ rs
∂ S∂ rp
∂ S∂ rs
)∣∣∣∣∣= 0, (40)
whereJe is the Jacobian matrix. Due to the complexity ofthis expression, the solution will be obtained by means ofa numerical method. The solution for this expressioncombined with the expressions in (23) and (24) provide aparametric form (in terms of the power levels) of theboundary of the return-risk region. This solution iscomplemented by the boundary conditions which areobtained by setting the transmit power variables equal tothe maximum power constraintrmax or equal to zero.Sketches of the different trade-off regions are provided inthe following section.
5.4 Optimum transmission policy with fairness
In the previous subsections we addressed the derivation ofthe boundaries of the three types of trade-off region.However, it is possible that none of the points of suchboundaries provide a convenient network and economicperformance solution for a given operator. To address thisissue, let us now derive a transmission policy thatmaximizes return while controlling the risk, but which isalso able to ensure a given throughput performance forprimary and secondary users. This can be expressed as:
ropt = argmaxr
R, s.t. S≤ S0,
Tp ≥ αpqp, Ts ≥ αsqs, rp, rs < rmax (41)
where αp and αs are the constraints on primary andsecondary throughput performance, respectively. In thefollowing derivation we assume that the inequalityconstraints Tp ≥ αpqp and Ts ≥ αsqs can besimultaneously achieved. Since the return is an increasingfunction in terms of the average power levels of primaryand secondary users, the solution that complies with allthe constraints can be found by exploring all theintersections points between the different equalityconstraints and the boundary of the return-risk region(S= S0, Tp = αpqp, Ts = αsqs and bd(CM), wherebd(CM) indicates the boundary of the regionCM) andselect the intersection with the best return value.
6 Results and discussion
This section presents the sketches of the three types oftrade-off performance region studied in this paper. The
c© 2013 NSPNatural Sciences Publishing Cor.

1762 R. Samano-Robles , A. Gameiro: Network and Economic Trade-Off...
results will be divided in two cases: one where theinterference between secondary and primary users is high,and the second one where this interference is relativelylow. Primary users will be modelled with channelparameter ofσ2
p = 4, while secondary users will use aparameter ofσ2
s = 2. Interference parameters in the highinterference scenario will be given byσ2
sp = 10 andσ2
ps = 12. Interference parameters in the low interferencescenario will be given byσ2
sp = 0.5 and σ2ps = 0.25.
Reception threshold is set to a value ofβ = 1. Regardingthe economic parameters, the secondary transmission willalways be considered with a higher financial risk valuewith E[p2
s] − p2s = 10, while the risk in primary
transmission will be fixed too to a value ofE[p2
p]− p2p = 0.1. In the case of the average return we
will consider two cases: one where the return of theprimary transmission is higher than the average return ofthe secondary transmission ( ˆpp = 5, ps = 1), and thesecond case where secondary transmissions experiencehigher average return than primary transmissions ( ˆpp = 1,ps = 5).
Fig. 3, 4 and 5 show, respectively, the throughput,return-risk, and sum throughput vs. fairness trade-offregions in a system with high interference and wherereturn in the primary is higher than the return in thesecondary. Note that the throughput region in fig.3 isnon-convex. All figures show the region projected by theproposed power control policy with fairness consideringthe constraintsαp = 0.3, αs = 0.1, andS0 = 7. The sumthroughput vs. fairness region in Fig.4 shows that worstfairness performance, which is also the point of highersum-throughput performance, occurs when primary useris allocated with the maximum power constraintrmax. Bycontrast, the point with the best fairness performance isgiven by the point where the secondary user is allocatedwith the maximum power, at the expense ofsum-throughput reduction. In this figure it can be alsoobserved that the proposed policy maintains a fairnessbelow the value of 0.6, thereby showing that it providesgood fairness performance. In the return vs. risk trade-offregion in Fig.5 it can be observed that the maximum riskperformance is given when the secondary user is allocatedwith full power. By contrast, the lowest risk performance,which gives also the highest return performance, is givenwhen the primary user is allocated with full power. Sincenone of these performance points provide fairness, it canbe observed that the proposed policy with fairness givesus a good trade-off between the achieved return and therisk associated with the allocation. Note that theboundaries of this trade-off region are given exclusivelyby boundary conditions with maximum or null powerallocation.
Fig. 6, 7 and 8 show, respectively, the throughput,return-risk, and sum throughput vs. fairness trade-offregions in a system with high interference and wherereturn in the primary is lower than the return in thesecondary. While the throughput and sum throughput vs.
Policy withfairness
Full power primary
Full power secondary
Full power primary and secondary
Fig. 3 Throughput region of a cognitive radio system with highinterference and primary transmission with higher return thansecondary transmission.
Full power primary
Full power secondary
Full power primary andsecondary
Policy with fairness
Fig. 4 Sum-throughput vs fairness trade-off region of a cognitiveradio system with high interference and primary transmissionwith higher return than secondary transmission.
Full power primary
Full power secondary
Full power primary and secondary
Null power secondary
Null power primary
Policy with fairness
Fig. 5 Return-risk region of a cognitive radio system with highinterference and primary transmission with higher return thansecondary transmission.
c© 2013 NSPNatural Sciences Publishing Cor.

Appl. Math. Inf. Sci.7, No. 5, 1755-1766 (2013) /www.naturalspublishing.com/Journals.asp 1763
fairness trade-off regions remain quite similar to theprevious case in Fig.3 to Fig. 5, the return vs. risktrade-off region in Fig.8 has been considerably changed.The point of maximum return is now given when thesecondary user is allocated with full power, which alsoprovides the point with maximum risk, as secondarytransmissions have been considered as always more riskythan primary transmissions. We can observe that incomparison with the previous example in Fig.5 the returnobtained by the policy with fairness is lower, and indeedthe whole return performance seems to be much morelimited. This suggests that having a primary system withhigher return than a secondary system provides muchmore flexible allocation in order to obtain goodperformance both in terms of economic and networkmetrics.
Full power secondary
Full power primary
Full power primary and secondary
Policy with fairness
Fig. 6 Throughput region of a cognitive radio system with highinterference and primary transmission with lower return thansecondary transmission.
Full power primary
Full powersecondary
Full power primaryand secondary
Policy with fairness
Fig. 7 Sum-throughput vs fairness trade-off region of a cognitiveradio system with high interference and primary transmissionwith lower return than secondary transmission.
Full power secondary
Full power primary
Full power primary and secondary
Null power primary
Null power secondary
Policy with fairness
Fig. 8 Return-risk region of a cognitive radio system with highinterference and primary transmission with lower return thansecondary transmission.
Fig. 9, 10 and11 show, respectively, the throughput,return-risk, and sum throughput vs. fairness trade-offregions in a system with low interference and wherereturn in the primary is lower than the return in thesecondary. It can be observed that the throughput regionin Fig. 9 is now convex as compared to the case with highinterference in Fig.6 and 3. The sum-throughput vs.fairness trade-off region has also changed. The maximumsum throughput is now given by the point where thesecondary user is allocated with full power and not theprimary user as in the previous cases. The return vs. riskregion in Fig.11 is also different. In comparison with theprevious cases, where the boundaries were given bysimply using maximum or null power allocationconditions, in this case one part of the boundary is givenby the solution of the jacobian determinant in eq.(40).The proposed policy with fairness can be observed in allfigures to comply with the constraints on throughput andrisk.
Full power secondary
Full power primary
Full power primary and secondary
Policy with fairness
Fig. 9 Throughput region of a cognitive radio system with lowinterference and primary transmission with lower return thansecondary transmission.
c© 2013 NSPNatural Sciences Publishing Cor.

1764 R. Samano-Robles , A. Gameiro: Network and Economic Trade-Off...
Full power primary
Full power secondary
Policy with fairness
Fig. 10 Sum-throughput vs fairness trade-off region of acognitive radio system with low interference and primarytransmission with lower return than secondary transmission.
Full power primary
Full power secondary
Null power primary
Policy with fairness
Null power secondary
Jacobian solution
Fig. 11 Return-risk region of a cognitive radio system with lowinterference and primary transmission with lower return thansecondary transmission.
Fig. 12, 13 and14 show, respectively, the throughput,return-risk, and sum throughput vs. fairness trade-offregions in a system with low interference and wherereturn in the primary is higher than the return in thesecondary. The main difference with respect to theprevious case is that the return-risk region in Fig.14 isnow larger than the region in the case where primary haslower return than the secondary, and mainly the proposedpolicy with fairness has a much better and extendedperformance over the projected region. This confirms theprevious result where better economic performance isobtained when the return in the primary is higher than thereturn in the secondary. This result can be useful in thedesign of billing and pricing schemes that give moreweight to primary than to secondary transmissions. Thisalso suggests that in order to obtain a good economicperformance, a given operator might want to keep areliable licensed primary band to support the major partof the requested traffic, and a secondary band which ismore unreliable, more risky and with lower return than
the primary band in order to provide additionalopportunistic services.
Full power secondary
Full power primary
Full power primaryand secondary
Policy with fairness
Fig. 12 Throughput region of a cognitive radio system with lowinterference and primary transmission with higher return thansecondary transmission.
Policy with fairness
Full power primary
Full power secondary
Fig. 13 Sum-throughput vs fairness trade-off region of acognitive radio system with low interference and primarytransmission with higher return than secondary transmission.
7 Conclusions
This paper has presented the derivation of the optimumaverage power transmission policies that will allow acognitive radio system to achieve, respectively, theboundaries of three types of trade-off regions: primaryversus secondary throughput performance, sumthroughput vs. fairness, and return versus risk (variance ofthe return) trade-off performance. The later transmissionpolicy is based on a multi-objective portfolio optimizationapproach that blends network with economic performancemetrics. A packet reception model was also proposed forRayleigh channels to derive closed-form expressions that
c© 2013 NSPNatural Sciences Publishing Cor.

Appl. Math. Inf. Sci.7, No. 5, 1755-1766 (2013) /www.naturalspublishing.com/Journals.asp 1765
Full power secondary
Full power primary
Null power secondary
Full power primary
Null power primary
Policy with fairness
Fig. 14 Return-risk region of a cognitive radio system with lowinterference and primary transmission with higher return thansecondary transmission.
can be included in all derivations. The boundaries of theregions were derived also in closed-form expression andsketches were further provided for scenarios withdifferent interference assumptions and economicperformance metrics. Particular good results wereobtained when the return in the primary band is higherthan the return in the secondary frequency band. In viewthat the boundaries of the two types of region tend to beunfair to primary or secondary users, a third transmissionpolicy was proposed that allows to maximize return,control the risk and to ensure a certain level of quality ofservice for primary and secondary user transmissions.This means that operators will be able to maximizenetwork and economic performance while ensuringfairness between the different types of users. The resultscan help operators improve network performance and toderive optimum billing schemes that will allow maximizerevenue and quality of service simultaneously. the resultsin this paper have assumed continuous transmission ofprimary and secondary users. Future work includes theuse of more advanced contention avoidance and mediumaccess control schemes for cognitive radio systems.
References
[1] R. Pal, D. Idris, K. Pasari, and N. Prasad, “CharacterizingReliability in cognitive radio networks,”First Int. Symposiumon Applie Sciences on Biomedical and Commun. tech.,1-6(2008),
[2] L. Lu, X. Zhou, U. Onunkwo, and G. Y. Li, “Ten years ofresearch in spectrum sensing and sharing in cognitive radio,”EURASIP Journal on Wireless Commun. and Networking,(2012).
[3] W. Jouini, C. Moy, and J. Palicot “Decision making forcognitive radio equipment: analysis of the first 10 years ofexploration,” EURASIP Journal on Wireless Commun. andNetworking, (2012).
[4] J. Mitola Software radios: survey, critical evaluation andfuture directions IEEE Aerosp. Electron. Syst. Mag.,8, 25-31, (1993).
[5] F. J. Fabozzi, et al., Robust Portfolio Optimization andManagementWiley Finance, (2007).
[6] S. Boyd and L. Vandenberghe, Convex optimization,Cambridge University Press, (2004).
[7] M. M. Alkhawlani, and A. T. Zahar, “Intelligent RadioNetwork Selection for Next Generation Networks”Journalof Intelligent Computing,1, 64-74 (2010).
[8] A. Konak, D. W. Coit, and A. E. Smith, “Multi-objectiveoptimization using genetic algorithms: A tutorial,”ReliabilityEngineering and System Safety,Special issue in geneticalgorithms and reliability,91, 992-1007.
[9] T. Smura, “Techno-economic modelling of wireless networkand industry architectures,” Doctoral dissertation,AaltoUniversity, (2012).
[10] D. Niyato and E. Hossain, “Spectrum trading in cognitiveradio networks: A market-equilibrium-based approach,”IEEE Wireless Communications,15, 71-80 (2008).
[11] R. Southwell, X. Chen, and J. Huang, “Quality of ServiceSatisfaction Games for Spectrum Sharing,” IEEE INFOCOM- Mini Conference. Turin, Italy, (2013).
[12] X. Chen, and J. Huang, “Spatial Spectrum Access Game:Nash Equilibria and Distributed Learning,” ACM Mobihoc.Hilton Head Island, South Carolina, (2012).
[13] Duan, Lingjie, Jianwei Huang, and Biying Shou. “DuopolyCompetition in Dynamic Spectrum Leasing and Pricing,”IEEE Transactions on Mobile Computing,11, 1706-1719(2012).
[14] Tekin, Cem, et al. “Atomic Congestion Games on Graphsand Their Applications in Networking,”IEEE Transactionson Networking,20, 1541-1552 (2012).
[15] L. Duan, J. Huang, and B. Shou, “Investment andPricing with Spectrum Uncertainty: A Cognitive Operator’sPerspective,”IEEE Transactions on Mobile Computing,10,1590-1604 (2011).
[16] Y. Zhang, D. Niyato, P. Wang, and E. Hossain, “Auction-based resource allocation in cognitive radio systems,”IEEECommunications Magazine,50, 108-120 (2008).
[17] J. Huang, R. Berry, and M. L. Honig, “Auction-basedSpectrum Sharing,”Springer Journal Mobile Networks andApplications,11, 405-408 (2006).
[18] T. A. Wysocki and A. Jamalipour, “An Economic WelfarePreserving Framework for Spot Pricing and Hedging ofSpectrum Rights for Cognitive Radio,”IEEE Transactionson Network and Service Management,9, 87-99 (2012).
[19] J. Luo and A. Ephremides “On the throughput, capacity,and stability regions of random multiple access,”IEEETransactions on Information Theory,52, 2593-2607 (2006).
[20] R. Samano-Robles, M. Ghogho and D. C. McLernon“Wireless Networks with retransmission diversity and carriersense multiple access,” IEEE Transactions on SignalProcessing, 57, 3722-3726 (2009).
[21] A. W. Marshall and I. Olkin, Inequalities: Theory ofMajorization and its applications,Academic Press, (1979).
c© 2013 NSPNatural Sciences Publishing Cor.

1766 R. Samano-Robles , A. Gameiro: Network and Economic Trade-Off...
Ramiro Samano Roblesreceived his Bachelor degreein Telecommunicationsin 2001 from the NationalAutonomous Universityof Mexico. In 2003,he received his MSc degreein Telecommunications andInformation Systems from theUniversity of Essex, UK, andthe PhD degree in cross-layer
design and signal processing for wireless networks fromthe University of Leeds in 2007. He currently holds apost-doctoral position at the Instituto deTelecomunicacoes in Aveiro, Portugal. His main interestslie in the areas of MAC-PHY cross-layer design, randomaccess protocols, distributed antenna systems, radiofrequency identification, and shaped reflectors design forsatellite communications. He has over 20 technical papersin international journals and conferences. He also hasprofessional experience in major telecommunicationcarriers in Mexico. He has been involved in severalnational and European projects, namely the CODIV,FUTON, ASPIRE, UNITE, CADWIN, and QoSMOS.
Atilio Gameiro receivedhis Licenciatura (five yearscourse) and his PhD fromthe University of Aveiro in1985 and 1993 respectively.He is currently a Professorin the Department ofElectronics and Telecom. ofthe University of Aveiro, anda researcher at the Institutode Telecomunicacoes, Polo de
Aveiro, where he is head of group. His industrialexperience includes a period of one year at BT Labs andone year at NKT Elektronik. His main interests lie insignal processing techniques for digital communicationsand communication protocols, and within this researchline he has done work for optical and mobilecommunications, either at the theoretical andexperimental level, and has published over 120 technicalpapers in International Journals and conferences. Hiscurrent research activities involve space-time-frequencyalgorithms for the broadband wireless systems andcross-layer design. He has been involved and has leadedIT or Univ of Aveiro participation in several national andEuropean projects, namely the RACE projectsMULTIGIGABIT, SPEED, MODAL ,the ACTS projectFRANS, and the IST projects ASILUM, MATRICE,4MORE, ORACLE. He has coordinated CODIV andperformed the technical management of the IP FUTON.
c© 2013 NSPNatural Sciences Publishing Cor.