Embed Size (px)
Citation preview
NetSpecUser Manual
Anupama [email protected]
April 1999
$XWKRU�RI�1HW6SHFRoel Jonkman
$XWKRUV�RI�1HW6SHF�'DHPRQVBeng-Ong Lee, Yulia Wijata, Sandeep Bhat, Anil Gopinath,
Shyam Murthy
Information and Telecommunication Technology CenterUniversity of KansasLawrence, KS 66045
Web Site: http://www.ittc.ukans.edu/netspec
NetSpec User Manual Page 2
Abstract
Development and deployment of new networking technologies initiated the developmentof appropriate testing tools. Network measurement has so far been dominated by passivemonitoring. Also the existing testing and performance analysis tools have proven to bevery limited in their abilities. Due to a need for active testing tools, NetSpec wasdeveloped. To cater to a wide variety of testing and measurement requirements, a numberof daemons have been developed under the NetSpec framework. This user manual is anattempt to highlight the features and limitations of NetSpec. This document describes theusage of the different daemons and is an attempt to shed light on how to use NetSpec toconduct network measurement experiments.

NetSpec User Manual Page 3
Table of Contents
1.0 Introduction to NetSpec ............................................................................................................................ 51.1 Features of NetSpec .............................................................................................................................. 61.2 NetSpec Architecture ............................................................................................................................ 7
2.0 NetSpec Daemon Structure and Protocols ................................................................................................ 82.1 Execution Constructs ............................................................................................................................ 9
3.0 Running NetSpec .................................................................................................................................... 113.1 Purpose of Scripts ............................................................................................................................... 13
4.0 NetSpec Daemons................................................................................................................................... 144.1 Test Daemon (nstestd) ....................................................................................................................... 14
4.1.1 Description of user NetSpec Scripts and Examples ..................................................................... 144.1.2 Full Stream Traffic Scripts........................................................................................................... 154.1.3 Burst Traffic scripts ..................................................................................................................... 254.1.4 Queued Burst Traffic scripts ........................................................................................................ 314.1.5 Emulated Traffic types and scripts............................................................................................... 37
4.2 Data Stream Daemon (nsdstrd) ........................................................................................................... 444.2.1 Features........................................................................................................................................ 444.2.2 NetSpec Script ............................................................................................................................. 444.2.3 Examples...................................................................................................................................... 45
4.3 SNMP Daemon (nssnmpd) ................................................................................................................ 484.3.1 NetSpec Script ............................................................................................................................. 484.3.2 Example ....................................................................................................................................... 49
4.4 CORBA Daemon (nscorbad) .............................................................................................................. 504.4.1 Example ....................................................................................................................................... 51
4.5 Private Network – Network Interface Daemon (pnnid) ..................................................................... 544.5.1 Features of PNNI ......................................................................................................................... 544.5.2 NetSpec Script ............................................................................................................................. 55
4.6 Switch Daemon (nsswitchd) ............................................................................................................... 584.6.1 NetSpec Script ............................................................................................................................. 584.6.2 Description of Parameters............................................................................................................ 58
4.7 Host Daemon (nsabrd) ........................................................................................................................ 614.7.1 NetSpec Script ............................................................................................................................. 61
5.0 Appendix................................................................................................................................................. 645.1 Installation of NetSpec........................................................................................................................ 64
5.1.1 inetd Installation........................................................................................................................... 645.1.2 Standalone Installation (i.e. you don't have root access).............................................................. 64
5.2 Working of NetSpec ........................................................................................................................... 655.3 Tables.................................................................................................................................................. 66
5.3.1 Table 10 Explanation of NetSpec Script keywords...................................................................... 665.3.2 Table 11 Keywords used in Emulated Traffic Scripts ................................................................. 68
6.0 Bibliography ........................................................................................................................................... 69
NetSpec User Manual Page 4
List of Figures
Figure 1 NetSpec 3.0 Architecture.................................................................................................................. 7Figure 2 The Three types of Execution Constructs....................................................................................... 10Figure 3 Test setup with the invoked daemons over TCP............................................................................. 16Figure 4 Test Setup over UDP ...................................................................................................................... 20Figure 5 Architecture of a PNNI Emulation ................................................................................................. 55
List of Tables
Table 1 Different Phases of execution of the Test performed......................................................................... 9Table 2 Description of the parameters .......................................................................................................... 49Table 3 List of parameters in the Script and their Description ..................................................................... 50Table 4 List of Test Types ............................................................................................................................ 51Table 5 Allowable Parameters of parameter type “ switch “ ........................................................................ 58Table 6 Allowable Parameters of parameter type “ connection “ ................................................................. 59Table 7 Allowable Parameters for “atmFull” and “atmSink” .......................................................................62Table 8 Parameter Set for PVC..................................................................................................................... 62Table 9 Parameter Set for SVC..................................................................................................................... 635.3.1 Table 10 Explanation of NetSpec Script keywords.............................................................................. 665.3.2 Table 11 Keywords used in Emulated Traffic Scripts ......................................................................... 68
NetSpec User Manual Page 5
1.0 Introduction to NetSpec
The tremendous growth in the field of networking technologies initiated the developmentof appropriate testing tools. Development and deployment of advanced techniques in thisfield have necessitated the need for the right kind of testing tools. Network managementhas so far been dominated by passive monitoring. Emerging networking technologieshowever force the development of active testing and performance analysis tools. As aresult of the limitations of the existing testing and performance analysis tools, NetSpecwas developed.
NetSpec is a network level end-to-end performance evaluation tool developed byresearchers in the University of Kansas, for the ACTS ATM Internetwork (AAI) project.The NetSpec system provides support for large-scale data communication networkperformance tests with a variety of traffic source types and modes. This software toolprovides a simple block structured language for specifying experimental parameters andsupport for controlling performance experiments containing an arbitrary number ofconnections across a LAN or WANS.
NetSpec exhibits many features like parallel and serial multiple connections, a range ofemulated traffic types (FTP, HTTP, MPEG, etc.) on the higher levels, the most widelyused transport protocols today, that is TCP and UDP, three different traffic modes,scalability, and the ability to collect system level information from the communicatingsystems as well as intermediate network nodes. The most frequently used performancetools (ttcp, Netperf) do not support most of these features.
NetSpec can run on a variety of platforms. It has been successfully ported to the mostcommonly used platforms like DEC Alpha DUnix 3.0 3.2 and 4.0, SunOs, Solaris,Linux2.0.x and IRIX 5.3 and 6.1. Also NetSpec supports a wide variety oftest/measurement daemons in its framework. This enables the user to select the daemonbased on his requirements. Thus NetSpec provides the user with a capability to run testson a variety of architectures and also helps the users to perform different kinds of tests togather different types of network measurement information.

NetSpec User Manual Page 6
1.1 Features of NetSpec
• Scalability
The framework that is provided is scalable to carry out multiple tests. Thisis very desirable since networks generally carry hundreds of flows simultaneously.
• Flexibility
The framework is flexible incorporating both passive(probes, measurements) and active nodes (traffic generators).
• Reproducible
The results of the network are reproducible, assuming that the state of the network did not change.
• Integration
Measurements and tests are integrated in a seamless manner.
• Extensibility
The design has been done with a provision to add new components. New daemons can be incorporated in the existing framework with ease.
NetSpec User Manual Page 7
1.2 NetSpec Architecture
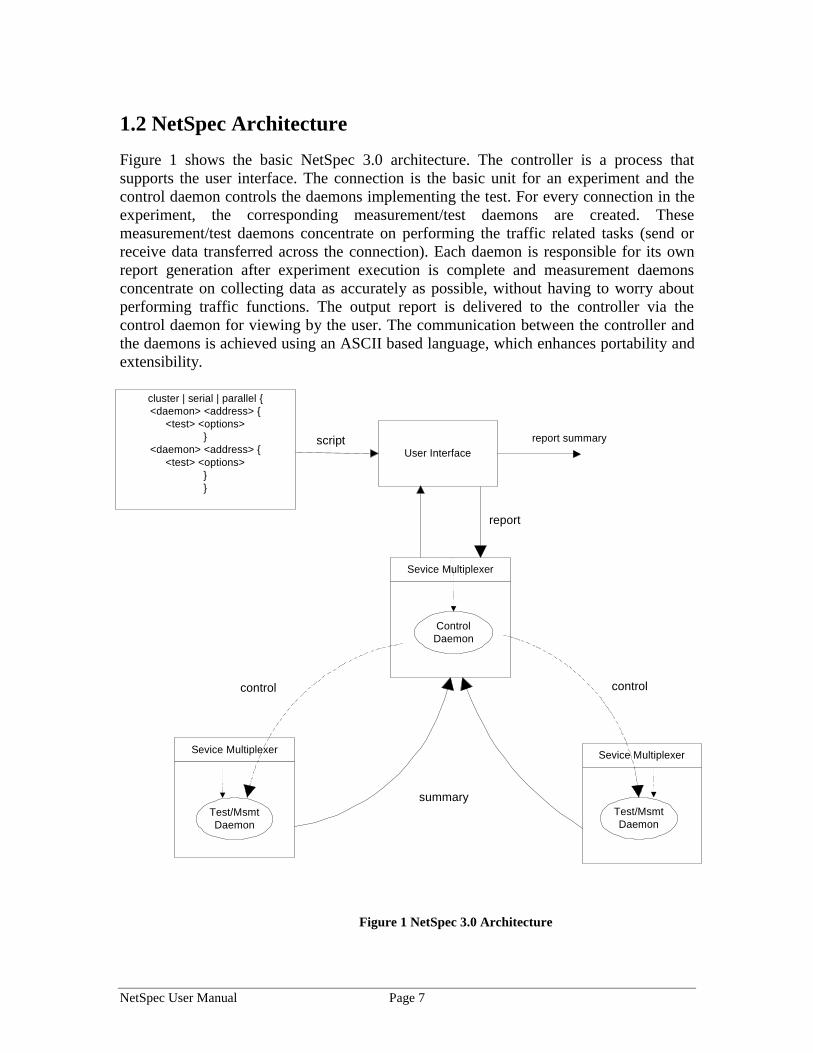
Figure 1 shows the basic NetSpec 3.0 architecture. The controller is a process thatsupports the user interface. The connection is the basic unit for an experiment and thecontrol daemon controls the daemons implementing the test. For every connection in theexperiment, the corresponding measurement/test daemons are created. Thesemeasurement/test daemons concentrate on performing the traffic related tasks (send orreceive data transferred across the connection). Each daemon is responsible for its ownreport generation after experiment execution is complete and measurement daemonsconcentrate on collecting data as accurately as possible, without having to worry aboutperforming traffic functions. The output report is delivered to the controller via thecontrol daemon for viewing by the user. The communication between the controller andthe daemons is achieved using an ASCII based language, which enhances portability andextensibility.
Figure 1 NetSpec 3.0 Architecture
Sevice Multiplexer
textControlDaemon
Sevice Multiplexer
textTest/MsmtDaemon
Sevice Multiplexer
textTest/MsmtDaemon
User Interface
cluster | serial | parallel {<daemon> <address> {
<test> <options>}
<daemon> <address> {<test> <options>
}}
script report summary
report
control control
summary
NetSpec User Manual Page 8
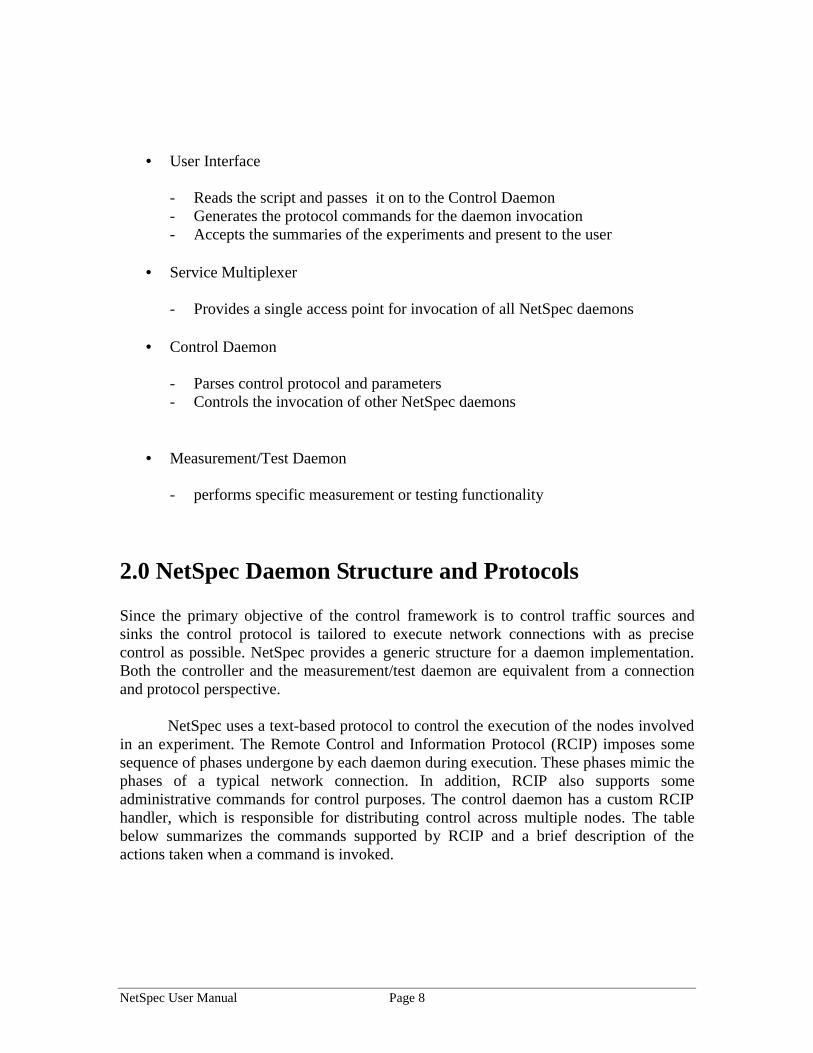
• User Interface
- Reads the script and passes it on to the Control Daemon- Generates the protocol commands for the daemon invocation- Accepts the summaries of the experiments and present to the user
• Service Multiplexer
- Provides a single access point for invocation of all NetSpec daemons
• Control Daemon
- Parses control protocol and parameters- Controls the invocation of other NetSpec daemons
• Measurement/Test Daemon
- performs specific measurement or testing functionality
2.0 NetSpec Daemon Structure and Protocols
Since the primary objective of the control framework is to control traffic sources andsinks the control protocol is tailored to execute network connections with as precisecontrol as possible. NetSpec provides a generic structure for a daemon implementation.Both the controller and the measurement/test daemon are equivalent from a connectionand protocol perspective.
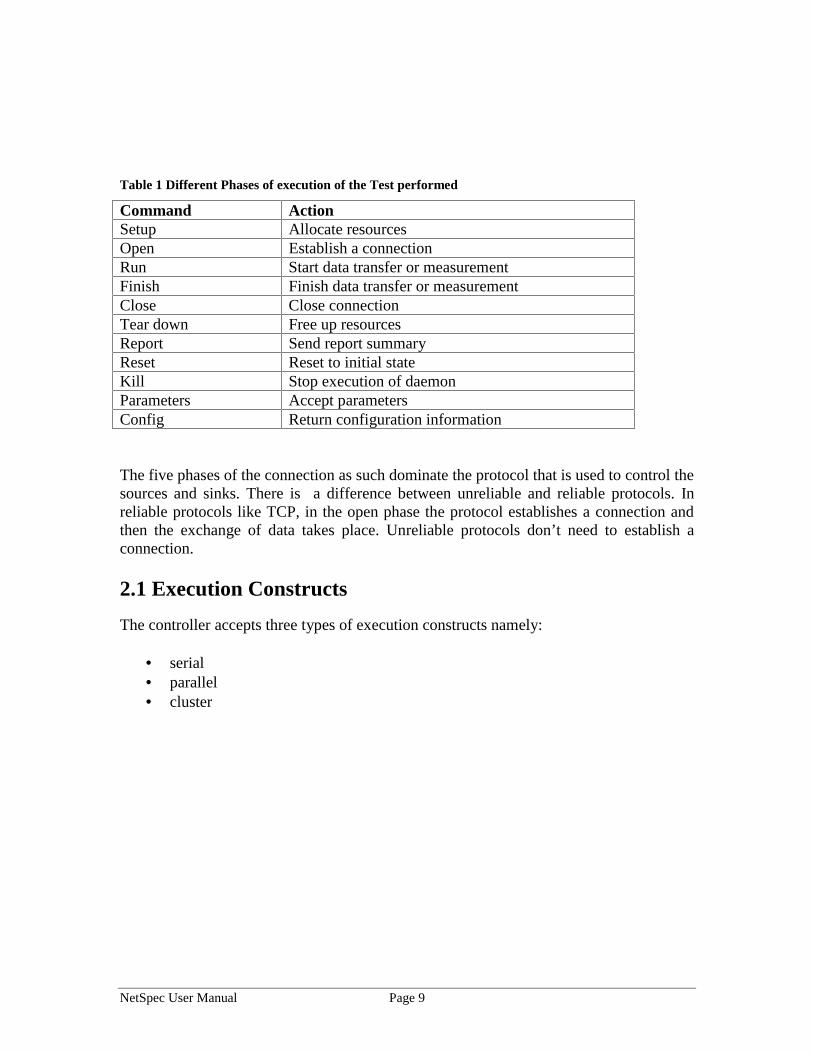
NetSpec uses a text-based protocol to control the execution of the nodes involvedin an experiment. The Remote Control and Information Protocol (RCIP) imposes somesequence of phases undergone by each daemon during execution. These phases mimic thephases of a typical network connection. In addition, RCIP also supports someadministrative commands for control purposes. The control daemon has a custom RCIPhandler, which is responsible for distributing control across multiple nodes. The tablebelow summarizes the commands supported by RCIP and a brief description of theactions taken when a command is invoked.
NetSpec User Manual Page 9
Table 1 Different Phases of execution of the Test performed
Command ActionSetup Allocate resourcesOpen Establish a connectionRun Start data transfer or measurementFinish Finish data transfer or measurementClose Close connectionTear down Free up resourcesReport Send report summaryReset Reset to initial stateKill Stop execution of daemonParameters Accept parametersConfig Return configuration information
The five phases of the connection as such dominate the protocol that is used to control thesources and sinks. There is a difference between unreliable and reliable protocols. Inreliable protocols like TCP, in the open phase the protocol establishes a connection andthen the exchange of data takes place. Unreliable protocols don’t need to establish aconnection.
2.1 Execution Constructs
The controller accepts three types of execution constructs namely:
• serial• parallel• cluster

NetSpec User Manual Page 10
Figure 2 The Three types of Execution Constructs
When two daemons, Daemon A and Daemon B are inside a serial or parallel or clusterconstruct we observe the following behavior
serial - The open, run and close phases with respect to one daemon (say Daemon A) are finished before Daemon B is executed. So, Daemons A and B are executed serially.
Open
Ack
Run
Ack
Close
Ack
OpenOpen
Open
Ack
Ack
Ack
Ack
Ack
Ack
Ack
Ack
Ack
Ack
Ack
Ack
Ack
Ack
Run
Run
Run
Run
Open
Open
Close
Run
Close
Close
AckClose
Close
Serial ConstructParallel
ConstructCluster
Construct
Execution Constructs
NetSpec User Manual Page 11
parallel - When the run phase of Daemon A is in progress the open phase of Daemon B is initiated. The run phase of both the daemons is executed in parallel.
cluster - The open phase of Daemon A is executed and the run is executed only after the open phase of Daemon B is done. In this construct all the phases of both the daemons are done in parallel. This construct encloses a source and a sink.
3.0 Running NetSpec
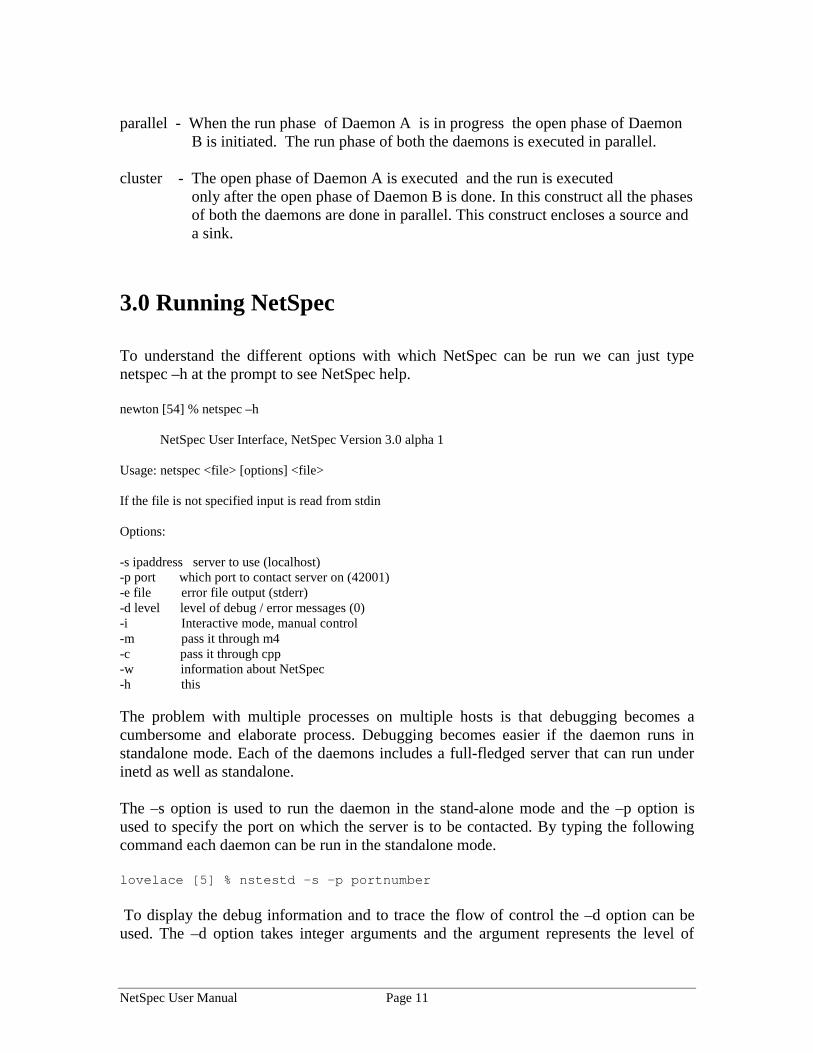
To understand the different options with which NetSpec can be run we can just typenetspec –h at the prompt to see NetSpec help.
newton [54] % netspec –h
NetSpec User Interface, NetSpec Version 3.0 alpha 1
Usage: netspec <file> [options] <file>
If the file is not specified input is read from stdin
Options:
-s ipaddress server to use (localhost)-p port which port to contact server on (42001)-e file error file output (stderr)-d level level of debug / error messages (0)-i Interactive mode, manual control-m pass it through m4-c pass it through cpp-w information about NetSpec-h this
The problem with multiple processes on multiple hosts is that debugging becomes acumbersome and elaborate process. Debugging becomes easier if the daemon runs instandalone mode. Each of the daemons includes a full-fledged server that can run underinetd as well as standalone.
The –s option is used to run the daemon in the stand-alone mode and the –p option isused to specify the port on which the server is to be contacted. By typing the followingcommand each daemon can be run in the standalone mode.
lovelace [5] % nstestd –s –p portnumber
To display the debug information and to trace the flow of control the –d option can beused. The –d option takes integer arguments and the argument represents the level of
NetSpec User Manual Page 12
verboseness. The –f option is used to facilitate running the daemon with the debugger. Itinstructs the daemon not to fork since this usually complicates matters within thedebugger.
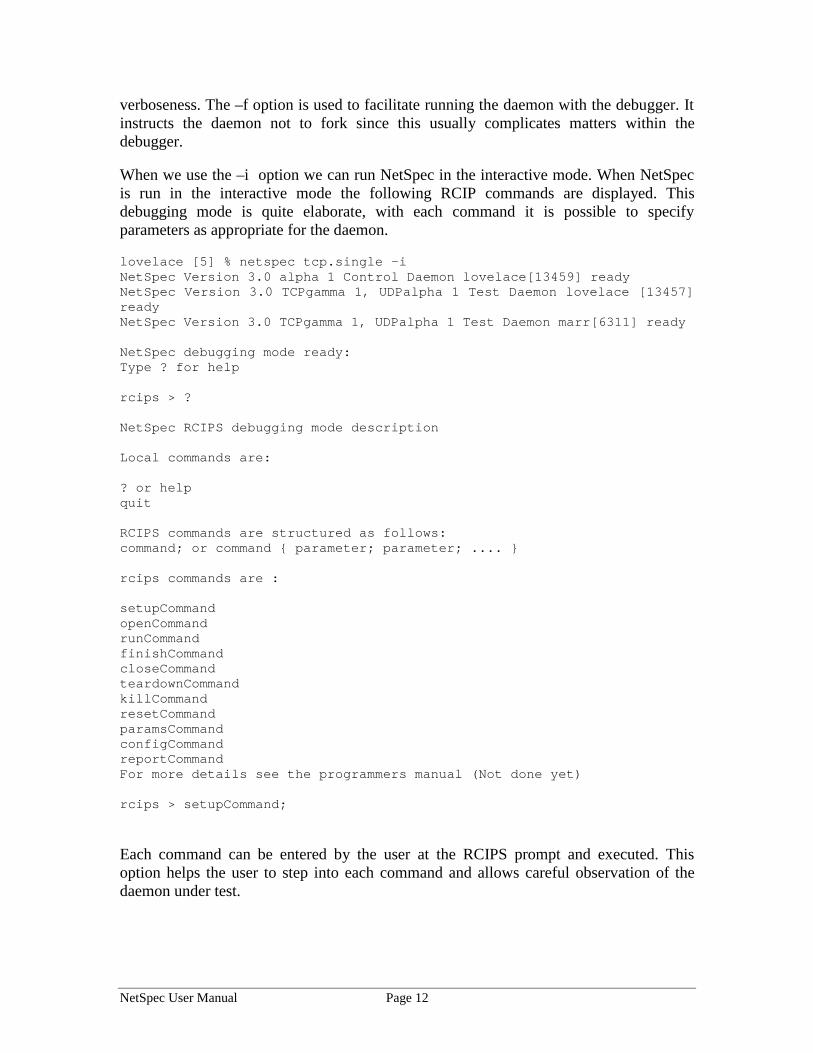
When we use the –i option we can run NetSpec in the interactive mode. When NetSpecis run in the interactive mode the following RCIP commands are displayed. Thisdebugging mode is quite elaborate, with each command it is possible to specifyparameters as appropriate for the daemon.
lovelace [5] % netspec tcp.single -iNetSpec Version 3.0 alpha 1 Control Daemon lovelace[13459] readyNetSpec Version 3.0 TCPgamma 1, UDPalpha 1 Test Daemon lovelace [13457]readyNetSpec Version 3.0 TCPgamma 1, UDPalpha 1 Test Daemon marr[6311] ready
NetSpec debugging mode ready:Type ? for help
rcips > ?
NetSpec RCIPS debugging mode description
Local commands are:
? or helpquit
RCIPS commands are structured as follows:command; or command { parameter; parameter; .... }
rcips commands are :
setupCommandopenCommandrunCommandfinishCommandcloseCommandteardownCommandkillCommandresetCommandparamsCommandconfigCommandreportCommandFor more details see the programmers manual (Not done yet)
rcips > setupCommand;
Each command can be entered by the user at the RCIPS prompt and executed. Thisoption helps the user to step into each command and allows careful observation of thedaemon under test.
NetSpec User Manual Page 13
3.1 Purpose of Scripts
All NetSpec experiments are based on the experiment script provided by the user. Thescript serves the following purposes:
• Identify the nodes involved in the experiment. A node is a generic term for aNetSpec daemon, which can be a control, test or measurement daemon.
• Identify the role assumed by each node
• Define the test parameters for each measurement/test daemon.
• Describe the relationship between nodes and thus describing the topology of theexperiment.
NetSpec User Manual Page 14
4.0 NetSpec Daemons
Under the NetSpec framework, a host of daemons have been developed. These daemonshelp the user in running the tests on different environments. There is a Control Daemon,which essentially starts up the required test/measurement daemon according to thespecification provided by the user in the script. The test/measurement daemon performsthe test measures the required parameters and displays the measured information in theform of a report. A brief description of the different daemons under the NetSpecframework is dealt with in the forth-coming sections.
4.1 Test Daemon (nstestd)
For every connection in the experiment the control daemon creates a test daemon. Thetest daemons provide the capability to generate and sink a wide variety of TCP and UDPtraffic. These test daemons concentrate on performing the traffic related tasks (send orreceive data transferred across the connection). The test daemon is responsible for its ownreport generation after experiment execution is complete.
4.1.1 Description of user NetSpec Scripts and Examples
The user interface to NetSpec is a simple block structured language or otherwise aNetSpec script with keywords and user parameters. The appropriate NetSpec parsers willprocess this script and the output will be delivered to the lower levels of the softwarearchitecture.
The best way to learn how to create these scripts is by example. What follows is a varietyof real scripts with the necessary explanation and suggestions on where they can be used.
• Full Stream Traffic Mode
• Burst Traffic Mode
• Queued Burst Traffic Mode
• Emulated Traffic types
NetSpec User Manual Page 15
4.1.2 Full Stream Traffic Scripts
In the full stream traffic mode, the hosts under test transmit data as fast as they can. Thisis the mode that ttcp supports. NetSpec on this mode can be used to estimate themaximum throughput that can be utilized in a specific communication channel, beingeither terrestrial or satellite. Table 10 given in Appendix explains all the key words usedin the following scripts.
4.1.2.1 Full Stream Traffic: Script #1 - Point-to-Point TCP Traffic
Generally, the script given below is of the most widely type used for a TCP point-to-pointconnection. The first block specifies the characteristics of the traffic source, while thesecond block specifies the characteristics of the receiver host. The sender and receiverTCP systems used are machines in the local ATM network in the University of Kansas(KU). This script can be used in testing the performance in a WAN, as well as testing theperformance over a satellite link, after the appropriate window size is specified for TCPusing the bandwidth-delay product for achieving optimized performance.
1 cluster {
2 test lovelace {3 type = full (blocksize=32768, duration=30);4 protocol = tcp (window=32768);5 own = lovelace.atm:42020;6 peer =marr.atm:42020;7 }
8 test marr {
9 type = sink (blocksize=32768, duration=30);10 protocol = tcp (window=32768);11 own = marr.atm:42020;12 peer = lovelace.atm:42020;13 }
14 }
NetSpec User Manual Page 16
Source Sink Full over TCP
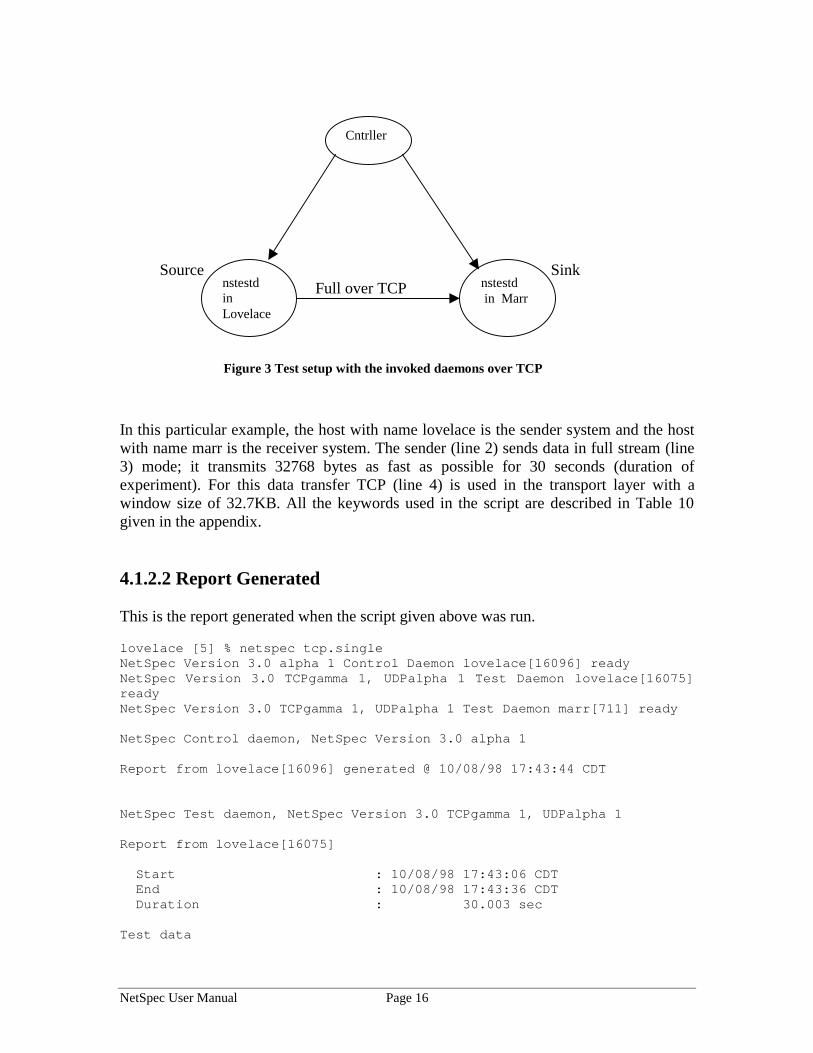
Figure 3 Test setup with the invoked daemons over TCP
In this particular example, the host with name lovelace is the sender system and the hostwith name marr is the receiver system. The sender (line 2) sends data in full stream (line3) mode; it transmits 32768 bytes as fast as possible for 30 seconds (duration ofexperiment). For this data transfer TCP (line 4) is used in the transport layer with awindow size of 32.7KB. All the keywords used in the script are described in Table 10given in the appendix.
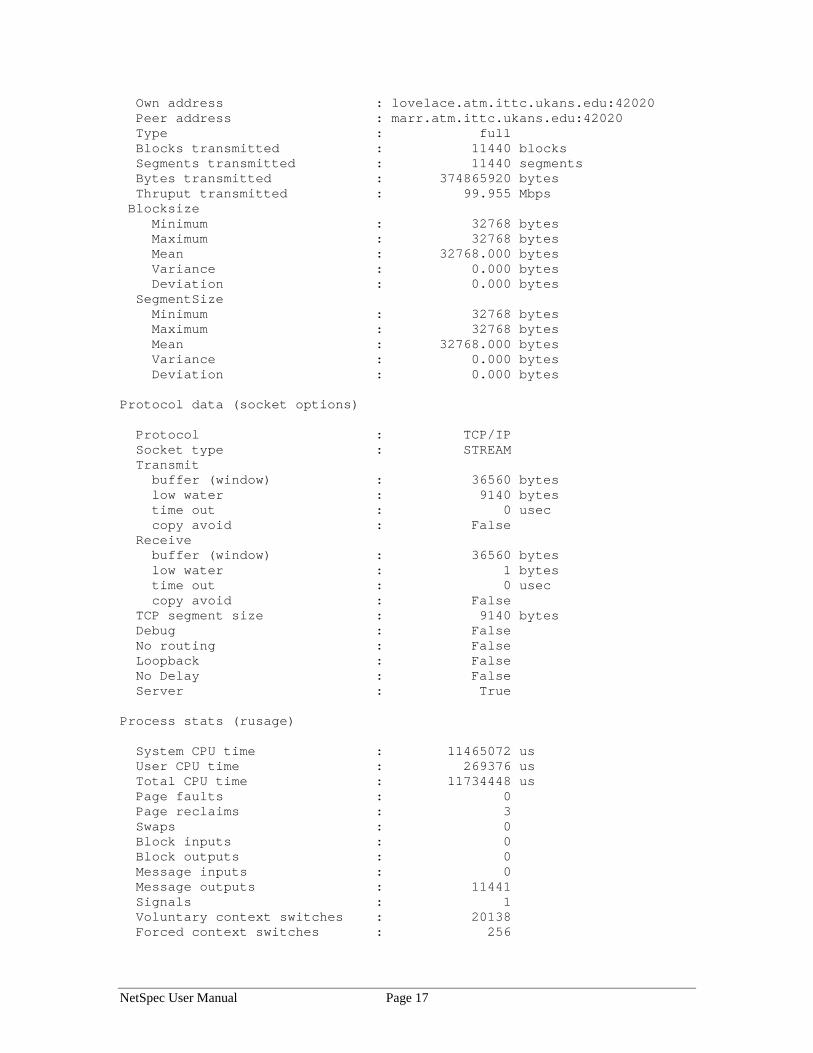
4.1.2.2 Report Generated
This is the report generated when the script given above was run.
lovelace [5] % netspec tcp.singleNetSpec Version 3.0 alpha 1 Control Daemon lovelace[16096] readyNetSpec Version 3.0 TCPgamma 1, UDPalpha 1 Test Daemon lovelace[16075]readyNetSpec Version 3.0 TCPgamma 1, UDPalpha 1 Test Daemon marr[711] ready
NetSpec Control daemon, NetSpec Version 3.0 alpha 1
Report from lovelace[16096] generated @ 10/08/98 17:43:44 CDT
NetSpec Test daemon, NetSpec Version 3.0 TCPgamma 1, UDPalpha 1
Report from lovelace[16075]
Start : 10/08/98 17:43:06 CDT End : 10/08/98 17:43:36 CDT Duration : 30.003 sec
Test data
Cntrller
nstestd in Marr
nstestdinLovelace
NetSpec User Manual Page 17
Own address : lovelace.atm.ittc.ukans.edu:42020 Peer address : marr.atm.ittc.ukans.edu:42020 Type : full Blocks transmitted : 11440 blocks Segments transmitted : 11440 segments Bytes transmitted : 374865920 bytes Thruput transmitted : 99.955 Mbps Blocksize Minimum : 32768 bytes Maximum : 32768 bytes Mean : 32768.000 bytes Variance : 0.000 bytes Deviation : 0.000 bytes SegmentSize Minimum : 32768 bytes Maximum : 32768 bytes Mean : 32768.000 bytes Variance : 0.000 bytes Deviation : 0.000 bytes
Protocol data (socket options)
Protocol : TCP/IP Socket type : STREAM Transmit buffer (window) : 36560 bytes low water : 9140 bytes time out : 0 usec copy avoid : False Receive buffer (window) : 36560 bytes low water : 1 bytes time out : 0 usec copy avoid : False TCP segment size : 9140 bytes Debug : False No routing : False Loopback : False No Delay : False Server : True
Process stats (rusage)
System CPU time : 11465072 us User CPU time : 269376 us Total CPU time : 11734448 us Page faults : 0 Page reclaims : 3 Swaps : 0 Block inputs : 0 Block outputs : 0 Message inputs : 0 Message outputs : 11441 Signals : 1 Voluntary context switches : 20138 Forced context switches : 256
NetSpec User Manual Page 18
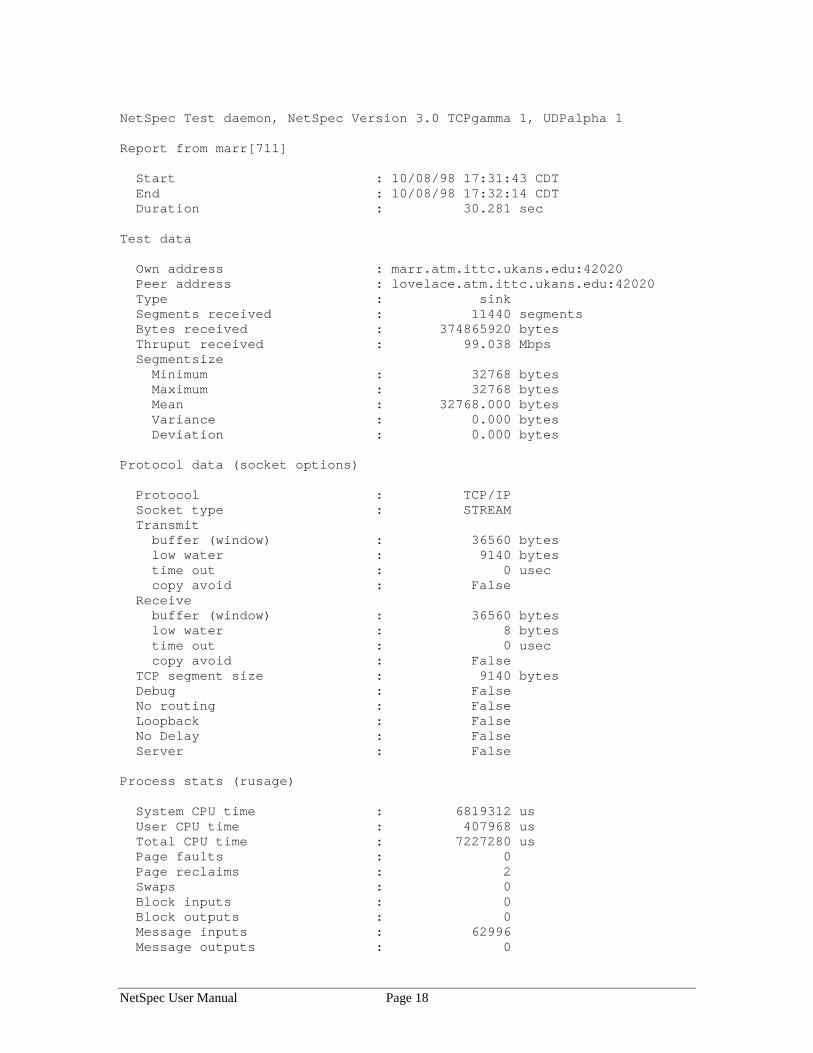
NetSpec Test daemon, NetSpec Version 3.0 TCPgamma 1, UDPalpha 1
Report from marr[711]
Start : 10/08/98 17:31:43 CDT End : 10/08/98 17:32:14 CDT Duration : 30.281 sec
Test data
Own address : marr.atm.ittc.ukans.edu:42020 Peer address : lovelace.atm.ittc.ukans.edu:42020 Type : sink Segments received : 11440 segments Bytes received : 374865920 bytes Thruput received : 99.038 Mbps Segmentsize Minimum : 32768 bytes Maximum : 32768 bytes Mean : 32768.000 bytes Variance : 0.000 bytes Deviation : 0.000 bytes
Protocol data (socket options)
Protocol : TCP/IP Socket type : STREAM Transmit buffer (window) : 36560 bytes low water : 9140 bytes time out : 0 usec copy avoid : False Receive buffer (window) : 36560 bytes low water : 8 bytes time out : 0 usec copy avoid : False TCP segment size : 9140 bytes Debug : False No routing : False Loopback : False No Delay : False Server : False
Process stats (rusage)
System CPU time : 6819312 us User CPU time : 407968 us Total CPU time : 7227280 us Page faults : 0 Page reclaims : 2 Swaps : 0 Block inputs : 0 Block outputs : 0 Message inputs : 62996 Message outputs : 0
NetSpec User Manual Page 19
Signals : 1 Voluntary context switches : 39658 Forced context switches : 1530
The report gives the statistics of the test in term of the blocks and bytes transmitted andreceived. Also the throughput which is a measure of the amount of data acommunications channel can carry is measured from both the sender’s and the receiver’sside. It helps the user to find out the state of the network between two endpoints. Helpsthe user evaluate the protocol used for transmission.
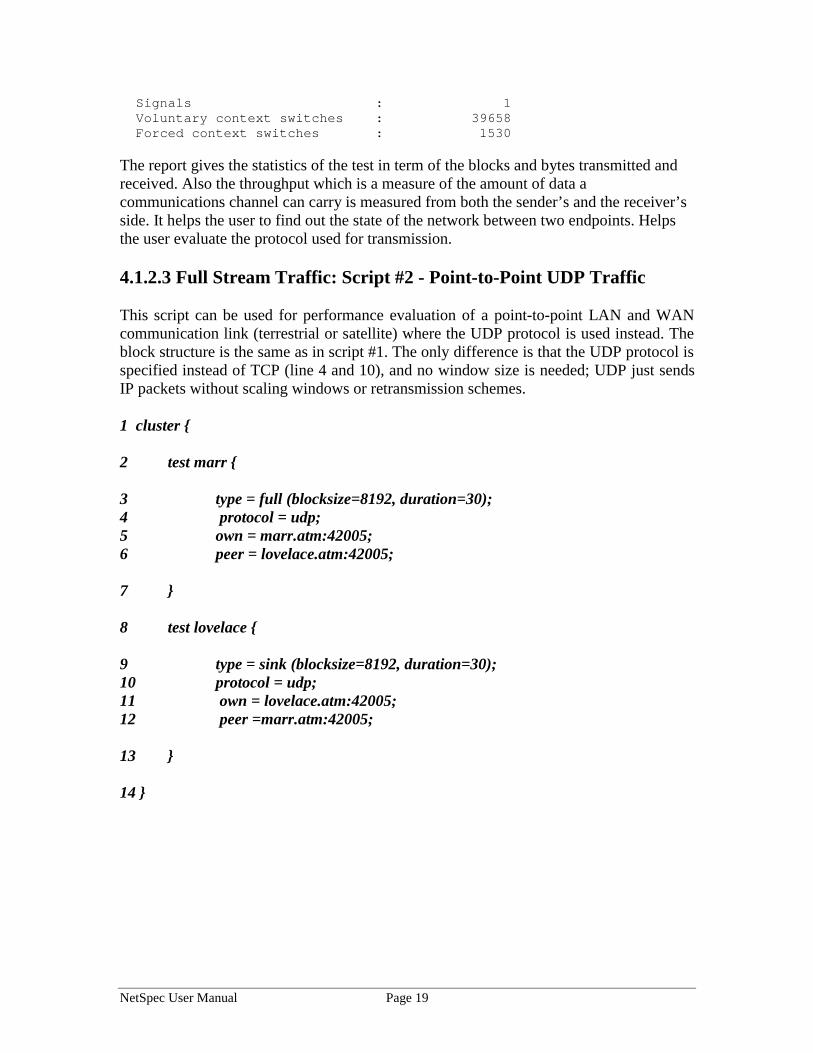
4.1.2.3 Full Stream Traffic: Script #2 - Point-to-Point UDP Traffic
This script can be used for performance evaluation of a point-to-point LAN and WANcommunication link (terrestrial or satellite) where the UDP protocol is used instead. Theblock structure is the same as in script #1. The only difference is that the UDP protocol isspecified instead of TCP (line 4 and 10), and no window size is needed; UDP just sendsIP packets without scaling windows or retransmission schemes.
1 cluster {
2 test marr {
3 type = full (blocksize=8192, duration=30);4 protocol = udp;5 own = marr.atm:42005;6 peer = lovelace.atm:42005;
7 }
8 test lovelace {
9 type = sink (blocksize=8192, duration=30);10 protocol = udp;11 own = lovelace.atm:42005;12 peer =marr.atm:42005;
13 }
14 }
NetSpec User Manual Page 20
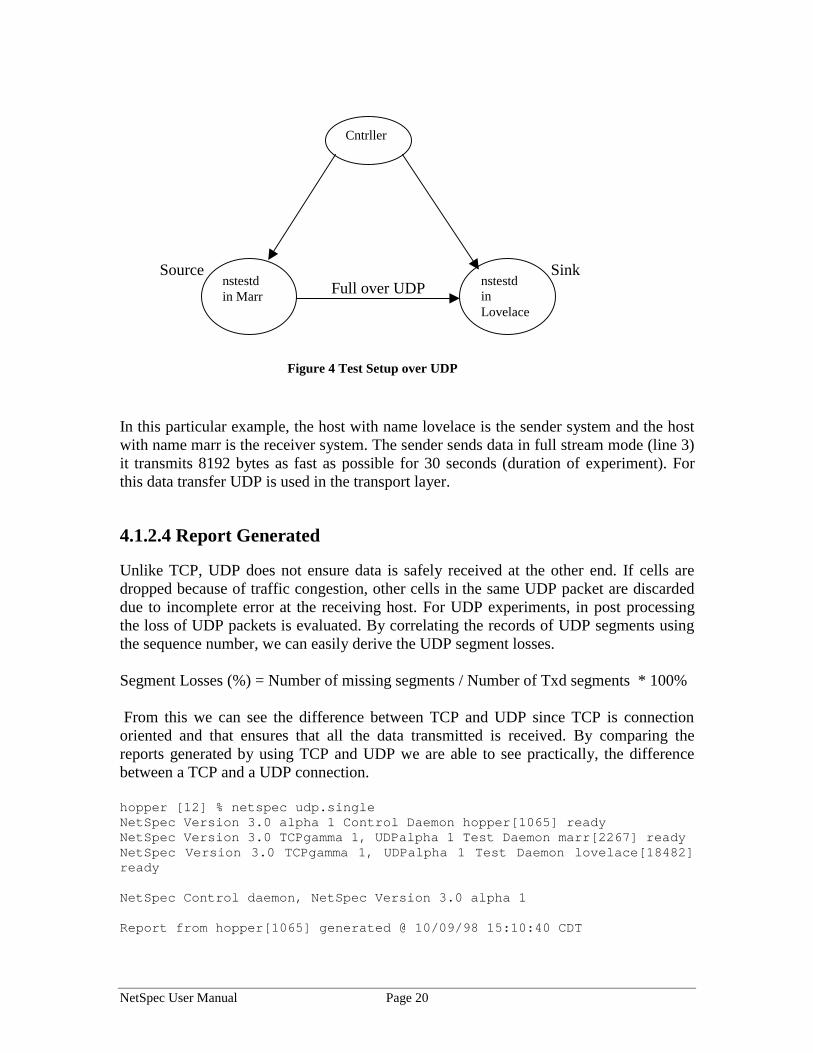
Source Sink Full over UDP
Figure 4 Test Setup over UDP
In this particular example, the host with name lovelace is the sender system and the hostwith name marr is the receiver system. The sender sends data in full stream mode (line 3)it transmits 8192 bytes as fast as possible for 30 seconds (duration of experiment). Forthis data transfer UDP is used in the transport layer.
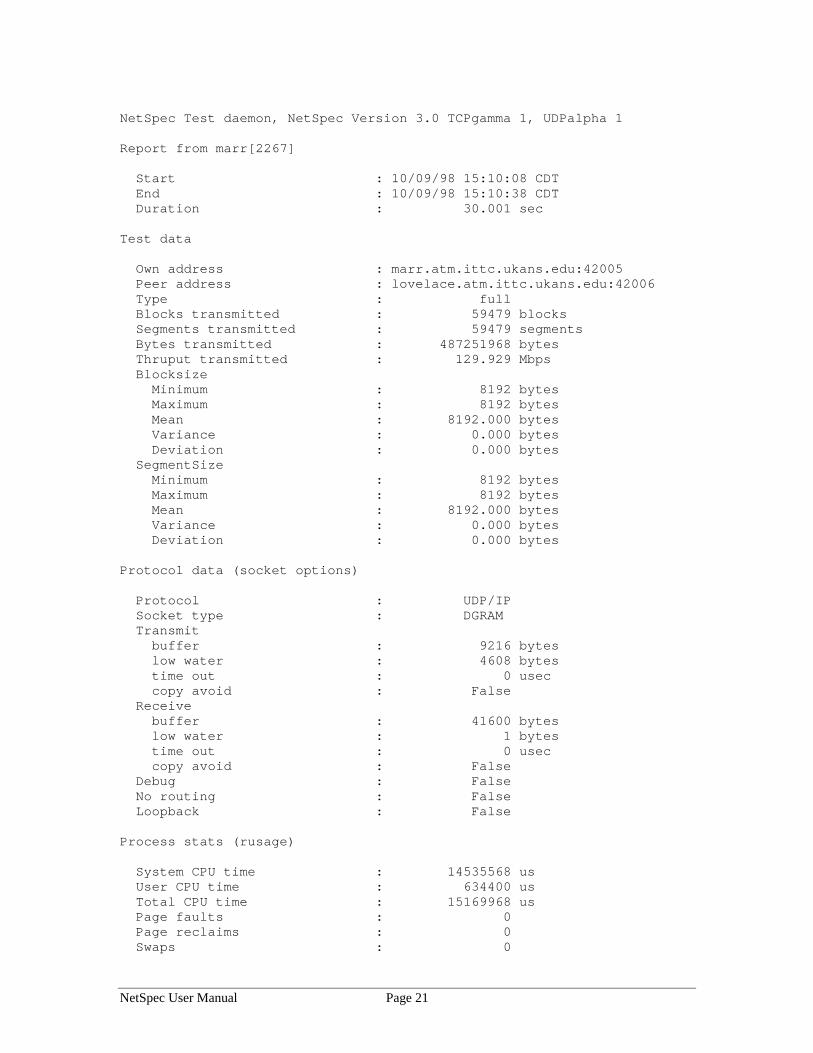
4.1.2.4 Report Generated
Unlike TCP, UDP does not ensure data is safely received at the other end. If cells aredropped because of traffic congestion, other cells in the same UDP packet are discardeddue to incomplete error at the receiving host. For UDP experiments, in post processingthe loss of UDP packets is evaluated. By correlating the records of UDP segments usingthe sequence number, we can easily derive the UDP segment losses.
Segment Losses (%) = Number of missing segments / Number of Txd segments * 100%
From this we can see the difference between TCP and UDP since TCP is connectionoriented and that ensures that all the data transmitted is received. By comparing thereports generated by using TCP and UDP we are able to see practically, the differencebetween a TCP and a UDP connection.
hopper [12] % netspec udp.singleNetSpec Version 3.0 alpha 1 Control Daemon hopper[1065] readyNetSpec Version 3.0 TCPgamma 1, UDPalpha 1 Test Daemon marr[2267] readyNetSpec Version 3.0 TCPgamma 1, UDPalpha 1 Test Daemon lovelace[18482]ready
NetSpec Control daemon, NetSpec Version 3.0 alpha 1
Report from hopper[1065] generated @ 10/09/98 15:10:40 CDT
Cntrller
nstestdin Marr
nstestdinLovelace
NetSpec User Manual Page 21
NetSpec Test daemon, NetSpec Version 3.0 TCPgamma 1, UDPalpha 1
Report from marr[2267]
Start : 10/09/98 15:10:08 CDT End : 10/09/98 15:10:38 CDT Duration : 30.001 sec
Test data
Own address : marr.atm.ittc.ukans.edu:42005 Peer address : lovelace.atm.ittc.ukans.edu:42006 Type : full Blocks transmitted : 59479 blocks Segments transmitted : 59479 segments Bytes transmitted : 487251968 bytes Thruput transmitted : 129.929 Mbps Blocksize Minimum : 8192 bytes Maximum : 8192 bytes Mean : 8192.000 bytes Variance : 0.000 bytes Deviation : 0.000 bytes SegmentSize Minimum : 8192 bytes Maximum : 8192 bytes Mean : 8192.000 bytes Variance : 0.000 bytes Deviation : 0.000 bytes
Protocol data (socket options)
Protocol : UDP/IP Socket type : DGRAM Transmit buffer : 9216 bytes low water : 4608 bytes time out : 0 usec copy avoid : False Receive buffer : 41600 bytes low water : 1 bytes time out : 0 usec copy avoid : False Debug : False No routing : False Loopback : False
Process stats (rusage)
System CPU time : 14535568 us User CPU time : 634400 us Total CPU time : 15169968 us Page faults : 0 Page reclaims : 0 Swaps : 0
NetSpec User Manual Page 22
Block inputs : 0 Block outputs : 0 Message inputs : 0 Message outputs : 60995 Signals : 1 Voluntary context switches : 0 Forced context switches : 3370
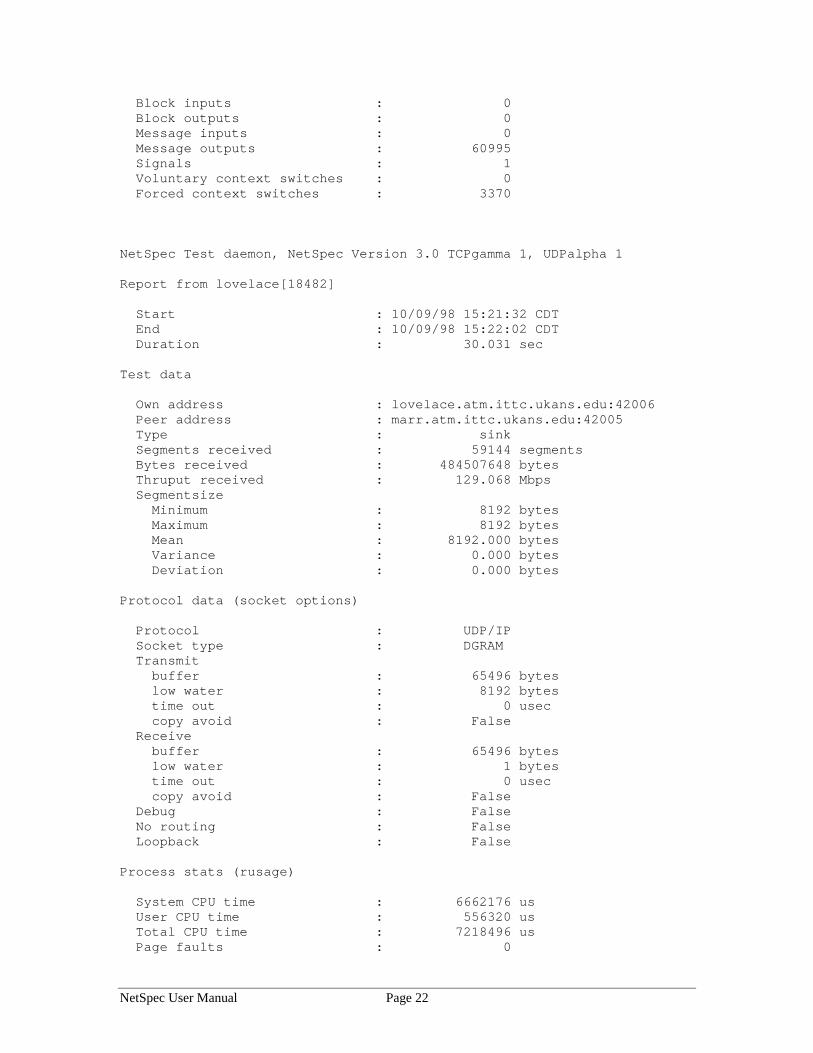
NetSpec Test daemon, NetSpec Version 3.0 TCPgamma 1, UDPalpha 1
Report from lovelace[18482]
Start : 10/09/98 15:21:32 CDT End : 10/09/98 15:22:02 CDT Duration : 30.031 sec
Test data
Own address : lovelace.atm.ittc.ukans.edu:42006 Peer address : marr.atm.ittc.ukans.edu:42005 Type : sink Segments received : 59144 segments Bytes received : 484507648 bytes Thruput received : 129.068 Mbps Segmentsize Minimum : 8192 bytes Maximum : 8192 bytes Mean : 8192.000 bytes Variance : 0.000 bytes Deviation : 0.000 bytes
Protocol data (socket options)
Protocol : UDP/IP Socket type : DGRAM Transmit buffer : 65496 bytes low water : 8192 bytes time out : 0 usec copy avoid : False Receive buffer : 65496 bytes low water : 1 bytes time out : 0 usec copy avoid : False Debug : False No routing : False Loopback : False
Process stats (rusage)
System CPU time : 6662176 us User CPU time : 556320 us Total CPU time : 7218496 us Page faults : 0
NetSpec User Manual Page 23
Page reclaims : 1 Swaps : 0 Block inputs : 0 Block outputs : 0 Message inputs : 59144 Message outputs : 0 Signals : 1 Voluntary context switches : 58186 Forced context switches : 761
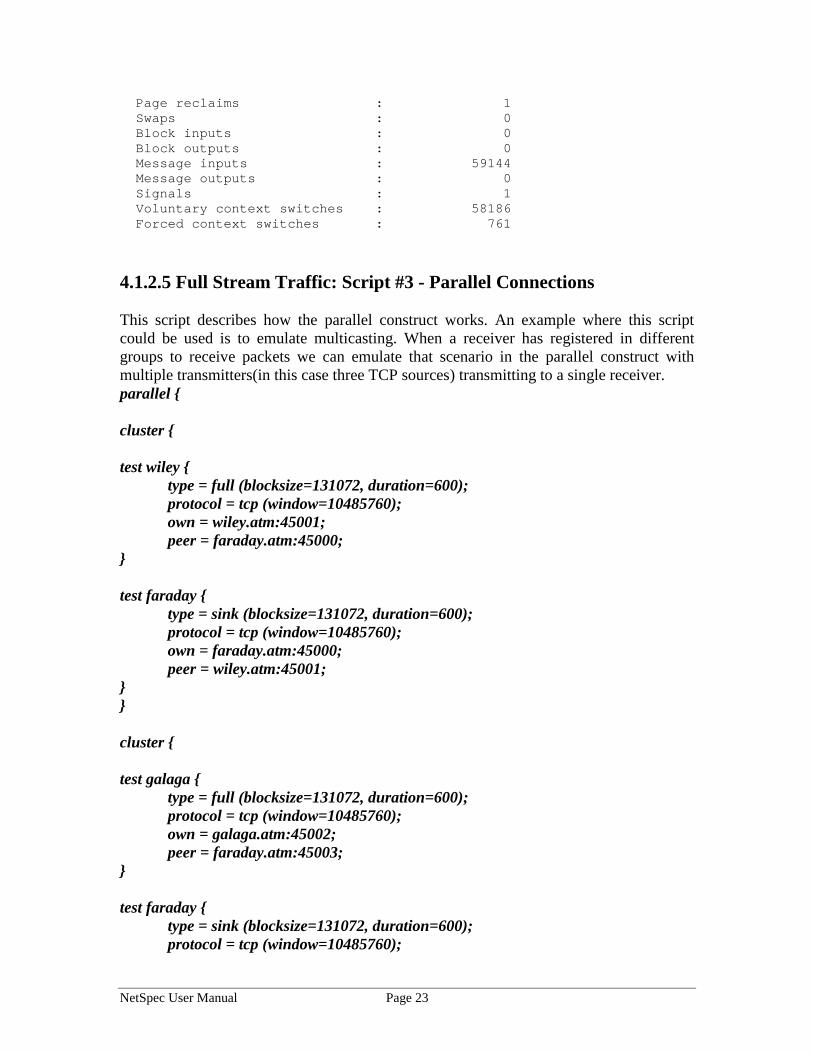
4.1.2.5 Full Stream Traffic: Script #3 - Parallel Connections
This script describes how the parallel construct works. An example where this scriptcould be used is to emulate multicasting. When a receiver has registered in differentgroups to receive packets we can emulate that scenario in the parallel construct withmultiple transmitters(in this case three TCP sources) transmitting to a single receiver.parallel {
cluster {
test wiley {type = full (blocksize=131072, duration=600);protocol = tcp (window=10485760);own = wiley.atm:45001;peer = faraday.atm:45000;
}
test faraday {type = sink (blocksize=131072, duration=600);protocol = tcp (window=10485760);own = faraday.atm:45000;peer = wiley.atm:45001;
}}
cluster {
test galaga {type = full (blocksize=131072, duration=600);protocol = tcp (window=10485760);own = galaga.atm:45002;peer = faraday.atm:45003;
}
test faraday {type = sink (blocksize=131072, duration=600);protocol = tcp (window=10485760);
NetSpec User Manual Page 24
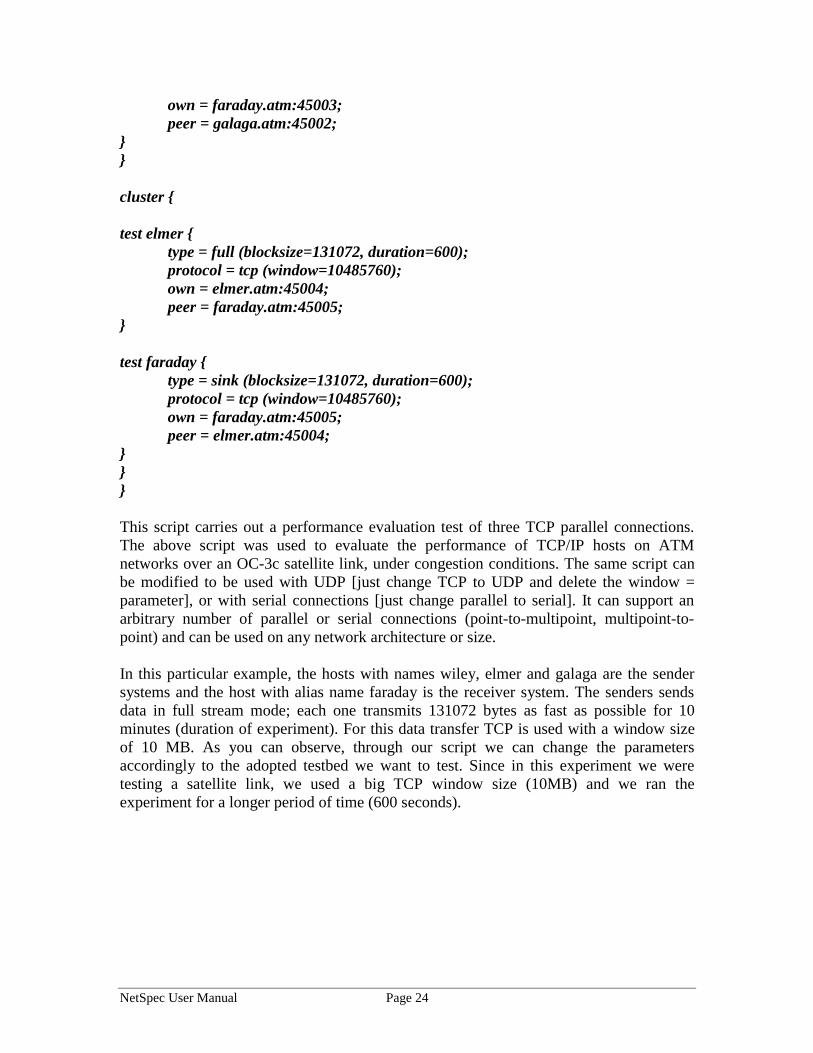
own = faraday.atm:45003;peer = galaga.atm:45002;
}}
cluster {
test elmer {type = full (blocksize=131072, duration=600);protocol = tcp (window=10485760);own = elmer.atm:45004;peer = faraday.atm:45005;
}
test faraday {type = sink (blocksize=131072, duration=600);protocol = tcp (window=10485760);own = faraday.atm:45005;peer = elmer.atm:45004;
}}}
This script carries out a performance evaluation test of three TCP parallel connections.The above script was used to evaluate the performance of TCP/IP hosts on ATMnetworks over an OC-3c satellite link, under congestion conditions. The same script canbe modified to be used with UDP [just change TCP to UDP and delete the window =parameter], or with serial connections [just change parallel to serial]. It can support anarbitrary number of parallel or serial connections (point-to-multipoint, multipoint-to-point) and can be used on any network architecture or size.
In this particular example, the hosts with names wiley, elmer and galaga are the sendersystems and the host with alias name faraday is the receiver system. The senders sendsdata in full stream mode; each one transmits 131072 bytes as fast as possible for 10minutes (duration of experiment). For this data transfer TCP is used with a window sizeof 10 MB. As you can observe, through our script we can change the parametersaccordingly to the adopted testbed we want to test. Since in this experiment we weretesting a satellite link, we used a big TCP window size (10MB) and we ran theexperiment for a longer period of time (600 seconds).
NetSpec User Manual Page 25
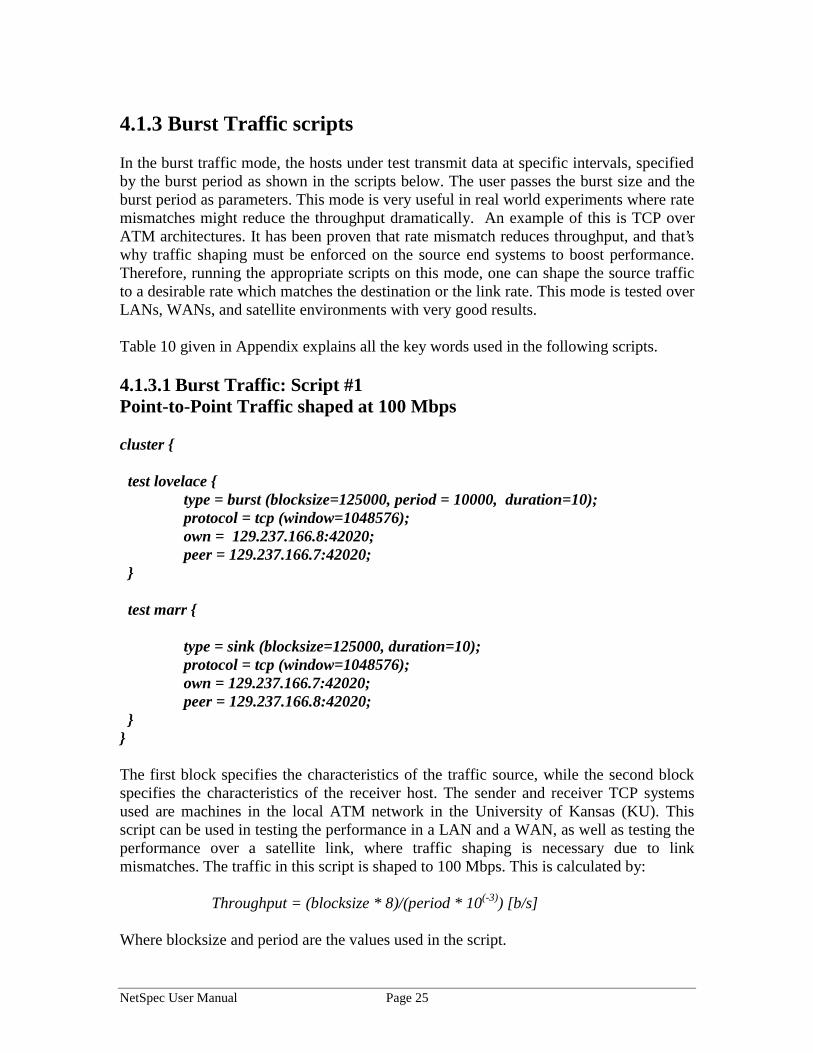
4.1.3 Burst Traffic scripts
In the burst traffic mode, the hosts under test transmit data at specific intervals, specifiedby the burst period as shown in the scripts below. The user passes the burst size and theburst period as parameters. This mode is very useful in real world experiments where ratemismatches might reduce the throughput dramatically. An example of this is TCP overATM architectures. It has been proven that rate mismatch reduces throughput, and that’swhy traffic shaping must be enforced on the source end systems to boost performance.Therefore, running the appropriate scripts on this mode, one can shape the source trafficto a desirable rate which matches the destination or the link rate. This mode is tested overLANs, WANs, and satellite environments with very good results.
Table 10 given in Appendix explains all the key words used in the following scripts.
4.1.3.1 Burst Traffic: Script #1Point-to-Point Traffic shaped at 100 Mbps
cluster {
test lovelace { type = burst (blocksize=125000, period = 10000, duration=10); protocol = tcp (window=1048576); own = 129.237.166.8:42020; peer = 129.237.166.7:42020;
}
test marr {
type = sink (blocksize=125000, duration=10); protocol = tcp (window=1048576); own = 129.237.166.7:42020; peer = 129.237.166.8:42020;
}}
The first block specifies the characteristics of the traffic source, while the second blockspecifies the characteristics of the receiver host. The sender and receiver TCP systemsused are machines in the local ATM network in the University of Kansas (KU). Thisscript can be used in testing the performance in a LAN and a WAN, as well as testing theperformance over a satellite link, where traffic shaping is necessary due to linkmismatches. The traffic in this script is shaped to 100 Mbps. This is calculated by:
Throughput = (blocksize * 8)/(period * 10(-3)) [b/s]
Where blocksize and period are the values used in the script.
NetSpec User Manual Page 26
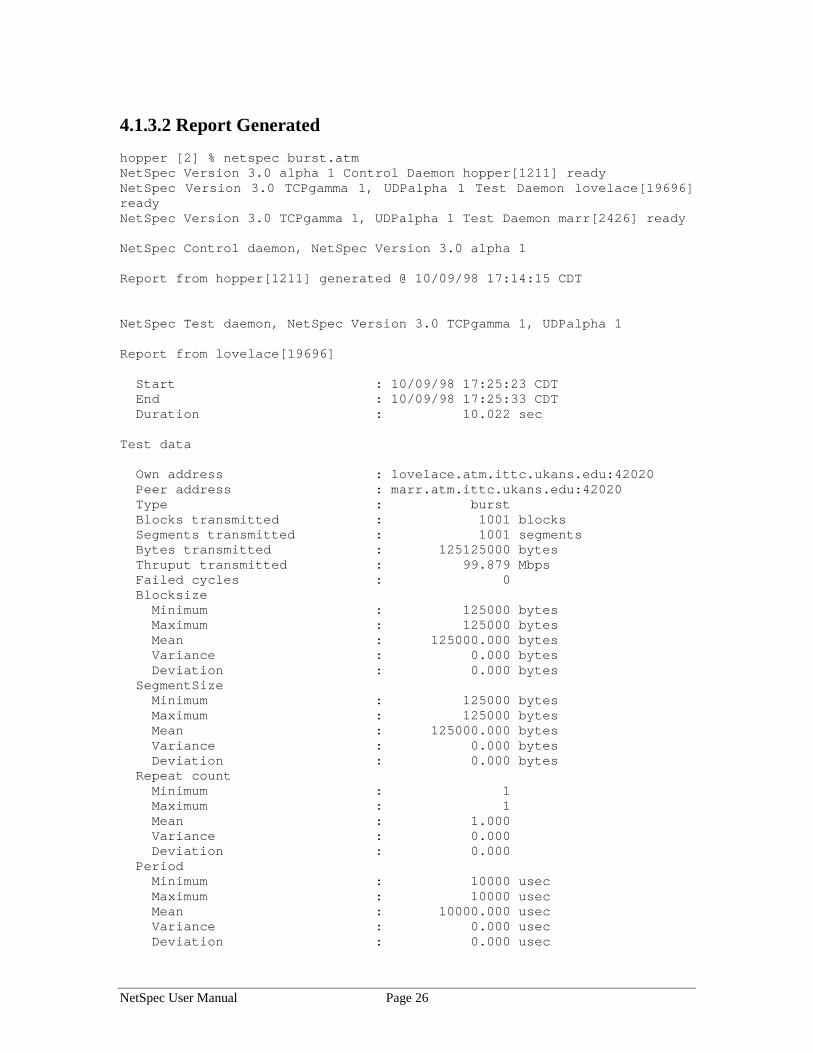
4.1.3.2 Report Generated
hopper [2] % netspec burst.atmNetSpec Version 3.0 alpha 1 Control Daemon hopper[1211] readyNetSpec Version 3.0 TCPgamma 1, UDPalpha 1 Test Daemon lovelace[19696]readyNetSpec Version 3.0 TCPgamma 1, UDPalpha 1 Test Daemon marr[2426] ready
NetSpec Control daemon, NetSpec Version 3.0 alpha 1
Report from hopper[1211] generated @ 10/09/98 17:14:15 CDT
NetSpec Test daemon, NetSpec Version 3.0 TCPgamma 1, UDPalpha 1
Report from lovelace[19696]
Start : 10/09/98 17:25:23 CDT End : 10/09/98 17:25:33 CDT Duration : 10.022 sec
Test data
Own address : lovelace.atm.ittc.ukans.edu:42020 Peer address : marr.atm.ittc.ukans.edu:42020 Type : burst Blocks transmitted : 1001 blocks Segments transmitted : 1001 segments Bytes transmitted : 125125000 bytes Thruput transmitted : 99.879 Mbps Failed cycles : 0 Blocksize Minimum : 125000 bytes Maximum : 125000 bytes Mean : 125000.000 bytes Variance : 0.000 bytes Deviation : 0.000 bytes SegmentSize Minimum : 125000 bytes Maximum : 125000 bytes Mean : 125000.000 bytes Variance : 0.000 bytes Deviation : 0.000 bytes Repeat count Minimum : 1 Maximum : 1 Mean : 1.000 Variance : 0.000 Deviation : 0.000 Period Minimum : 10000 usec Maximum : 10000 usec Mean : 10000.000 usec Variance : 0.000 usec Deviation : 0.000 usec
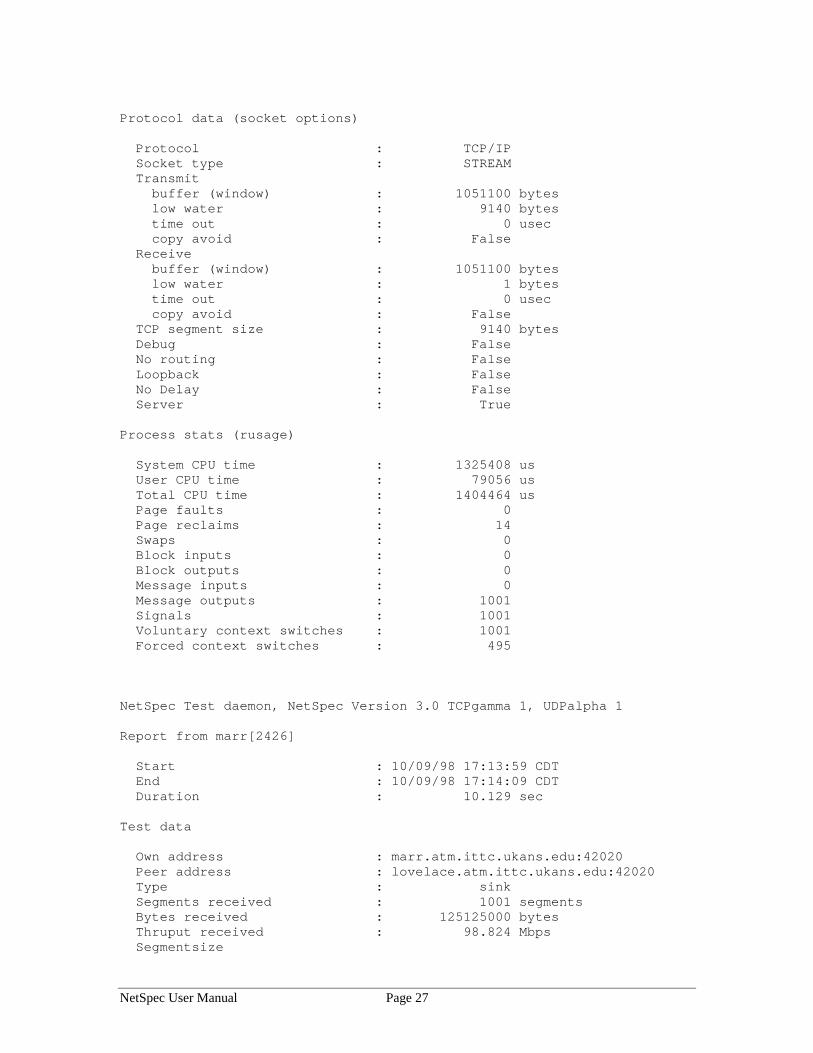
NetSpec User Manual Page 27
Protocol data (socket options)
Protocol : TCP/IP Socket type : STREAM Transmit buffer (window) : 1051100 bytes low water : 9140 bytes time out : 0 usec copy avoid : False Receive buffer (window) : 1051100 bytes low water : 1 bytes time out : 0 usec copy avoid : False TCP segment size : 9140 bytes Debug : False No routing : False Loopback : False No Delay : False Server : True
Process stats (rusage)
System CPU time : 1325408 us User CPU time : 79056 us Total CPU time : 1404464 us Page faults : 0 Page reclaims : 14 Swaps : 0 Block inputs : 0 Block outputs : 0 Message inputs : 0 Message outputs : 1001 Signals : 1001 Voluntary context switches : 1001 Forced context switches : 495
NetSpec Test daemon, NetSpec Version 3.0 TCPgamma 1, UDPalpha 1
Report from marr[2426]
Start : 10/09/98 17:13:59 CDT End : 10/09/98 17:14:09 CDT Duration : 10.129 sec
Test data
Own address : marr.atm.ittc.ukans.edu:42020 Peer address : lovelace.atm.ittc.ukans.edu:42020 Type : sink Segments received : 1001 segments Bytes received : 125125000 bytes Thruput received : 98.824 Mbps Segmentsize
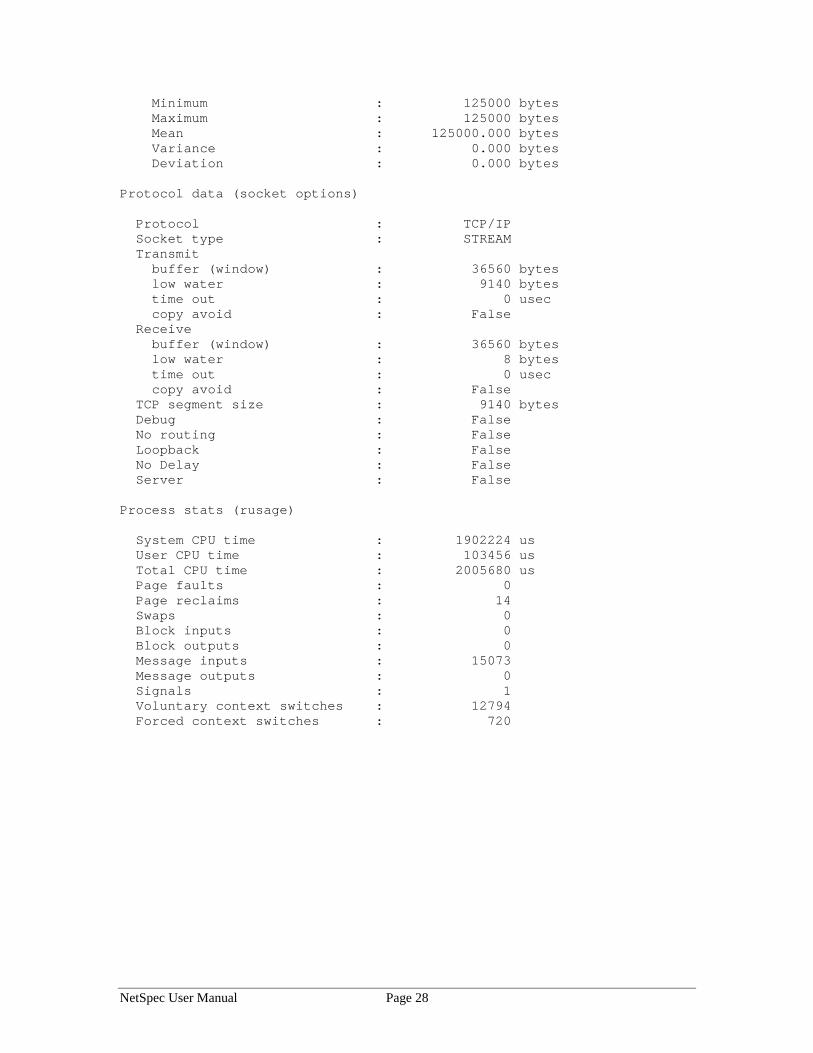
NetSpec User Manual Page 28
Minimum : 125000 bytes Maximum : 125000 bytes Mean : 125000.000 bytes Variance : 0.000 bytes Deviation : 0.000 bytes
Protocol data (socket options)
Protocol : TCP/IP Socket type : STREAM Transmit buffer (window) : 36560 bytes low water : 9140 bytes time out : 0 usec copy avoid : False Receive buffer (window) : 36560 bytes low water : 8 bytes time out : 0 usec copy avoid : False TCP segment size : 9140 bytes Debug : False No routing : False Loopback : False No Delay : False Server : False
Process stats (rusage)
System CPU time : 1902224 us User CPU time : 103456 us Total CPU time : 2005680 us Page faults : 0 Page reclaims : 14 Swaps : 0 Block inputs : 0 Block outputs : 0 Message inputs : 15073 Message outputs : 0 Signals : 1 Voluntary context switches : 12794 Forced context switches : 720
NetSpec User Manual Page 29
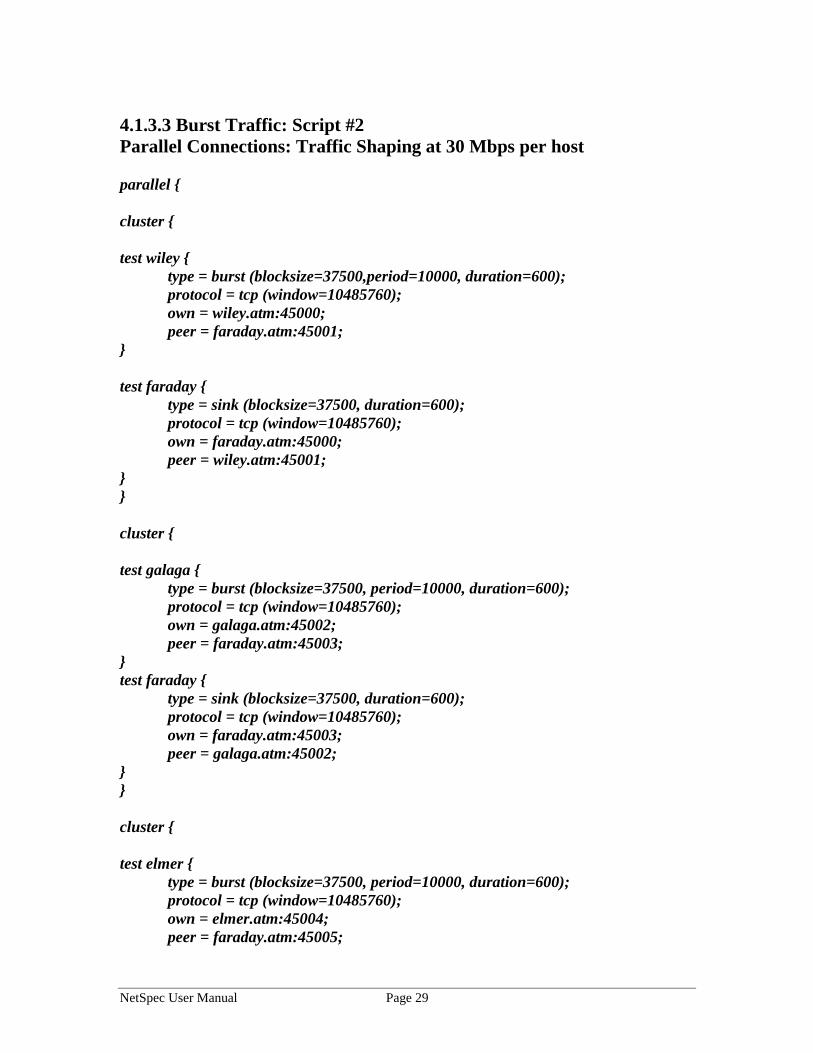
4.1.3.3 Burst Traffic: Script #2Parallel Connections: Traffic Shaping at 30 Mbps per host
parallel {
cluster {
test wiley {type = burst (blocksize=37500,period=10000, duration=600);protocol = tcp (window=10485760);own = wiley.atm:45000;peer = faraday.atm:45001;
}
test faraday {type = sink (blocksize=37500, duration=600);protocol = tcp (window=10485760);own = faraday.atm:45000;peer = wiley.atm:45001;
}}
cluster {
test galaga {type = burst (blocksize=37500, period=10000, duration=600);protocol = tcp (window=10485760);own = galaga.atm:45002;peer = faraday.atm:45003;
}test faraday {
type = sink (blocksize=37500, duration=600);protocol = tcp (window=10485760);own = faraday.atm:45003;peer = galaga.atm:45002;
}}
cluster {
test elmer {type = burst (blocksize=37500, period=10000, duration=600);protocol = tcp (window=10485760);own = elmer.atm:45004;peer = faraday.atm:45005;
NetSpec User Manual Page 30
}
test faraday {type = sink (blocksize=37500, duration=600);protocol = tcp (window=10485760);own = faraday.atm:45005;peer = elmer.atm:45004;
}}}
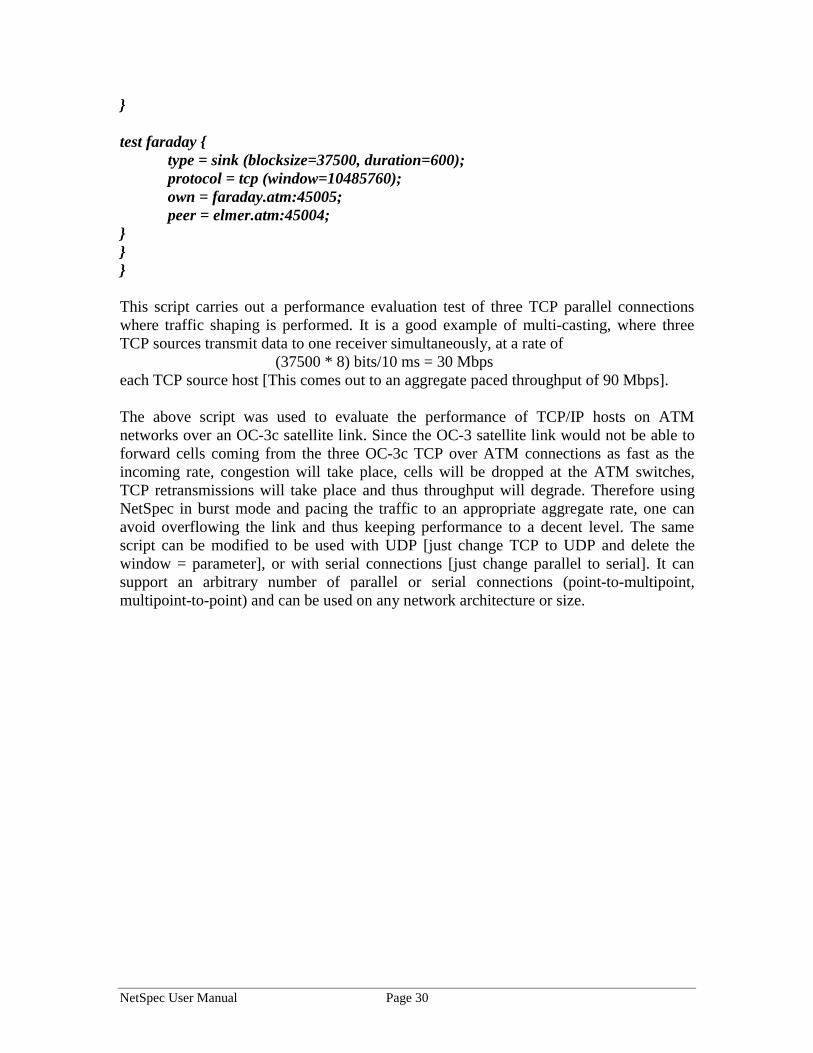
This script carries out a performance evaluation test of three TCP parallel connectionswhere traffic shaping is performed. It is a good example of multi-casting, where threeTCP sources transmit data to one receiver simultaneously, at a rate of (37500 * 8) bits/10 ms = 30 Mbpseach TCP source host [This comes out to an aggregate paced throughput of 90 Mbps].
The above script was used to evaluate the performance of TCP/IP hosts on ATMnetworks over an OC-3c satellite link. Since the OC-3 satellite link would not be able toforward cells coming from the three OC-3c TCP over ATM connections as fast as theincoming rate, congestion will take place, cells will be dropped at the ATM switches,TCP retransmissions will take place and thus throughput will degrade. Therefore usingNetSpec in burst mode and pacing the traffic to an appropriate aggregate rate, one canavoid overflowing the link and thus keeping performance to a decent level. The samescript can be modified to be used with UDP [just change TCP to UDP and delete thewindow = parameter], or with serial connections [just change parallel to serial]. It cansupport an arbitrary number of parallel or serial connections (point-to-multipoint,multipoint-to-point) and can be used on any network architecture or size.
NetSpec User Manual Page 31
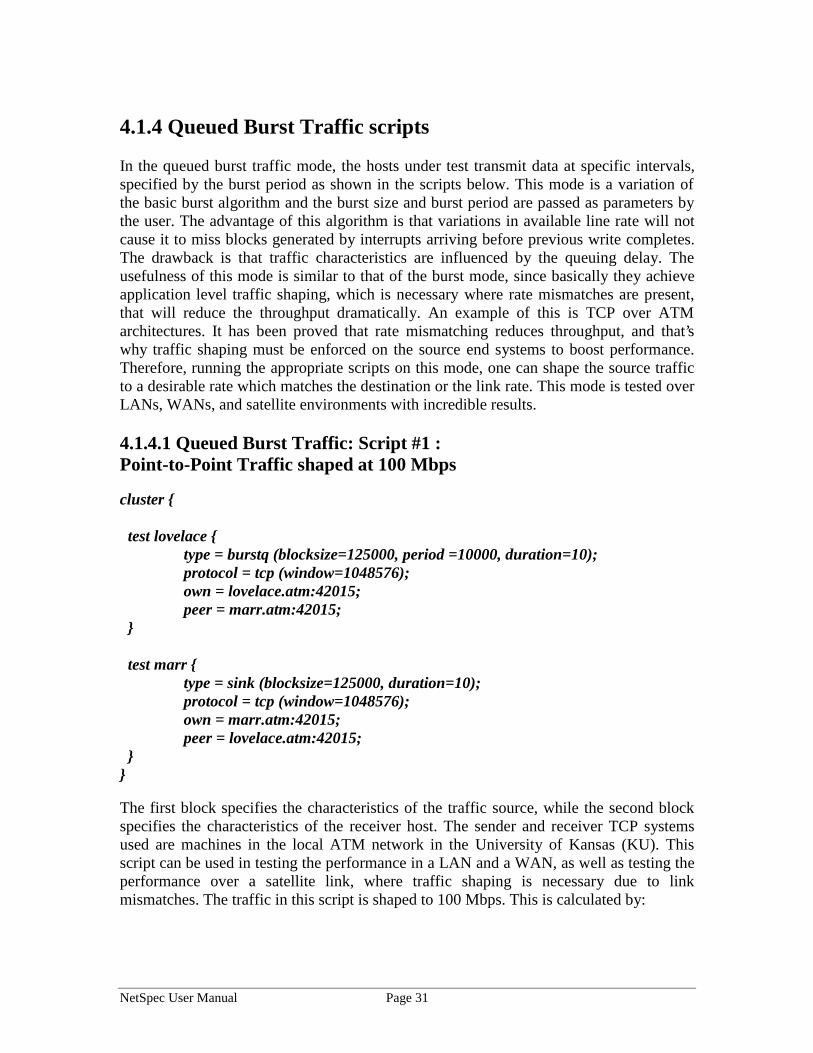
4.1.4 Queued Burst Traffic scripts
In the queued burst traffic mode, the hosts under test transmit data at specific intervals,specified by the burst period as shown in the scripts below. This mode is a variation ofthe basic burst algorithm and the burst size and burst period are passed as parameters bythe user. The advantage of this algorithm is that variations in available line rate will notcause it to miss blocks generated by interrupts arriving before previous write completes.The drawback is that traffic characteristics are influenced by the queuing delay. Theusefulness of this mode is similar to that of the burst mode, since basically they achieveapplication level traffic shaping, which is necessary where rate mismatches are present,that will reduce the throughput dramatically. An example of this is TCP over ATMarchitectures. It has been proved that rate mismatching reduces throughput, and that’swhy traffic shaping must be enforced on the source end systems to boost performance.Therefore, running the appropriate scripts on this mode, one can shape the source trafficto a desirable rate which matches the destination or the link rate. This mode is tested overLANs, WANs, and satellite environments with incredible results.
4.1.4.1 Queued Burst Traffic: Script #1 :Point-to-Point Traffic shaped at 100 Mbps
cluster {
test lovelace { type = burstq (blocksize=125000, period =10000, duration=10); protocol = tcp (window=1048576); own = lovelace.atm:42015; peer = marr.atm:42015;
}
test marr { type = sink (blocksize=125000, duration=10);
protocol = tcp (window=1048576); own = marr.atm:42015; peer = lovelace.atm:42015;
}}
The first block specifies the characteristics of the traffic source, while the second blockspecifies the characteristics of the receiver host. The sender and receiver TCP systemsused are machines in the local ATM network in the University of Kansas (KU). Thisscript can be used in testing the performance in a LAN and a WAN, as well as testing theperformance over a satellite link, where traffic shaping is necessary due to linkmismatches. The traffic in this script is shaped to 100 Mbps. This is calculated by:
NetSpec User Manual Page 32
Throughput = (blocksize * 8)/(period * 10(-3)) [b/s]
Where blocksize and period are the values used in the script.
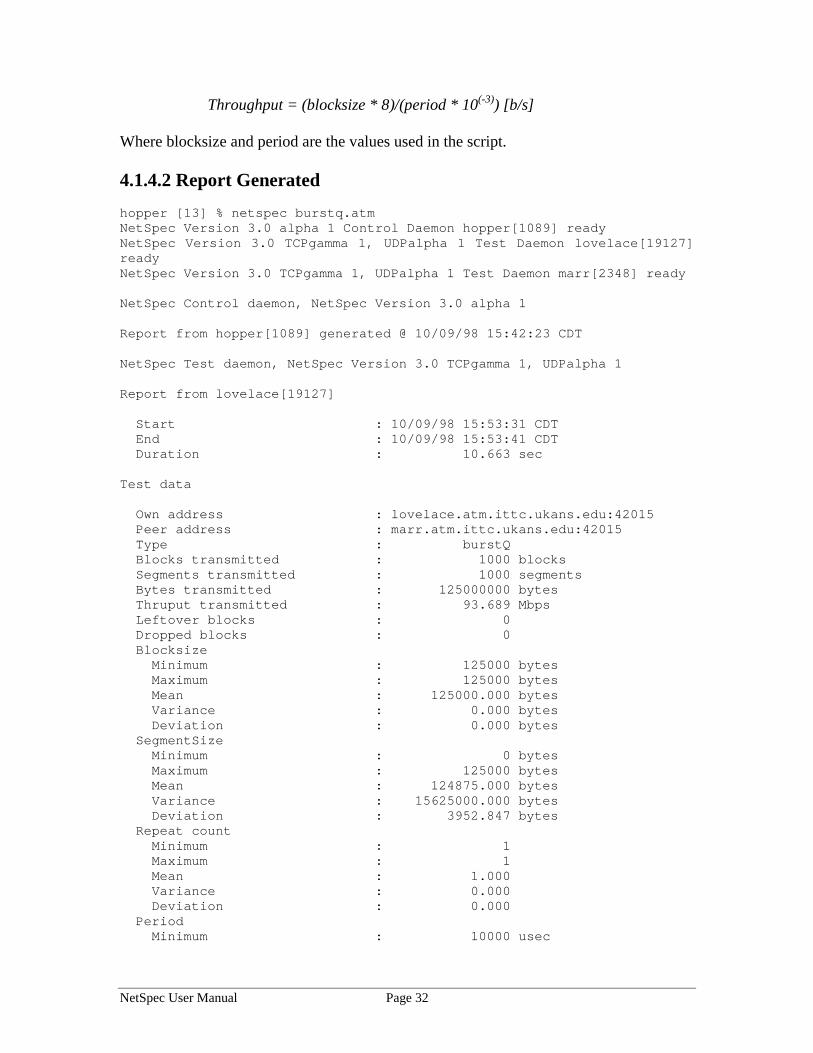
4.1.4.2 Report Generated
hopper [13] % netspec burstq.atmNetSpec Version 3.0 alpha 1 Control Daemon hopper[1089] readyNetSpec Version 3.0 TCPgamma 1, UDPalpha 1 Test Daemon lovelace[19127]readyNetSpec Version 3.0 TCPgamma 1, UDPalpha 1 Test Daemon marr[2348] ready
NetSpec Control daemon, NetSpec Version 3.0 alpha 1
Report from hopper[1089] generated @ 10/09/98 15:42:23 CDT
NetSpec Test daemon, NetSpec Version 3.0 TCPgamma 1, UDPalpha 1
Report from lovelace[19127]
Start : 10/09/98 15:53:31 CDT End : 10/09/98 15:53:41 CDT Duration : 10.663 sec
Test data
Own address : lovelace.atm.ittc.ukans.edu:42015 Peer address : marr.atm.ittc.ukans.edu:42015 Type : burstQ Blocks transmitted : 1000 blocks Segments transmitted : 1000 segments Bytes transmitted : 125000000 bytes Thruput transmitted : 93.689 Mbps Leftover blocks : 0 Dropped blocks : 0 Blocksize Minimum : 125000 bytes Maximum : 125000 bytes Mean : 125000.000 bytes Variance : 0.000 bytes Deviation : 0.000 bytes SegmentSize Minimum : 0 bytes Maximum : 125000 bytes Mean : 124875.000 bytes Variance : 15625000.000 bytes Deviation : 3952.847 bytes Repeat count Minimum : 1 Maximum : 1 Mean : 1.000 Variance : 0.000 Deviation : 0.000 Period Minimum : 10000 usec
NetSpec User Manual Page 33
Maximum : 10000 usec Mean : 10000.000 usec Variance : 0.000 usec Deviation : 0.000 usec Queue Minimum : 0 blocks Maximum : 3 blocks Mean : 0.095 blocks Variance : 0.118 blocks Deviation : 0.344 blocks
Protocol data (socket options)
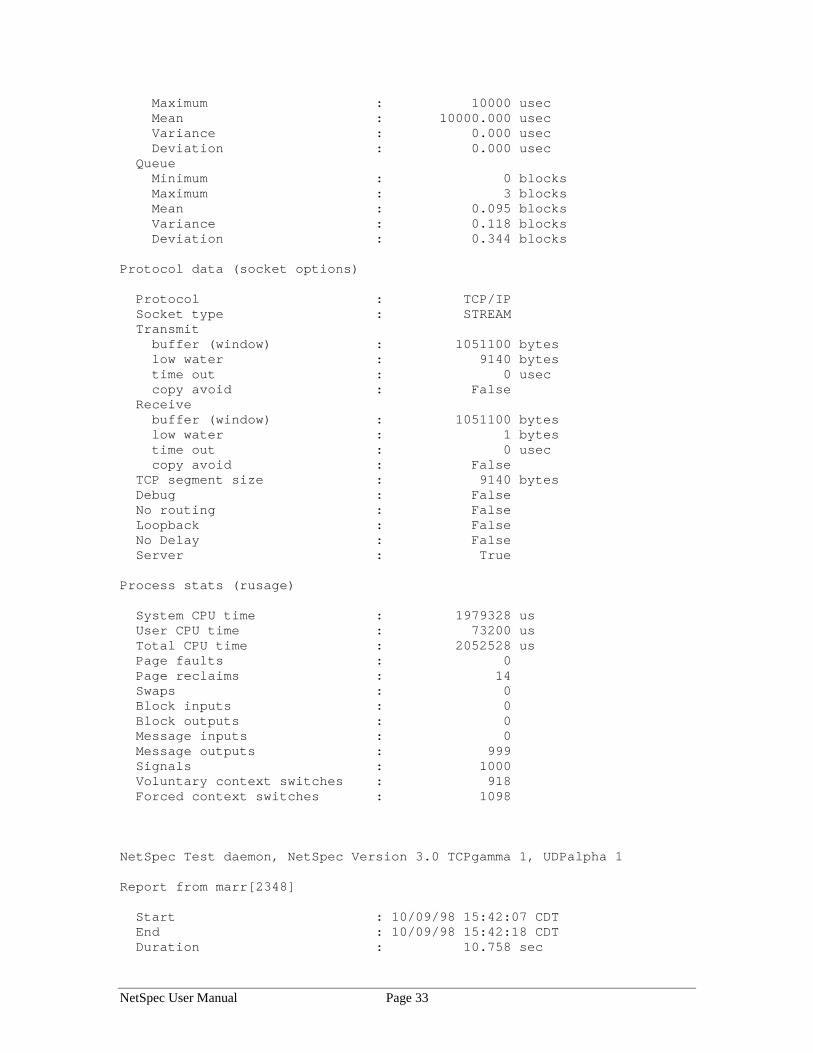
Protocol : TCP/IP Socket type : STREAM Transmit buffer (window) : 1051100 bytes low water : 9140 bytes time out : 0 usec copy avoid : False Receive buffer (window) : 1051100 bytes low water : 1 bytes time out : 0 usec copy avoid : False TCP segment size : 9140 bytes Debug : False No routing : False Loopback : False No Delay : False Server : True
Process stats (rusage)
System CPU time : 1979328 us User CPU time : 73200 us Total CPU time : 2052528 us Page faults : 0 Page reclaims : 14 Swaps : 0 Block inputs : 0 Block outputs : 0 Message inputs : 0 Message outputs : 999 Signals : 1000 Voluntary context switches : 918 Forced context switches : 1098
NetSpec Test daemon, NetSpec Version 3.0 TCPgamma 1, UDPalpha 1
Report from marr[2348]
Start : 10/09/98 15:42:07 CDT End : 10/09/98 15:42:18 CDT Duration : 10.758 sec
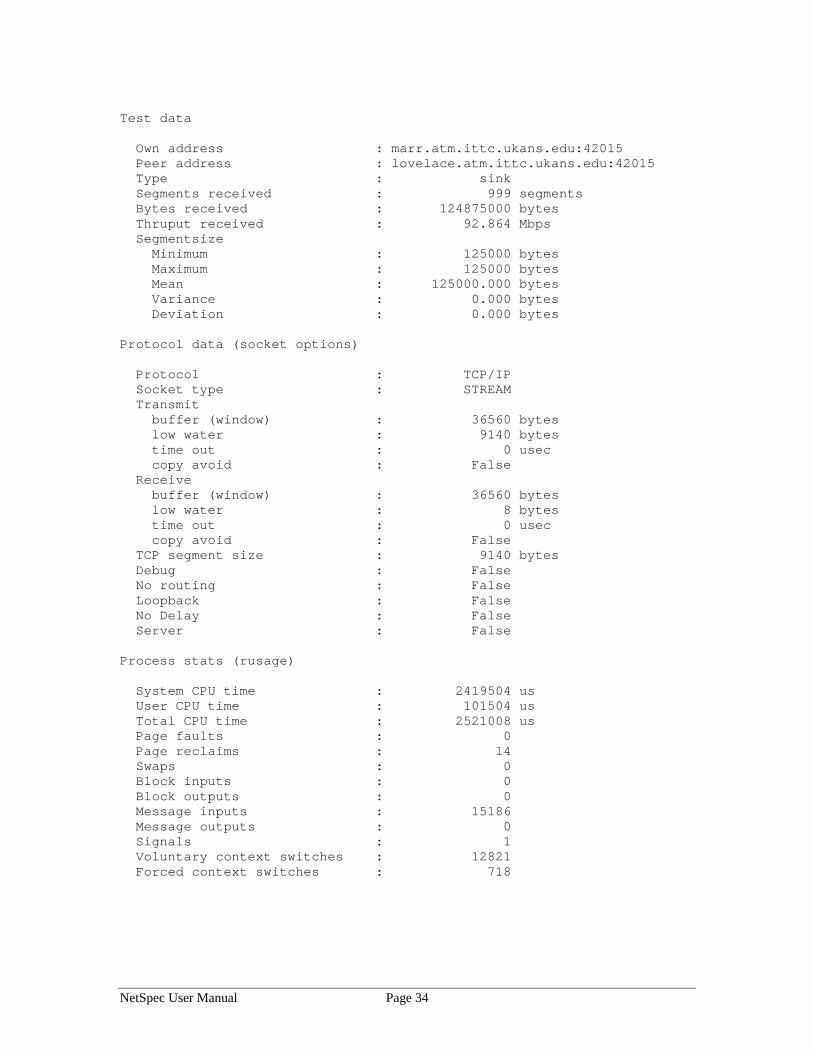
NetSpec User Manual Page 34
Test data
Own address : marr.atm.ittc.ukans.edu:42015 Peer address : lovelace.atm.ittc.ukans.edu:42015 Type : sink Segments received : 999 segments Bytes received : 124875000 bytes Thruput received : 92.864 Mbps Segmentsize Minimum : 125000 bytes Maximum : 125000 bytes Mean : 125000.000 bytes Variance : 0.000 bytes Deviation : 0.000 bytes
Protocol data (socket options)
Protocol : TCP/IP Socket type : STREAM Transmit buffer (window) : 36560 bytes low water : 9140 bytes time out : 0 usec copy avoid : False Receive buffer (window) : 36560 bytes low water : 8 bytes time out : 0 usec copy avoid : False TCP segment size : 9140 bytes Debug : False No routing : False Loopback : False No Delay : False Server : False
Process stats (rusage)
System CPU time : 2419504 us User CPU time : 101504 us Total CPU time : 2521008 us Page faults : 0 Page reclaims : 14 Swaps : 0 Block inputs : 0 Block outputs : 0 Message inputs : 15186 Message outputs : 0 Signals : 1 Voluntary context switches : 12821 Forced context switches : 718
NetSpec User Manual Page 35
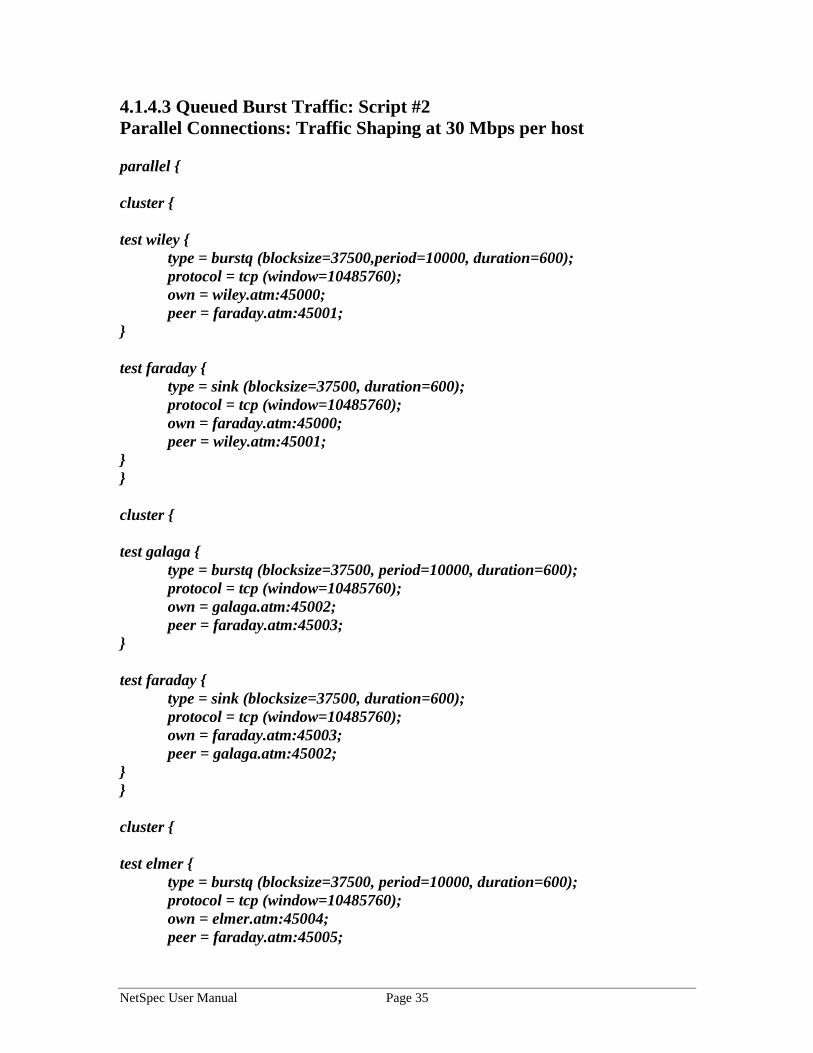
4.1.4.3 Queued Burst Traffic: Script #2Parallel Connections: Traffic Shaping at 30 Mbps per host
parallel {
cluster {
test wiley {type = burstq (blocksize=37500,period=10000, duration=600);protocol = tcp (window=10485760);own = wiley.atm:45000;peer = faraday.atm:45001;
}
test faraday {type = sink (blocksize=37500, duration=600);protocol = tcp (window=10485760);own = faraday.atm:45000;peer = wiley.atm:45001;
}}
cluster {
test galaga {type = burstq (blocksize=37500, period=10000, duration=600);protocol = tcp (window=10485760);own = galaga.atm:45002;peer = faraday.atm:45003;
}
test faraday {type = sink (blocksize=37500, duration=600);protocol = tcp (window=10485760);own = faraday.atm:45003;peer = galaga.atm:45002;
}}
cluster {
test elmer {type = burstq (blocksize=37500, period=10000, duration=600);protocol = tcp (window=10485760);own = elmer.atm:45004;peer = faraday.atm:45005;
NetSpec User Manual Page 36
}
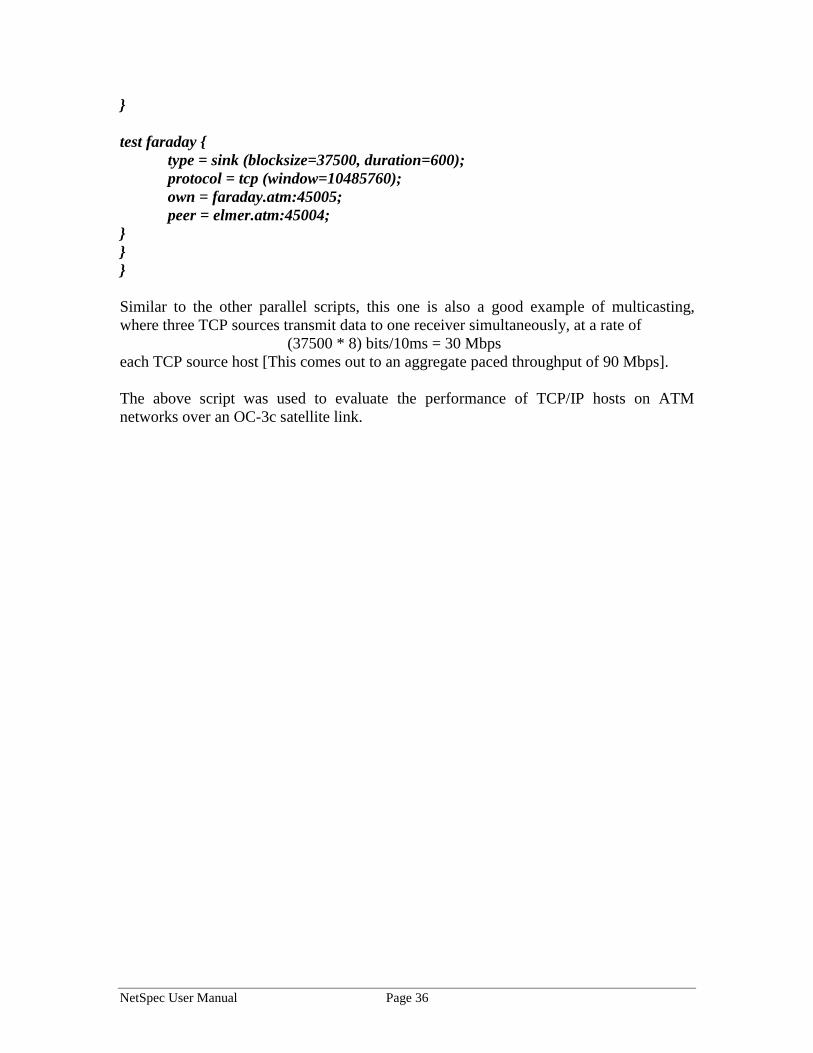
test faraday {type = sink (blocksize=37500, duration=600);protocol = tcp (window=10485760);own = faraday.atm:45005;peer = elmer.atm:45004;
}}}
Similar to the other parallel scripts, this one is also a good example of multicasting,where three TCP sources transmit data to one receiver simultaneously, at a rate of (37500 * 8) bits/10ms = 30 Mbpseach TCP source host [This comes out to an aggregate paced throughput of 90 Mbps].
The above script was used to evaluate the performance of TCP/IP hosts on ATMnetworks over an OC-3c satellite link.
NetSpec User Manual Page 37
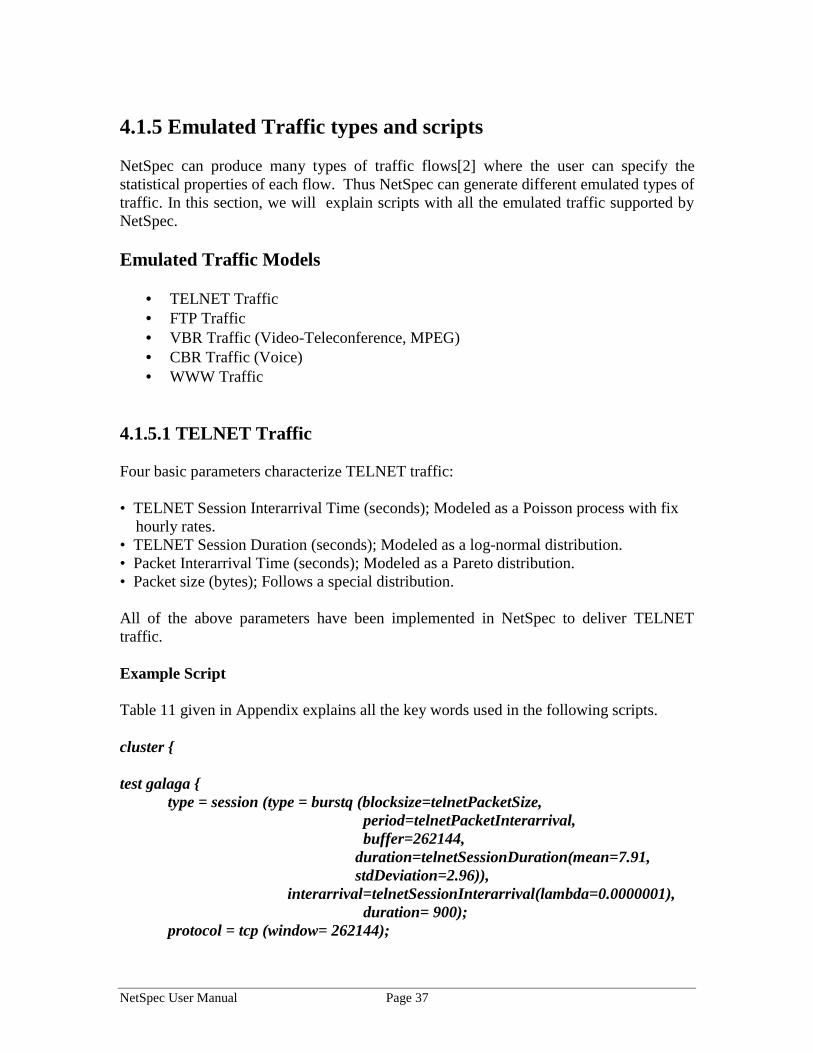
4.1.5 Emulated Traffic types and scripts
NetSpec can produce many types of traffic flows[2] where the user can specify thestatistical properties of each flow. Thus NetSpec can generate different emulated types oftraffic. In this section, we will explain scripts with all the emulated traffic supported byNetSpec.
Emulated Traffic Models
• TELNET Traffic• FTP Traffic• VBR Traffic (Video-Teleconference, MPEG)• CBR Traffic (Voice)• WWW Traffic
4.1.5.1 TELNET Traffic
Four basic parameters characterize TELNET traffic:
• TELNET Session Interarrival Time (seconds); Modeled as a Poisson process with fix hourly rates.• TELNET Session Duration (seconds); Modeled as a log-normal distribution.• Packet Interarrival Time (seconds); Modeled as a Pareto distribution.• Packet size (bytes); Follows a special distribution.
All of the above parameters have been implemented in NetSpec to deliver TELNETtraffic.
Example Script
Table 11 given in Appendix explains all the key words used in the following scripts.
cluster {
test galaga {type = session (type = burstq (blocksize=telnetPacketSize,
period=telnetPacketInterarrival, buffer=262144,
duration=telnetSessionDuration(mean=7.91,stdDeviation=2.96)),
interarrival=telnetSessionInterarrival(lambda=0.0000001), duration= 900);
protocol = tcp (window= 262144);
NetSpec User Manual Page 38
own = galaga.atm:45000;peer = hopper.atm:45001;
}
test hopper {type = sink (buffer=262144, duration=900);protocol = tcp (window=262144, rcvlowat=8);own = hopper.atm:45000;peer = galaga.atm:45001;
}}
The blocksize and the period are using the fixed models, telnetPacketSize andtelnetPacketInterarrival. Duration of each session is set to be the telnetSessionDurationdistribution with mean = 7.91 and standard deviation = 2.96. This means that the mean oftelnet sessions is 2^7.91; approximately 240 seconds. The interarrival of telnet sessionhas a mean of 1/0.0000001 microseconds = 10 seconds. The duration of the test is 900seconds = 15 minutes.
4.1.5.2 FTP Traffic
Compared to TELNET traffic, FTP traffic doesn’t have the duration and item interarrivaltime setups. This is because the duration of each FTP session is dependent upon thenetwork capacity, such as link rate. The faster the link rate, the more items the networkcan transfer in the same amount of time.
The following three parameters are needed to characterize FTP traffic:
• FTP Session Interarrival Time (seconds); Modeled as a Poisson process within one hour intervals.• FTP number of items transferred; Follows a special distribution.• FTP item size (bytes); Modeled as log-normal distribution.
Example Script
cluster {
test galaga {type = burstq (blocksize=ftpItemSize,
repeats=ftpNOfItems, period=ftpSessionInterarrival(lambda=0.00001),
buffer=262144, duration= 1800);
protocol = tcp (window= 262144);own = galaga.atm:45000;peer = hopper.atm:45001;
NetSpec User Manual Page 39
}
test hopper {type = sink (blocksize=262144, duration=900);protocol = tcp (window=262144)own = hopper.atm:45000;peer = galaga.atm:45001;
}}
ftpItemSize and ftpNOfItems are the fixed models. In this script, the interarrival time offtp sessions has a mean of 1/0.00001 = 100 milliseconds. The duration of the whole testis about half an hour (1800 seconds).
4.1.5.3 VBR Traffic (e.g. Video)
Broadband integrated networks are expected to carry substantial portions of the videoservices. Accurate source modeling of video and other services is essential to develop anetwork that achieves pre-defined quality of services and cost-efficiency.
Generally, there are two types of video traffic:
(1) Teleconference video stream, and(2) MPEG video stream.
Each of these video streams has difference characteristics based on its nature of objectmotions and use of compression algorithms. NetSpec is capable of producing both videotraffic streams as specified.
1.Video Teleconference
Two basic parameters characterize Video teleconference traffic.
• Frame Interarrival Time(seconds); [1/frame rate]. It's a constant value: In NTSC systems is 33 ms (30 frames/sec). In PAL systems is 40 ms (25 frames/sec).If using 25 to 30 frames/sec rates, it will produce high quality video stream that requires a large portion of network bandwidth. Typical conference calls with high compression technique that produce acceptable quality often only require 5 to 15 frames/sec rates. Generally, 12 frame/sec (83 milliseconds/frame) is 0 commonly used.
• Number of Cells per frame. Modeled as a gamma distribution.
Both of the above parameters have been implemented in NetSpec to deliver VideoTeleconference traffic.
NetSpec User Manual Page 40
Example Script
cluster {
test galaga {type = burstq (blocksize=videoTeleConferenceFrameSize(scale=42.50,shape=3),
period=83000, duration= 600);
protocol = tcp (window= 262144);own = galaga.atm:45000;peer = hopper.atm:45001;
}
test hopper {type = sink (buffer=131072, duration=900);protocol = tcp (window=262144, rcvlowat=8);own = hopper.atm:45000;peer = galaga.atm:45001;
}}
The constant period is 83000 microseconds (83 ms); approximately 12 frames/sec[1/(83000*10(-6))].
2.MPEG (Motion Picture Experts Group) Video stream
The basic parameters needed to characterize MPEG Video traffic are:• Frame Interarrival Time (seconds); For high quality motion pictures, a high frame rate is often required. The typical constant interframe period is at least 33 ms (30 frames/sec) for NTSC standard systems and 40 ms (25 frames/sec) for PAL standard systems.
• Scene length; A video stream consists of several segments such that the sizes of I frames in each segment are close in value. The length of a scene (in I frames) is modeled as a geometric distribution.
• Number of Cell per frame; There are three types of coded frames : Intra-coded (I); Prediction (P), and bidirectional (B) MPEG frames. The sizes of all three coded frames are modeled as log-normal distributions with different mean and standard deviation.
NetSpec User Manual Page 41
Both of the above parameters have been implemented in Netspec to deliver MPEG Videotraffic.
Example Script
cluster {
test galaga {type = burstq (blocksize=videoMPEGFrameSize(sceneLengthMean=10.5,
Imean=5.1968,IstdDeviation=0.2016, Pmean=3.7380,PstdDeviation=0.5961,Bmean=2.8687,BstdDeviation=0.2675,
period=33000, duration= 300);
protocol = tcp (window= 262144);own = galaga.atm:45000;peer = hopper.atm:45001;
}
test hopper {type = sink (blocksize=131072, duration=300);protocol = tcp (window=262144, rcvlowat=8);own = hopper.atm:45000;peer = galaga.atm:45001;
}}
The interarrival time of frames is 33000 microseconds; approximately 30 frames/sec.
4.1.5.4 CBR Traffic (e.g. Voice)
The standard way for digitizing the voice signal is to bandlimit the signal to a band from100Hz to 3400Hz and then to sample that at 8kHz. Each sample is given 8 bits. Thisproduces the standard bit rate of 64kb/s for voice.
The following parameters are needed to characterize Voice traffic.
• Voice Session Interarrival Time (seconds); The connection arrivals can be modeled by a Poisson process with fixed hourly rates within one-hour periods.
• Voice Session Duration (holding time); Modeled as an exponential distribution.
NetSpec User Manual Page 42
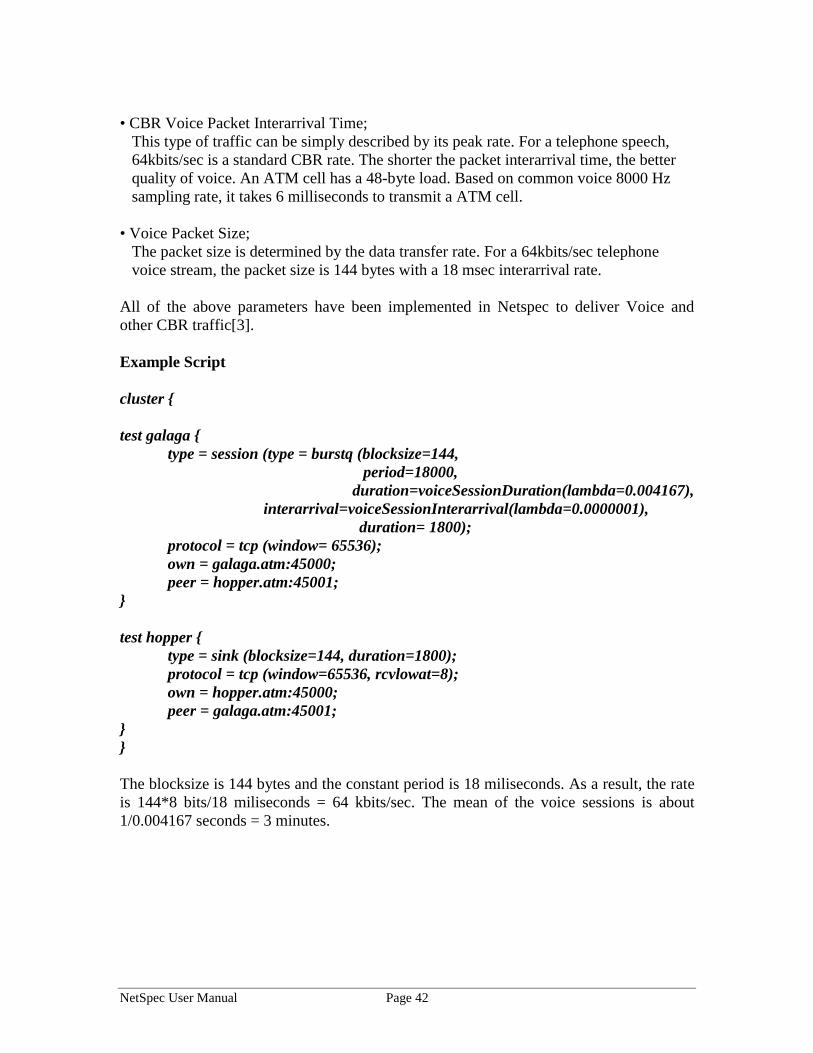
• CBR Voice Packet Interarrival Time; This type of traffic can be simply described by its peak rate. For a telephone speech, 64kbits/sec is a standard CBR rate. The shorter the packet interarrival time, the better quality of voice. An ATM cell has a 48-byte load. Based on common voice 8000 Hz sampling rate, it takes 6 milliseconds to transmit a ATM cell.
• Voice Packet Size; The packet size is determined by the data transfer rate. For a 64kbits/sec telephone voice stream, the packet size is 144 bytes with a 18 msec interarrival rate.
All of the above parameters have been implemented in Netspec to deliver Voice andother CBR traffic[3].
Example Script
cluster {
test galaga {type = session (type = burstq (blocksize=144,
period=18000, duration=voiceSessionDuration(lambda=0.004167), interarrival=voiceSessionInterarrival(lambda=0.0000001), duration= 1800);
protocol = tcp (window= 65536);own = galaga.atm:45000;peer = hopper.atm:45001;
}
test hopper {type = sink (blocksize=144, duration=1800);protocol = tcp (window=65536, rcvlowat=8);own = hopper.atm:45000;peer = galaga.atm:45001;
}}
The blocksize is 144 bytes and the constant period is 18 miliseconds. As a result, the rateis 144*8 bits/18 miliseconds = 64 kbits/sec. The mean of the voice sessions is about1/0.004167 seconds = 3 minutes.
NetSpec User Manual Page 43
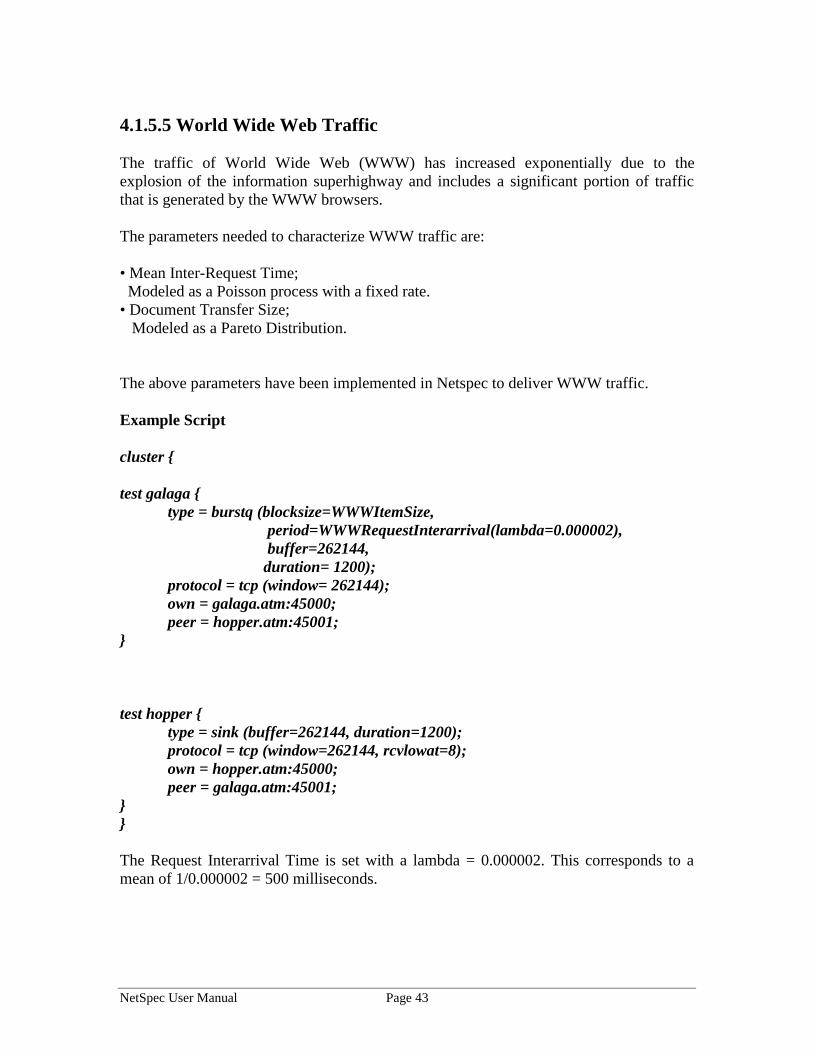
4.1.5.5 World Wide Web Traffic
The traffic of World Wide Web (WWW) has increased exponentially due to theexplosion of the information superhighway and includes a significant portion of trafficthat is generated by the WWW browsers.
The parameters needed to characterize WWW traffic are:
• Mean Inter-Request Time; Modeled as a Poisson process with a fixed rate.• Document Transfer Size; Modeled as a Pareto Distribution.
The above parameters have been implemented in Netspec to deliver WWW traffic.
Example Script
cluster {
test galaga {type = burstq (blocksize=WWWItemSize,
period=WWWRequestInterarrival(lambda=0.000002), buffer=262144,
duration= 1200);protocol = tcp (window= 262144);own = galaga.atm:45000;peer = hopper.atm:45001;
}
test hopper {type = sink (buffer=262144, duration=1200);protocol = tcp (window=262144, rcvlowat=8);own = hopper.atm:45000;peer = galaga.atm:45001;
}}
The Request Interarrival Time is set with a lambda = 0.000002. This corresponds to amean of 1/0.000002 = 500 milliseconds.
NetSpec User Manual Page 44
4.2 Data Stream Daemon (nsdstrd)
The NetSpec Test Daemon (nstestd) generates various types of traffic and delayvariations and measures the end-to-end performance in terms of throughput. While theTest Daemon also provides a way to collect time stamps of individual packets at theapplication level, it is often desirable to collect the event traces from the lower levels ofthe system.
Data Stream Driver Interface (DSKI) [http://hegel.ittc.ukans.edu/projects/datastream/index.html] isa tool to collect event traces and data from the Operating System kernel. To allow datacollection from the Operating System in the NetSpec framework, the nsdstrd was written.The nsdstrd thus functions as a measurement daemon. The Data Stream daemon allowsthe collection of event traces and counter values from the OS kernel. The kernel must beinstrumented with tap points as described in the DSKI document. The DSKI is onlysupported in the Digital UNIX and Linux. To make use of the Data Stream daemon, youmust have access to the OS source code.
4.2.1 Features
1. Event Traces (Active Source)
• Collect event traces for a subset of events from the kernel.• Can enable all events in a family.• Can specify the length of experiment by the duration (in second) or by the number of events.• Can specify one special parameter to filter trace.
2. Counter
• Collect counter values for a subset of counters from the kernel.• Can enable all counter in a family.• Collection is done periodically for a specified duration.
4.2.2 NetSpec Script
1. Active Source
dstream { type = active (numevents = x, duration = y, param = z);
family1 = set ( eventnames ) | all; family2 = set ( eventnames ) | all;
}
NetSpec User Manual Page 45
Parameters:
• numevents: The maximum number of events to collect.• duration: The length of experiment in seconds. If duration is not specified, the experiment will continue until the maximum count is reached. (optional)• param: A value to pass to the DSKI to filter out unwanted data. See DSKI documentation for more details. If this parameter is not specified, the event trace
comes unfiltered. (optional)• family name: A valid family name which has been registered with DSKI. For
each family, a subset of events must be specified. If all events are to be collected, the keyword all can be used instead.
• eventnames: A coma-separated list of valid event names in a family.
2. Counter
dstream { type = counter (duration = x, interval = y);
family1 = set ( counternames ) | all; family2 = set ( counternames ) | all;
}
Parameters:
• duration: The length of experiment in seconds. (optional)• interval: The interval between two successive readings of the counter values in
seconds. (optional)• family name: A valid family name which has been registered with DSKI. For
each family, a subset of counters must be specified. If all counter values are to becollected, the keyword all can be used instead.
• counternames: A coma-separated list of valid counter names in a family.
4.2.3 Examples
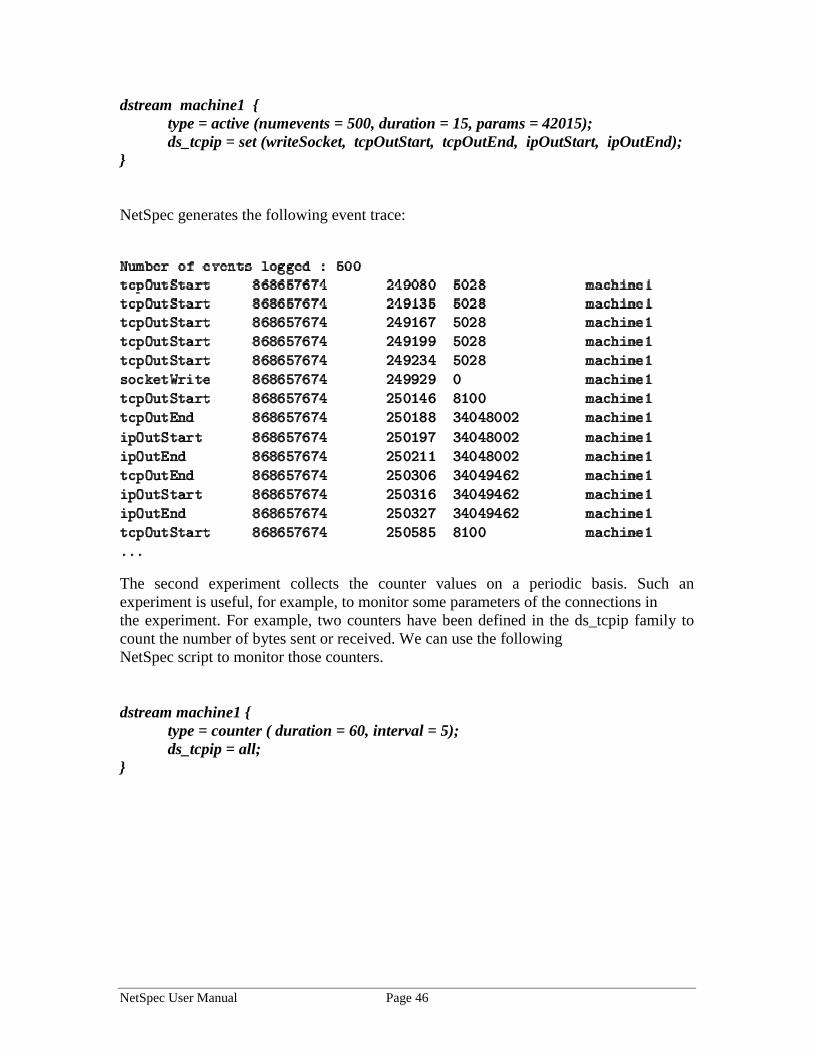
The first example shows how can we use the DSKI to collect detailed event traces of theTCP/IP protocol stack. The kernel has been instrumented with several event loggingpoints. We would like to collect event traces on the transmitting host. Specifically, weonly want traces for packets going on port 42015. To do that, the following script isincluded in the NetSpec script.
NetSpec User Manual Page 46
dstream machine1 {type = active (numevents = 500, duration = 15, params = 42015);ds_tcpip = set (writeSocket, tcpOutStart, tcpOutEnd, ipOutStart, ipOutEnd);
}
NetSpec generates the following event trace:
The second experiment collects the counter values on a periodic basis. Such anexperiment is useful, for example, to monitor some parameters of the connections inthe experiment. For example, two counters have been defined in the ds_tcpip family tocount the number of bytes sent or received. We can use the followingNetSpec script to monitor those counters.
dstream machine1 {type = counter ( duration = 60, interval = 5);ds_tcpip = all;
}

NetSpec User Manual Page 47
NetSpec generates the following report
NetSpec User Manual Page 48
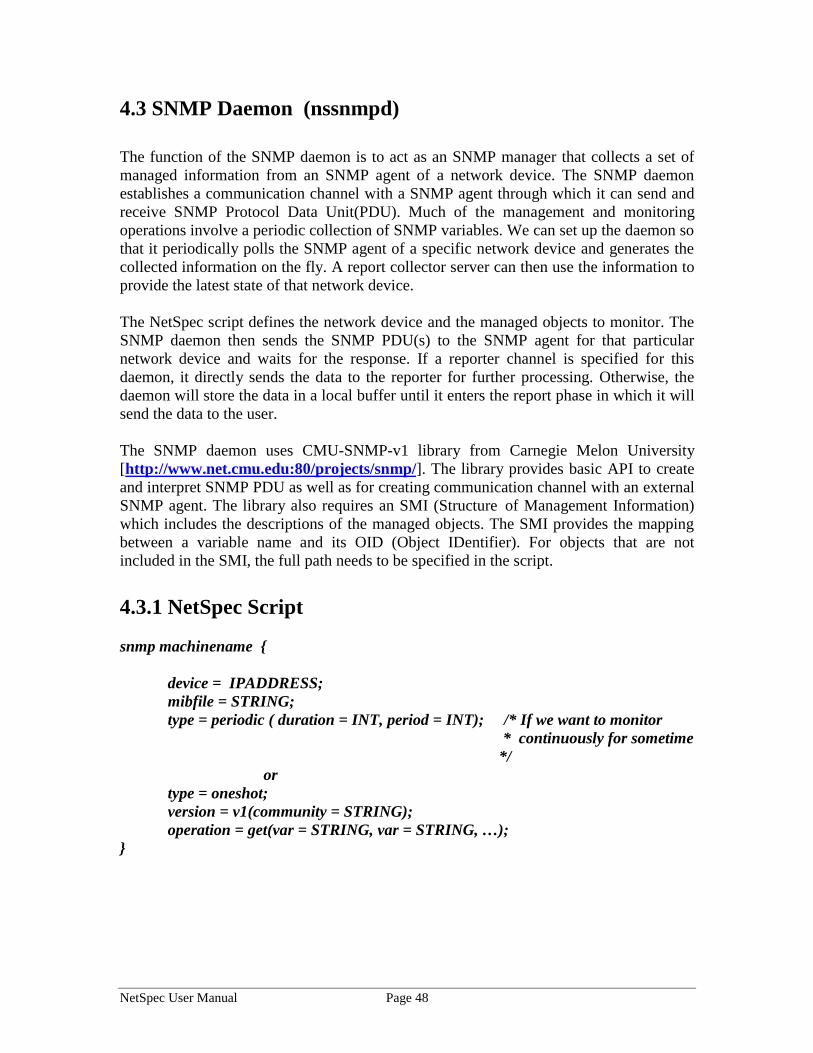
4.3 SNMP Daemon (nssnmpd)
The function of the SNMP daemon is to act as an SNMP manager that collects a set ofmanaged information from an SNMP agent of a network device. The SNMP daemonestablishes a communication channel with a SNMP agent through which it can send andreceive SNMP Protocol Data Unit(PDU). Much of the management and monitoringoperations involve a periodic collection of SNMP variables. We can set up the daemon sothat it periodically polls the SNMP agent of a specific network device and generates thecollected information on the fly. A report collector server can then use the information toprovide the latest state of that network device.
The NetSpec script defines the network device and the managed objects to monitor. TheSNMP daemon then sends the SNMP PDU(s) to the SNMP agent for that particularnetwork device and waits for the response. If a reporter channel is specified for thisdaemon, it directly sends the data to the reporter for further processing. Otherwise, thedaemon will store the data in a local buffer until it enters the report phase in which it willsend the data to the user.
The SNMP daemon uses CMU-SNMP-v1 library from Carnegie Melon University[http://www.net.cmu.edu:80/projects/snmp/]. The library provides basic API to createand interpret SNMP PDU as well as for creating communication channel with an externalSNMP agent. The library also requires an SMI (Structure of Management Information)which includes the descriptions of the managed objects. The SMI provides the mappingbetween a variable name and its OID (Object IDentifier). For objects that are notincluded in the SMI, the full path needs to be specified in the script.
4.3.1 NetSpec Script
snmp machinename {
device = IPADDRESS;mibfile = STRING;type = periodic ( duration = INT, period = INT); /* If we want to monitor
* continuously for sometime */
ortype = oneshot;version = v1(community = STRING);operation = get(var = STRING, var = STRING, …);
}
NetSpec User Manual Page 49
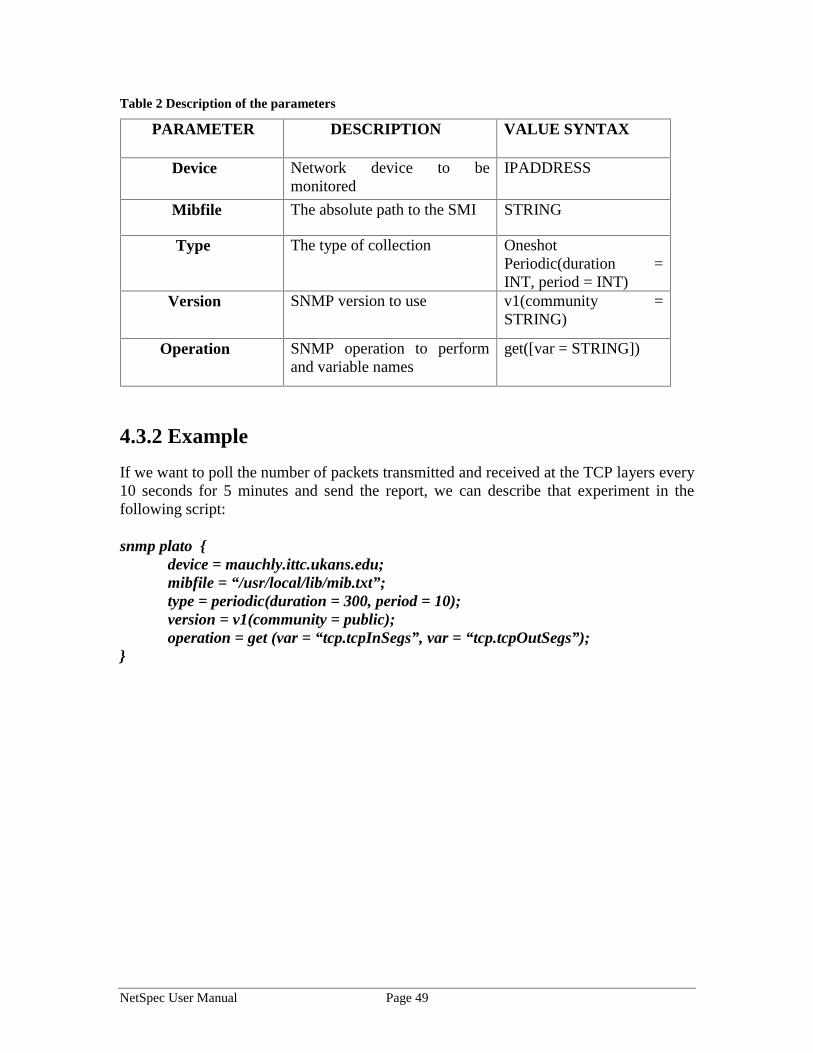
Table 2 Description of the parameters
PARAMETER DESCRIPTION VALUE SYNTAX
Device Network device to bemonitored
IPADDRESS
Mibfile The absolute path to the SMI STRING
Type The type of collection OneshotPeriodic(duration =INT, period = INT)
Version SNMP version to use v1(community =STRING)
Operation SNMP operation to performand variable names
get([var = STRING])
4.3.2 Example
If we want to poll the number of packets transmitted and received at the TCP layers every10 seconds for 5 minutes and send the report, we can describe that experiment in thefollowing script:
snmp plato {device = mauchly.ittc.ukans.edu;mibfile = “/usr/local/lib/mib.txt”;type = periodic(duration = 300, period = 10);version = v1(community = public);operation = get (var = “tcp.tcpInSegs”, var = “tcp.tcpOutSegs”);
}
NetSpec User Manual Page 50
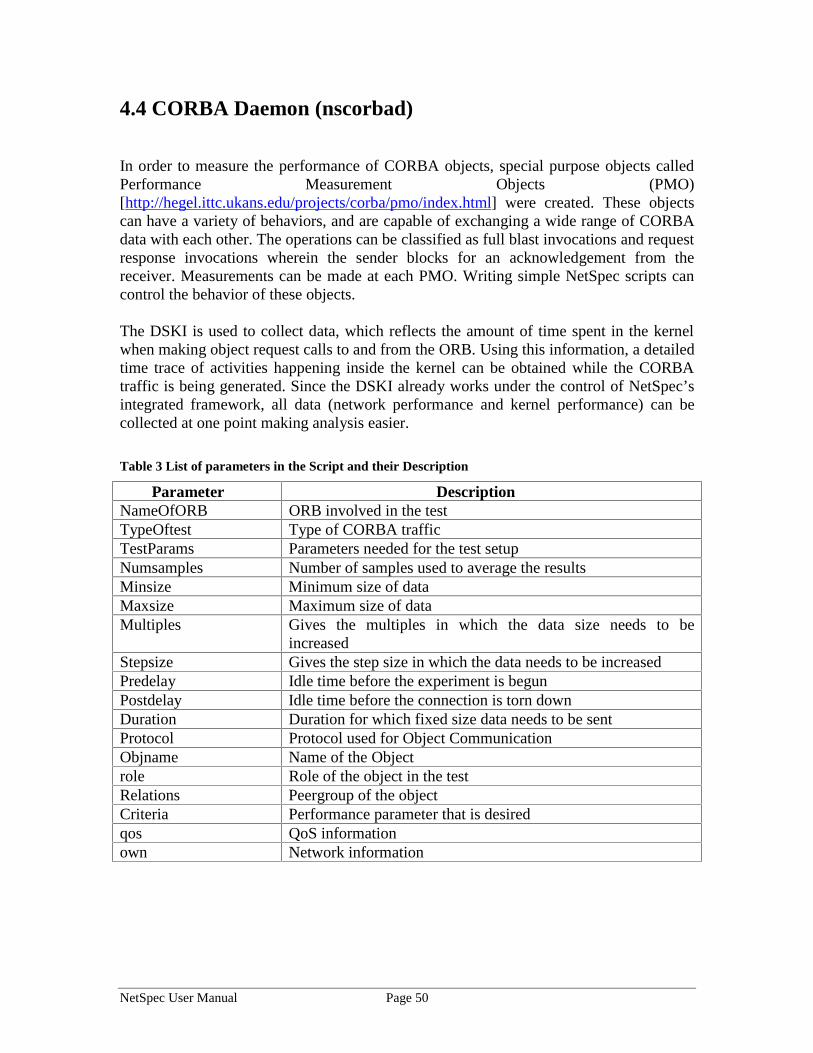
4.4 CORBA Daemon (nscorbad)
In order to measure the performance of CORBA objects, special purpose objects calledPerformance Measurement Objects (PMO)[http://hegel.ittc.ukans.edu/projects/corba/pmo/index.html] were created. These objectscan have a variety of behaviors, and are capable of exchanging a wide range of CORBAdata with each other. The operations can be classified as full blast invocations and requestresponse invocations wherein the sender blocks for an acknowledgement from thereceiver. Measurements can be made at each PMO. Writing simple NetSpec scripts cancontrol the behavior of these objects.
The DSKI is used to collect data, which reflects the amount of time spent in the kernelwhen making object request calls to and from the ORB. Using this information, a detailedtime trace of activities happening inside the kernel can be obtained while the CORBAtraffic is being generated. Since the DSKI already works under the control of NetSpec’sintegrated framework, all data (network performance and kernel performance) can becollected at one point making analysis easier.
Table 3 List of parameters in the Script and their Description
Parameter DescriptionNameOfORB ORB involved in the testTypeOftest Type of CORBA trafficTestParams Parameters needed for the test setupNumsamples Number of samples used to average the resultsMinsize Minimum size of dataMaxsize Maximum size of dataMultiples Gives the multiples in which the data size needs to be
increasedStepsize Gives the step size in which the data needs to be increasedPredelay Idle time before the experiment is begunPostdelay Idle time before the connection is torn downDuration Duration for which fixed size data needs to be sentProtocol Protocol used for Object CommunicationObjname Name of the Objectrole Role of the object in the testRelations Peergroup of the objectCriteria Performance parameter that is desiredqos QoS informationown Network information
NetSpec User Manual Page 51
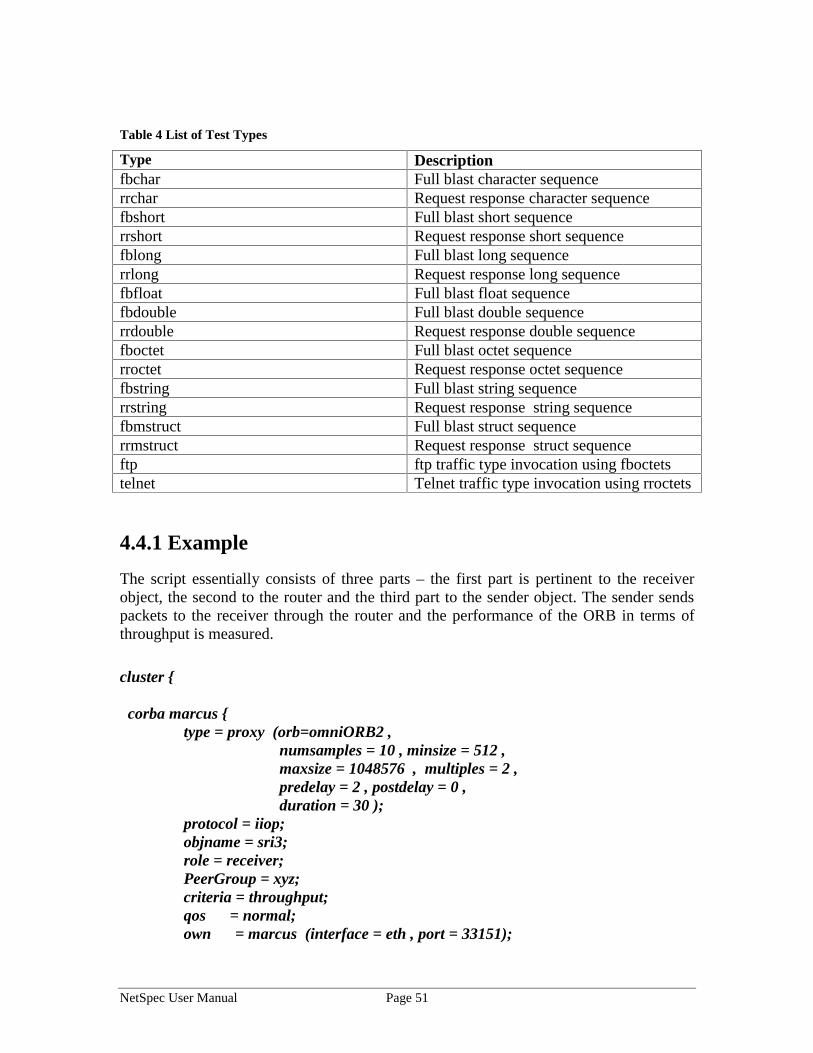
Table 4 List of Test Types
Type Descriptionfbchar Full blast character sequencerrchar Request response character sequencefbshort Full blast short sequencerrshort Request response short sequencefblong Full blast long sequencerrlong Request response long sequencefbfloat Full blast float sequencefbdouble Full blast double sequencerrdouble Request response double sequencefboctet Full blast octet sequencerroctet Request response octet sequencefbstring Full blast string sequencerrstring Request response string sequencefbmstruct Full blast struct sequencerrmstruct Request response struct sequenceftp ftp traffic type invocation using fboctetstelnet Telnet traffic type invocation using rroctets
4.4.1 Example
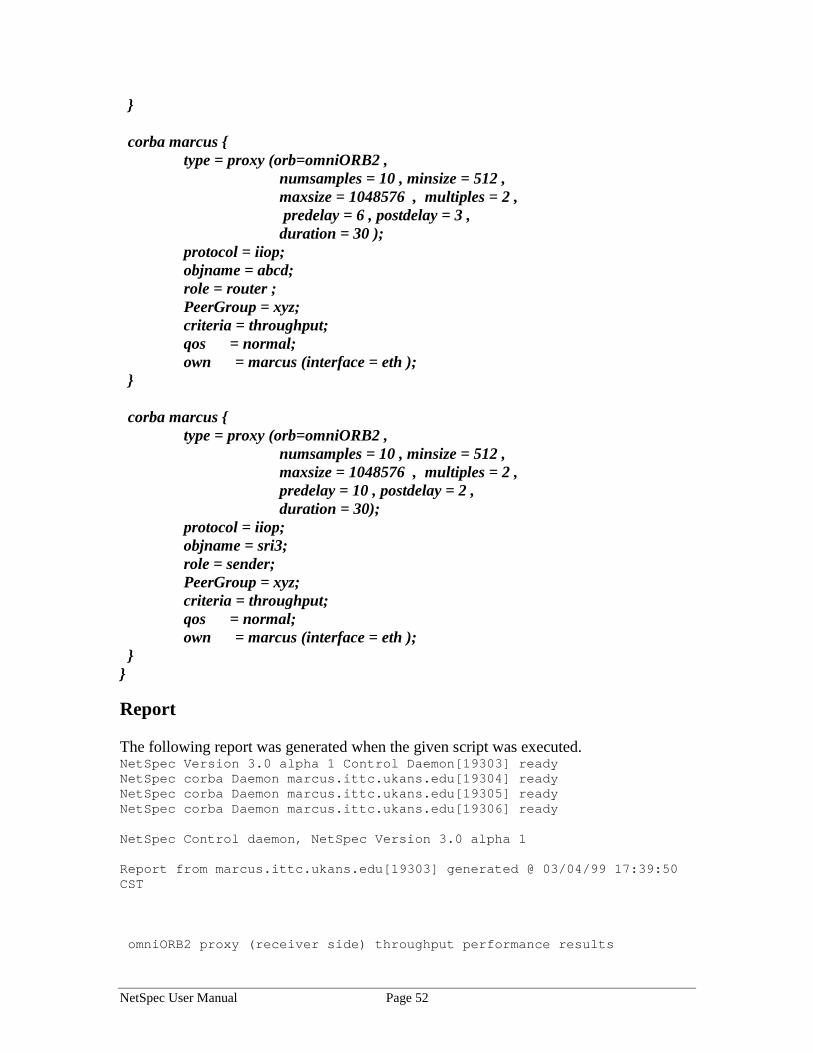
The script essentially consists of three parts – the first part is pertinent to the receiverobject, the second to the router and the third part to the sender object. The sender sendspackets to the receiver through the router and the performance of the ORB in terms ofthroughput is measured.
cluster {
corba marcus { type = proxy (orb=omniORB2 ,
numsamples = 10 , minsize = 512 , maxsize = 1048576 , multiples = 2 , predelay = 2 , postdelay = 0 ,
duration = 30 ); protocol = iiop; objname = sri3; role = receiver; PeerGroup = xyz; criteria = throughput; qos = normal; own = marcus (interface = eth , port = 33151);
NetSpec User Manual Page 52
}
corba marcus { type = proxy (orb=omniORB2 ,
numsamples = 10 , minsize = 512 , maxsize = 1048576 , multiples = 2 , predelay = 6 , postdelay = 3 ,
duration = 30 ); protocol = iiop; objname = abcd; role = router ; PeerGroup = xyz; criteria = throughput; qos = normal; own = marcus (interface = eth );
}
corba marcus { type = proxy (orb=omniORB2 ,
numsamples = 10 , minsize = 512 , maxsize = 1048576 , multiples = 2 , predelay = 10 , postdelay = 2 , duration = 30);
protocol = iiop; objname = sri3; role = sender; PeerGroup = xyz; criteria = throughput; qos = normal; own = marcus (interface = eth );
}}
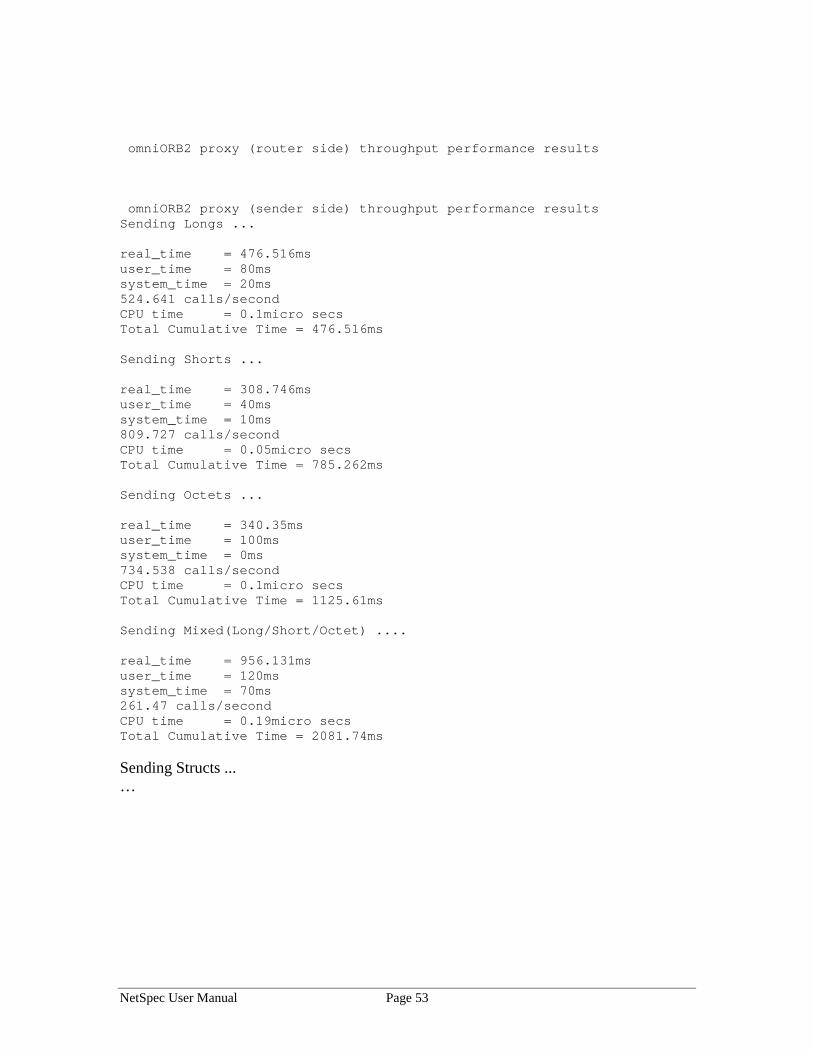
Report
The following report was generated when the given script was executed.NetSpec Version 3.0 alpha 1 Control Daemon[19303] readyNetSpec corba Daemon marcus.ittc.ukans.edu[19304] readyNetSpec corba Daemon marcus.ittc.ukans.edu[19305] readyNetSpec corba Daemon marcus.ittc.ukans.edu[19306] ready
NetSpec Control daemon, NetSpec Version 3.0 alpha 1
Report from marcus.ittc.ukans.edu[19303] generated @ 03/04/99 17:39:50CST
omniORB2 proxy (receiver side) throughput performance results
NetSpec User Manual Page 53
omniORB2 proxy (router side) throughput performance results
omniORB2 proxy (sender side) throughput performance resultsSending Longs ...
real_time = 476.516msuser_time = 80mssystem_time = 20ms524.641 calls/secondCPU time = 0.1micro secsTotal Cumulative Time = 476.516ms
Sending Shorts ...
real_time = 308.746msuser_time = 40mssystem_time = 10ms809.727 calls/secondCPU time = 0.05micro secsTotal Cumulative Time = 785.262ms
Sending Octets ...
real_time = 340.35msuser_time = 100mssystem_time = 0ms734.538 calls/secondCPU time = 0.1micro secsTotal Cumulative Time = 1125.61ms
Sending Mixed(Long/Short/Octet) ....
real_time = 956.131msuser_time = 120mssystem_time = 70ms261.47 calls/secondCPU time = 0.19micro secsTotal Cumulative Time = 2081.74ms
Sending Structs ...…

NetSpec User Manual Page 54
4.5 Private Network – Network Interface Daemon (pnnid)
PNNI is a topology state routing protocol in which nodes flood Quality of Service andreachability information to all other nodes so that each node obtains completeinformation about the topology of the network and its current state. In an effort to reducethe complexity of such a scheme, PNNI uses a hierarchical model to divide nodes intopeer groups.
4.5.1 Features of PNNI
• PNNI has the capability to automatically configure itself when the addressstructure reflects the topology of the network
• The hierarchical model allows it to scale well for large networks.• Crankback feature allows it to reroute around failed components during call setup• Connection follows the same path as the setup message used.• Uses many routing metrics including cell transfer delay, delay variation, current
and average peak load.
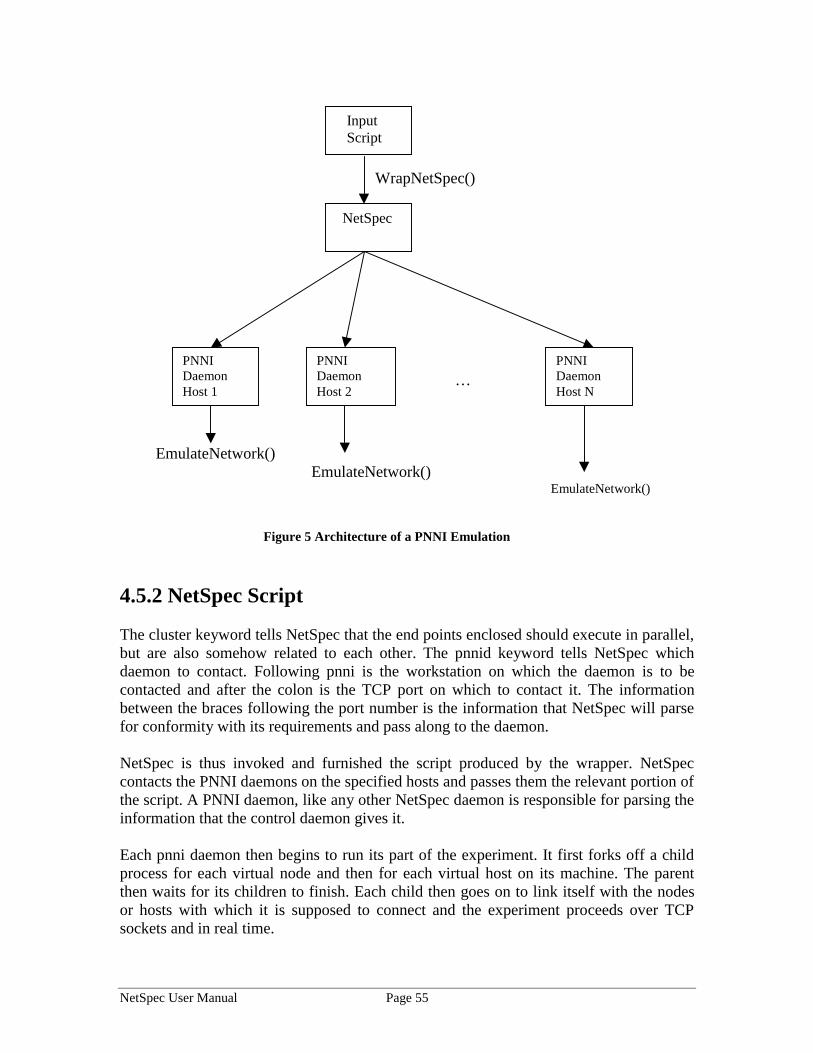
The PNNI Simulation and Emulation tools has a common user interface designed tofacilitate the user in specifying the minimal required parameters to setup a networkand run experiments of varying complexity and magnitude. NetSpec is used toconduct the experiments of the PNNI Simulator/Emulator. However, in an effort toreduce the complexity of the scripts, this tool provides a wrapper that takes a simplescript and creates a NetSpec script containing all the additional required information.
To perform emulation, NetSpec is used to distribute the experiment to a specifiedpool of workstations. NetSpec use a control daemon to communicate with PNNIslave daemon processes on target workstations, providing each of them with anindividual script containing information about the network to be setup. Uponcompletion, all the PNNI daemons report the experimentation results to the controldaemon at the main workstation, which are printed on the console.
NetSpec User Manual Page 55
Input Script
WrapNetSpec()
…
EmulateNetwork()EmulateNetwork()
EmulateNetwork()
Figure 5 Architecture of a PNNI Emulation
4.5.2 NetSpec Script
The cluster keyword tells NetSpec that the end points enclosed should execute in parallel,but are also somehow related to each other. The pnnid keyword tells NetSpec whichdaemon to contact. Following pnni is the workstation on which the daemon is to becontacted and after the colon is the TCP port on which to contact it. The informationbetween the braces following the port number is the information that NetSpec will parsefor conformity with its requirements and pass along to the daemon.
NetSpec is thus invoked and furnished the script produced by the wrapper. NetSpeccontacts the PNNI daemons on the specified hosts and passes them the relevant portion ofthe script. A PNNI daemon, like any other NetSpec daemon is responsible for parsing theinformation that the control daemon gives it.
Each pnni daemon then begins to run its part of the experiment. It first forks off a childprocess for each virtual node and then for each virtual host on its machine. The parentthen waits for its children to finish. Each child then goes on to link itself with the nodesor hosts with which it is supposed to connect and the experiment proceeds over TCPsockets and in real time.
NetSpec
PNNIDaemonHost 1
PNNIDaemonHost 2
PNNIDaemonHost N
NetSpec User Manual Page 56
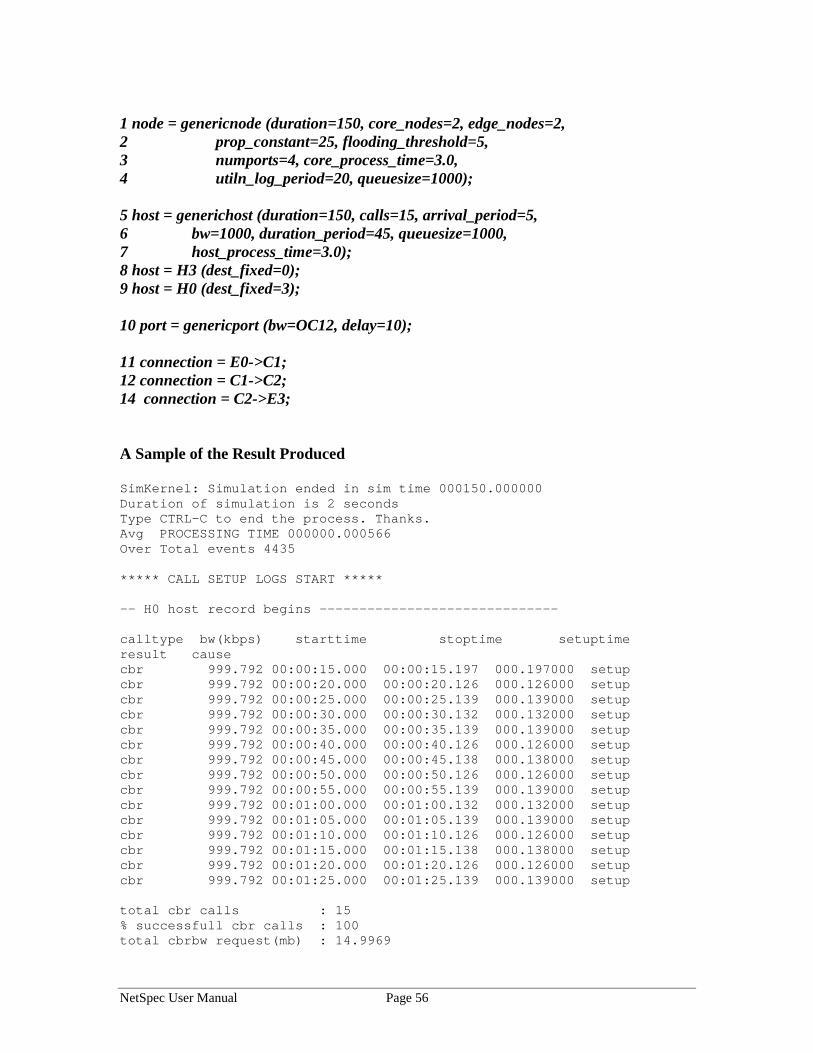
1 node = genericnode (duration=150, core_nodes=2, edge_nodes=2,2 prop_constant=25, flooding_threshold=5,3 numports=4, core_process_time=3.0,4 utiln_log_period=20, queuesize=1000);
5 host = generichost (duration=150, calls=15, arrival_period=5,6 bw=1000, duration_period=45, queuesize=1000,7 host_process_time=3.0);8 host = H3 (dest_fixed=0);9 host = H0 (dest_fixed=3);
10 port = genericport (bw=OC12, delay=10);
11 connection = E0->C1;12 connection = C1->C2;14 connection = C2->E3;
A Sample of the Result Produced
SimKernel: Simulation ended in sim time 000150.000000Duration of simulation is 2 secondsType CTRL-C to end the process. Thanks.Avg PROCESSING TIME 000000.000566Over Total events 4435
***** CALL SETUP LOGS START *****
-- H0 host record begins ------------------------------
calltype bw(kbps) starttime stoptime setuptimeresult causecbr 999.792 00:00:15.000 00:00:15.197 000.197000 setupcbr 999.792 00:00:20.000 00:00:20.126 000.126000 setupcbr 999.792 00:00:25.000 00:00:25.139 000.139000 setupcbr 999.792 00:00:30.000 00:00:30.132 000.132000 setupcbr 999.792 00:00:35.000 00:00:35.139 000.139000 setup cbr 999.792 00:00:40.000 00:00:40.126 000.126000 setupcbr 999.792 00:00:45.000 00:00:45.138 000.138000 setupcbr 999.792 00:00:50.000 00:00:50.126 000.126000 setupcbr 999.792 00:00:55.000 00:00:55.139 000.139000 setupcbr 999.792 00:01:00.000 00:01:00.132 000.132000 setupcbr 999.792 00:01:05.000 00:01:05.139 000.139000 setupcbr 999.792 00:01:10.000 00:01:10.126 000.126000 setupcbr 999.792 00:01:15.000 00:01:15.138 000.138000 setupcbr 999.792 00:01:20.000 00:01:20.126 000.126000 setupcbr 999.792 00:01:25.000 00:01:25.139 000.139000 setup
total cbr calls : 15% successfull cbr calls : 100total cbrbw request(mb) : 14.9969
NetSpec User Manual Page 57
cbrbwrej(mb) : 0mean callsetup time : 000.137466
-- H0 host record ends --------------------------------
-- H3 host record begins ------------------------------
calltype bw(kbps) starttime stoptime setuptimeresult causecbr 999.792 00:00:15.000 00:00:15.198 000.198000 setupcbr 999.792 00:00:20.000 00:00:20.126 000.126000 setupcbr 999.792 00:00:25.000 00:00:25.139 000.139000 setupcbr 999.792 00:00:30.000 00:00:30.132 000.132000 setupcbr 999.792 00:00:35.000 00:00:35.139 000.139000 setupcbr 999.792 00:00:40.000 00:00:40.126 000.126000 setupcbr 999.792 00:00:45.000 00:00:45.138 000.138000 setupcbr 999.792 00:00:50.000 00:00:50.126 000.126000 setupcbr 999.792 00:00:55.000 00:00:55.139 000.139000 setupcbr 999.792 00:01:00.000 00:01:00.132 000.132000 setup
total cbr calls : 15% successfull cbr calls : 100total cbrbw request(mb) : 14.9969cbrbwrej(mb) : 0mean callsetup time : 000.137533
-- H3 host record ends --------------------------------
AVG RESULTS OF ALL CALLS
total cbr calls : 30% successfull cbr calls : 100total cbrbw request(mb) : 29.9938cbrbwrej(mb) : 0mean callsetup time : 000.137500
***** CALL SETUP LOGS END *****
##### NODE INSTRUMENTATION LOGS START #####
-- C1 node record begins ------------------------------
convergence time : 000000.140000
…
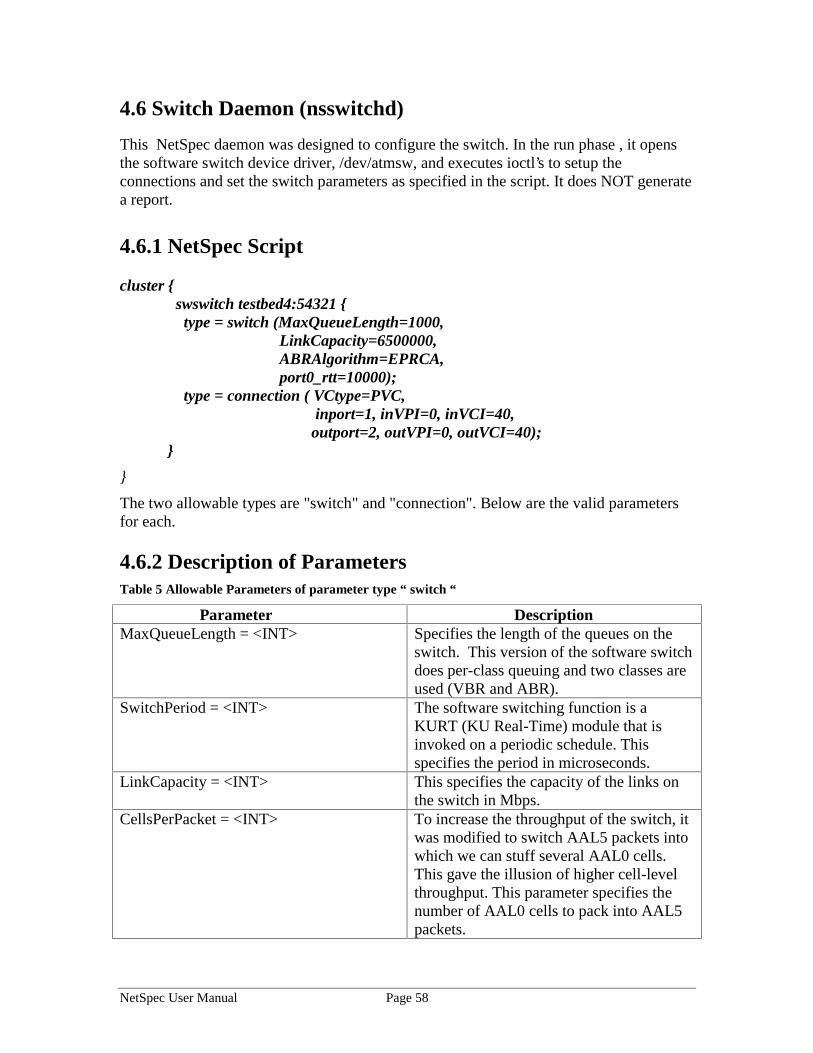
NetSpec User Manual Page 58
4.6 Switch Daemon (nsswitchd)
This NetSpec daemon was designed to configure the switch. In the run phase , it opensthe software switch device driver, /dev/atmsw, and executes ioctl’s to setup theconnections and set the switch parameters as specified in the script. It does NOT generatea report.
4.6.1 NetSpec Script
cluster { swswitch testbed4:54321 { type = switch (MaxQueueLength=1000,
LinkCapacity=6500000, ABRAlgorithm=EPRCA, port0_rtt=10000);
type = connection ( VCtype=PVC, inport=1, inVPI=0, inVCI=40,
outport=2, outVPI=0, outVCI=40); }
}
The two allowable types are "switch" and "connection". Below are the valid parametersfor each.
4.6.2 Description of ParametersTable 5 Allowable Parameters of parameter type “ switch “
Parameter DescriptionMaxQueueLength = <INT> Specifies the length of the queues on the
switch. This version of the software switchdoes per-class queuing and two classes areused (VBR and ABR).
SwitchPeriod = <INT> The software switching function is aKURT (KU Real-Time) module that isinvoked on a periodic schedule. Thisspecifies the period in microseconds.
LinkCapacity = <INT> This specifies the capacity of the links onthe switch in Mbps.
CellsPerPacket = <INT> To increase the throughput of the switch, itwas modified to switch AAL5 packets intowhich we can stuff several AAL0 cells.This gave the illusion of higher cell-levelthroughput. This parameter specifies thenumber of AAL0 cells to pack into AAL5packets.
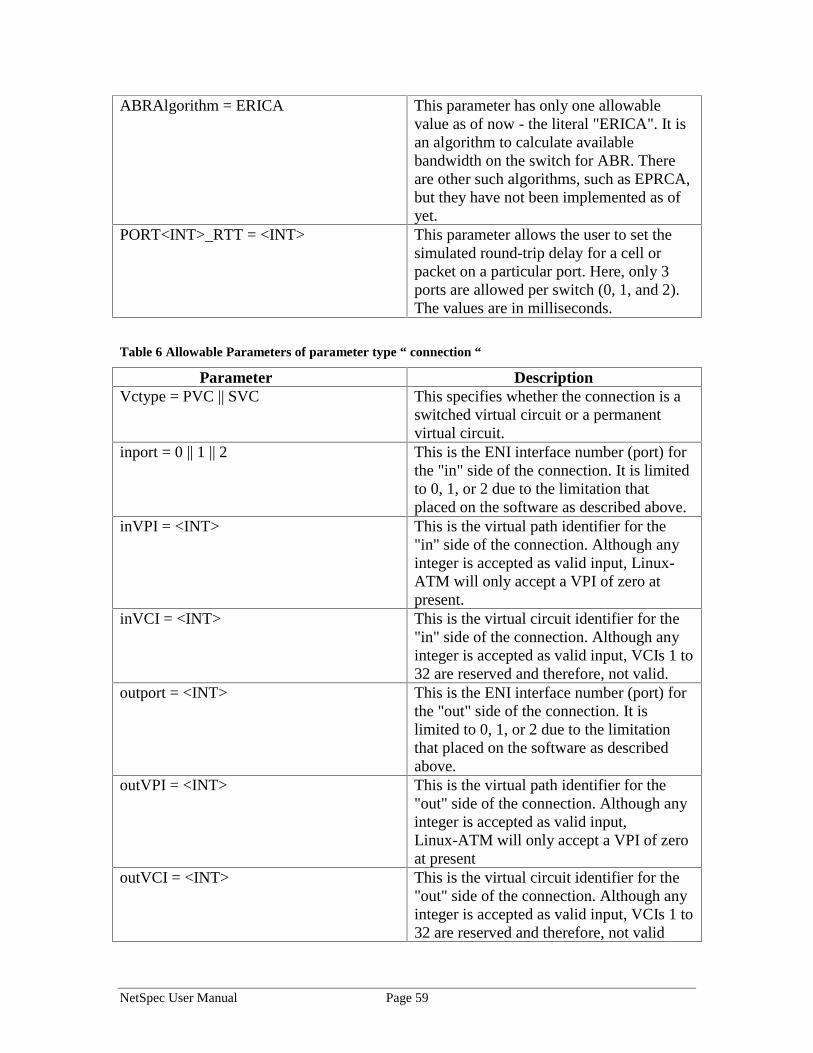
NetSpec User Manual Page 59
ABRAlgorithm = ERICA This parameter has only one allowablevalue as of now - the literal "ERICA". It isan algorithm to calculate availablebandwidth on the switch for ABR. Thereare other such algorithms, such as EPRCA,but they have not been implemented as ofyet.
PORT<INT>_RTT = <INT> This parameter allows the user to set thesimulated round-trip delay for a cell orpacket on a particular port. Here, only 3ports are allowed per switch (0, 1, and 2).The values are in milliseconds.
Table 6 Allowable Parameters of parameter type “ connection “
Parameter DescriptionVctype = PVC || SVC This specifies whether the connection is a
switched virtual circuit or a permanentvirtual circuit.
inport = 0 || 1 || 2 This is the ENI interface number (port) forthe "in" side of the connection. It is limitedto 0, 1, or 2 due to the limitation thatplaced on the software as described above.
inVPI = <INT> This is the virtual path identifier for the"in" side of the connection. Although anyinteger is accepted as valid input, Linux-ATM will only accept a VPI of zero atpresent.
inVCI = <INT> This is the virtual circuit identifier for the"in" side of the connection. Although anyinteger is accepted as valid input, VCIs 1 to32 are reserved and therefore, not valid.
outport = <INT> This is the ENI interface number (port) forthe "out" side of the connection. It islimited to 0, 1, or 2 due to the limitationthat placed on the software as describedabove.
outVPI = <INT> This is the virtual path identifier for the"out" side of the connection. Although anyinteger is accepted as valid input,Linux-ATM will only accept a VPI of zeroat present
outVCI = <INT> This is the virtual circuit identifier for the"out" side of the connection. Although anyinteger is accepted as valid input, VCIs 1 to32 are reserved and therefore, not valid

NetSpec User Manual Page 60
ALL of these parameters are REQUIRED to setup a connection and they are expected inthe order presented, separated by commas as in the example script.
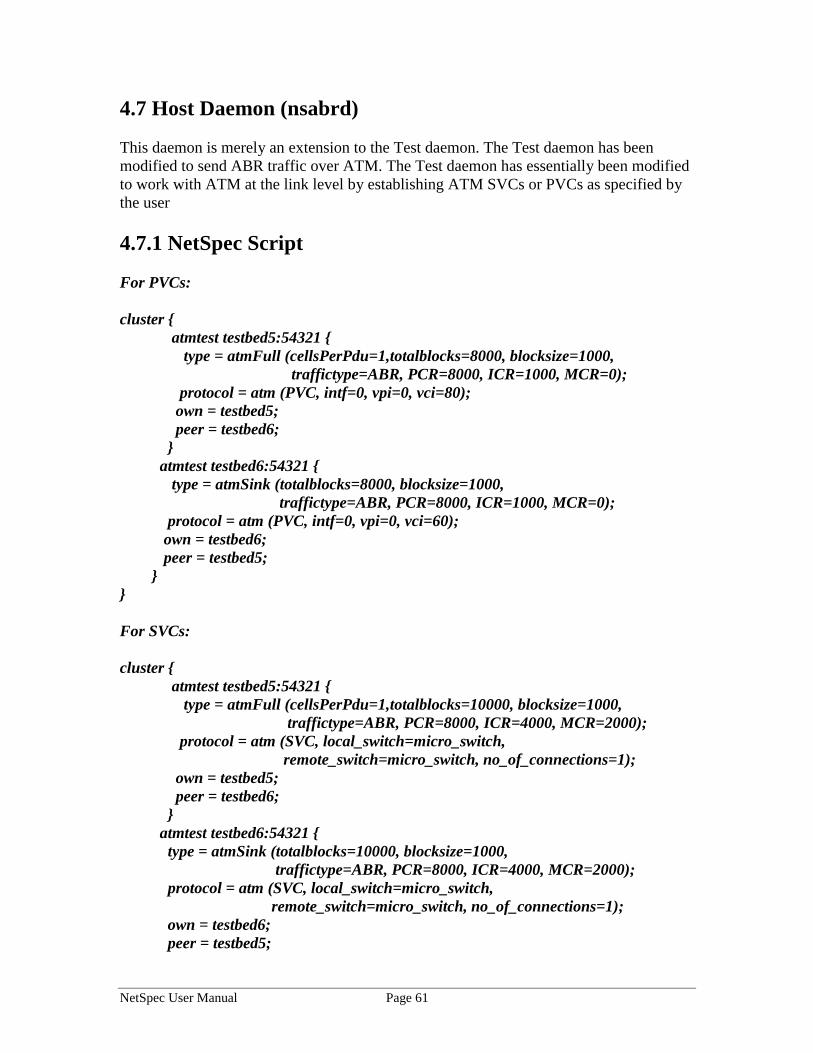
NetSpec User Manual Page 61
4.7 Host Daemon (nsabrd)
This daemon is merely an extension to the Test daemon. The Test daemon has beenmodified to send ABR traffic over ATM. The Test daemon has essentially been modifiedto work with ATM at the link level by establishing ATM SVCs or PVCs as specified bythe user
4.7.1 NetSpec Script
For PVCs:
cluster { atmtest testbed5:54321 {
type = atmFull (cellsPerPdu=1,totalblocks=8000, blocksize=1000, traffictype=ABR, PCR=8000, ICR=1000, MCR=0);
protocol = atm (PVC, intf=0, vpi=0, vci=80); own = testbed5; peer = testbed6;
} atmtest testbed6:54321 { type = atmSink (totalblocks=8000, blocksize=1000, traffictype=ABR, PCR=8000, ICR=1000, MCR=0);
protocol = atm (PVC, intf=0, vpi=0, vci=60); own = testbed6; peer = testbed5; }}
For SVCs:
cluster { atmtest testbed5:54321 {
type = atmFull (cellsPerPdu=1,totalblocks=10000, blocksize=1000, traffictype=ABR, PCR=8000, ICR=4000, MCR=2000);
protocol = atm (SVC, local_switch=micro_switch, remote_switch=micro_switch, no_of_connections=1);
own = testbed5; peer = testbed6;
} atmtest testbed6:54321 {
type = atmSink (totalblocks=10000, blocksize=1000, traffictype=ABR, PCR=8000, ICR=4000, MCR=2000);
protocol = atm (SVC, local_switch=micro_switch, remote_switch=micro_switch, no_of_connections=1); own = testbed6;
peer = testbed5;
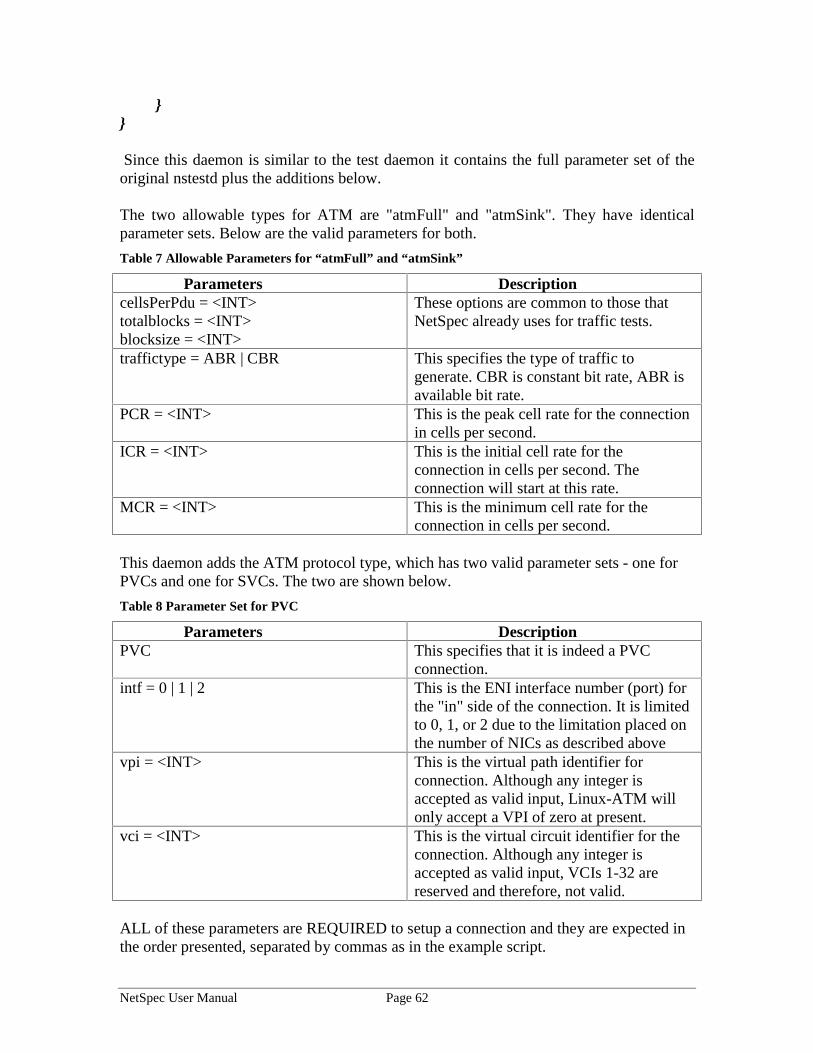
NetSpec User Manual Page 62
}}
Since this daemon is similar to the test daemon it contains the full parameter set of theoriginal nstestd plus the additions below.
The two allowable types for ATM are "atmFull" and "atmSink". They have identicalparameter sets. Below are the valid parameters for both.
Table 7 Allowable Parameters for “atmFull” and “atmSink”
Parameters DescriptioncellsPerPdu = <INT>totalblocks = <INT>blocksize = <INT>
These options are common to those thatNetSpec already uses for traffic tests.
traffictype = ABR | CBR This specifies the type of traffic togenerate. CBR is constant bit rate, ABR isavailable bit rate.
PCR = <INT> This is the peak cell rate for the connectionin cells per second.
ICR = <INT> This is the initial cell rate for theconnection in cells per second. Theconnection will start at this rate.
MCR = <INT> This is the minimum cell rate for theconnection in cells per second.
This daemon adds the ATM protocol type, which has two valid parameter sets - one forPVCs and one for SVCs. The two are shown below.
Table 8 Parameter Set for PVC
Parameters DescriptionPVC This specifies that it is indeed a PVC
connection.intf = 0 | 1 | 2 This is the ENI interface number (port) for
the "in" side of the connection. It is limitedto 0, 1, or 2 due to the limitation placed onthe number of NICs as described above
vpi = <INT> This is the virtual path identifier forconnection. Although any integer isaccepted as valid input, Linux-ATM willonly accept a VPI of zero at present.
vci = <INT> This is the virtual circuit identifier for theconnection. Although any integer isaccepted as valid input, VCIs 1-32 arereserved and therefore, not valid.
ALL of these parameters are REQUIRED to setup a connection and they are expected inthe order presented, separated by commas as in the example script.
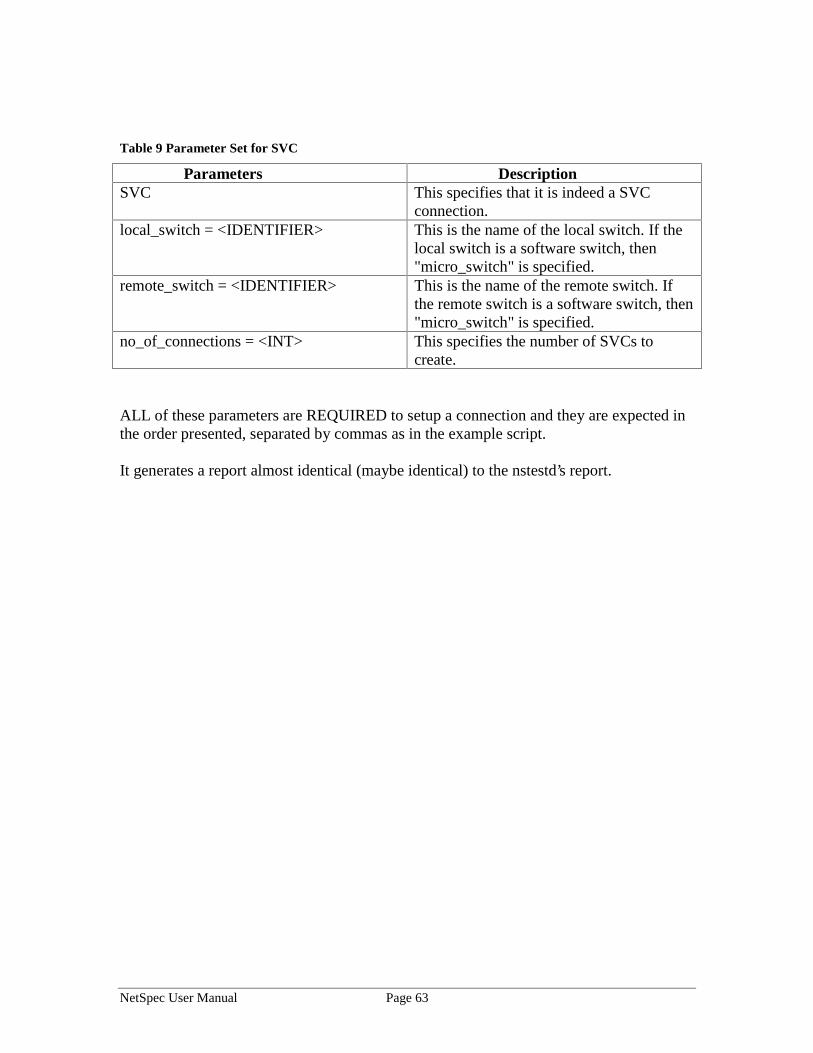
NetSpec User Manual Page 63
Table 9 Parameter Set for SVC
Parameters DescriptionSVC This specifies that it is indeed a SVC
connection.local_switch = <IDENTIFIER> This is the name of the local switch. If the
local switch is a software switch, then"micro_switch" is specified.
remote_switch = <IDENTIFIER> This is the name of the remote switch. Ifthe remote switch is a software switch, then"micro_switch" is specified.
no_of_connections = <INT> This specifies the number of SVCs tocreate.
ALL of these parameters are REQUIRED to setup a connection and they are expected inthe order presented, separated by commas as in the example script.
It generates a report almost identical (maybe identical) to the nstestd’s report.
NetSpec User Manual Page 64
5.0 Appendix
5.1 Installation of NetSpec
Copy the files from the tar supplied netspec/bin directory into /usr/local/bin. (You maychange this location if you prefer. If you change locations, then you will need to edit thesupplied netspec.conf file and modify the inetd.conf and services line additions asnecessary).
Copy netspec.conf into /etc.
NetSpec can be installed in either of the two ways described below :
5.1.1 inetd Installation
Edit /etc/services and add the following line:
netspec 42003/tcp # NetSpec Daemon
and then add the following line to /etc/inetd.conf:
netspec stream tcp nowait root /usr/local/bin/netspecd netspecd
Finally, you have to reinitialize inetd, so determine the process id of inetd ("ps axuw |grep inetd" on BSD-ish stuff, "ps -elf | grep inetd" on systemV-ish) and performa "kill -1" on this process. You might choose to install the daemons owned by nobody,but this restricts certain options such as changing MTU sizes.
5.1.2 Standalone Installation (i.e. you don’t have root access)
Place the executables at the destination of your choice, add them to your pathenvironment variable for ease of use, or cd to the dir and execute netspecd with the"-s" option on all the machines that are being used for the test. This will start the daemonin standalone mode. Every time the systems reboot you will need to restartthem. In case you don’t have access to /etc, you can alternatively specify the -c option tonetspecd. All daemons have a help function, namely -h.
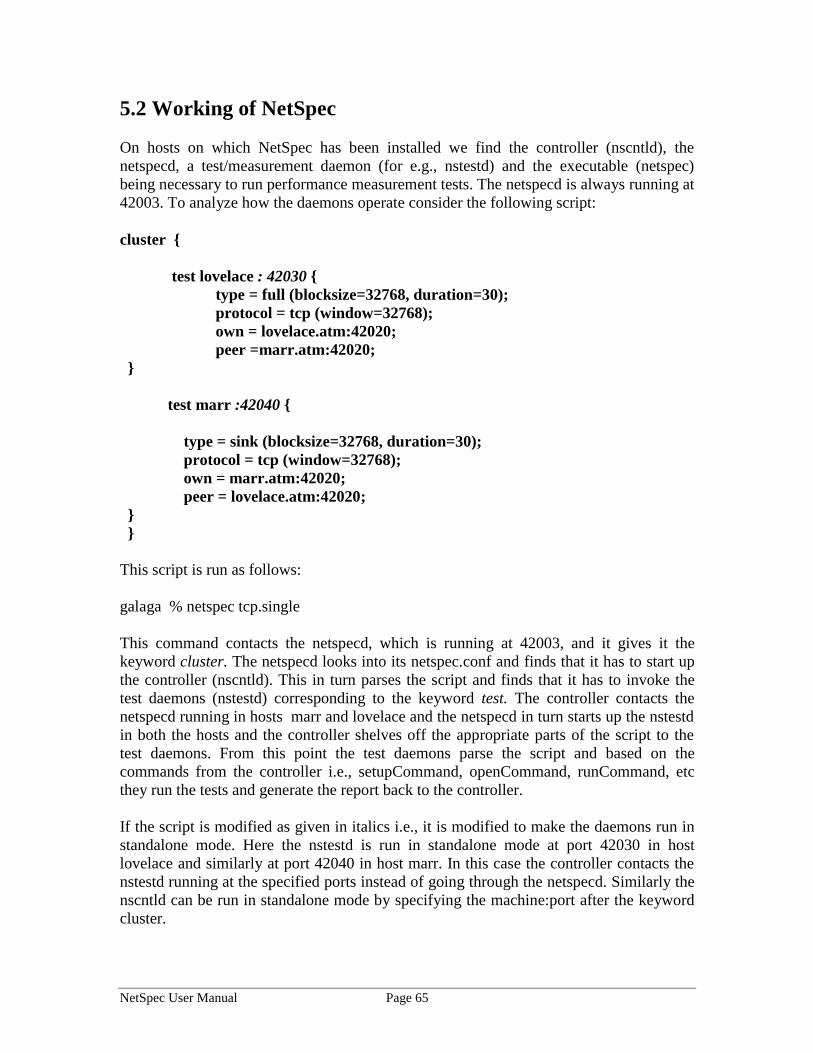
NetSpec User Manual Page 65
5.2 Working of NetSpec
On hosts on which NetSpec has been installed we find the controller (nscntld), thenetspecd, a test/measurement daemon (for e.g., nstestd) and the executable (netspec)being necessary to run performance measurement tests. The netspecd is always running at42003. To analyze how the daemons operate consider the following script:
cluster {
test lovelace : 42030 {type = full (blocksize=32768, duration=30);protocol = tcp (window=32768);own = lovelace.atm:42020;peer =marr.atm:42020;
}
test marr :42040 {
type = sink (blocksize=32768, duration=30); protocol = tcp (window=32768); own = marr.atm:42020; peer = lovelace.atm:42020;
} }
This script is run as follows:
galaga % netspec tcp.single
This command contacts the netspecd, which is running at 42003, and it gives it thekeyword cluster. The netspecd looks into its netspec.conf and finds that it has to start upthe controller (nscntld). This in turn parses the script and finds that it has to invoke thetest daemons (nstestd) corresponding to the keyword test. The controller contacts thenetspecd running in hosts marr and lovelace and the netspecd in turn starts up the nstestdin both the hosts and the controller shelves off the appropriate parts of the script to thetest daemons. From this point the test daemons parse the script and based on thecommands from the controller i.e., setupCommand, openCommand, runCommand, etcthey run the tests and generate the report back to the controller.
If the script is modified as given in italics i.e., it is modified to make the daemons run instandalone mode. Here the nstestd is run in standalone mode at port 42030 in hostlovelace and similarly at port 42040 in host marr. In this case the controller contacts thenstestd running at the specified ports instead of going through the netspecd. Similarly thenscntld can be run in standalone mode by specifying the machine:port after the keywordcluster.
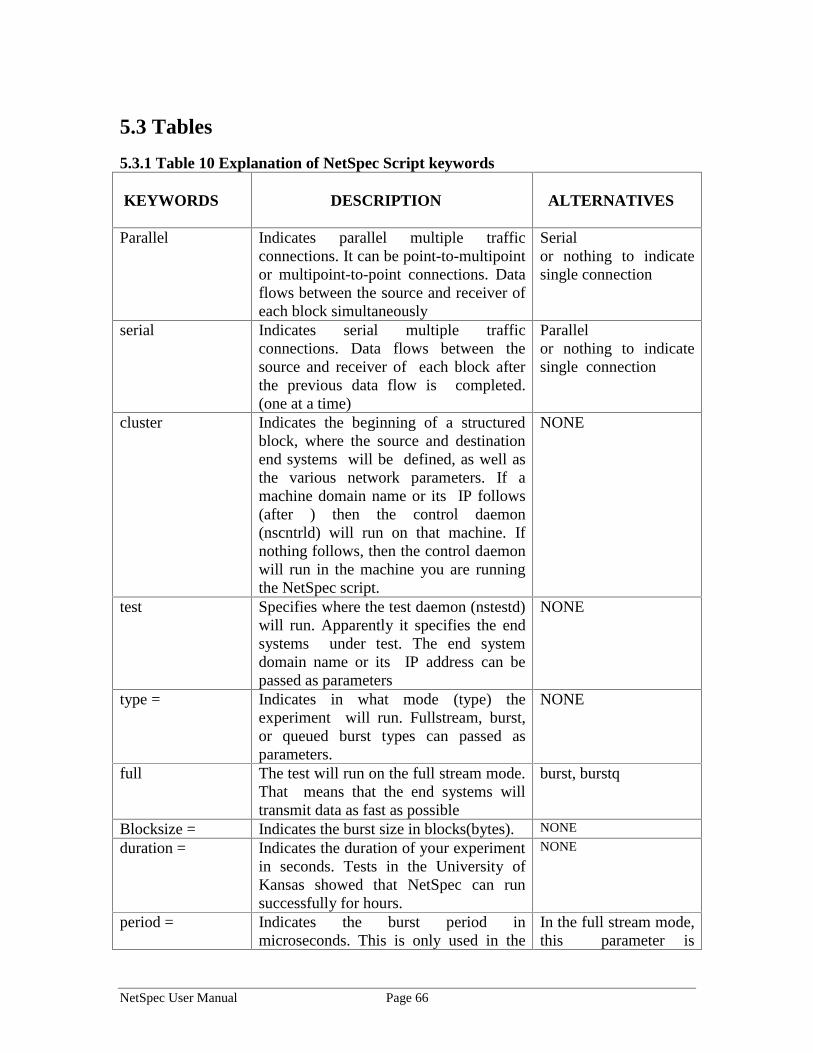
NetSpec User Manual Page 66
5.3 Tables
5.3.1 Table 10 Explanation of NetSpec Script keywords
KEYWORDS DESCRIPTION ALTERNATIVES
Parallel Indicates parallel multiple trafficconnections. It can be point-to-multipointor multipoint-to-point connections. Dataflows between the source and receiver ofeach block simultaneously
Serialor nothing to indicatesingle connection
serial Indicates serial multiple trafficconnections. Data flows between thesource and receiver of each block afterthe previous data flow is completed.(one at a time)
Parallelor nothing to indicatesingle connection
cluster Indicates the beginning of a structuredblock, where the source and destinationend systems will be defined, as well asthe various network parameters. If amachine domain name or its IP follows(after ) then the control daemon(nscntrld) will run on that machine. Ifnothing follows, then the control daemonwill run in the machine you are runningthe NetSpec script.
NONE
test Specifies where the test daemon (nstestd)will run. Apparently it specifies the endsystems under test. The end systemdomain name or its IP address can bepassed as parameters
NONE
type = Indicates in what mode (type) theexperiment will run. Fullstream, burst,or queued burst types can passed asparameters.
NONE
full The test will run on the full stream mode.That means that the end systems willtransmit data as fast as possible
burst, burstq
Blocksize = Indicates the burst size in blocks(bytes). NONE
duration = Indicates the duration of your experimentin seconds. Tests in the University ofKansas showed that NetSpec can runsuccessfully for hours.
NONE
period = Indicates the burst period inmicroseconds. This is only used in the
In the full stream mode,this parameter is
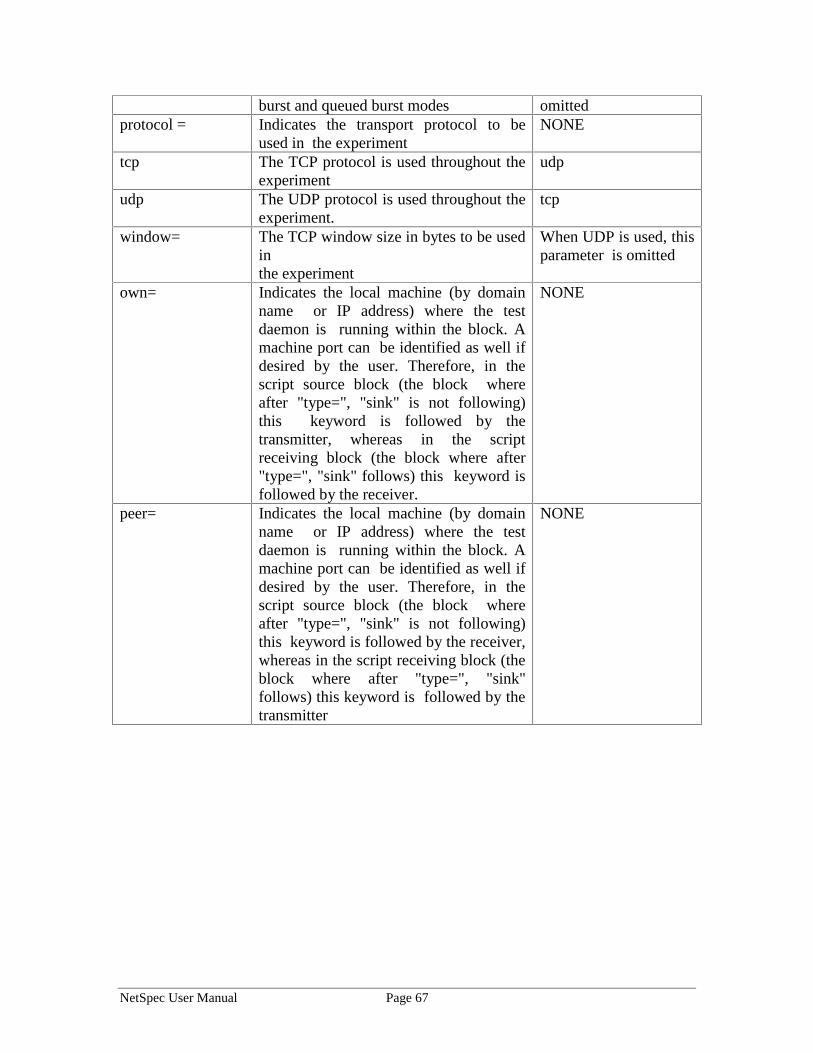
NetSpec User Manual Page 67
burst and queued burst modes omittedprotocol = Indicates the transport protocol to be
used in the experimentNONE
tcp The TCP protocol is used throughout theexperiment
udp
udp The UDP protocol is used throughout theexperiment.
tcp
window= The TCP window size in bytes to be usedinthe experiment
When UDP is used, thisparameter is omitted
own= Indicates the local machine (by domainname or IP address) where the testdaemon is running within the block. Amachine port can be identified as well ifdesired by the user. Therefore, in thescript source block (the block whereafter "type=", "sink" is not following)this keyword is followed by thetransmitter, whereas in the scriptreceiving block (the block where after"type=", "sink" follows) this keyword isfollowed by the receiver.
NONE
peer= Indicates the local machine (by domainname or IP address) where the testdaemon is running within the block. Amachine port can be identified as well ifdesired by the user. Therefore, in thescript source block (the block whereafter "type=", "sink" is not following)this keyword is followed by the receiver,whereas in the script receiving block (theblock where after "type=", "sink"follows) this keyword is followed by thetransmitter
NONE
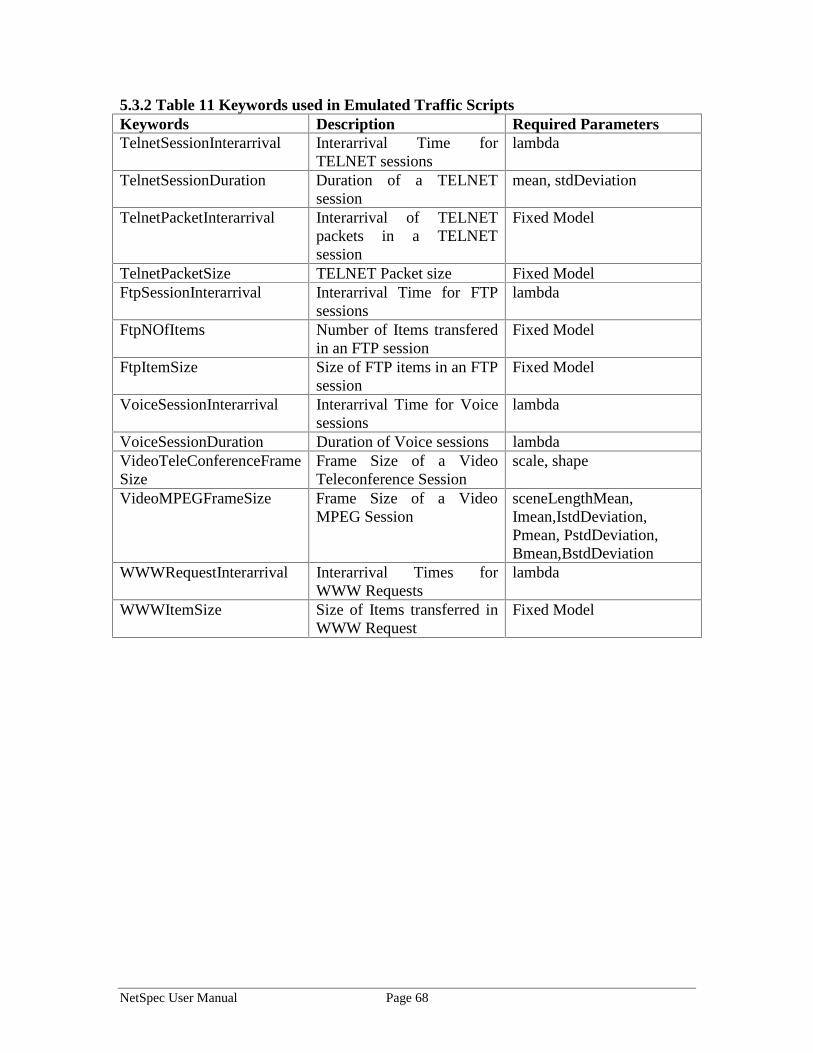
NetSpec User Manual Page 68
5.3.2 Table 11 Keywords used in Emulated Traffic ScriptsKeywords Description Required ParametersTelnetSessionInterarrival Interarrival Time for
TELNET sessionslambda
TelnetSessionDuration Duration of a TELNETsession
mean, stdDeviation
TelnetPacketInterarrival Interarrival of TELNETpackets in a TELNETsession
Fixed Model
TelnetPacketSize TELNET Packet size Fixed ModelFtpSessionInterarrival Interarrival Time for FTP
sessionslambda
FtpNOfItems Number of Items transferedin an FTP session
Fixed Model
FtpItemSize Size of FTP items in an FTPsession
Fixed Model
VoiceSessionInterarrival Interarrival Time for Voicesessions
lambda
VoiceSessionDuration Duration of Voice sessions lambdaVideoTeleConferenceFrameSize
Frame Size of a VideoTeleconference Session
scale, shape
VideoMPEGFrameSize Frame Size of a VideoMPEG Session
sceneLengthMean,Imean,IstdDeviation,Pmean, PstdDeviation,Bmean,BstdDeviation
WWWRequestInterarrival Interarrival Times forWWW Requests
lambda
WWWItemSize Size of Items transferred inWWW Request
Fixed Model

NetSpec User Manual Page 69
6.0 Bibliography
[1] Roelof J.T. Jonkman. NetSpec: Philosophy, Design and Implementation. Master’s Thesis, University of Kansas, Informations and Telecommunications Sciences Laboratory.
[2]Beng-Ong Lee. Wide Area ATM network experiments using Emulated Traffic sources. Master’s Thesis, University of Kansas, January 1998
[3]Anil Gopinath. Performance Measurement and Analysis of Real-Time CORBA Endsystems, Master’s Thesis, University of Kansas.