Embed Size (px)
Citation preview
Netatmo User ManualAn interactive version of this manual is embedded in your Netatmo iPhone/iPad/Android
application. It is also available at http://my.netatmo.com on your personal account.
Netatmo Weather Station NWS01. Version 1 / May 2012
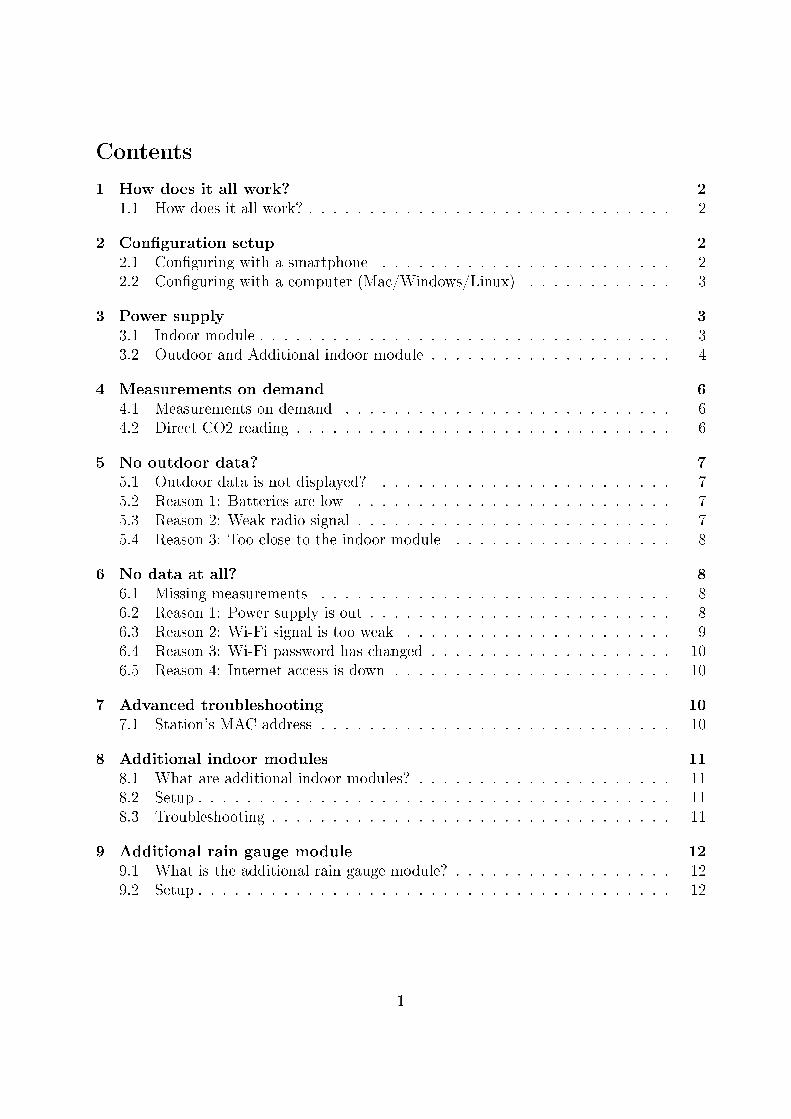
Contents
1 How does it all work? 21.1 How does it all work? . . . . . . . . . . . . . . . . . . . . . . . . . . . . . . 2
2 Con�guration setup 22.1 Con�guring with a smartphone . . . . . . . . . . . . . . . . . . . . . . . . 22.2 Con�guring with a computer (Mac/Windows/Linux) . . . . . . . . . . . . 3
3 Power supply 33.1 Indoor module . . . . . . . . . . . . . . . . . . . . . . . . . . . . . . . . . . 33.2 Outdoor and Additional indoor module . . . . . . . . . . . . . . . . . . . . 4
4 Measurements on demand 64.1 Measurements on demand . . . . . . . . . . . . . . . . . . . . . . . . . . . 64.2 Direct CO2 reading . . . . . . . . . . . . . . . . . . . . . . . . . . . . . . . 6
5 No outdoor data? 75.1 Outdoor data is not displayed? . . . . . . . . . . . . . . . . . . . . . . . . 75.2 Reason 1: Batteries are low . . . . . . . . . . . . . . . . . . . . . . . . . . 75.3 Reason 2: Weak radio signal . . . . . . . . . . . . . . . . . . . . . . . . . . 75.4 Reason 3: Too close to the indoor module . . . . . . . . . . . . . . . . . . 8
6 No data at all? 86.1 Missing measurements . . . . . . . . . . . . . . . . . . . . . . . . . . . . . 86.2 Reason 1: Power supply is out . . . . . . . . . . . . . . . . . . . . . . . . . 86.3 Reason 2: Wi-Fi signal is too weak . . . . . . . . . . . . . . . . . . . . . . 96.4 Reason 3: Wi-Fi password has changed . . . . . . . . . . . . . . . . . . . . 106.5 Reason 4: Internet access is down . . . . . . . . . . . . . . . . . . . . . . . 10
7 Advanced troubleshooting 107.1 Station's MAC address . . . . . . . . . . . . . . . . . . . . . . . . . . . . . 10
8 Additional indoor modules 118.1 What are additional indoor modules? . . . . . . . . . . . . . . . . . . . . . 118.2 Setup . . . . . . . . . . . . . . . . . . . . . . . . . . . . . . . . . . . . . . . 118.3 Troubleshooting . . . . . . . . . . . . . . . . . . . . . . . . . . . . . . . . . 11
9 Additional rain gauge module 129.1 What is the additional rain gauge module? . . . . . . . . . . . . . . . . . . 129.2 Setup . . . . . . . . . . . . . . . . . . . . . . . . . . . . . . . . . . . . . . . 12
1
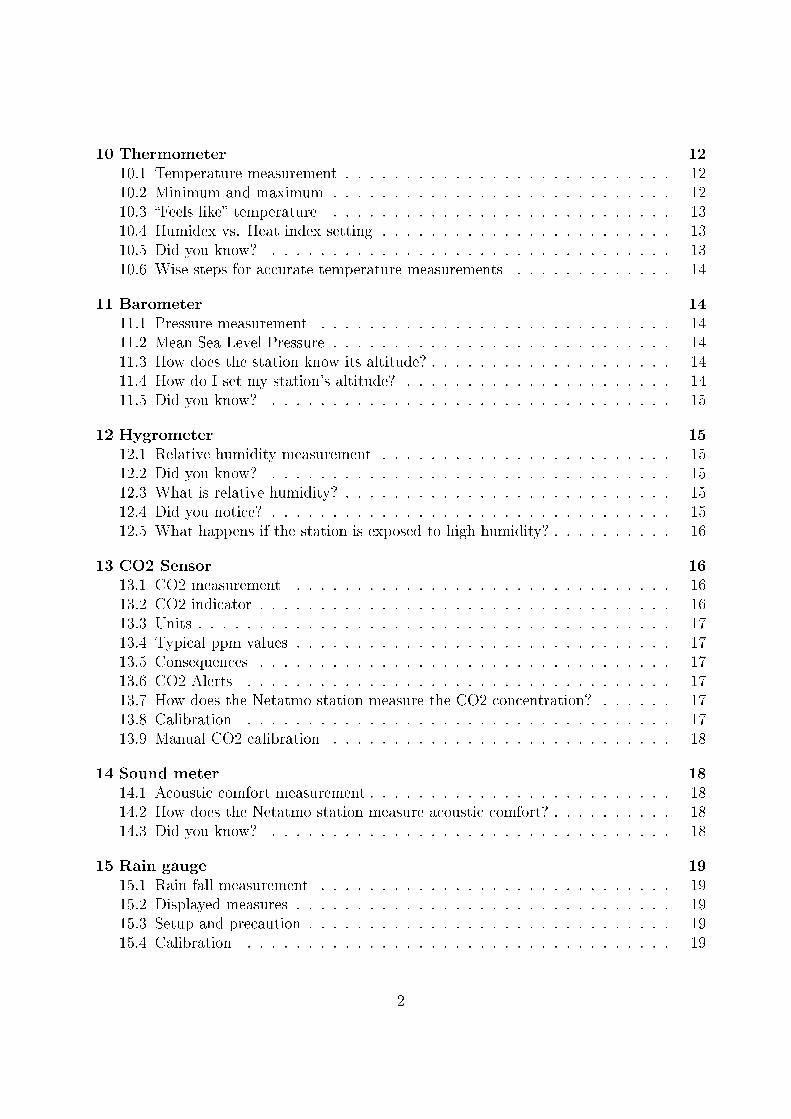
10 Thermometer 1210.1 Temperature measurement . . . . . . . . . . . . . . . . . . . . . . . . . . . 1210.2 Minimum and maximum . . . . . . . . . . . . . . . . . . . . . . . . . . . . 1210.3 �Feels like� temperature . . . . . . . . . . . . . . . . . . . . . . . . . . . . 1310.4 Humidex vs. Heat index setting . . . . . . . . . . . . . . . . . . . . . . . . 1310.5 Did you know? . . . . . . . . . . . . . . . . . . . . . . . . . . . . . . . . . 1310.6 Wise steps for accurate temperature measurements . . . . . . . . . . . . . 14
11 Barometer 1411.1 Pressure measurement . . . . . . . . . . . . . . . . . . . . . . . . . . . . . 1411.2 Mean Sea Level Pressure . . . . . . . . . . . . . . . . . . . . . . . . . . . . 1411.3 How does the station know its altitude? . . . . . . . . . . . . . . . . . . . . 1411.4 How do I set my station's altitude? . . . . . . . . . . . . . . . . . . . . . . 1411.5 Did you know? . . . . . . . . . . . . . . . . . . . . . . . . . . . . . . . . . 15
12 Hygrometer 1512.1 Relative humidity measurement . . . . . . . . . . . . . . . . . . . . . . . . 1512.2 Did you know? . . . . . . . . . . . . . . . . . . . . . . . . . . . . . . . . . 1512.3 What is relative humidity? . . . . . . . . . . . . . . . . . . . . . . . . . . . 1512.4 Did you notice? . . . . . . . . . . . . . . . . . . . . . . . . . . . . . . . . . 1512.5 What happens if the station is exposed to high humidity? . . . . . . . . . . 16
13 CO2 Sensor 1613.1 CO2 measurement . . . . . . . . . . . . . . . . . . . . . . . . . . . . . . . 1613.2 CO2 indicator . . . . . . . . . . . . . . . . . . . . . . . . . . . . . . . . . . 1613.3 Units . . . . . . . . . . . . . . . . . . . . . . . . . . . . . . . . . . . . . . . 1713.4 Typical ppm values . . . . . . . . . . . . . . . . . . . . . . . . . . . . . . . 1713.5 Consequences . . . . . . . . . . . . . . . . . . . . . . . . . . . . . . . . . . 1713.6 CO2 Alerts . . . . . . . . . . . . . . . . . . . . . . . . . . . . . . . . . . . 1713.7 How does the Netatmo station measure the CO2 concentration? . . . . . . 1713.8 Calibration . . . . . . . . . . . . . . . . . . . . . . . . . . . . . . . . . . . 1713.9 Manual CO2 calibration . . . . . . . . . . . . . . . . . . . . . . . . . . . . 18
14 Sound meter 1814.1 Acoustic comfort measurement . . . . . . . . . . . . . . . . . . . . . . . . . 1814.2 How does the Netatmo station measure acoustic comfort? . . . . . . . . . . 1814.3 Did you know? . . . . . . . . . . . . . . . . . . . . . . . . . . . . . . . . . 18
15 Rain gauge 1915.1 Rain fall measurement . . . . . . . . . . . . . . . . . . . . . . . . . . . . . 1915.2 Displayed measures . . . . . . . . . . . . . . . . . . . . . . . . . . . . . . . 1915.3 Setup and precaution . . . . . . . . . . . . . . . . . . . . . . . . . . . . . . 1915.4 Calibration . . . . . . . . . . . . . . . . . . . . . . . . . . . . . . . . . . . 19
2
16 Current weather conditions 1916.1 Current weather icon . . . . . . . . . . . . . . . . . . . . . . . . . . . . . . 19
17 7-day forecast 2017.1 Forecast . . . . . . . . . . . . . . . . . . . . . . . . . . . . . . . . . . . . . 2017.2 Summary mode . . . . . . . . . . . . . . . . . . . . . . . . . . . . . . . . . 2017.3 Temperature mode . . . . . . . . . . . . . . . . . . . . . . . . . . . . . . . 2117.4 Rain mode . . . . . . . . . . . . . . . . . . . . . . . . . . . . . . . . . . . . 21
18 Indoor comfort 2218.1 Indoor comfort index . . . . . . . . . . . . . . . . . . . . . . . . . . . . . . 2218.2 Complementary information available on the mobile app . . . . . . . . . . 2218.3 Indoor comfort index . . . . . . . . . . . . . . . . . . . . . . . . . . . . . . 22
19 Noti�cations 2319.1 What are noti�cations? . . . . . . . . . . . . . . . . . . . . . . . . . . . . . 2319.2 Personalized noti�cations . . . . . . . . . . . . . . . . . . . . . . . . . . . . 2319.3 CO2 noti�cations (default) . . . . . . . . . . . . . . . . . . . . . . . . . . . 2319.4 Freezing noti�cation (default) . . . . . . . . . . . . . . . . . . . . . . . . . 2319.5 Pressure drop noti�cation (default) . . . . . . . . . . . . . . . . . . . . . . 2319.6 Room temperature noti�cations (default) . . . . . . . . . . . . . . . . . . . 2319.7 Humidity noti�cation (default) . . . . . . . . . . . . . . . . . . . . . . . . 2419.8 NOAA Weather Alerts (US) . . . . . . . . . . . . . . . . . . . . . . . . . . 2419.9 MeteoAlarm Weather Alerts (Europe) . . . . . . . . . . . . . . . . . . . . . 24
20 Highlights 2420.1 What are highlights? . . . . . . . . . . . . . . . . . . . . . . . . . . . . . . 2420.2 Example . . . . . . . . . . . . . . . . . . . . . . . . . . . . . . . . . . . . 24
21 Graphs 2421.1 Automated recording . . . . . . . . . . . . . . . . . . . . . . . . . . . . . . 2421.2 Navigating from dashboard to graphs on a smartphone . . . . . . . . . . . 2521.3 Navigating from dashboard to graphs on a tablet . . . . . . . . . . . . . . 2521.4 Showing graphs in the browser app . . . . . . . . . . . . . . . . . . . . . . 26
22 Air Quality (USA) 2722.1 Outdoor air quality index . . . . . . . . . . . . . . . . . . . . . . . . . . . 2722.2 Complementary information available on the mobile app . . . . . . . . . . 2722.3 AQI colors . . . . . . . . . . . . . . . . . . . . . . . . . . . . . . . . . . . . 2822.4 Understanding the AQI . . . . . . . . . . . . . . . . . . . . . . . . . . . . . 2822.5 Where does the outdoor air quality index come from? . . . . . . . . . . . . 29
3
23 Air Quality (Canada) 2923.1 Outdoor: Air Quality Health Index . . . . . . . . . . . . . . . . . . . . . . 2923.2 AQHI colors . . . . . . . . . . . . . . . . . . . . . . . . . . . . . . . . . . . 2923.3 Understanding the AQHI . . . . . . . . . . . . . . . . . . . . . . . . . . . . 2923.4 Where does the AQHI come from? . . . . . . . . . . . . . . . . . . . . . . 30
24 Air Quality (Europe - Citeair) 3024.1 Outdoor air quality: pollution index . . . . . . . . . . . . . . . . . . . . . . 3024.2 Complementary information available on the mobile app . . . . . . . . . . 3024.3 Citeair indices color code scale . . . . . . . . . . . . . . . . . . . . . . . . . 3124.4 Understanding the Citeair indices . . . . . . . . . . . . . . . . . . . . . . . 3124.5 Source and Acknowledgement . . . . . . . . . . . . . . . . . . . . . . . . . 32
25 Air Quality (Europe - Citeair/MACC) 3225.1 Outdoor air quality: pollution index . . . . . . . . . . . . . . . . . . . . . . 3225.2 Complementary information available on the mobile app . . . . . . . . . . 3225.3 CiteAir index color code . . . . . . . . . . . . . . . . . . . . . . . . . . . . 3225.4 Understanding the Citeair index . . . . . . . . . . . . . . . . . . . . . . . . 3325.5 Source and Acknowledgement . . . . . . . . . . . . . . . . . . . . . . . . . 33
26 Air quality (Australia) 3426.1 Outdoor air quality index . . . . . . . . . . . . . . . . . . . . . . . . . . . 3426.2 Complementary information available on the mobile app . . . . . . . . . . 3426.3 Australian AQI Colors . . . . . . . . . . . . . . . . . . . . . . . . . . . . . 3426.4 Understanding the Australian AQI . . . . . . . . . . . . . . . . . . . . . . 3526.5 Where does the Australian AQI come from? . . . . . . . . . . . . . . . . . 35
27 Air Quality (China US embassy) 3527.1 Outdoor air quality index . . . . . . . . . . . . . . . . . . . . . . . . . . . 3527.2 Complementary information available on the mobile app . . . . . . . . . . 3627.3 AQI colors . . . . . . . . . . . . . . . . . . . . . . . . . . . . . . . . . . . . 3627.4 Understanding the AQI . . . . . . . . . . . . . . . . . . . . . . . . . . . . . 3727.5 Where does the outdoor AQI come from? . . . . . . . . . . . . . . . . . . . 37
28 Air Quality (China) 3728.1 Outdoor Air Pollution Index . . . . . . . . . . . . . . . . . . . . . . . . . . 3728.2 Complementary information available on the mobile app . . . . . . . . . . 3728.3 Air pollution colors . . . . . . . . . . . . . . . . . . . . . . . . . . . . . . . 3828.4 Understanding the Air Pollution Index . . . . . . . . . . . . . . . . . . . . 3828.5 Where does the outdoor Air Pollution Index come from? . . . . . . . . . . 39
4
29 Air Quality (Hong Kong) 3929.1 Outdoor Air Pollution Index (API) . . . . . . . . . . . . . . . . . . . . . . 3929.2 Complementary information available on the mobile app . . . . . . . . . . 3929.3 API colors . . . . . . . . . . . . . . . . . . . . . . . . . . . . . . . . . . . . 3929.4 Understanding the Air Pollution Index . . . . . . . . . . . . . . . . . . . . 4029.5 Where does the outdoor API come from? . . . . . . . . . . . . . . . . . . . 40
30 Air Quality (Japan) 4130.1 Outdoor Air Pollution Index (AQI) . . . . . . . . . . . . . . . . . . . . . . 4130.2 Complementary information available on the mobile app . . . . . . . . . . 4130.3 AQI colors . . . . . . . . . . . . . . . . . . . . . . . . . . . . . . . . . . . . 4130.4 Understanding the Air Pollution Index . . . . . . . . . . . . . . . . . . . . 4230.5 Where does the outdoor AQI in Japan come from? . . . . . . . . . . . . . 43
31 Air Quality (Taiwan) 4331.1 Outdoor Pollutant Standards Index (PSI) . . . . . . . . . . . . . . . . . . 4331.2 Complementary information available on the mobile app . . . . . . . . . . 4331.3 PSI colors . . . . . . . . . . . . . . . . . . . . . . . . . . . . . . . . . . . . 4331.4 Understanding the Pollutant Standards Index . . . . . . . . . . . . . . . . 4431.5 Where does the outdoor PSI in Taiwan come from? . . . . . . . . . . . . . 44
32 Air Quality (Greater Mexico City) 4432.1 Metropolitan Air Quality Index (IMECA) . . . . . . . . . . . . . . . . . . 4432.2 Complementary information available on the mobile app . . . . . . . . . . 4532.3 IMECA colors . . . . . . . . . . . . . . . . . . . . . . . . . . . . . . . . . . 4532.4 Understanding the IMECA index . . . . . . . . . . . . . . . . . . . . . . . 4532.5 Where does the IMECA in Mexico come from? . . . . . . . . . . . . . . . . 46
5
Tips and troubleshooting
1 How does it all work?
1.1 How does it all work?
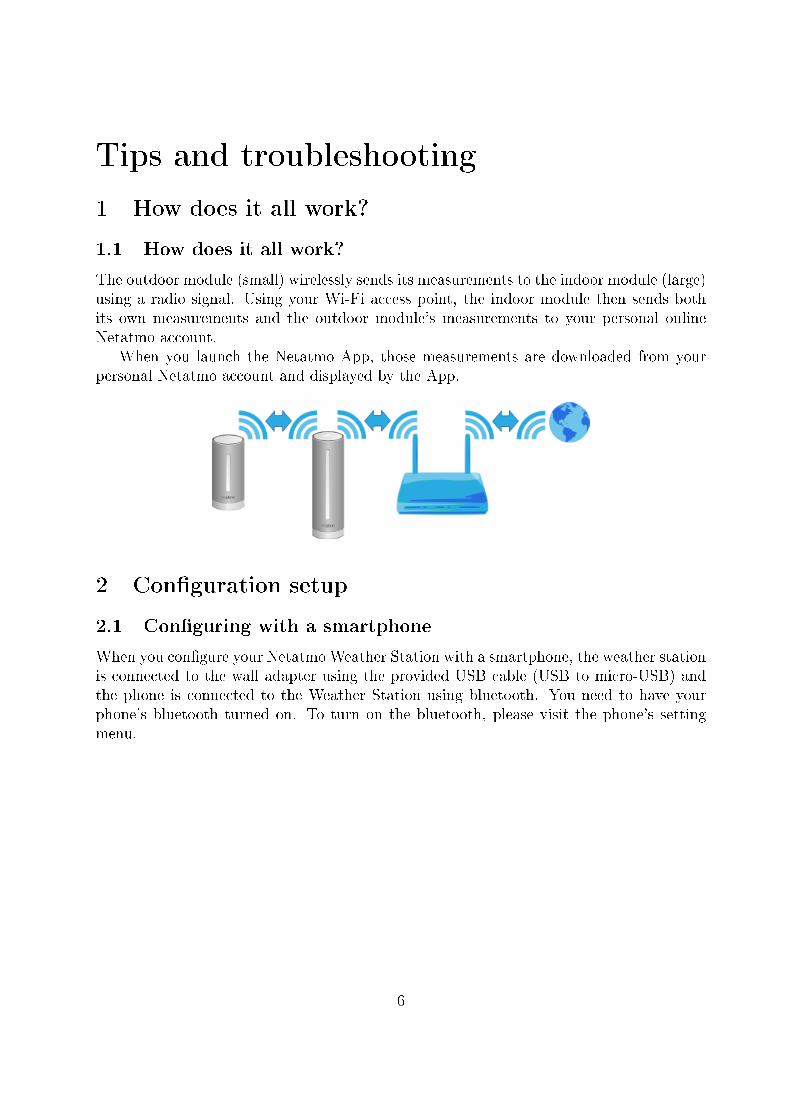
The outdoor module (small) wirelessly sends its measurements to the indoor module (large)using a radio signal. Using your Wi-Fi access point, the indoor module then sends bothits own measurements and the outdoor module's measurements to your personal onlineNetatmo account.
When you launch the Netatmo App, those measurements are downloaded from yourpersonal Netatmo account and displayed by the App.
2 Con�guration setup
2.1 Con�guring with a smartphone
When you con�gure your Netatmo Weather Station with a smartphone, the weather stationis connected to the wall adapter using the provided USB cable (USB to micro-USB) andthe phone is connected to the Weather Station using bluetooth. You need to have yourphone's bluetooth turned on. To turn on the bluetooth, please visit the phone's settingmenu.
6
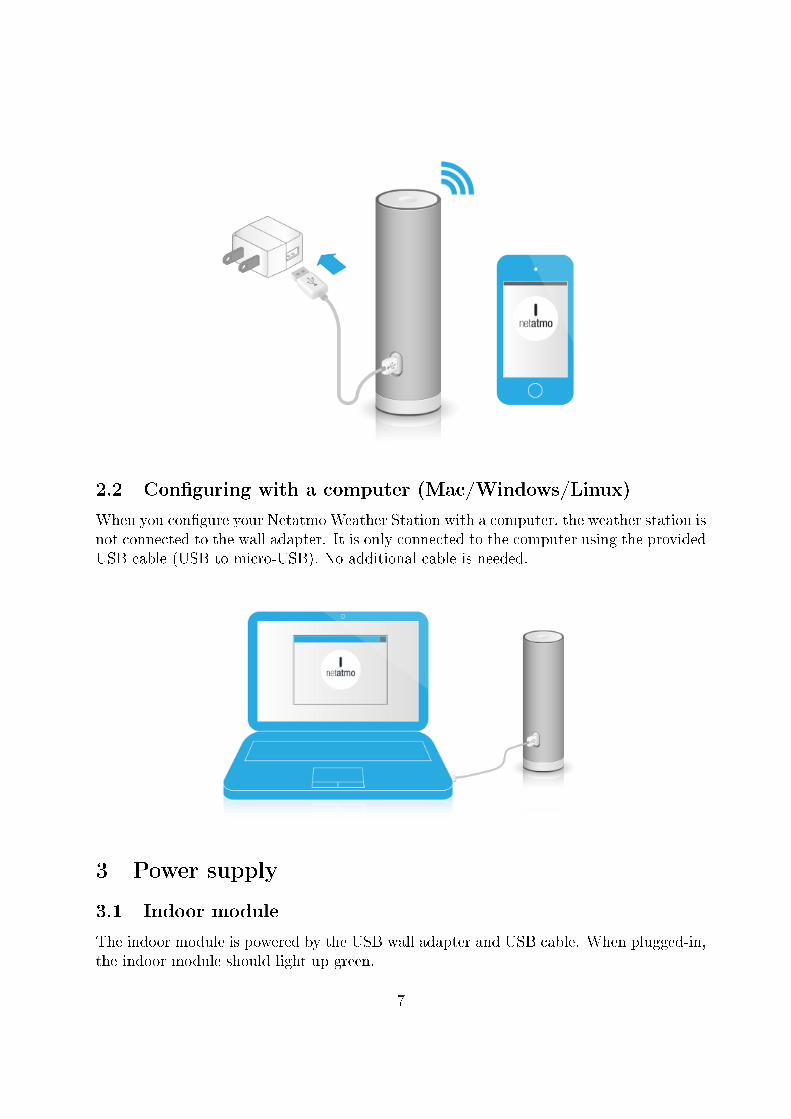
2.2 Con�guring with a computer (Mac/Windows/Linux)
When you con�gure your Netatmo Weather Station with a computer, the weather station isnot connected to the wall adapter. It is only connected to the computer using the providedUSB cable (USB to micro-USB). No additional cable is needed.
3 Power supply
3.1 Indoor module
The indoor module is powered by the USB wall adapter and USB cable. When plugged-in,the indoor module should light up green.
7
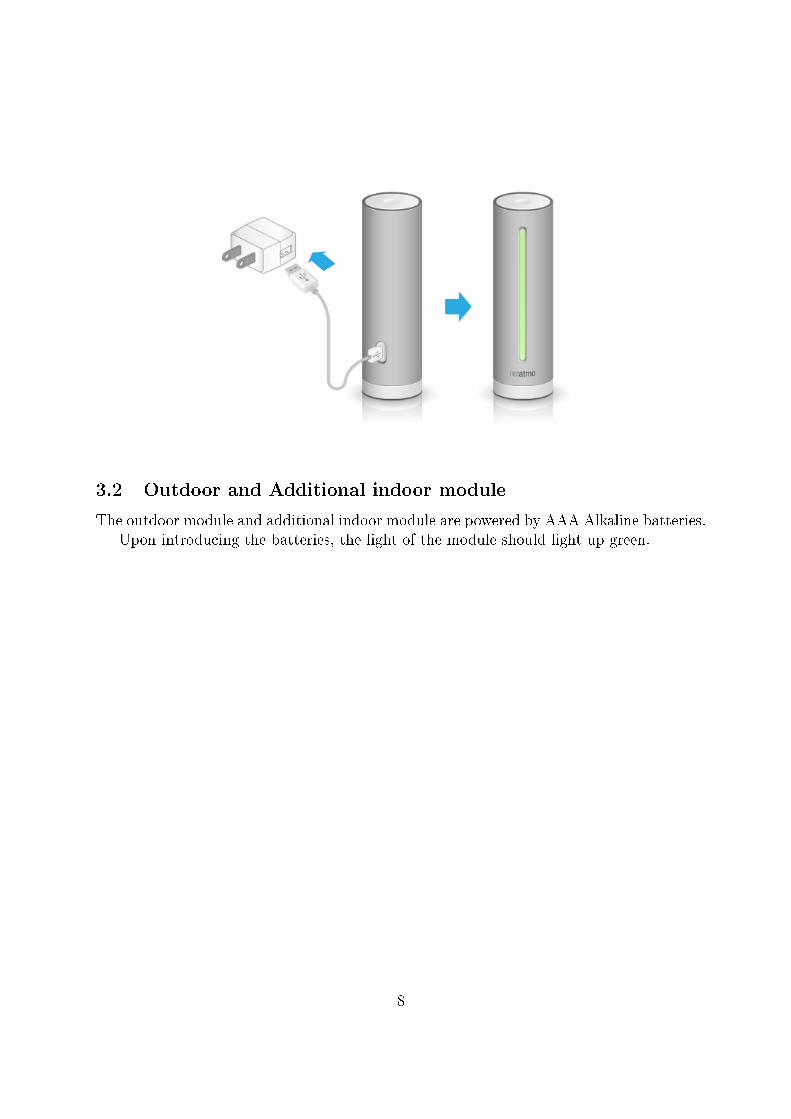
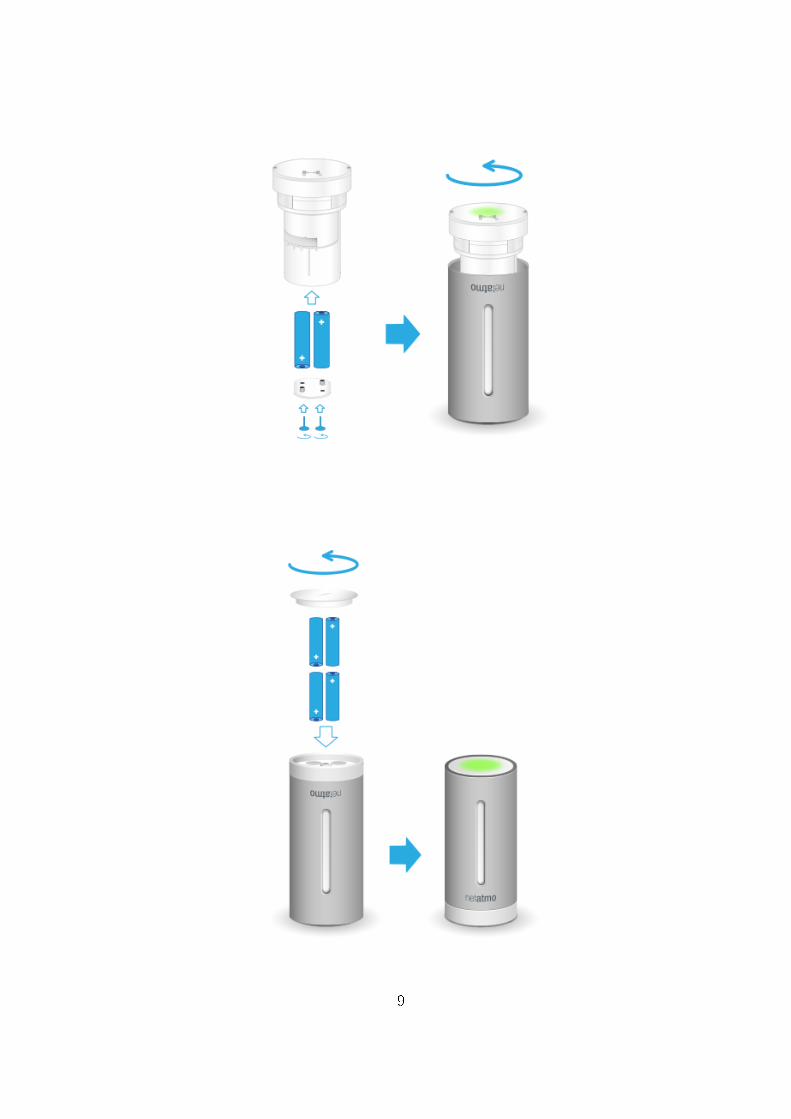
3.2 Outdoor and Additional indoor module
The outdoor module and additional indoor module are powered by AAA Alkaline batteries.Upon introducing the batteries, the light of the module should light up green.
8
9
4 Measurements on demand
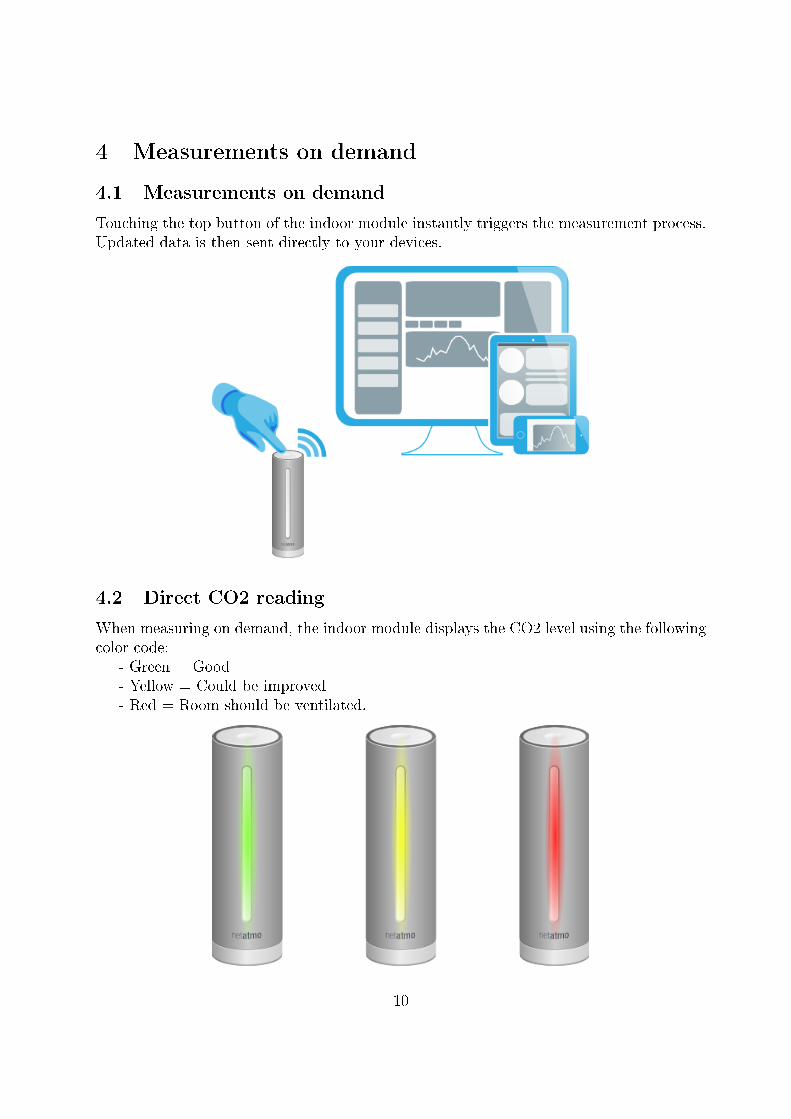
4.1 Measurements on demand
Touching the top button of the indoor module instantly triggers the measurement process.Updated data is then sent directly to your devices.
4.2 Direct CO2 reading
When measuring on demand, the indoor module displays the CO2 level using the followingcolor code:
- Green = Good- Yellow = Could be improved- Red = Room should be ventilated.
10
5 No outdoor data?
5.1 Outdoor data is not displayed?
If your outdoor module's data is not displayed on the Netatmo dashboard, although indoormeasurements are still visible, the link between the two modules might not be working.This may occur due to one of the following reasons:
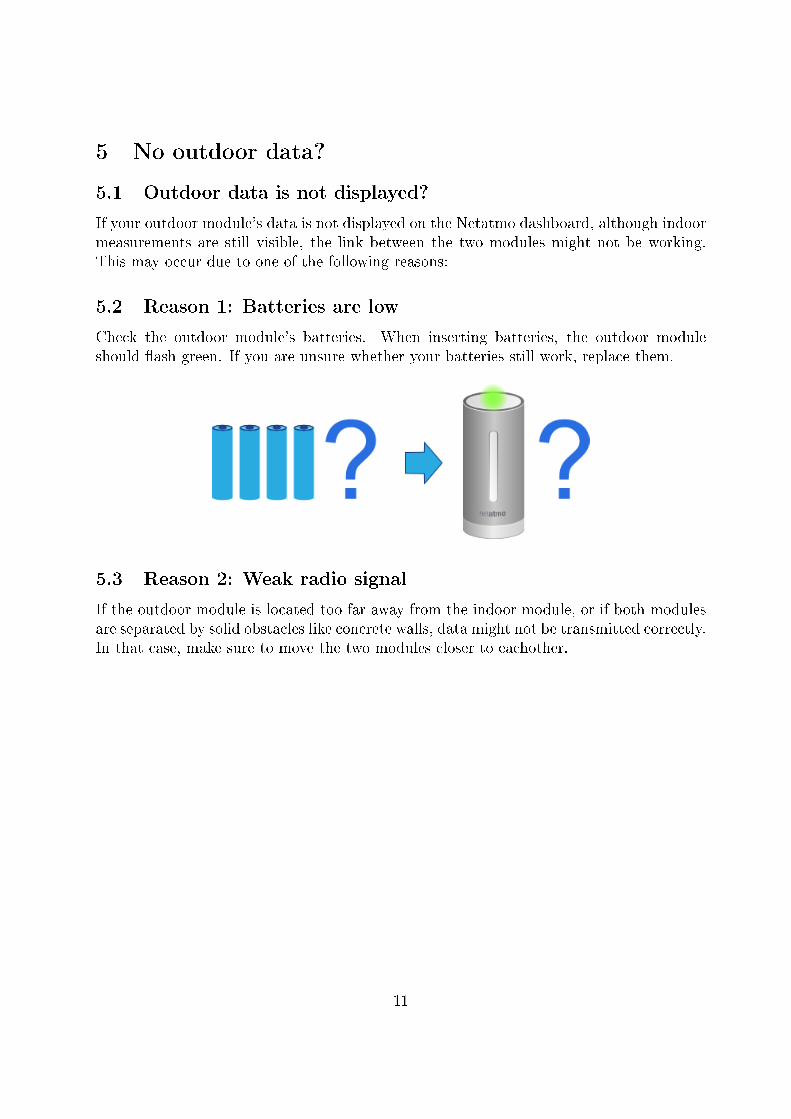
5.2 Reason 1: Batteries are low
Check the outdoor module's batteries. When inserting batteries, the outdoor moduleshould �ash green. If you are unsure whether your batteries still work, replace them.
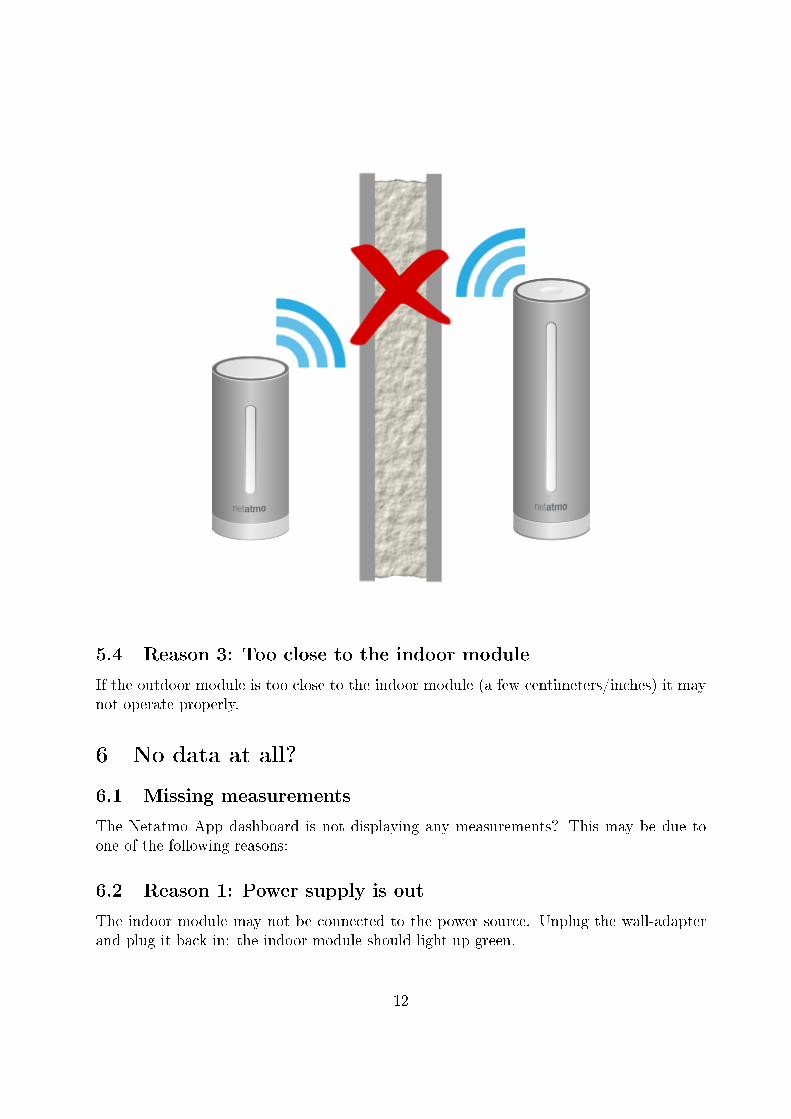
5.3 Reason 2: Weak radio signal
If the outdoor module is located too far away from the indoor module, or if both modulesare separated by solid obstacles like concrete walls, data might not be transmitted correctly.In that case, make sure to move the two modules closer to eachother.
11
5.4 Reason 3: Too close to the indoor module
If the outdoor module is too close to the indoor module (a few centimeters/inches) it maynot operate properly.
6 No data at all?
6.1 Missing measurements
The Netatmo App dashboard is not displaying any measurements? This may be due toone of the following reasons:
6.2 Reason 1: Power supply is out
The indoor module may not be connected to the power source. Unplug the wall-adapterand plug it back in: the indoor module should light up green.
12
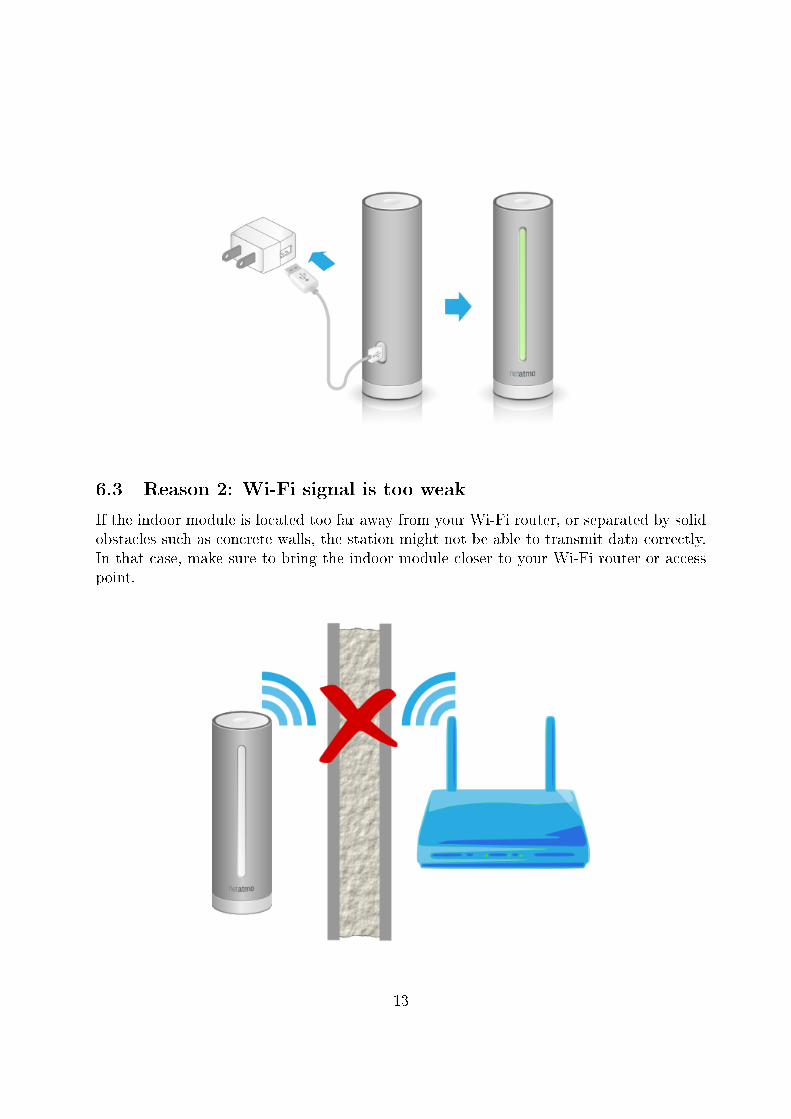
6.3 Reason 2: Wi-Fi signal is too weak
If the indoor module is located too far away from your Wi-Fi router, or separated by solidobstacles such as concrete walls, the station might not be able to transmit data correctly.In that case, make sure to bring the indoor module closer to your Wi-Fi router or accesspoint.
13
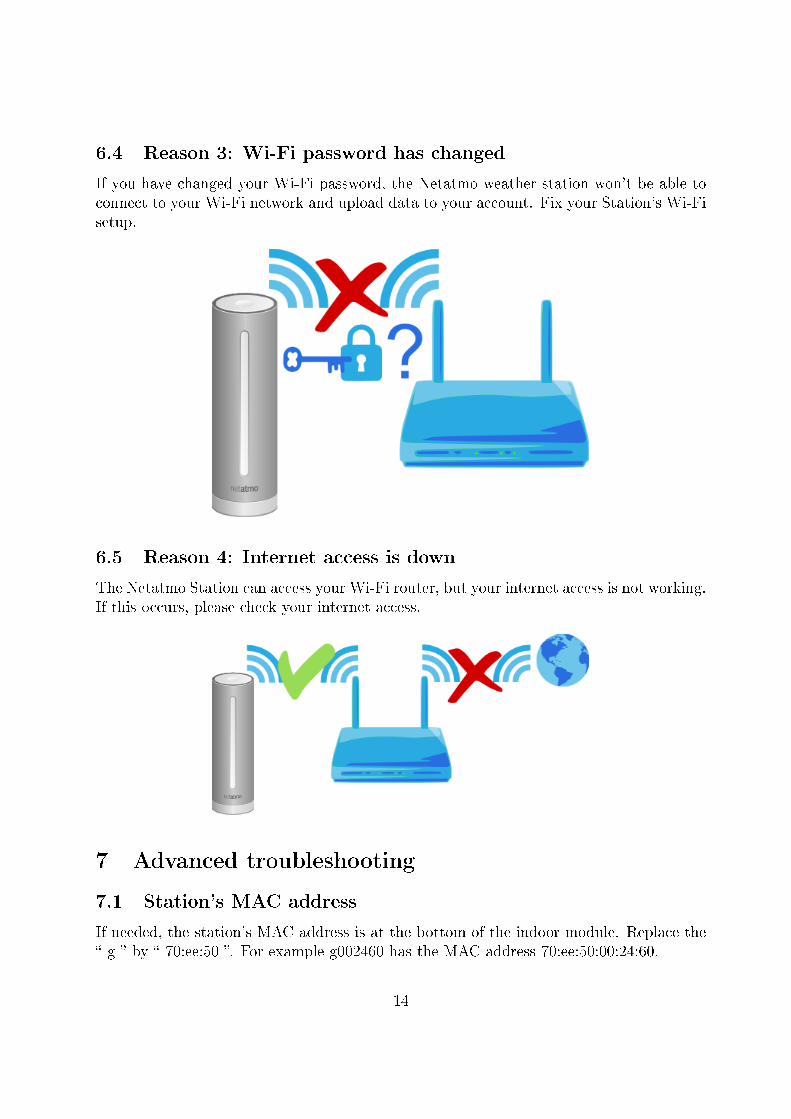
6.4 Reason 3: Wi-Fi password has changed
If you have changed your Wi-Fi password, the Netatmo weather station won't be able toconnect to your Wi-Fi network and upload data to your account. Fix your Station's Wi-Fisetup.
6.5 Reason 4: Internet access is down
The Netatmo Station can access your Wi-Fi router, but your internet access is not working.If this occurs, please check your internet access.
7 Advanced troubleshooting
7.1 Station's MAC address
If needed, the station's MAC address is at the bottom of the indoor module. Replace the� g � by � 70:ee:50 �. For example g002460 has the MAC address 70:ee:50:00:24:60.
14
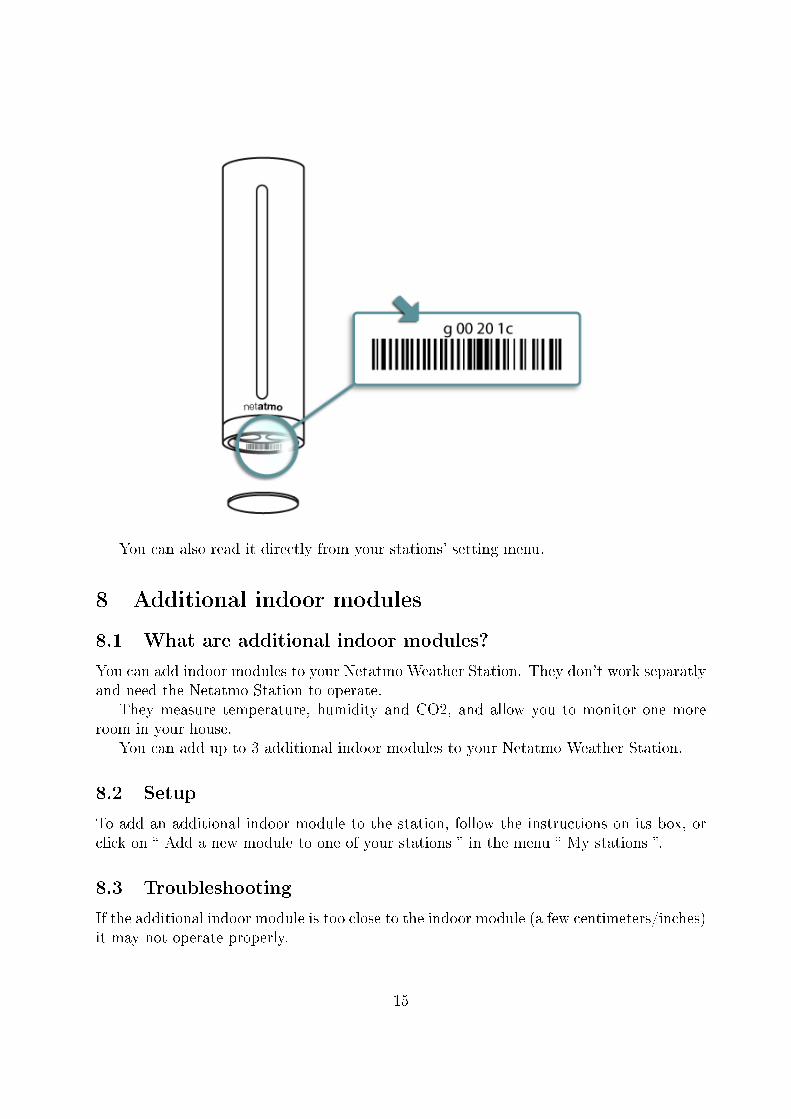
You can also read it directly from your stations' setting menu.
8 Additional indoor modules
8.1 What are additional indoor modules?
You can add indoor modules to your Netatmo Weather Station. They don't work separatlyand need the Netatmo Station to operate.
They measure temperature, humidity and CO2, and allow you to monitor one moreroom in your house.
You can add up to 3 additional indoor modules to your Netatmo Weather Station.
8.2 Setup
To add an additional indoor module to the station, follow the instructions on its box, orclick on � Add a new module to one of your stations � in the menu � My stations �.
8.3 Troubleshooting
If the additional indoor module is too close to the indoor module (a few centimeters/inches)it may not operate properly.
15
9 Additional rain gauge module
9.1 What is the additional rain gauge module?
You can add an additional rain gauge module to your Netatmo Weather Station. It doesnot work separatly and need the Netatmo Station to operate.
It allows you to monitor rain fall.You can add only one rain gauge module to your Netatmo Weather Station.
9.2 Setup
To add an additional rain gauge module to the station, follow the instructions on its box,or click on � Add a new module to one of your stations � in the menu � My stations �.
Sensors
10 Thermometer
10.1 Temperature measurement
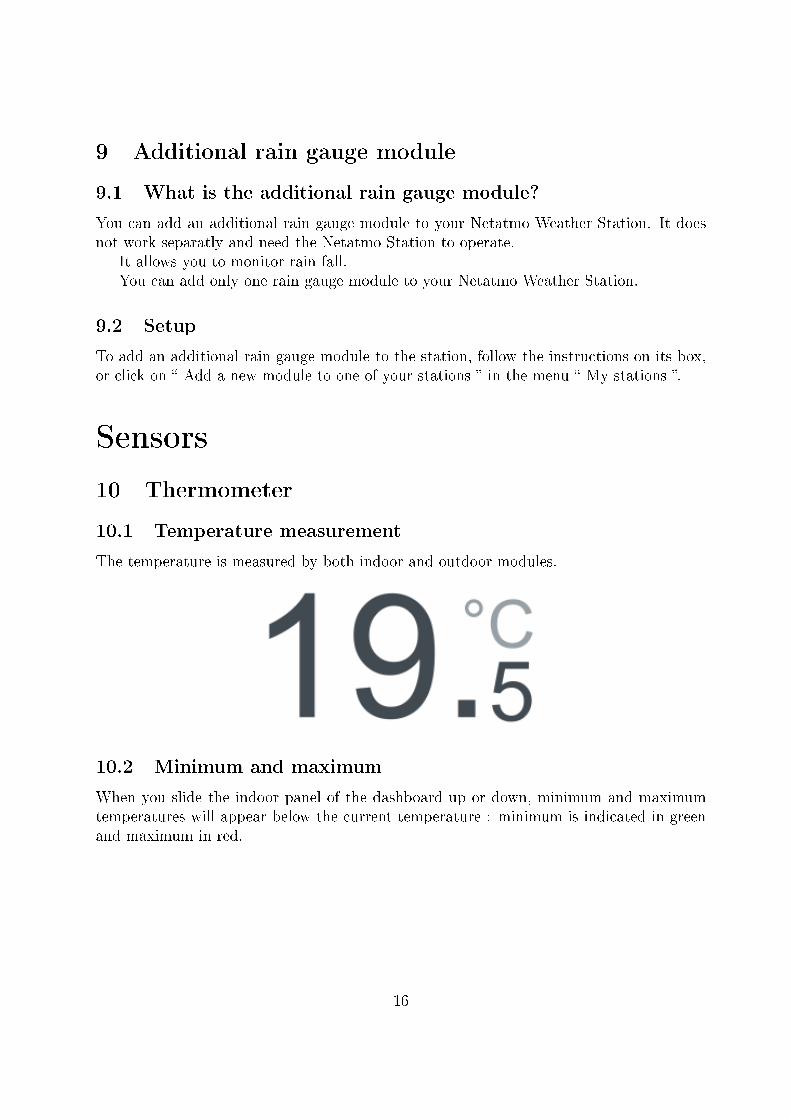
The temperature is measured by both indoor and outdoor modules.
10.2 Minimum and maximum
When you slide the indoor panel of the dashboard up or down, minimum and maximumtemperatures will appear below the current temperature : minimum is indicated in greenand maximum in red.
16
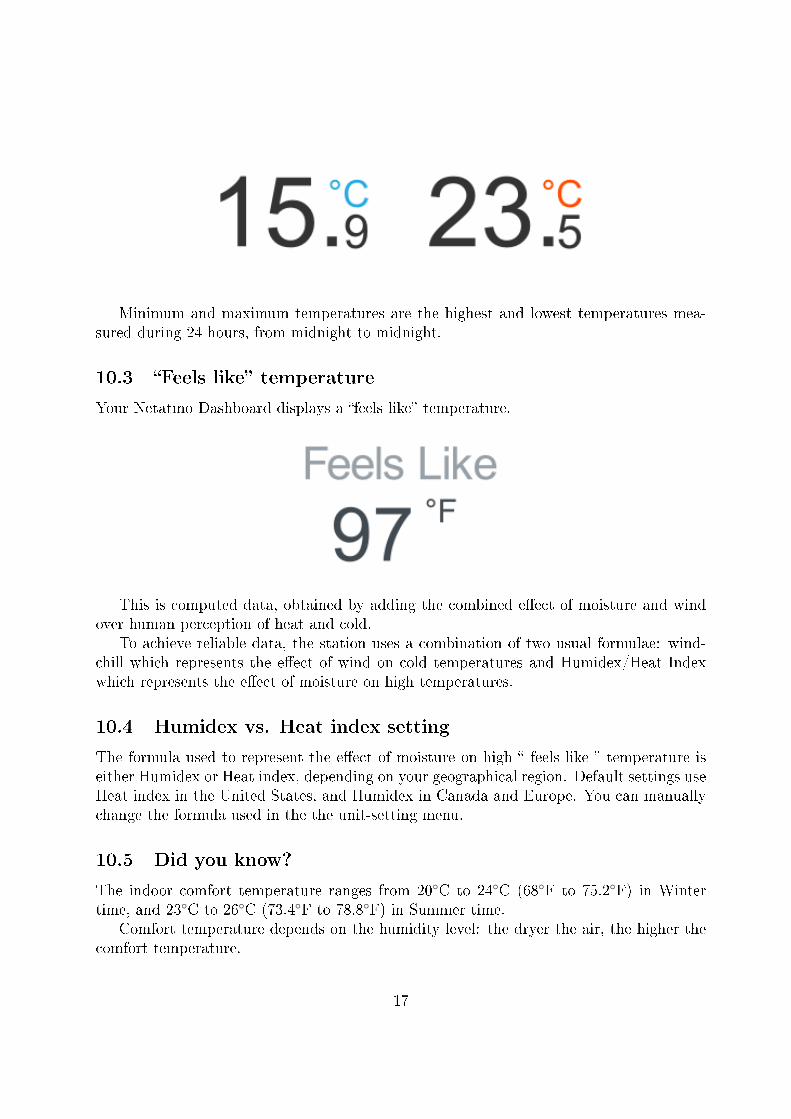
Minimum and maximum temperatures are the highest and lowest temperatures mea-sured during 24 hours, from midnight to midnight.
10.3 �Feels like� temperature
Your Netatmo Dashboard displays a �feels like� temperature.
This is computed data, obtained by adding the combined e�ect of moisture and windover human perception of heat and cold.
To achieve reliable data, the station uses a combination of two usual formulae: wind-chill which represents the e�ect of wind on cold temperatures and Humidex/Heat Indexwhich represents the e�ect of moisture on high temperatures.
10.4 Humidex vs. Heat index setting
The formula used to represent the e�ect of moisture on high � feels like � temperature iseither Humidex or Heat index, depending on your geographical region. Default settings useHeat index in the United States, and Humidex in Canada and Europe. You can manuallychange the formula used in the the unit-setting menu.
10.5 Did you know?
The indoor comfort temperature ranges from 20◦C to 24◦C (68◦F to 75.2◦F) in Wintertime, and 23◦C to 26◦C (73.4◦F to 78.8◦F) in Summer time.
Comfort temperature depends on the humidity level: the dryer the air, the higher thecomfort temperature.
17
10.6 Wise steps for accurate temperature measurements
You will improve the accuracy of your temperature measurements by protecting your mod-ules from exposure to direct sunlight.
Also, measurements on demand, when used frequently, trigger the indoor module'slights, which may arti�cially increase the measured temperature.
11 Barometer
11.1 Pressure measurement
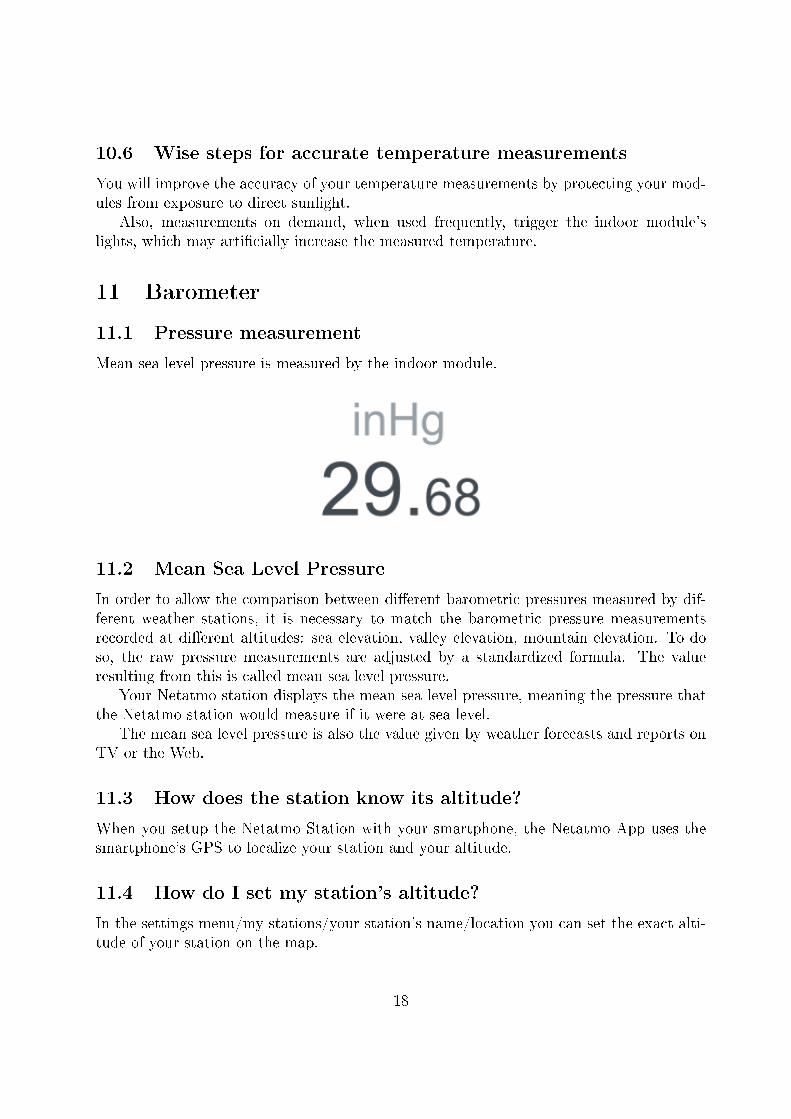
Mean sea level pressure is measured by the indoor module.
11.2 Mean Sea Level Pressure
In order to allow the comparison between di�erent barometric pressures measured by dif-ferent weather stations, it is necessary to match the barometric pressure measurementsrecorded at di�erent altitudes: sea elevation, valley elevation, mountain elevation. To doso, the raw pressure measurements are adjusted by a standardized formula. The valueresulting from this is called mean sea level pressure.
Your Netatmo station displays the mean sea level pressure, meaning the pressure thatthe Netatmo station would measure if it were at sea level.
The mean sea level pressure is also the value given by weather forecasts and reports onTV or the Web.
11.3 How does the station know its altitude?
When you setup the Netatmo Station with your smartphone, the Netatmo App uses thesmartphone's GPS to localize your station and your altitude.
11.4 How do I set my station's altitude?
In the settings menu/my stations/your station's name/location you can set the exact alti-tude of your station on the map.
18
11.5 Did you know?
The indoor and outdoor barometric pressure is always the same.For that reason, the barometer sensor is located in the indoor module only.
12 Hygrometer
12.1 Relative humidity measurement
Relative humidity is measured by both indoor and outdoor modules.
12.2 Did you know?
Dry environments can cause throat or nose irritation. Comfortable indoor humidity rangesfrom 30% up to 70%.
12.3 What is relative humidity?
Relative humidity is a measurement of the amount of water vapor in the air (at a speci�ctemperature) compared to the maximum amount of water vapor air can hold at that speci�ctemperature level. Humidity is represented by a percentage value.
Relative humidity depends on the temperature of the air. Warm air can hold moremoisture than cold air.
A relative humidity of 100% indicates that the air is holding all the water it can at thatspeci�c temperature; any additional moisture at that point will transform into condensa-tion.
If the temperature decreases, but the amount of moisture in the air does not change,the relative humidity increases.
12.4 Did you notice?
If you blow into the station, the humidity level raises!
19
12.5 What happens if the station is exposed to high humidity?
When the weather is very humid (due to rain) the humidity sensor may become saturated.It usually takes a few hours for it to dry, and return to its normal state.
13 CO2 Sensor
13.1 CO2 measurement
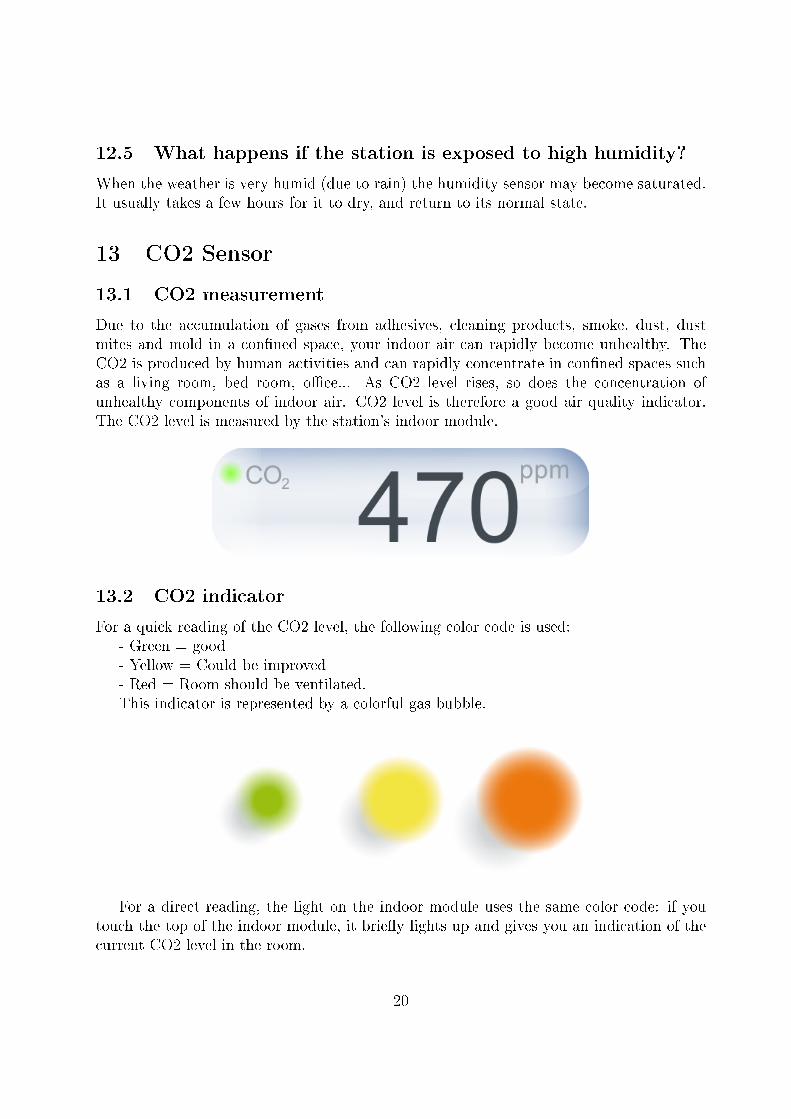
Due to the accumulation of gases from adhesives, cleaning products, smoke, dust, dustmites and mold in a con�ned space, your indoor air can rapidly become unhealthy. TheCO2 is produced by human activities and can rapidly concentrate in con�ned spaces suchas a living room, bed room, o�ce... As CO2 level rises, so does the concentration ofunhealthy components of indoor air. CO2 level is therefore a good air quality indicator.The CO2 level is measured by the station's indoor module.
13.2 CO2 indicator
For a quick reading of the CO2 level, the following color code is used:- Green = good- Yellow = Could be improved- Red = Room should be ventilated.This indicator is represented by a colorful gas bubble.
For a direct reading, the light on the indoor module uses the same color code: if youtouch the top of the indoor module, it brie�y lights up and gives you an indication of thecurrent CO2 level in the room.
20
13.3 Units
CO2 is measured in ppm (parts per million), meaning the number of CO2 molecules amongone million air molecules. Usual indoor CO2 levels vary between 400 and 5000 ppm.
13.4 Typical ppm values
- Outdoor, CO2 level is always around 400 ppm.- In an appropriately ventilated room, the CO2 level should remain below 1000 ppm
for the upmost comfort.- In a closed room such as a meeting room with several people or a small bedroom at
night, CO2 can easily go past 1000 ppm.
13.5 Consequences
CO2 is not dangerous when kept within such values. Nevertheless, when it rises over 1000ppm, it is an indication that indoor air has not been renewed for a long time. If thishappens, ventilating the room is a simple and e�ective action.
Over 2000 ppm CO2 can also cause sleepiness and slight headaches.
13.6 CO2 Alerts
When the CO2 level rises above 1000 ppm, a noti�cation is sent to your smartphone andthe indoor module brie�y lights up yellow.
When the CO2 level goes above 2000 ppm, a second alert is sent to your smartphoneand the indoor module brie�y lights up red.
13.7 How does the Netatmo station measure the CO2 concentra-tion?
The sensor measures CO2 using an optical process: the Station is embedded with a lightbulb and an infrared receiver. Light is emitted from the bulb and partially absorbed bythe CO2 contained in the ambient air. The higher the CO2 level, the more the light isabsorbed. The infrared receiver then measures the amount of light received and from thereit deducts the CO2 level. This method works regardless of the ambient light.
13.8 Calibration
To ensure the accuracy of your CO2 measurements, the Netatmo Weather Station auto-matically and regularly recalibrates its CO2 sensor. This calibration is performed assumingthat the CO2 level surrounding the station lowers to 400 ppm at least once a week. Toachieve a precise calibration, make sure to ventilate the room for a period of time longenough to entirely renew the air.
21
13.9 Manual CO2 calibration
If the Netatmo station fells on the ground or goes under similar shocks, it may be necessaryto perform a manual calibration of the CO2 sensor.
For this purpose please visit the CO2 Calibration tab of your station, from the menu� My stations �. Once the manual CO2 calibration started, please don't unplug the stationfor at least 6 hours, to let it calibrate.
If the station did not go under excessive shock manual CO2 calibration should not beneeded.
14 Sound meter
14.1 Acoustic comfort measurement
Acoustic comfort is measured by the indoor module.You can view data and measurements directly on the Netatmo App dashboard.
14.2 How does the Netatmo station measure acoustic comfort?
The Netatmo weather station evaluates the surrounding acoustic comfort by measuringthe average noise level (in dB) over a 5-minute interval.
14.3 Did you know?
- The usual human ear cannot distinguish sounds below 30 dB.- A prolongated exposure to sound levels over 65 dB noticeably disminishes your ability
to concentrate.- In many countries, continuous exposure to noise during a workday is limited to an 85
dB level.- Sounds over 95 dB can put your hearing at risk.
22
15 Rain gauge
15.1 Rain fall measurement
Rainfall is measured with a tipping buckets rain gauge. Water makes the buckets tip, andthe number of tips is counted through a magnet placed on the buckets.
15.2 Displayed measures
Your dashboard displays:- Rainfall in mm/h or inches/h measured over the last hour.- Cumulative rainfall during the day (measured from midnight to midnight).A reminder of the forecasted rainfall value for the day (forecasted from midnight to
midnight), which let you compare and estimate remaining rainfall for today.
15.3 Setup and precaution
The rain gauge shoudl be place horizontally, if possible between 0,5 and 1,5 m (2 and 5feet) high and 3 m (10 feet) away from surrounding obstacles.
To �x the rain gauge, you may use a 1/4 inches standard camera mounting screw, orthe two holes pierced in the rain gauge plastic base.
The rain gauge cannot measure snowfall and it is recommended not to let it outside byvery low temperatures.
15.4 Calibration
If you wish to recalibrate your rain gauge, please visit the � calibration � section of yourweather station settings menu.
Other functions
16 Current weather conditions
16.1 Current weather icon
The current weather condition is estimated, using the most up-to-date information availableat your station's precise location.
23
17 7-day forecast
17.1 Forecast
The Netatmo App o�ers a complete 7-day detailed weather forecast. It is localized accord-ing to your Netatmo Weather Station location and transmitted from our servers throughthe Internet and to your Netatmo App. This weather forecast data is provided by Me-teoGroup.
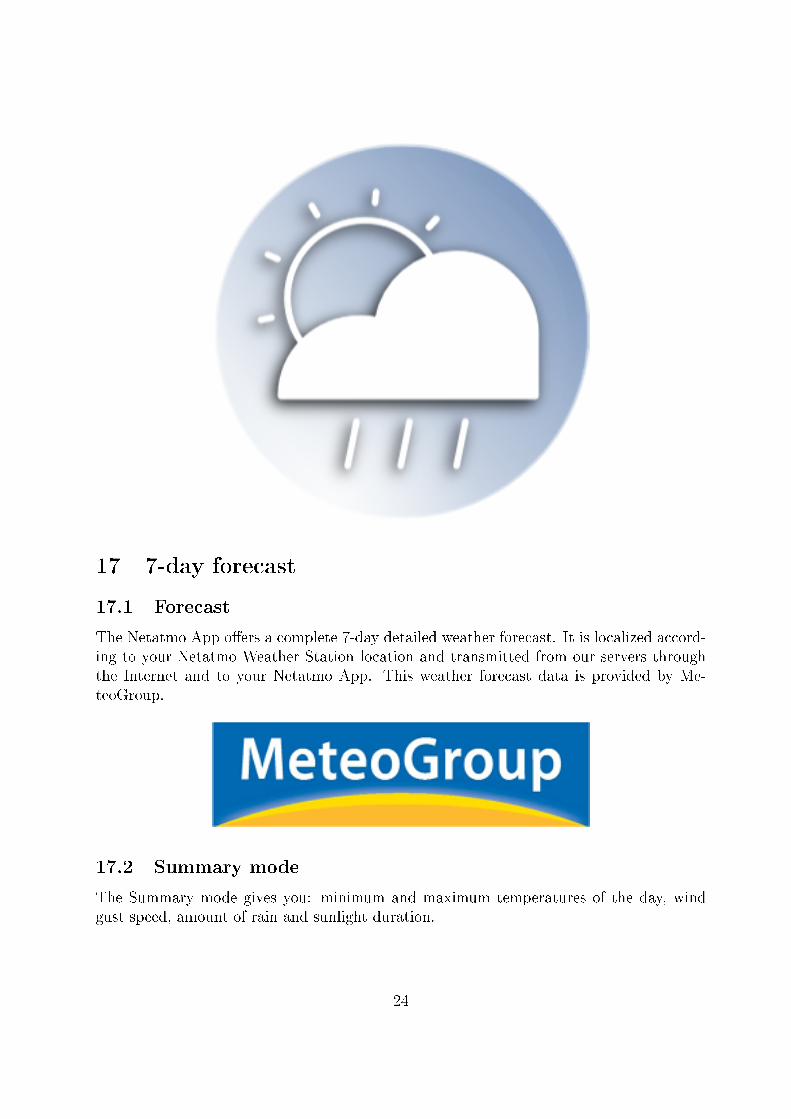
17.2 Summary mode
The Summary mode gives you: minimum and maximum temperatures of the day, windgust speed, amount of rain and sunlight duration.
24
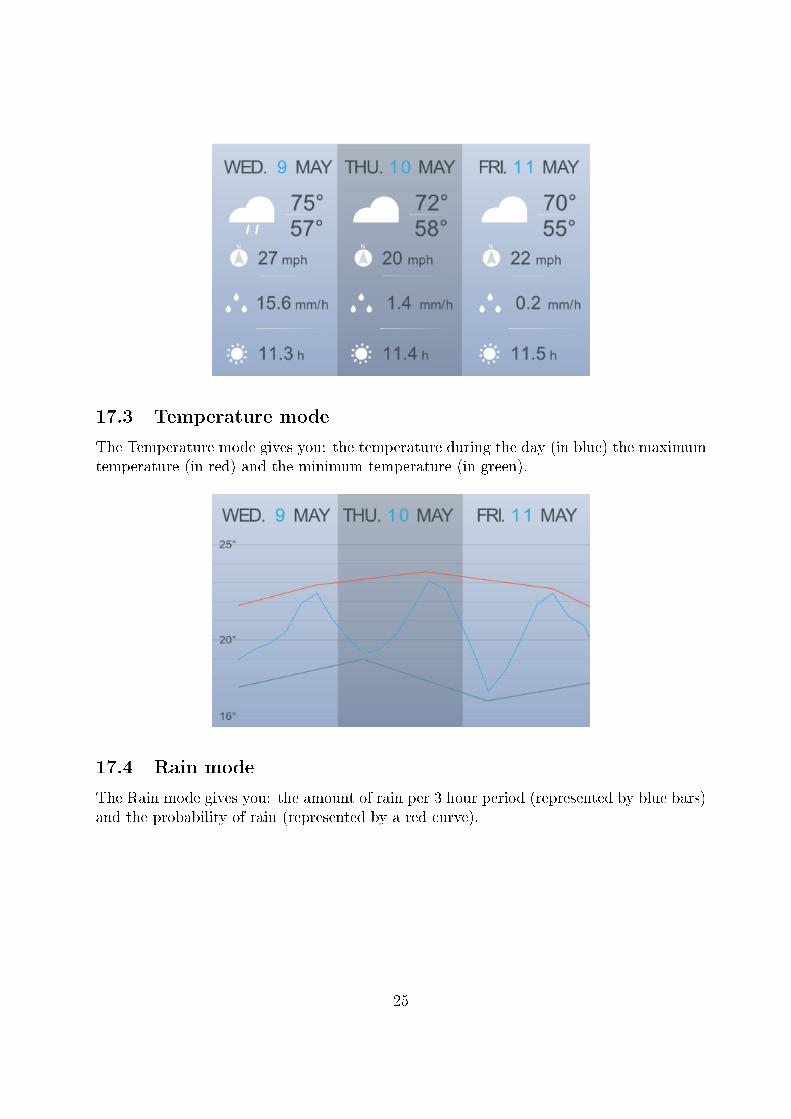
17.3 Temperature mode
The Temperature mode gives you: the temperature during the day (in blue) the maximumtemperature (in red) and the minimum temperature (in green).
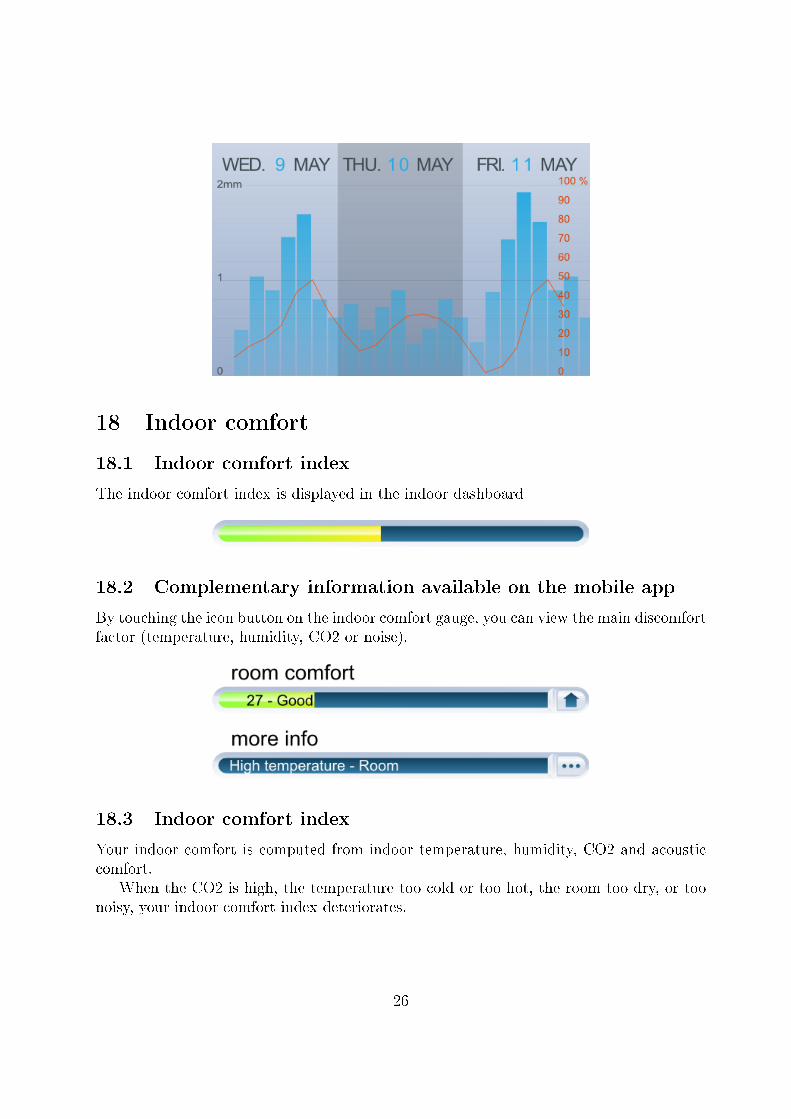
17.4 Rain mode
The Rain mode gives you: the amount of rain per 3 hour period (represented by blue bars)and the probability of rain (represented by a red curve).
25
18 Indoor comfort
18.1 Indoor comfort index
The indoor comfort index is displayed in the indoor dashboard
18.2 Complementary information available on the mobile app
By touching the icon button on the indoor comfort gauge, you can view the main discomfortfactor (temperature, humidity, CO2 or noise).
18.3 Indoor comfort index
Your indoor comfort is computed from indoor temperature, humidity, CO2 and acousticcomfort.
When the CO2 is high, the temperature too cold or too hot, the room too dry, or toonoisy, your indoor comfort index deteriorates.
26
19 Noti�cations
19.1 What are noti�cations?
Noti�cations are computed by your NetatmoWeather Station and sent to your smartphone.They are implemented to help you improve your environment with basic daily steps.
Those noti�cations are stored in your Netatmo embedded events timeline.
19.2 Personalized noti�cations
Your Netatmo stations is set up with the following default noti�cations: CO2, temperature,pressure and humidity. You can �nd details about each noti�cation below, and you canactivate and deactivate each noti�cation from the personalized noti�cations menu of yourstation.
In addition to those default noti�cations, you can create personalized noti�cations bychoosing a module (indoor/outdoor), a measurement type (high CO2, low temperature...)and a threshold.
19.3 CO2 noti�cations (default)
When the CO2 level rises above 1000 ppm, this noti�cation indicates the potential bene�tsof ventilating the room.
Similarly, above 2000 ppm, this noti�cation warns you that you should open the windowto refresh your living environment.
19.4 Freezing noti�cation (default)
When the outdoor temperature reaches 3◦C (37◦F), this noti�cation warns you of freezingconditions.
19.5 Pressure drop noti�cation (default)
When the pressure drops by more than 2 mbar (0.06 inHg) in the last hour, this noti�cationwarns you that weather has deteriorated.
19.6 Room temperature noti�cations (default)
When the indoor temperature drops below 10◦C (50◦F) this noti�cation warns you ofpotential heating system failure.
Similarly, when the indoor temperature drops below 3◦C (37◦F), this noti�cation warnsyou of freezing conditions indoors.
27
19.7 Humidity noti�cation (default)
When the humidity rises by 20% within a short time, you are noti�ed.
19.8 NOAA Weather Alerts (US)
Weather alerts from the National Weather Service are sent as noti�cations to your Netatmoapp. They are selected according to your station's location.
Typical message will look like � Dense Fog Advisory issued February 01 at 4:18AMAKST until February 01 at 12:00PM AKST by NWS �.
More information about those alerts and sources can be found on the National WeatherService Website.
19.9 MeteoAlarm Weather Alerts (Europe)
Weather alerts in Europe are provided thanks to the MeteoAlarm service.Typical message looks like � Fog alert (meteoalarm). Station's name: reduced visibility
(Level 1/3) �This service is provided by Eumetnet, the Network of European Meteorological Services.
More information can be found on the MeteoAlarm Website.
20 Highlights
20.1 What are highlights?
Highlights are personalized analyses based on one week worth of measurement data: everyweek-end, 1 or 2 remarkable facts are highlighted from your station's raw data.
Highlights are displayed in the event timeline of the Netatmo App.
20.2 Example
Your Netatmo station can detect temperature degradation over several weeks, CO2 peaks,and large pressure variations.
21 Graphs
21.1 Automated recording
Your Netatmo station is automatically and constantly recording measurements. Thosemeasurements are accessible as graphs that you can easily access in your Netatmo app.
28
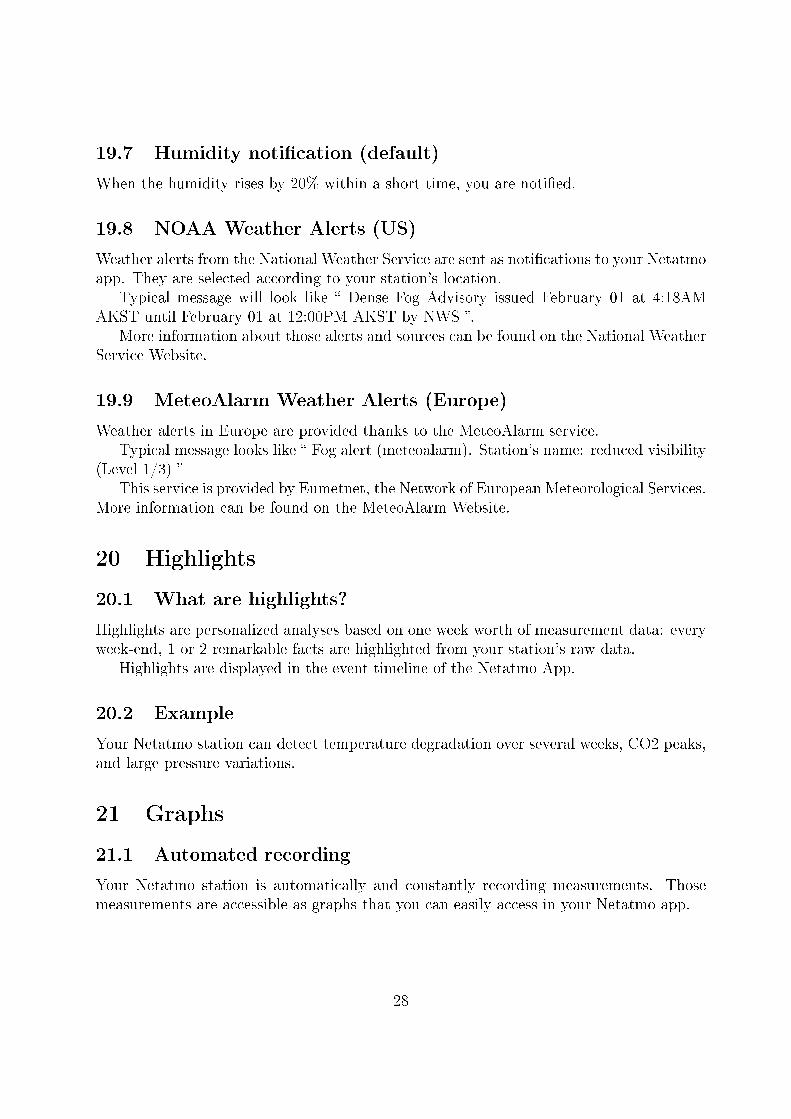
21.2 Navigating from dashboard to graphs on a smartphone
You can access to graphs by tilting your smartphone into landscape mode.You can zoom in and out by pinching the graphs in and out.
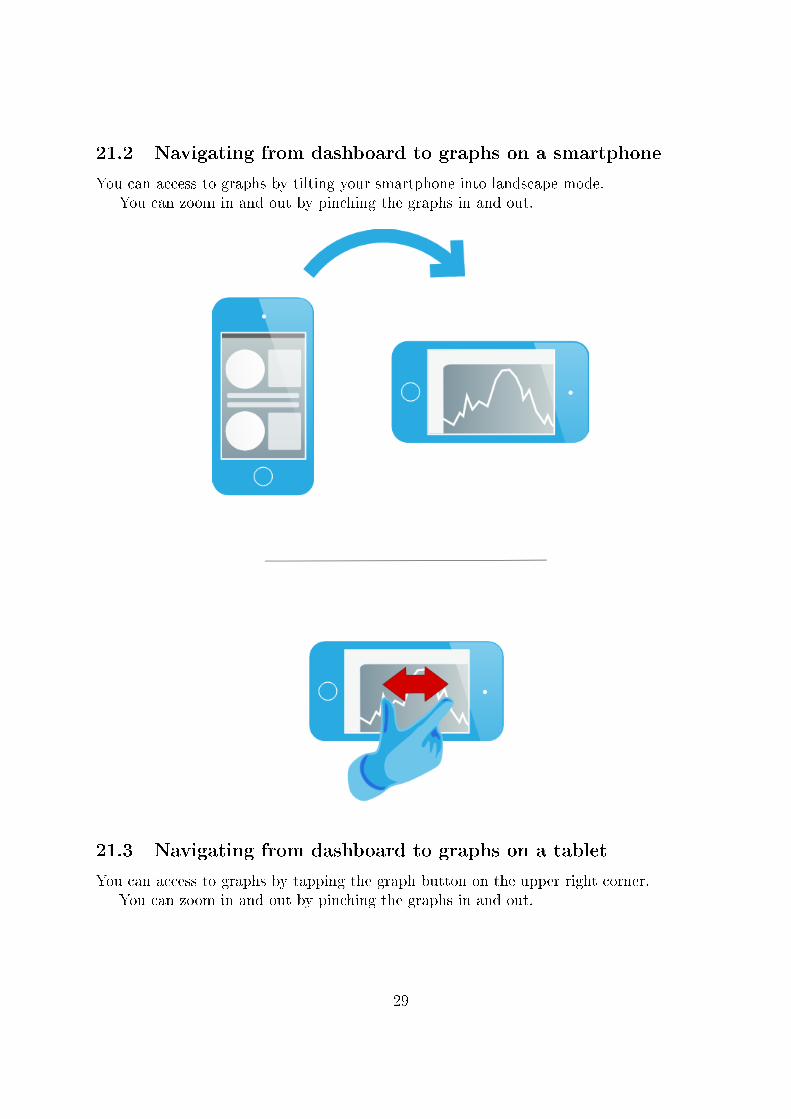
21.3 Navigating from dashboard to graphs on a tablet
You can access to graphs by tapping the graph button on the upper right corner.You can zoom in and out by pinching the graphs in and out.
29
21.4 Showing graphs in the browser app
In the Netatmo browser app (available here) graphs are displayed in the middle of thescreen. To display a given type of measure, select it in the left column.
You can display the graph by day, week, month or year.
30
Air Quality
22 Air Quality (USA)
22.1 Outdoor air quality index
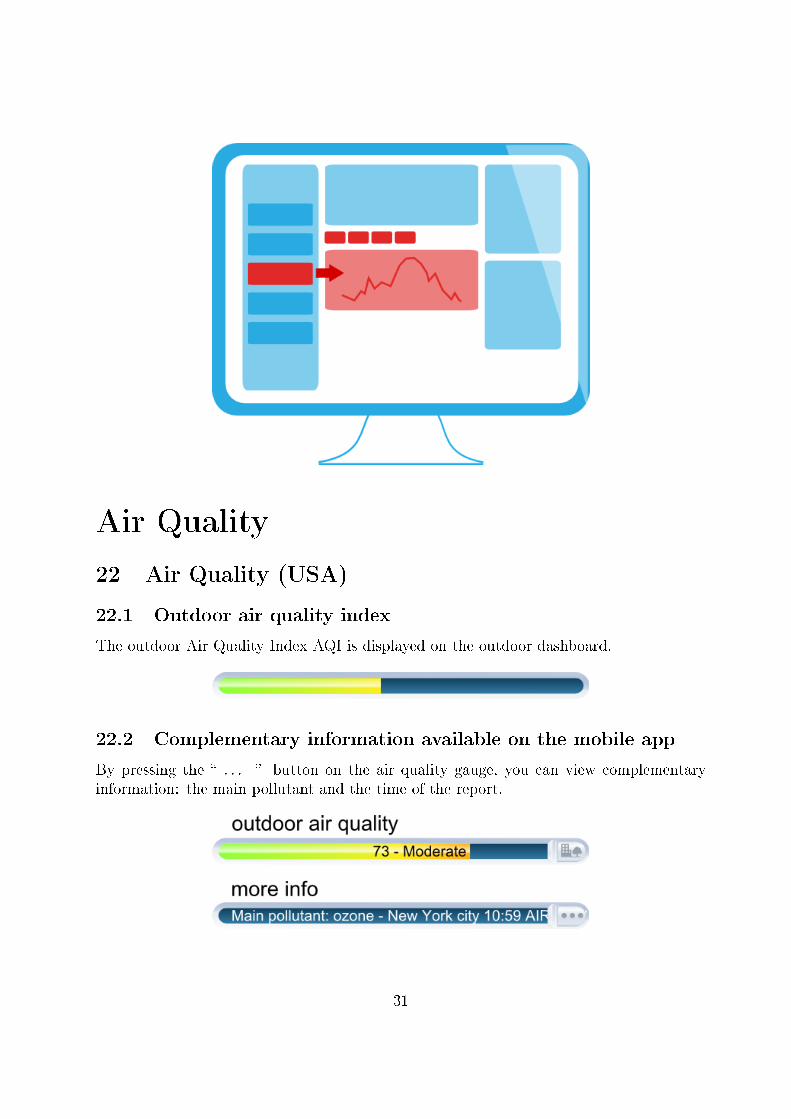
The outdoor Air Quality Index AQI is displayed on the outdoor dashboard.
22.2 Complementary information available on the mobile app
By pressing the � . . . � button on the air quality gauge, you can view complementaryinformation: the main pollutant and the time of the report.
31
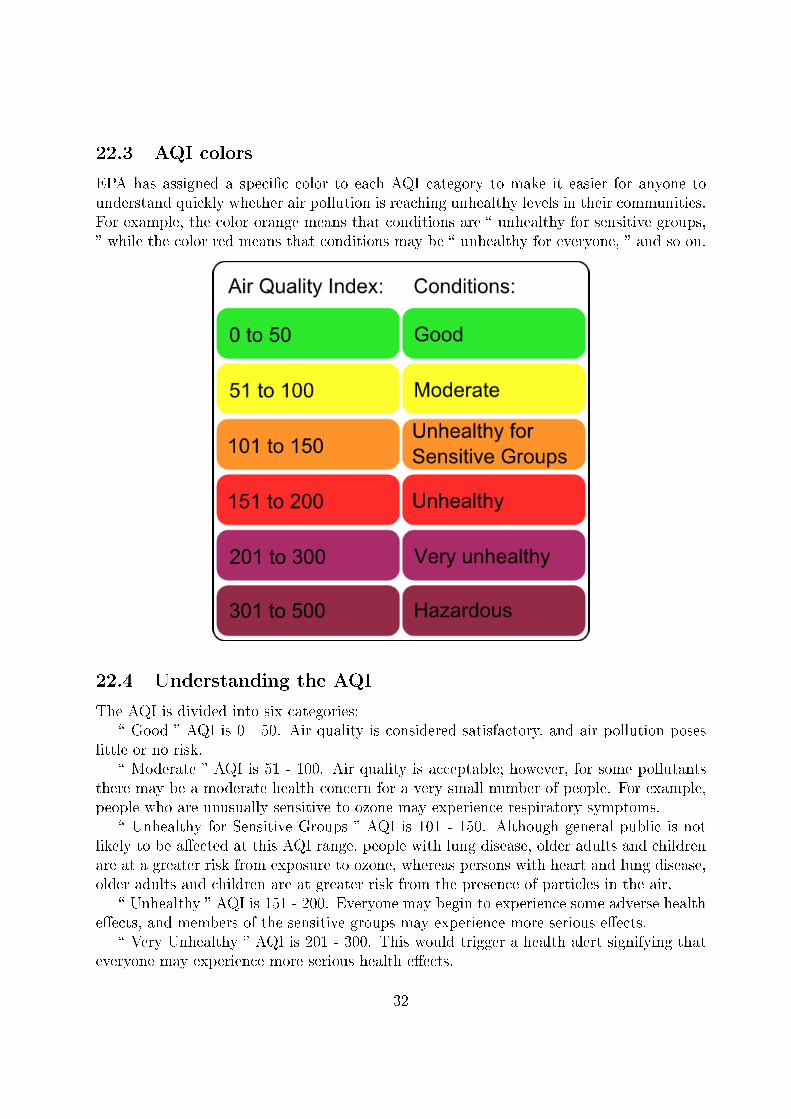
22.3 AQI colors
EPA has assigned a speci�c color to each AQI category to make it easier for anyone tounderstand quickly whether air pollution is reaching unhealthy levels in their communities.For example, the color orange means that conditions are � unhealthy for sensitive groups,� while the color red means that conditions may be � unhealthy for everyone, � and so on.
22.4 Understanding the AQI
The AQI is divided into six categories:� Good � AQI is 0 - 50. Air quality is considered satisfactory, and air pollution poses
little or no risk.� Moderate � AQI is 51 - 100. Air quality is acceptable; however, for some pollutants
there may be a moderate health concern for a very small number of people. For example,people who are unusually sensitive to ozone may experience respiratory symptoms.
� Unhealthy for Sensitive Groups � AQI is 101 - 150. Although general public is notlikely to be a�ected at this AQI range, people with lung disease, older adults and childrenare at a greater risk from exposure to ozone, whereas persons with heart and lung disease,older adults and children are at greater risk from the presence of particles in the air.
� Unhealthy � AQI is 151 - 200. Everyone may begin to experience some adverse healthe�ects, and members of the sensitive groups may experience more serious e�ects.
� Very Unhealthy � AQI is 201 - 300. This would trigger a health alert signifying thateveryone may experience more serious health e�ects.
32
� Hazardous � AQI higher than 300. This would trigger a health warning of emergencycondition. The entire population is then more likely to be a�ected.
22.5 Where does the outdoor air quality index come from?
The outdoor air quality index (AQI) in the United States is provided by the U.S. Environ-mental Protection Agency (EPA) as part of the AIRNow program. A list of sources andAIRNow partners can be found here.
23 Air Quality (Canada)
23.1 Outdoor: Air Quality Health Index
The outdoor Air Quality Health Index (AQHI) is displayed on the outdoor dashboard.
This index is not available outside the 74 largest Canadian cities.
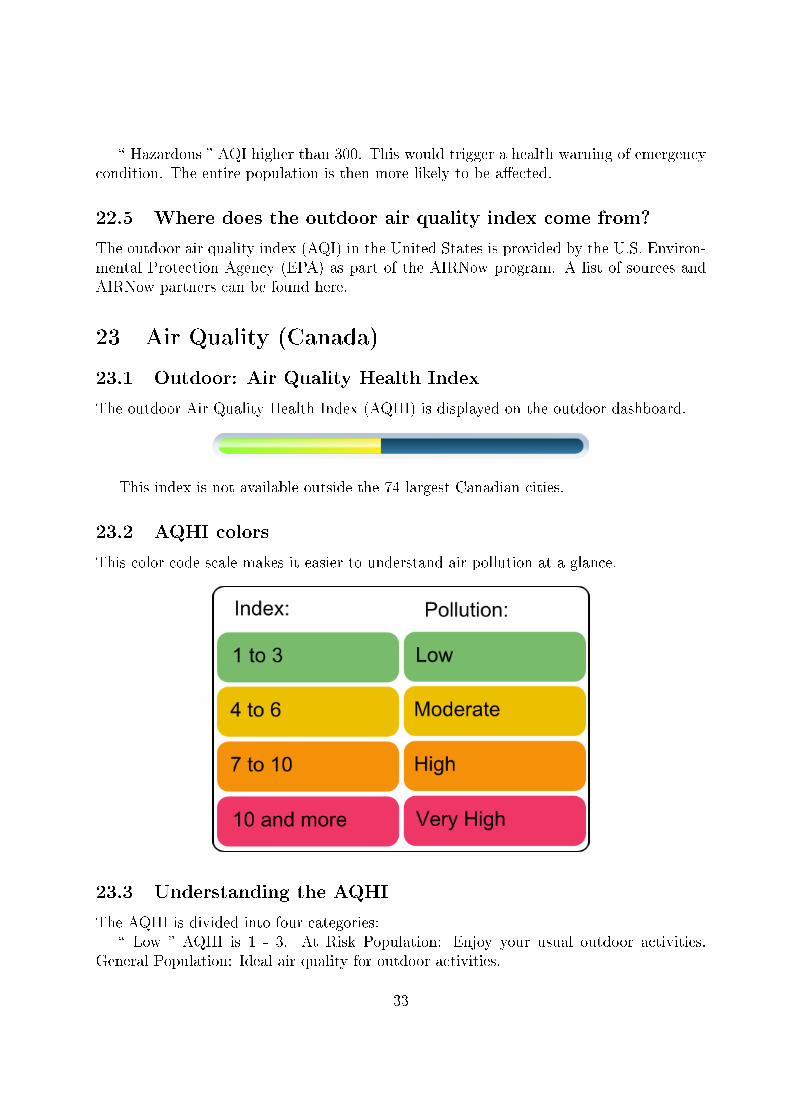
23.2 AQHI colors
This color code scale makes it easier to understand air pollution at a glance.
23.3 Understanding the AQHI
The AQHI is divided into four categories:� Low � AQHI is 1 - 3. At Risk Population: Enjoy your usual outdoor activities.
General Population: Ideal air quality for outdoor activities.
33
� Moderate � AQHI is 4 - 6. At Risk Population: Consider reducing or reschedulingstrenuous activities outdoors if you are experiencing symptoms. General Population: Noneed to modify your usual outdoor activities unless you experience symptoms such ascoughing and throat irritation.
� High � AQHI is 7 - 10. At Risk Population: Reduce or reschedule strenuous activitiesoutdoors. Children and the elderly should also take it easy. General Population: Considerreducing or rescheduling strenuous activities outdoors if you experience symptoms such ascoughing and throat irritation.
� Very high � AQHI higher than 10. At Risk Population: Avoid strenuous activitiesoutdoors. Children and the elderly should also avoid outdoor physical exertion. GeneralPopulation: Reduce or reschedule strenuous activities outdoors, especially if you experiencesymptoms such as coughing and throat irritation.
For more information about � At Risk Population �, please follow this link
23.4 Where does the AQHI come from?
The Air Quality Health Index (AQHI) is a new public information tool that helps Canadi-ans protect their health on a daily basis from the negative e�ects of air pollution. This toolhas been developed by Health Canada and Environment Canada, in collaboration with theprovinces and key health and environment stakeholders.
The use Licence can be found here.
24 Air Quality (Europe - Citeair)
24.1 Outdoor air quality: pollution index
The European Citeair indices for air pollution (Common information to European Air)are displayed on the outdoor dashboard. They are computed by Citeair using real-timepollutant monitoring. This monitoring is provided by partner air quality surveillance or-ganisms.
24.2 Complementary information available on the mobile app
By touching on the icon button on the air quality gauge, you may switch between back-ground air pollution index, tra�c air pollution index and complementary information aboutthe main pollutant.
34
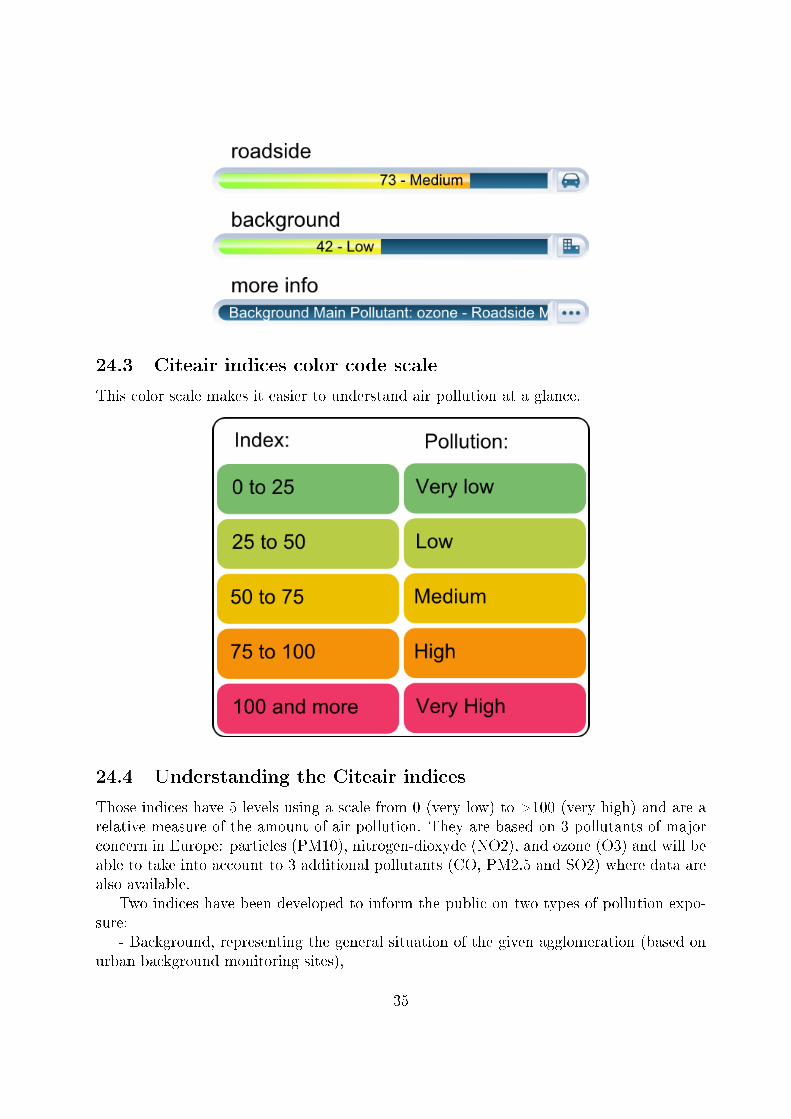
24.3 Citeair indices color code scale
This color scale makes it easier to understand air pollution at a glance.
24.4 Understanding the Citeair indices
Those indices have 5 levels using a scale from 0 (very low) to >100 (very high) and are arelative measure of the amount of air pollution. They are based on 3 pollutants of majorconcern in Europe: particles (PM10), nitrogen-dioxyde (NO2), and ozone (O3) and will beable to take into account to 3 additional pollutants (CO, PM2.5 and SO2) where data arealso available.
Two indices have been developed to inform the public on two types of pollution expo-sure:
- Background, representing the general situation of the given agglomeration (based onurban background monitoring sites),
35
- Roadside, being representative of city streets with a lot of tra�c, (based on roadsidemonitoring stations).
24.5 Source and Acknowledgement
These indices have been developed under the framework of the Citeair project (Commoninformation to European air) and co-funded by the INTERREG IIIC and INTERREGIVC programs. Those indices are computed based on data provided by partner air qualitysurveillance organisms and are available on the website here.
25 Air Quality (Europe - Citeair/MACC)
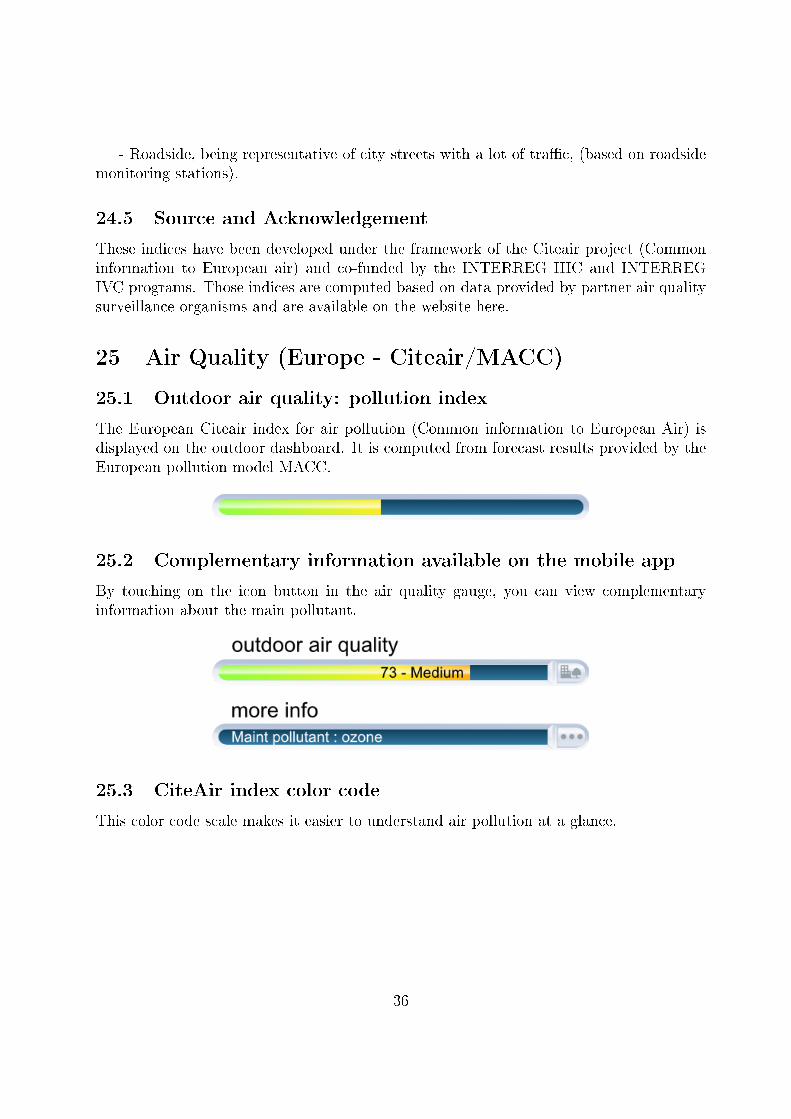
25.1 Outdoor air quality: pollution index
The European Citeair index for air pollution (Common information to European Air) isdisplayed on the outdoor dashboard. It is computed from forecast results provided by theEuropean pollution model MACC.
25.2 Complementary information available on the mobile app
By touching on the icon button in the air quality gauge, you can view complementaryinformation about the main pollutant.
25.3 CiteAir index color code
This color code scale makes it easier to understand air pollution at a glance.
36
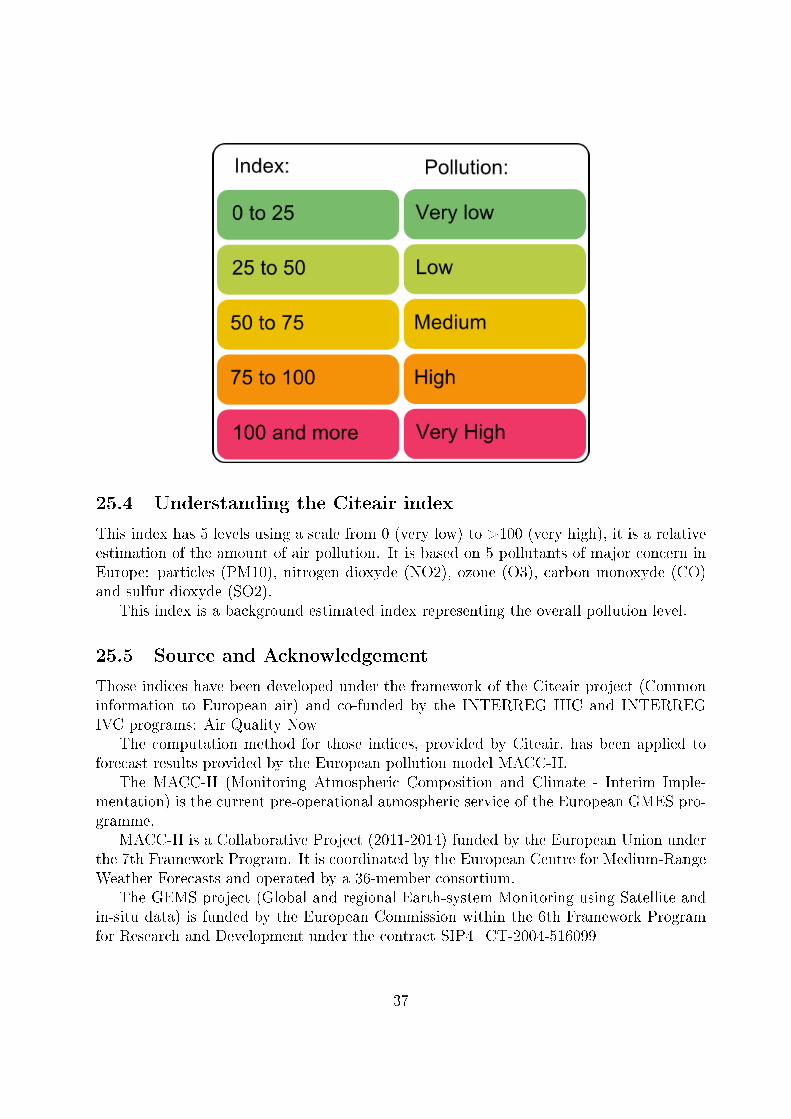
25.4 Understanding the Citeair index
This index has 5 levels using a scale from 0 (very low) to >100 (very high), it is a relativeestimation of the amount of air pollution. It is based on 5 pollutants of major concern inEurope: particles (PM10), nitrogen dioxyde (NO2), ozone (O3), carbon monoxyde (CO)and sulfur dioxyde (SO2).
This index is a background estimated index representing the overall pollution level.
25.5 Source and Acknowledgement
Those indices have been developed under the framework of the Citeair project (Commoninformation to European air) and co-funded by the INTERREG IIIC and INTERREGIVC programs: Air Quality Now
The computation method for those indices, provided by Citeair, has been applied toforecast results provided by the European pollution model MACC-II.
The MACC-II (Monitoring Atmospheric Composition and Climate - Interim Imple-mentation) is the current pre-operational atmospheric service of the European GMES pro-gramme.
MACC-II is a Collaborative Project (2011-2014) funded by the European Union underthe 7th Framework Program. It is coordinated by the European Centre for Medium-RangeWeather Forecasts and operated by a 36-member consortium.
The GEMS project (Global and regional Earth-system Monitoring using Satellite andin-situ data) is funded by the European Commission within the 6th Framework Programfor Research and Development under the contract SIP4_CT-2004-516099
37
26 Air quality (Australia)
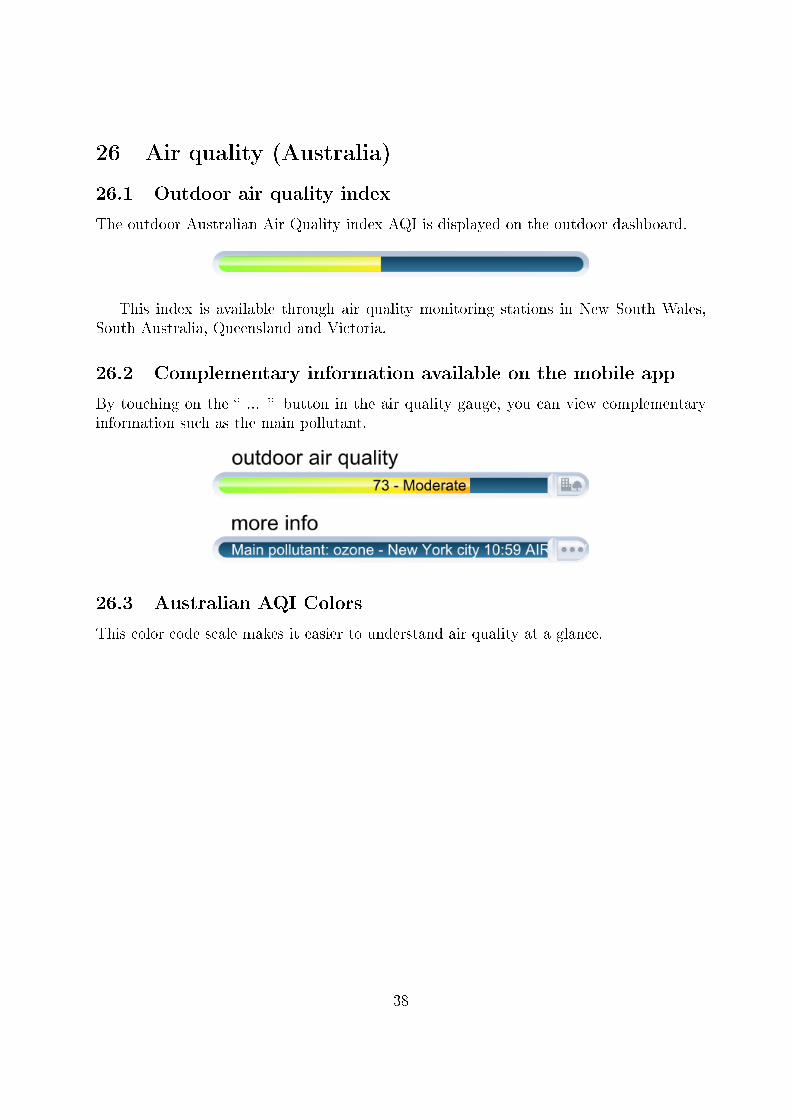
26.1 Outdoor air quality index
The outdoor Australian Air Quality index AQI is displayed on the outdoor dashboard.
This index is available through air quality monitoring stations in New South Wales,South Australia, Queensland and Victoria.
26.2 Complementary information available on the mobile app
By touching on the � ... � button in the air quality gauge, you can view complementaryinformation such as the main pollutant.
26.3 Australian AQI Colors
This color code scale makes it easier to understand air quality at a glance.
38
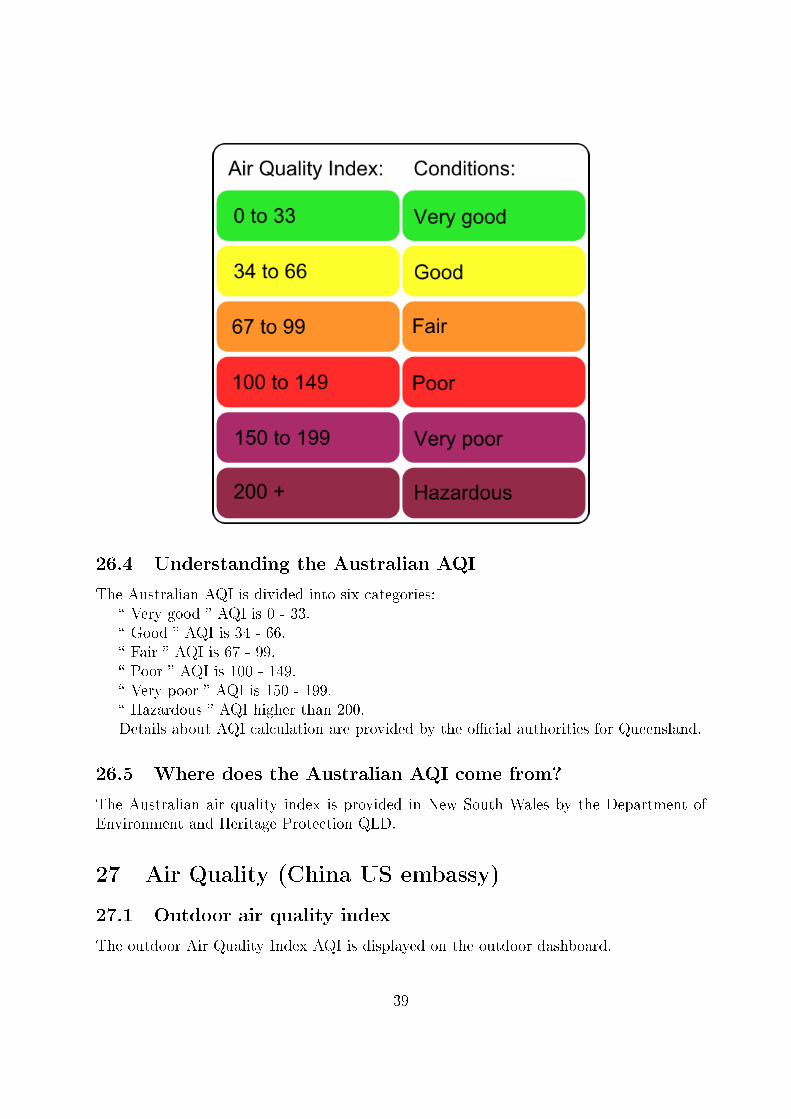
26.4 Understanding the Australian AQI
The Australian AQI is divided into six categories:� Very good � AQI is 0 - 33.� Good � AQI is 34 - 66.� Fair � AQI is 67 - 99.� Poor � AQI is 100 - 149.� Very poor � AQI is 150 - 199.� Hazardous � AQI higher than 200.Details about AQI calculation are provided by the o�cial authorities for Queensland.
26.5 Where does the Australian AQI come from?
The Australian air quality index is provided in New South Wales by the Department ofEnvironment and Heritage Protection QLD.
27 Air Quality (China US embassy)
27.1 Outdoor air quality index
The outdoor Air Quality Index AQI is displayed on the outdoor dashboard.
39
This index is made available by the US embassy's air quality monitoring stations.
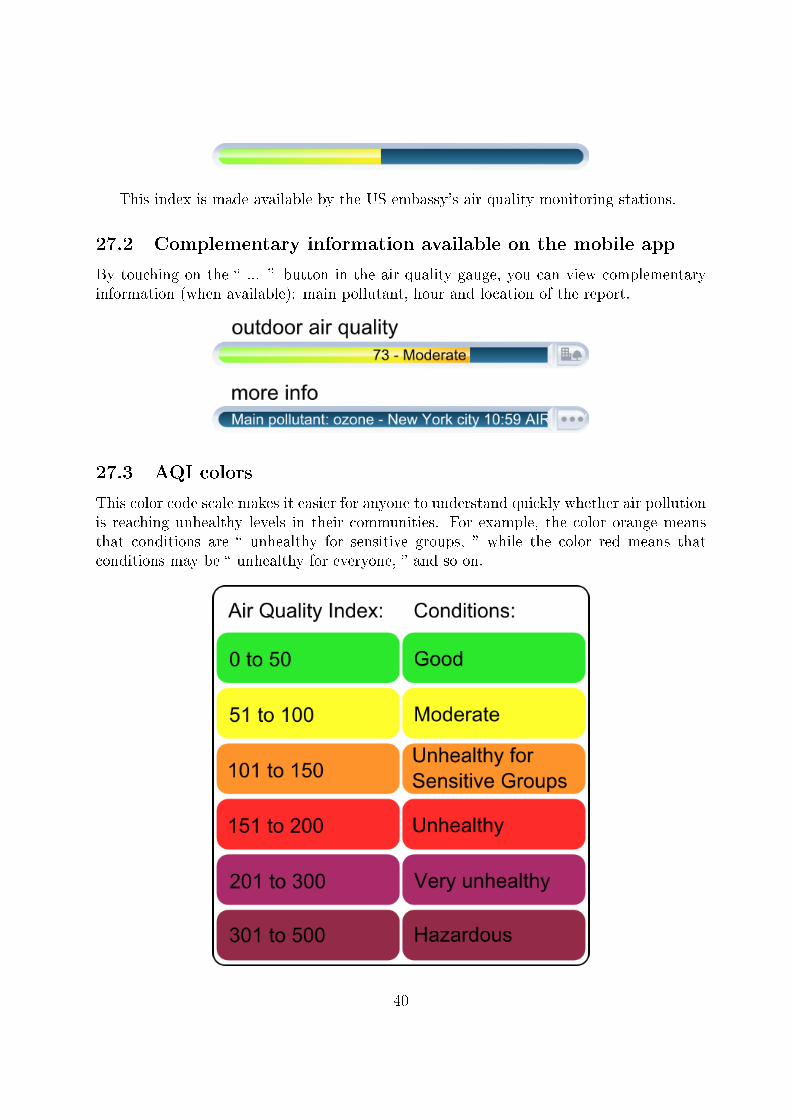
27.2 Complementary information available on the mobile app
By touching on the � ... � button in the air quality gauge, you can view complementaryinformation (when available): main pollutant, hour and location of the report.
27.3 AQI colors
This color code scale makes it easier for anyone to understand quickly whether air pollutionis reaching unhealthy levels in their communities. For example, the color orange meansthat conditions are � unhealthy for sensitive groups, � while the color red means thatconditions may be � unhealthy for everyone, � and so on.
40
27.4 Understanding the AQI
The AQI is divided into six categories:� Good � AQI is 0 - 50. Air quality is considered satisfactory, and air pollution poses
little or no risk.� Moderate � AQI is 51 - 100. Air quality is acceptable; however, for some pollutants
there may be a moderate health concern for a very small number of people. For example,people who are unusually sensitive to ozone may experience respiratory symptoms.
� Unhealthy for Sensitive Groups � AQI is 101 - 150. Although general public is notlikely to be a�ected at this AQI range, people with lung disease, older adults and childrenare at a greater risk from exposure to ozone, whereas persons with heart and lung disease,older adults and children are at greater risk from the presence of particles in the air.
� Unhealthy � AQI is 151 - 200. Everyone may begin to experience some adverse healthe�ects, and members of the sensitive groups may experience more serious e�ects.
� Very Unhealthy � AQI is 201 - 300. This would trigger a health alert signifying thateveryone may experience more serious health e�ects.
� Hazardous � AQI higher than 300. This would trigger a health warning of emergencycondition. The entire population is then more likely to be a�ected.
27.5 Where does the outdoor AQI come from?
The AQI in China is provided by the United States Embassy in Beijing, the US Consulatein Guangzhou and the US Consulate in Shanghai. More information can be found here forGuangzhou.
28 Air Quality (China)
28.1 Outdoor Air Pollution Index
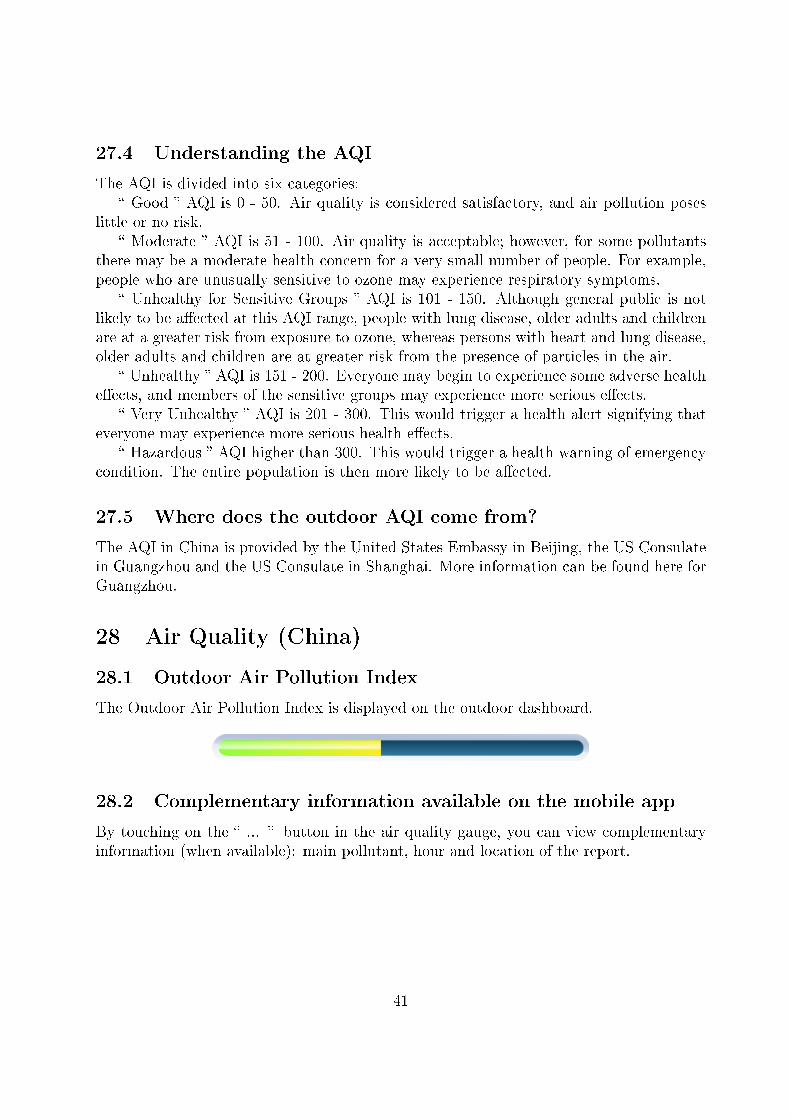
The Outdoor Air Pollution Index is displayed on the outdoor dashboard.
28.2 Complementary information available on the mobile app
By touching on the � ... � button in the air quality gauge, you can view complementaryinformation (when available): main pollutant, hour and location of the report.
41
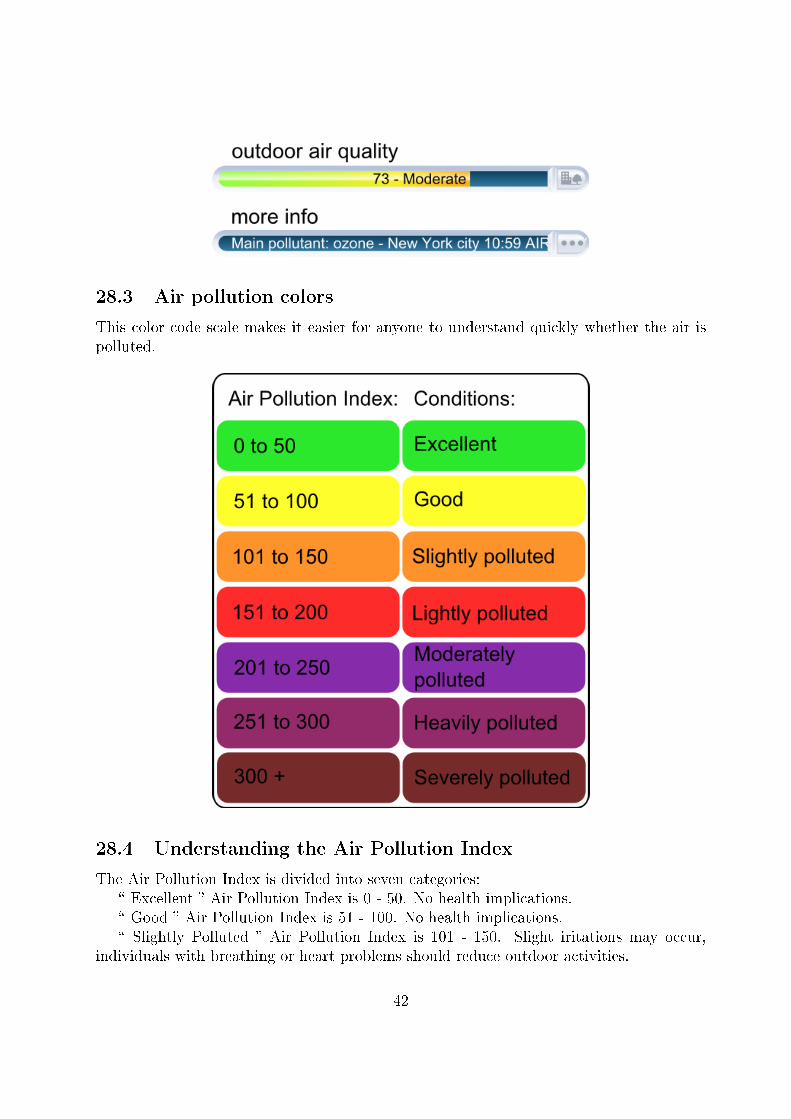
28.3 Air pollution colors
This color code scale makes it easier for anyone to understand quickly whether the air ispolluted.
28.4 Understanding the Air Pollution Index
The Air Pollution Index is divided into seven categories:� Excellent � Air Pollution Index is 0 - 50. No health implications.� Good � Air Pollution Index is 51 - 100. No health implications.� Slightly Polluted � Air Pollution Index is 101 - 150. Slight iritations may occur,
individuals with breathing or heart problems should reduce outdoor activities.
42
� Lightly Polluted � Air Pollution Index is 151 - 200. Slight iritations may occur,individuals with breathing or heart problems should reduce outdoor activities.
� Moderately Polluted � Air Pollution Index is 201 - 250. Healthy people will be notice-ably a�ected. People with breathing or heart problems will experience reduced endurancein activities. These individuals and elders should remain indoors and restrict activities.
� Heavily Polluted � Air Pollution Index is 251 - 300. Healthy people will be noticeablya�ected. People with breathing or heart problems will experience reduced endurance inactivities. These individuals and elders should remain indoors and restrict activities.
� Severely Polluted � Air Pollution Index higher than 300. Healthy people will expe-rience reduced endurance in activities. There may be strong irritations and symptomsand this may trigger other illnesses. Elders and the sick should remain indoors and avoidexercise. Healthy individuals should avoid outdoor activities.
28.5 Where does the outdoor Air Pollution Index come from?
The Air Pollution Index in China is provided by the Ministry of Environmental Protectionof the People's Republic of China. More information can be found here.
29 Air Quality (Hong Kong)
29.1 Outdoor Air Pollution Index (API)
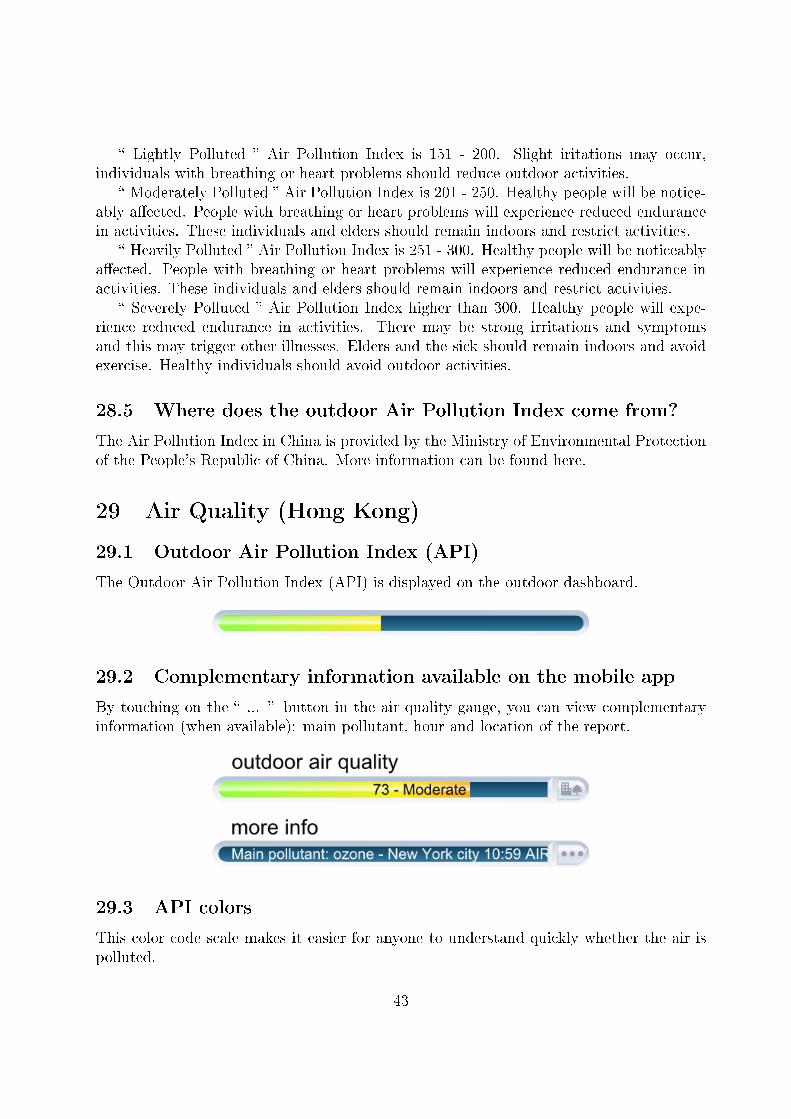
The Outdoor Air Pollution Index (API) is displayed on the outdoor dashboard.
29.2 Complementary information available on the mobile app
By touching on the � ... � button in the air quality gauge, you can view complementaryinformation (when available): main pollutant, hour and location of the report.
29.3 API colors
This color code scale makes it easier for anyone to understand quickly whether the air ispolluted.
43
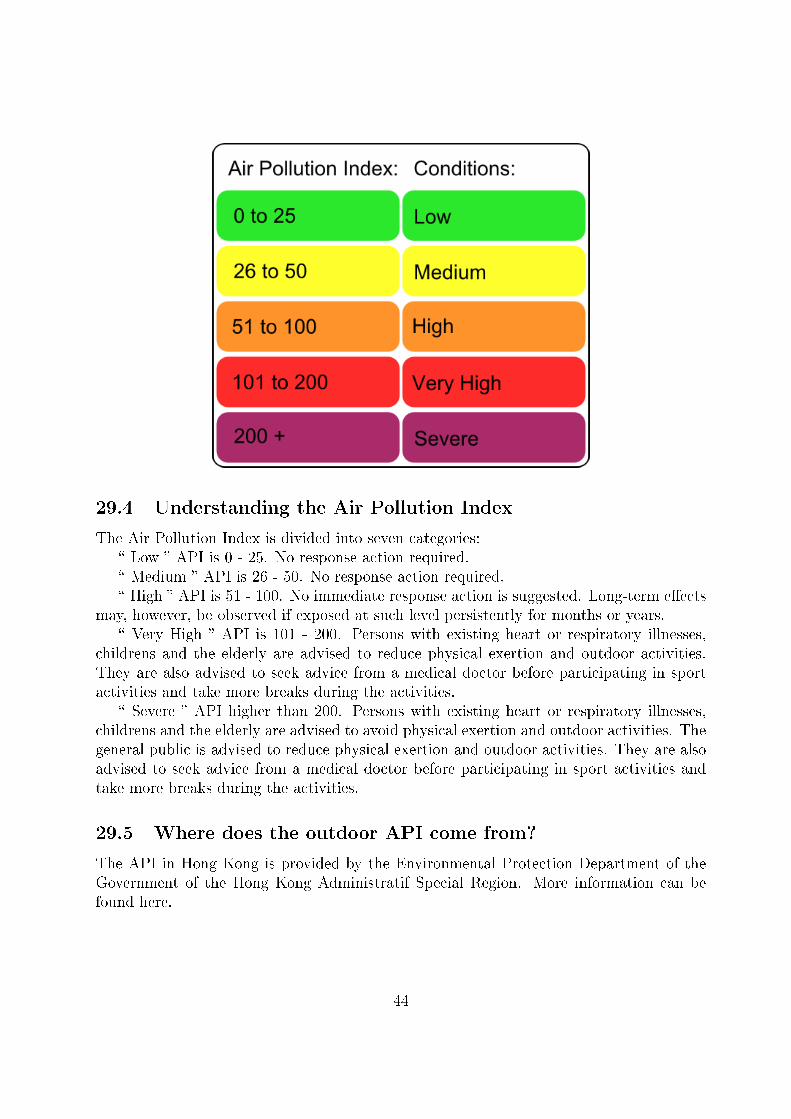
29.4 Understanding the Air Pollution Index
The Air Pollution Index is divided into seven categories:� Low � API is 0 - 25. No response action required.� Medium � API is 26 - 50. No response action required.� High � API is 51 - 100. No immediate response action is suggested. Long-term e�ects
may, however, be observed if exposed at such level persistently for months or years.� Very High � API is 101 - 200. Persons with existing heart or respiratory illnesses,
childrens and the elderly are advised to reduce physical exertion and outdoor activities.They are also advised to seek advice from a medical doctor before participating in sportactivities and take more breaks during the activities.
� Severe � API higher than 200. Persons with existing heart or respiratory illnesses,childrens and the elderly are advised to avoid physical exertion and outdoor activities. Thegeneral public is advised to reduce physical exertion and outdoor activities. They are alsoadvised to seek advice from a medical doctor before participating in sport activities andtake more breaks during the activities.
29.5 Where does the outdoor API come from?
The API in Hong Kong is provided by the Environmental Protection Department of theGovernment of the Hong Kong Administratif Special Region. More information can befound here.
44
30 Air Quality (Japan)
30.1 Outdoor Air Pollution Index (AQI)
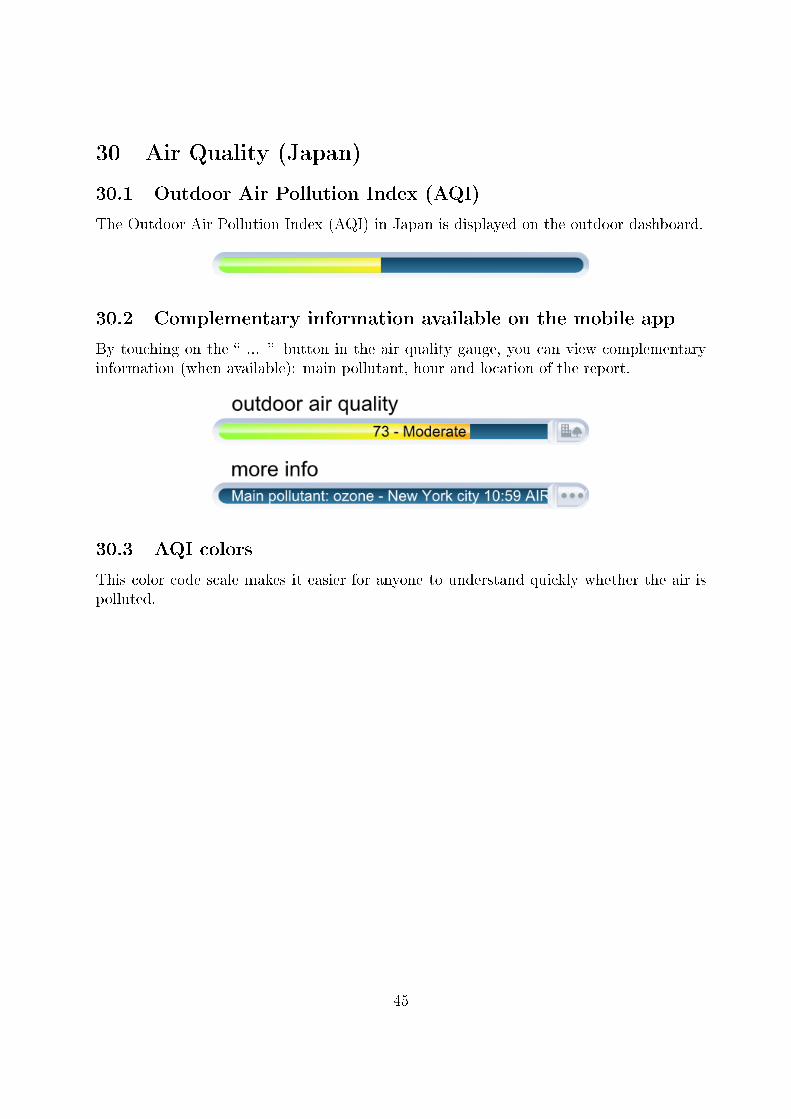
The Outdoor Air Pollution Index (AQI) in Japan is displayed on the outdoor dashboard.
30.2 Complementary information available on the mobile app
By touching on the � ... � button in the air quality gauge, you can view complementaryinformation (when available): main pollutant, hour and location of the report.
30.3 AQI colors
This color code scale makes it easier for anyone to understand quickly whether the air ispolluted.
45
30.4 Understanding the Air Pollution Index
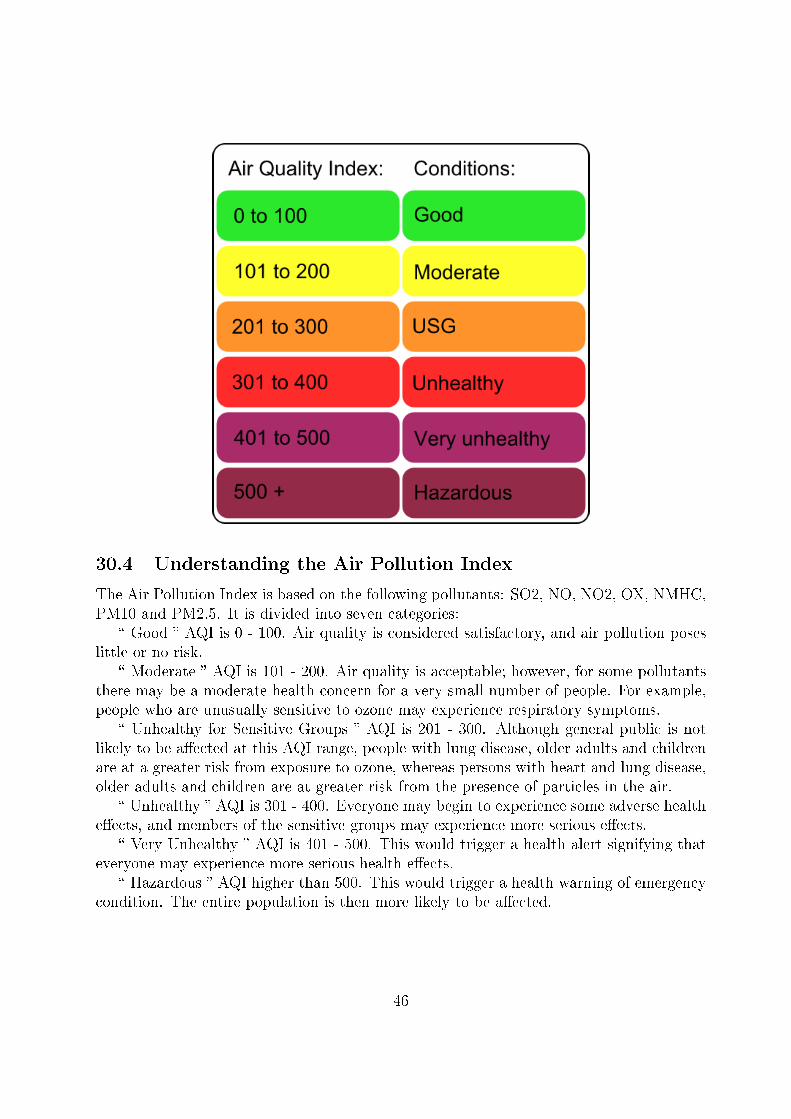
The Air Pollution Index is based on the following pollutants: SO2, NO, NO2, OX, NMHC,PM10 and PM2.5. It is divided into seven categories:
� Good � AQI is 0 - 100. Air quality is considered satisfactory, and air pollution poseslittle or no risk.
� Moderate � AQI is 101 - 200. Air quality is acceptable; however, for some pollutantsthere may be a moderate health concern for a very small number of people. For example,people who are unusually sensitive to ozone may experience respiratory symptoms.
� Unhealthy for Sensitive Groups � AQI is 201 - 300. Although general public is notlikely to be a�ected at this AQI range, people with lung disease, older adults and childrenare at a greater risk from exposure to ozone, whereas persons with heart and lung disease,older adults and children are at greater risk from the presence of particles in the air.
� Unhealthy � AQI is 301 - 400. Everyone may begin to experience some adverse healthe�ects, and members of the sensitive groups may experience more serious e�ects.
� Very Unhealthy � AQI is 401 - 500. This would trigger a health alert signifying thateveryone may experience more serious health e�ects.
� Hazardous � AQI higher than 500. This would trigger a health warning of emergencycondition. The entire population is then more likely to be a�ected.
46
30.5 Where does the outdoor AQI in Japan come from?
The AQI in Japan is based on Air Pollution data provided by the Atmospheric Environ-mental Regional Observation System : AEROS. This Air Pollution data is summed-up as acomprehensive Air Quality Index (AQI) using formulae similar to American and Europeanstandard formulae. The Air Pollution data can be found here.
31 Air Quality (Taiwan)
31.1 Outdoor Pollutant Standards Index (PSI)
The Pollutant Standards Index (PSI) in Taiwan is displayed on the outdoor dashboard.
31.2 Complementary information available on the mobile app
By touching on the � ... � button in the air quality gauge, you can view complementaryinformation (when available): main pollutant, hour and location of the report.
31.3 PSI colors
This color code scale makes it easier for anyone to understand quickly whether the air ispolluted.
47
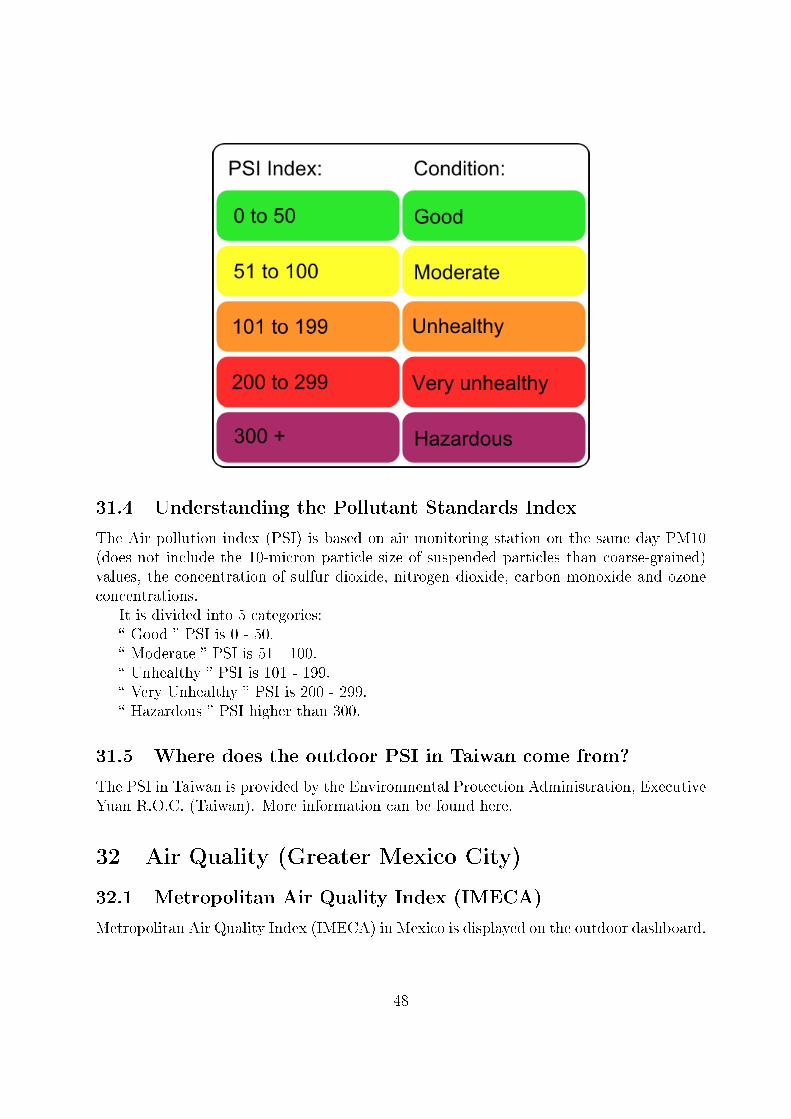
31.4 Understanding the Pollutant Standards Index
The Air pollution index (PSI) is based on air monitoring station on the same day PM10(does not include the 10-micron particle size of suspended particles than coarse-grained)values, the concentration of sulfur dioxide, nitrogen dioxide, carbon monoxide and ozoneconcentrations.
It is divided into 5 categories:� Good � PSI is 0 - 50.� Moderate � PSI is 51 - 100.� Unhealthy � PSI is 101 - 199.� Very Unhealthy � PSI is 200 - 299.� Hazardous � PSI higher than 300.
31.5 Where does the outdoor PSI in Taiwan come from?
The PSI in Taiwan is provided by the Environmental Protection Administration, ExecutiveYuan R.O.C. (Taiwan). More information can be found here.
32 Air Quality (Greater Mexico City)
32.1 Metropolitan Air Quality Index (IMECA)
Metropolitan Air Quality Index (IMECA) in Mexico is displayed on the outdoor dashboard.
48
32.2 Complementary information available on the mobile app
By touching on the � ... � button in the air quality gauge, you can view complementaryinformation (when available): main pollutant, hour and location of the report.
32.3 IMECA colors
This color code scale makes it easier for anyone to understand quickly whether the air ispolluted.
32.4 Understanding the IMECA index
The IMECA index is calculated using the Air Quality measurements by SIMAT (Sistemade Monitoreo Atmosférico de la Ciudad de México). The IMECA is calculated usingaveraged measurements of ozone (O3), sulphur dioxide (SO2), nitrogen dioxide (NO2),carbon monoxide (CO) and particles lower than 10 micrometers (PM10).
49
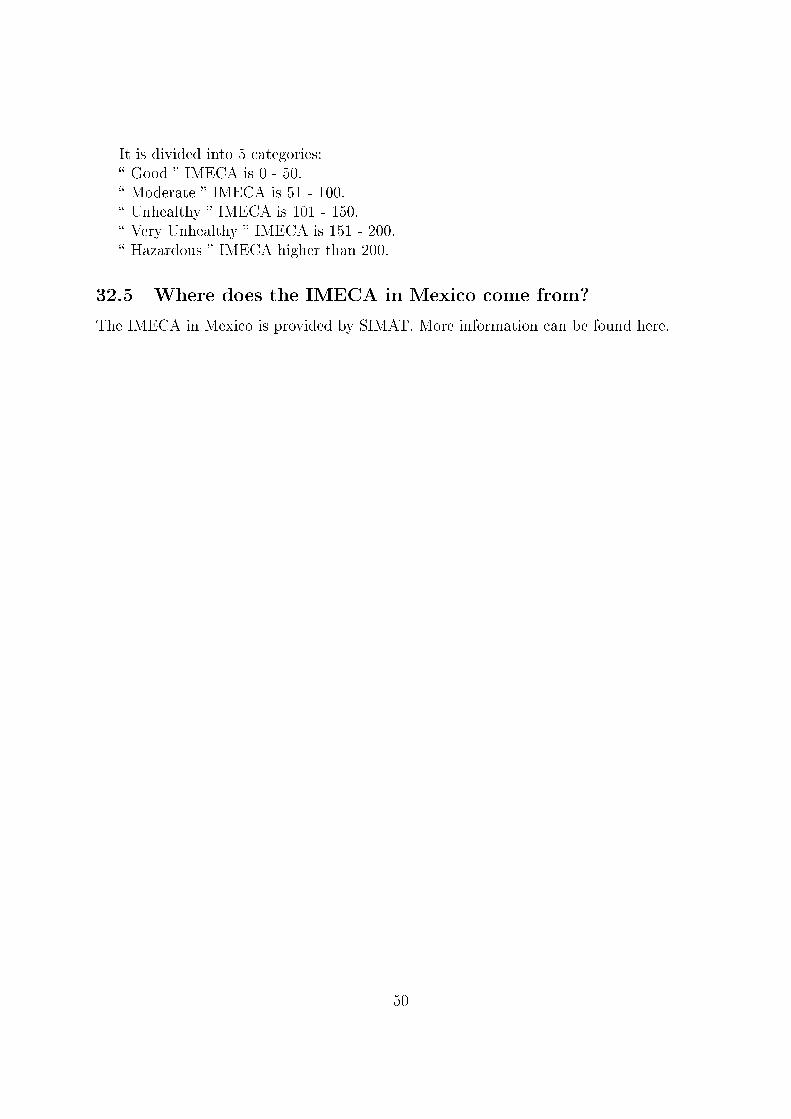
It is divided into 5 categories:� Good � IMECA is 0 - 50.� Moderate � IMECA is 51 - 100.� Unhealthy � IMECA is 101 - 150.� Very Unhealthy � IMECA is 151 - 200.� Hazardous � IMECA higher than 200.
32.5 Where does the IMECA in Mexico come from?
The IMECA in Mexico is provided by SIMAT. More information can be found here.
50