Embed Size (px)
Citation preview

Page 1
Net Impact of Workforce Programs Report to the Legislature January 2017
Total cost of salaries, printing, and supplies in developing/preparing this
report is $54,487 (reported as required by MS. 3.197).

Page 2
Executive summary This report estimates the net impact on earnings from participation in a workforce program and derives
cost/benefit estimates of those programs to taxpayers and society as a whole. It uses the methodology
and cost framework developed through the consensus of experts in the field convened by the
Governor’s Workforce Development Board’s Net Impact Advisory Group (active from 2009 to 2014).1
– Compared to observationally similar job seekers who were not engaged in any workforce
program, participants in the Dislocated Worker, WIA Adult (now WIOA Adult), and FastTRAC
programs tend to see substantial earnings increases.
- This result is driven by strong increases in employment among participants, suggesting
that program participation helps job seekers find work quicker than they otherwise
would have.
- Dislocated Worker participants not only get employed faster but, compared to similar
job seekers who found employment quickly, earn more in the long term.
– The Great Recession (December 2007 to June 2009) is likely a major force in the different
impacts across cohorts in the Dislocated Worker and WIA Adult programs. It appears that the
external economic landscape has a significant role in shaping the extent to which these
workforce programs impact participant outcomes.
1 A complete history of this project can be found in the pilot report, available on DEED’s Net Impact project page.
$29,518
$47,393
($45,660)
$12,259
$21,425
($3,799)
$19,998
DislocatedWorker(2007)
DislocatedWorker(2009)
DislocatedWorker(2012)
WIA Adult(2007)
WIA Adult(2009)
WIA Adult(2012)
FastTRAC(2012)
Figure 1. Total net earnings impact over the first three years of program participation

Page 3
– Participants in each cohort across programs see a small but significant increase in cash
assistance and public healthcare coverage, likely due to a combination of income loss and
direct referrals from program counselors. This increase trends downward through the follow-up
period, suggestive of more participants achieving self-sufficiency.
– For most cohorts in all programs in this study, the monetary benefits outweigh the costs. This
is true when taking into account not just the cost of the programs themselves, but the cost of
increased public benefit usage among participants and the benefit of increased tax revenue
when participants see a higher income as a result of participation.
- This result of benefits outweighing costs is driven by net increases in earnings, on
average, among participants.
- From the taxpayer perspective, the increase in the tax base due to these higher earnings
more than pays for the cost of these programs. Where participants do not see higher
earnings, the cost calculation will remain negative, as is true for the 2012 Dislocated
Worker and WIA Adult cohorts.
- In general, where program benefits do outweigh the costs, they do so within two to
three years.
$13,819
$18,872
($12,710)
$1,571 $3,100
($5,606)
$1,699
($15,000)
($10,000)
($5,000)
$0
$5,000
$10,000
$15,000
$20,000
$25,000
Year 1 Year 2 Year 3 Year 4 Year 5
Figure 2. Net monetary costs (-) and benefits (+) to Minnesota taxpayers through time, per participant
Dislocated Worker (2007)
Dislocated Worker (2009)
Dislocated Worker (2012)
WIA Adult (2007)
WIA Adult (2009)
WIA Adult (2012)
FastTRAC (2012)
Page 4
History, scope, and methodology Minnesota has been engaged in measuring the net impact of workforce development programs since
2009, with the passage of an updated performance measures statute. The Governor’s Workforce
Development Council (now Governor’s Workforce Development Board) led a Return on Investment
Initiative to establish an agreed-upon methodology, publishing the first results in the pilot report Smart
Investments, Real Results in January 2015.
Since January 2015, this project has been institutionalized in the Office of Policy within the Department
of Employment and Economic Development, which will publish ongoing updates every four years. The
external evaluator, Professor Raymond Robertson of the Bush School of Government and Public Service
at Texas A&M University, has remained engaged with the project through its move within the agency.
As that pilot report noted, the key questions answered by a net impact analysis are “what works?” and
“who is impacted?”.
The results presented in that pilot report are both updated and extended in this report, which includes
for the first time an analysis of the state’s career pathways program FastTRAC, an analysis of program
effects specific to training engagement, and an analysis of program costs and benefits.
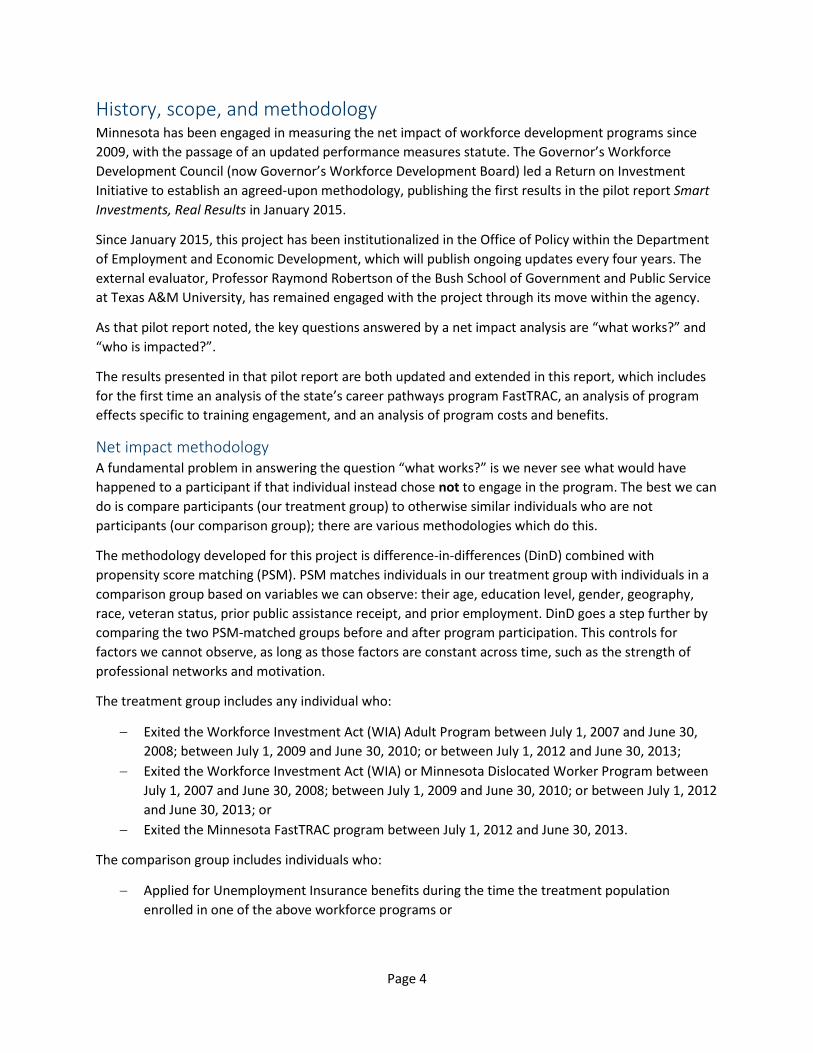
Net impact methodology A fundamental problem in answering the question “what works?” is we never see what would have
happened to a participant if that individual instead chose not to engage in the program. The best we can
do is compare participants (our treatment group) to otherwise similar individuals who are not
participants (our comparison group); there are various methodologies which do this.
The methodology developed for this project is difference-in-differences (DinD) combined with
propensity score matching (PSM). PSM matches individuals in our treatment group with individuals in a
comparison group based on variables we can observe: their age, education level, gender, geography,
race, veteran status, prior public assistance receipt, and prior employment. DinD goes a step further by
comparing the two PSM-matched groups before and after program participation. This controls for
factors we cannot observe, as long as those factors are constant across time, such as the strength of
professional networks and motivation.
The treatment group includes any individual who:
Exited the Workforce Investment Act (WIA) Adult Program between July 1, 2007 and June 30,
2008; between July 1, 2009 and June 30, 2010; or between July 1, 2012 and June 30, 2013;
Exited the Workforce Investment Act (WIA) or Minnesota Dislocated Worker Program between
July 1, 2007 and June 30, 2008; between July 1, 2009 and June 30, 2010; or between July 1, 2012
and June 30, 2013; or
Exited the Minnesota FastTRAC program between July 1, 2012 and June 30, 2013.
The comparison group includes individuals who:
Applied for Unemployment Insurance benefits during the time the treatment population
enrolled in one of the above workforce programs or
Page 5
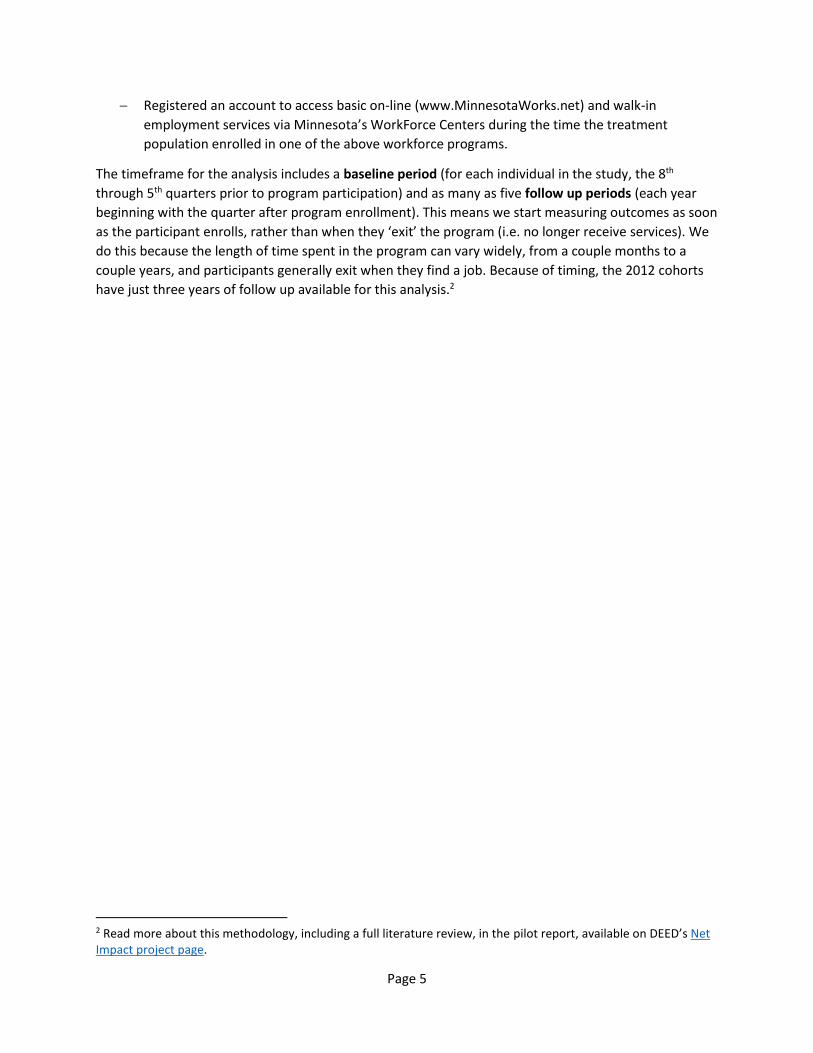
Registered an account to access basic on-line (www.MinnesotaWorks.net) and walk-in
employment services via Minnesota’s WorkForce Centers during the time the treatment
population enrolled in one of the above workforce programs.
The timeframe for the analysis includes a baseline period (for each individual in the study, the 8th
through 5th quarters prior to program participation) and as many as five follow up periods (each year
beginning with the quarter after program enrollment). This means we start measuring outcomes as soon
as the participant enrolls, rather than when they ‘exit’ the program (i.e. no longer receive services). We
do this because the length of time spent in the program can vary widely, from a couple months to a
couple years, and participants generally exit when they find a job. Because of timing, the 2012 cohorts
have just three years of follow up available for this analysis.2
2 Read more about this methodology, including a full literature review, in the pilot report, available on DEED’s Net Impact project page.
Page 6
Programs studied The three programs in this analysis represent very different service models and target populations. This
section describes each program.
Dislocated Worker The Dislocated Worker Program is available to any person who lost their job through no fault of their
own and is unlikely to be able to find work in that same industry or occupation due to declining
employment opportunities. The program is designed to help participants transfer their skills to a new
industry or occupation and get back to work quickly. A federal program, the Dislocated Worker Program
is supplemented with significant state dollars in Minnesota, roughly doubling the number of participants
served.
To be eligible, an individual typically must qualify for Unemployment Insurance (although the program
does not serve temporary or seasonal workers, who make up a large portion of Unemployment
Insurance recipients). In addition to these individuals, the following groups are eligible for Dislocated
Worker services in Minnesota:
Self-employed individuals who lose their jobs due to economic conditions;
Veterans leaving active duty with the armed forces; and
Certain individuals leaving active duty of the National Guard or armed forces reserves.
Recruitment for the program occurs through the state’s 48 WorkForce Centers and nine independent
service providers. For mass layoffs affecting 50 or more workers, recruitment often occurs directly on
the worksite with the employer’s cooperation. The Dislocated Worker Program operates seamlessly with
another federal program, Trade Adjustment Assistance, which provides extra funding for workers laid
off due to negative trade impacts.
Dislocated Worker and WIA Adult (below) provide the same set of program services:
1. Career Planning and Counseling: Professionally trained and experienced counselors help
customers assess skills, develop career paths, and set job goals.
2. Job Search and Placement Services: Counselor and program staff provide job search tools,
networking clubs, and workshops on everything from resume building to interview skills.
3. Job Training: Counselors and program staff help customers use funding proactively to develop
occupational skills training, on-the-job training, entrepreneurial support, adult basic education,
and other types of training.
4. Financial Support Services: The program has the ability to support its customers through tough
financial times by assisting with transportation costs, family care costs, health care costs, or
other emergency aid workers may need to reach their employment goals.
WIA Adult The WIA Title IB Adult program3 provides the program services listed above to adults who face
significant barriers to employment. While eligibility is broad, priority of service is given to those
3 In 2014, the Workforce Investment Act (WIA) was replaced by new legislation, the Workforce Innovation and Opportunity Act (WIOA). Both the Title IB Adult and Dislocated Worker programs survive largely unchanged under WIOA.

Page 7
receiving public assistance, low-income individuals, and veterans. Recruitment for the program occurs
through the state’s 48 WorkForce Centers.
FastTRAC FastTRAC Adult Career Pathways is a state initiative that partnered the Department of Employment and
Economic Development (DEED), Adult Basic Education, Minnesota State Colleges and Universities
(MnSCU), local employers, and community-based organizations. FastTRAC was first developed as a
career pathways system between 2008 and 2011 and has been refined over the years. 4 The State
currently funds career pathways through the Pathways to Prosperity program.5 The target population of
this program is adults with low educational attainment, and the program aims to place them in well-
paying careers with the potential for upward mobility.
FastTRAC participants in this analysis received three key components:
Contextualized instruction, meaning participants receive career-specific training as well as the
adult basic education they need to succeed in those courses.
Career development, including career assessment and job placement.
Support services and navigation, meaning participants can get help in both tangible and non-
tangible ways as they re-enter the education system, such as with transportation vouchers or
building self-esteem.
Recruitment into FastTRAC occurred from multiple different channels, including students already
enrolled in community college, participants of other workforce development programs (including WIA
Adult, Minnesota Family Investment Program (MFIP), and Vocational Rehabilitation), and general
outreach to the local community.
Unlike Dislocated Worker and WIA Adult, FastTRAC’s program model involves all participants engaging in
training, generally with both college coursework and ABE instruction.
Common aspects Despite their differences, the three programs in this analysis do share some key commonalities with
implications for this analysis.
Within each program, participation is a two-way selection process. That is, participants have to want to
engage in the program, and program staff have to approve the activities of participants. This is
important because of what economists term “selection bias”, which can lead to misleading results if the
participants studied are not representative of all participants.
This is especially true for program participants engaging in training: training activities are subject to
approval based on funding availability, labor market justification, and fit with the participant’s skills and
abilities. Ultimately, participants who engage in training may not be representative of all program
participants if they have more motivation, ability, or other traits valued in the workplace than
4 More information on the history and implementation of FastTRAC is available in the FastTRAC Implementation Study and the Shifting Gears Evaluation Report. 5 More information on Pathways to Prosperity is available on DEED’s website.
Page 8
participants who do not engage in training. Without controlling for selection bias, we could wrongly
attribute to training the positive labor market outcomes associated with motivation.
Our methodology controls for selection bias both by matching participants to observationally similar
non-participants, based on race, gender, educational attainment, etc., and by tracking individuals
through time. Tracking individuals through time effectively controls for traits we cannot observe (such
as motivation and ability) as long as those traits are constant through time.
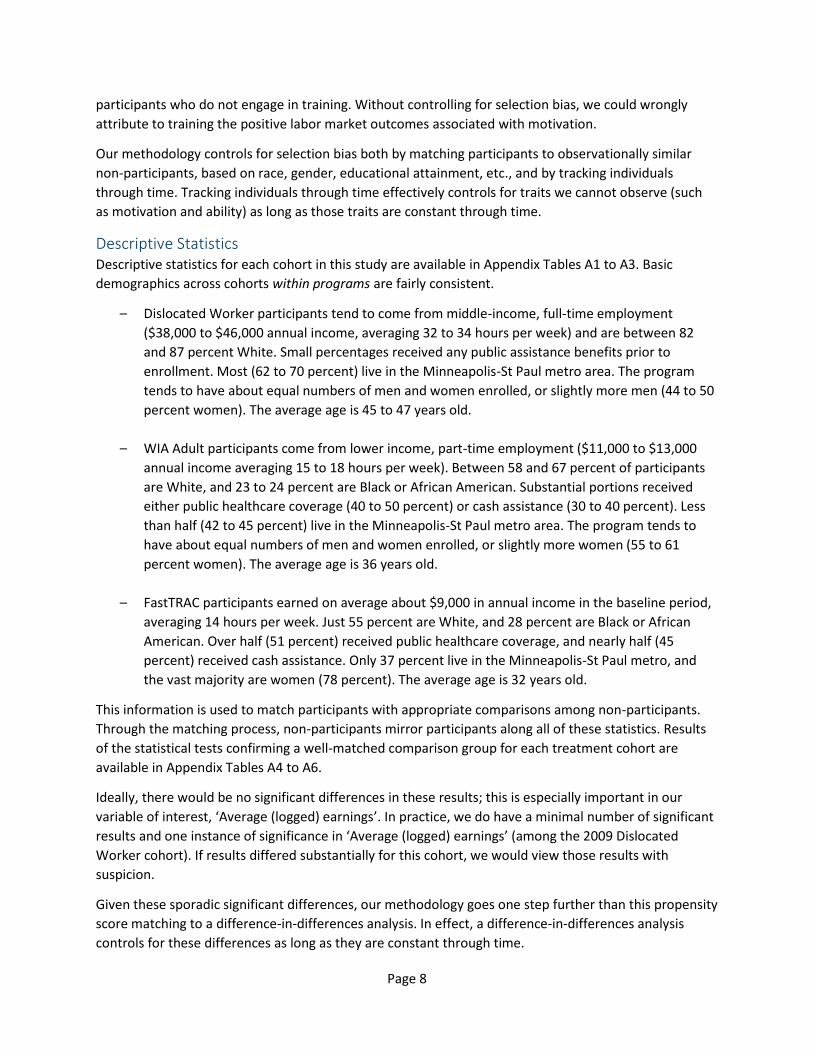
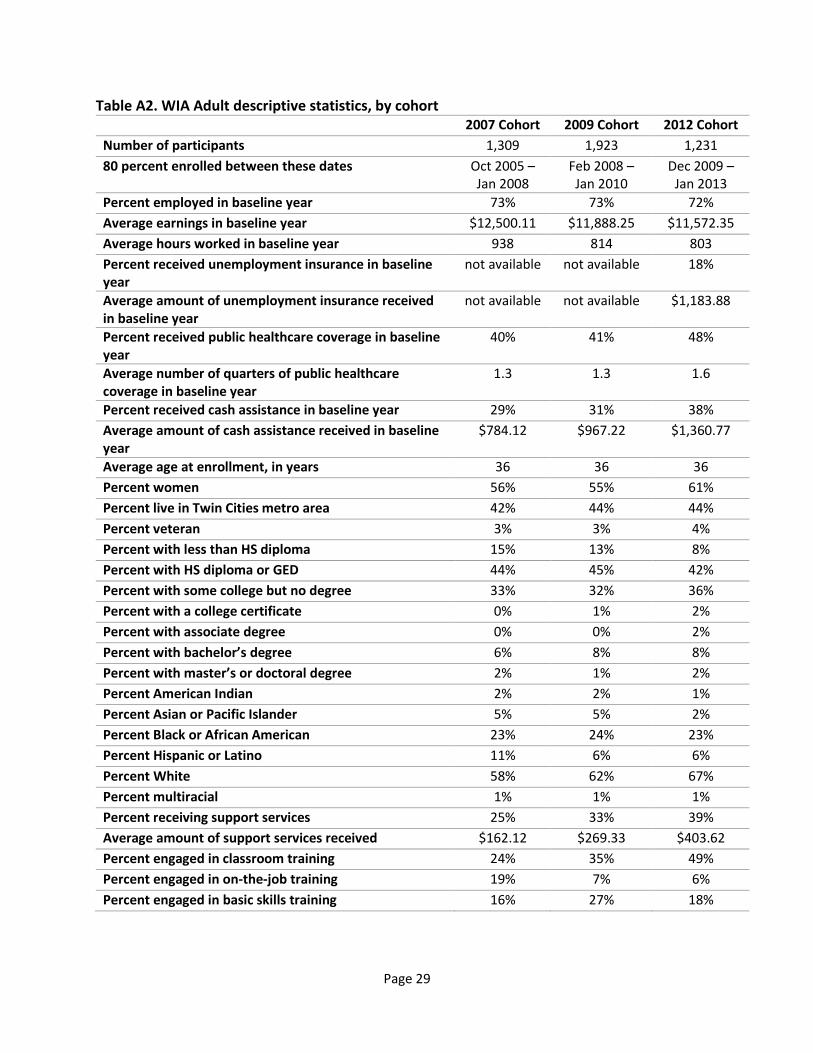
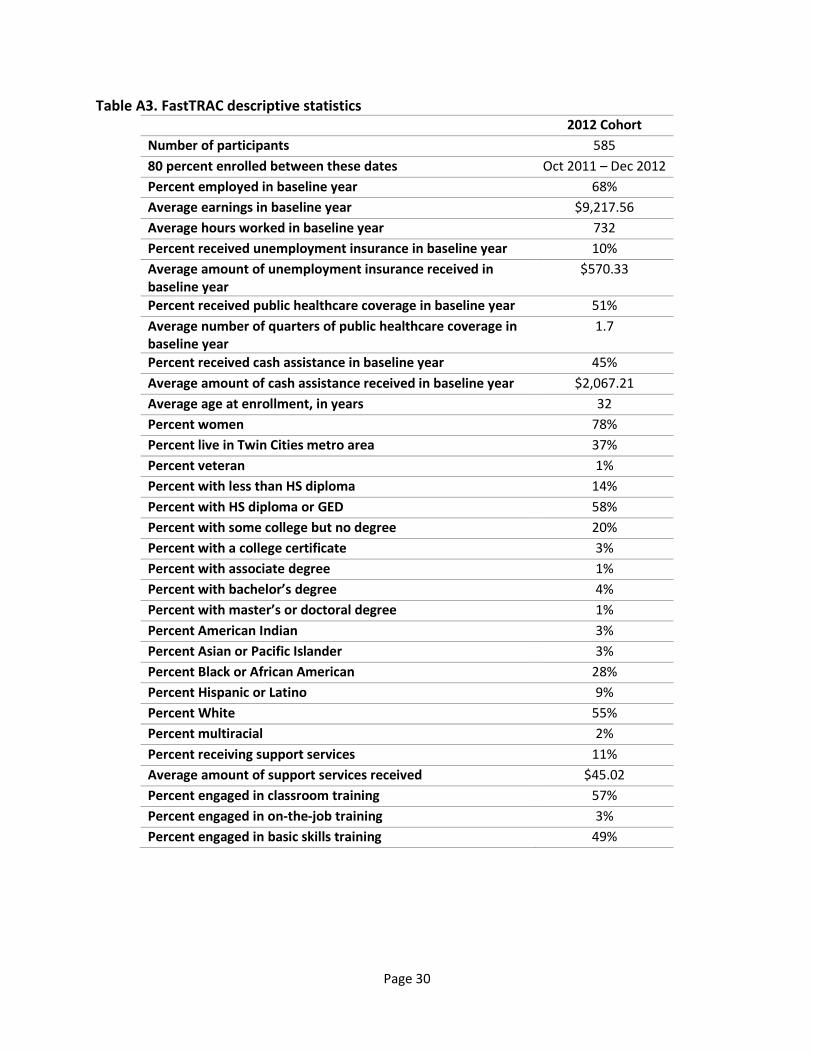
Descriptive Statistics Descriptive statistics for each cohort in this study are available in Appendix Tables A1 to A3. Basic
demographics across cohorts within programs are fairly consistent.
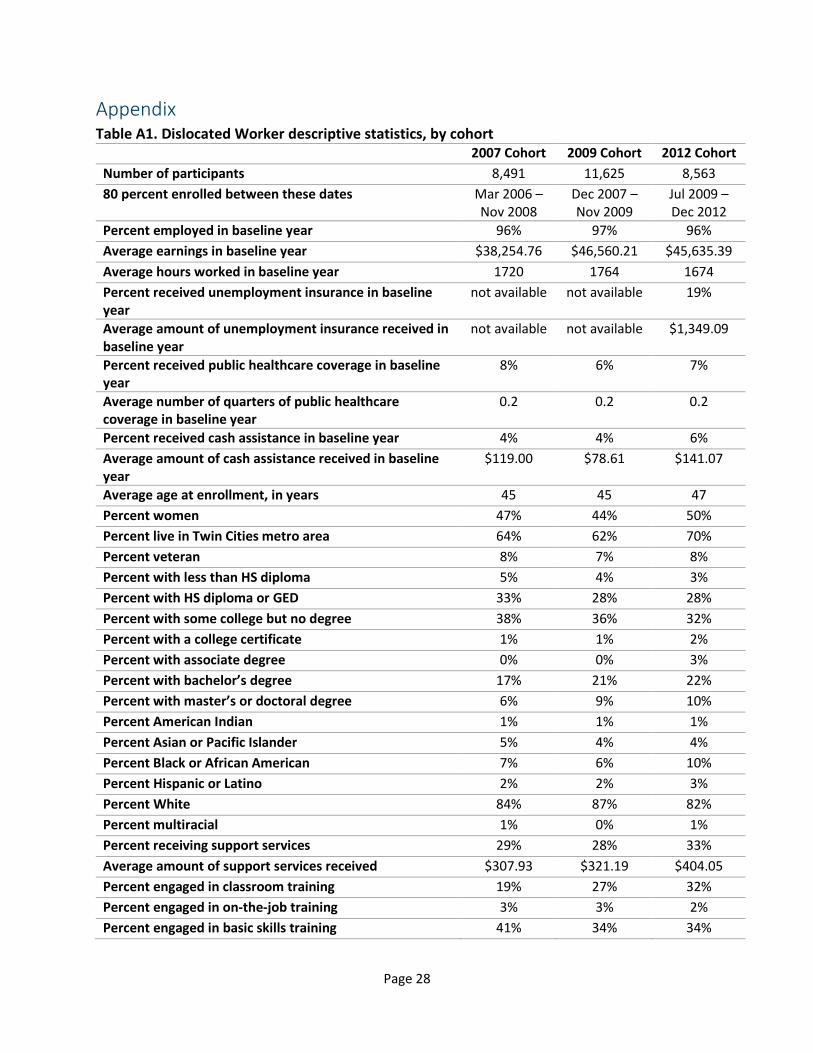
– Dislocated Worker participants tend to come from middle-income, full-time employment
($38,000 to $46,000 annual income, averaging 32 to 34 hours per week) and are between 82
and 87 percent White. Small percentages received any public assistance benefits prior to
enrollment. Most (62 to 70 percent) live in the Minneapolis-St Paul metro area. The program
tends to have about equal numbers of men and women enrolled, or slightly more men (44 to 50
percent women). The average age is 45 to 47 years old.
– WIA Adult participants come from lower income, part-time employment ($11,000 to $13,000
annual income averaging 15 to 18 hours per week). Between 58 and 67 percent of participants
are White, and 23 to 24 percent are Black or African American. Substantial portions received
either public healthcare coverage (40 to 50 percent) or cash assistance (30 to 40 percent). Less
than half (42 to 45 percent) live in the Minneapolis-St Paul metro area. The program tends to
have about equal numbers of men and women enrolled, or slightly more women (55 to 61
percent women). The average age is 36 years old.
– FastTRAC participants earned on average about $9,000 in annual income in the baseline period,
averaging 14 hours per week. Just 55 percent are White, and 28 percent are Black or African
American. Over half (51 percent) received public healthcare coverage, and nearly half (45
percent) received cash assistance. Only 37 percent live in the Minneapolis-St Paul metro, and
the vast majority are women (78 percent). The average age is 32 years old.
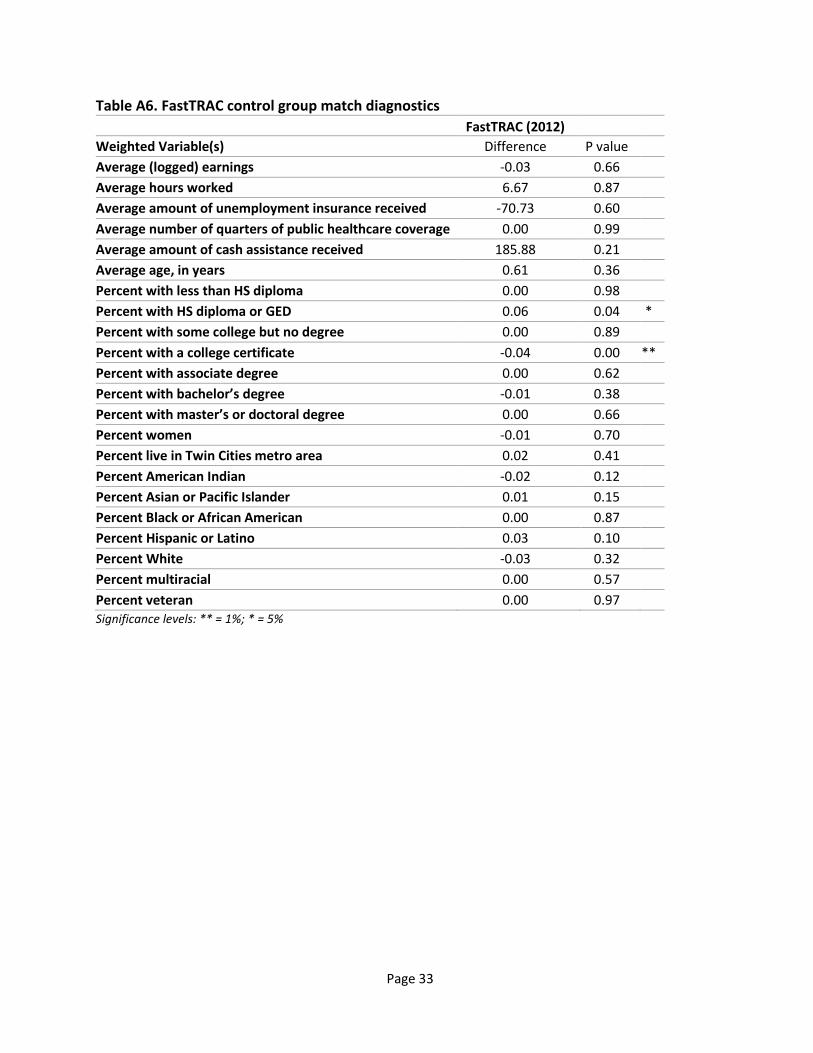
This information is used to match participants with appropriate comparisons among non-participants.
Through the matching process, non-participants mirror participants along all of these statistics. Results
of the statistical tests confirming a well-matched comparison group for each treatment cohort are
available in Appendix Tables A4 to A6.
Ideally, there would be no significant differences in these results; this is especially important in our
variable of interest, ‘Average (logged) earnings’. In practice, we do have a minimal number of significant
results and one instance of significance in ‘Average (logged) earnings’ (among the 2009 Dislocated
Worker cohort). If results differed substantially for this cohort, we would view those results with
suspicion.
Given these sporadic significant differences, our methodology goes one step further than this propensity
score matching to a difference-in-differences analysis. In effect, a difference-in-differences analysis
controls for these differences as long as they are constant through time.

Page 9
For example, Table A4 shows that the 2009 Dislocated Worker cohort earns less than the corresponding
comparison group, and that this difference is significant. The difference-in-differences analysis will
assume this earnings differential is constant across time and will only pick up increases or decreases
from there.
Page 10
Net Impact Results This section provides descriptive statistics on the treatment and comparison groups and presents net
impact results for each cohort.
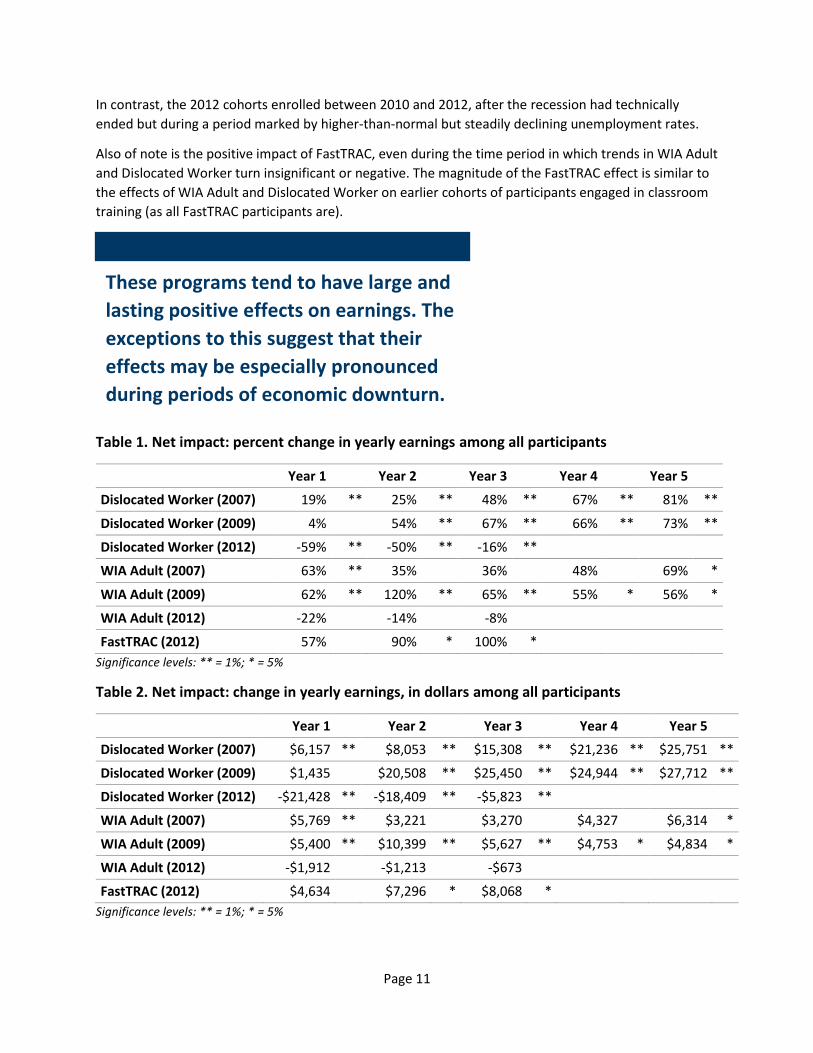
Net impact on earnings This section contains the main results of this analysis: the net impact on participant earnings. This is
expressed both as a percentage change relative to the baseline year (Table 1) and in corresponding
dollar amounts specific to those cohorts’ baseline earnings (Table 2).
For example, participants in the 2007 Dislocated Worker cohort are estimated to have earned 19
percent more in the first year after enrollment than if they had not participated.
In line with similar studies, the net impact methodology removes from the analysis those participants
who had no earnings in the baseline period. This ensures that we are removing any participant from the
sample who may have no earnings in the follow up periods because of an erroneous linkage between
participant data and employment data. For each cohort, the same set of participants are compared
before and after program participation, including those who are unemployed after participation.
In general, these programs have large and lasting positive effects on earnings. The exceptions to this are
the most recent, post-recession cohorts of WIA Adult and Dislocated Worker, suggesting that these
programs may be especially effective during periods of economic downturn, or that they increase
participants’ resiliency through recessions. See What could explain the business cycle effects in these
results? for a fuller discussion.
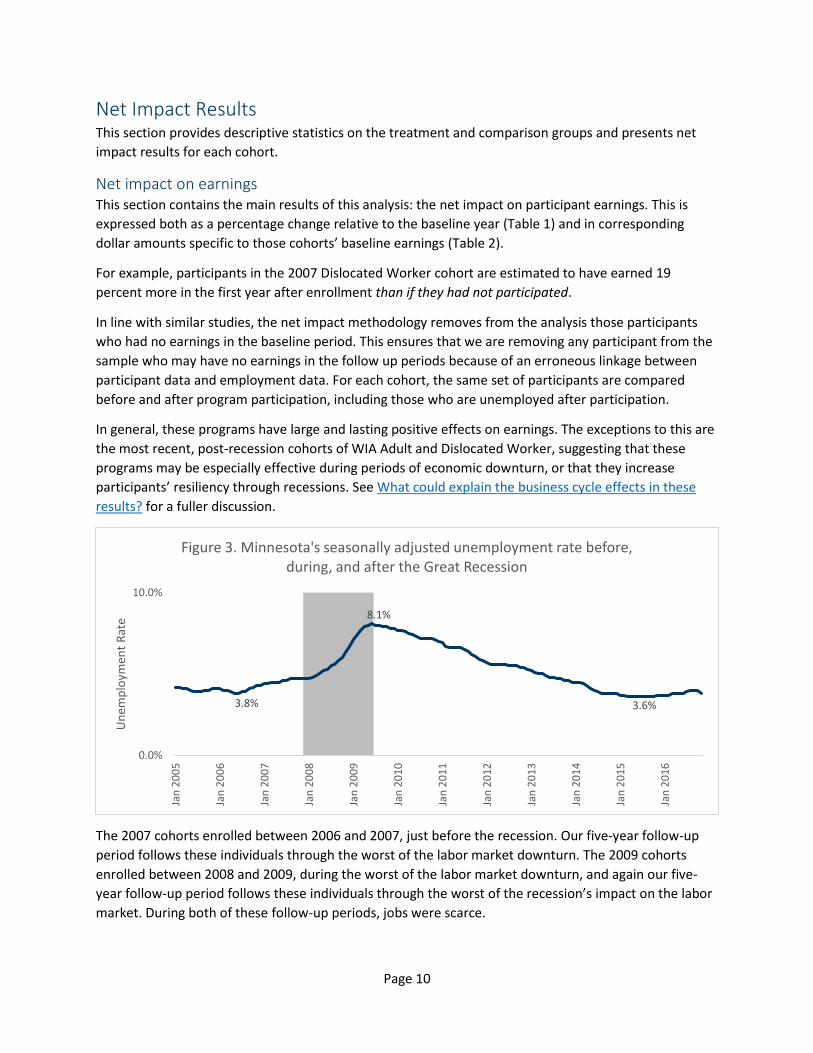
The 2007 cohorts enrolled between 2006 and 2007, just before the recession. Our five-year follow-up
period follows these individuals through the worst of the labor market downturn. The 2009 cohorts
enrolled between 2008 and 2009, during the worst of the labor market downturn, and again our five-
year follow-up period follows these individuals through the worst of the recession’s impact on the labor
market. During both of these follow-up periods, jobs were scarce.
3.8%
8.1%
3.6%
0.0%
10.0%
Jan
20
05
Jan
20
06
Jan
20
07
Jan
20
08
Jan
20
09
Jan
20
10
Jan
20
11
Jan
20
12
Jan
20
13
Jan
20
14
Jan
20
15
Jan
20
16
Un
emp
loym
ent
Rat
e
Figure 3. Minnesota's seasonally adjusted unemployment rate before, during, and after the Great Recession
Page 11
In contrast, the 2012 cohorts enrolled between 2010 and 2012, after the recession had technically
ended but during a period marked by higher-than-normal but steadily declining unemployment rates.
Also of note is the positive impact of FastTRAC, even during the time period in which trends in WIA Adult
and Dislocated Worker turn insignificant or negative. The magnitude of the FastTRAC effect is similar to
the effects of WIA Adult and Dislocated Worker on earlier cohorts of participants engaged in classroom
training (as all FastTRAC participants are).
Table 1. Net impact: percent change in yearly earnings among all participants
Year 1 Year 2 Year 3 Year 4 Year 5
Dislocated Worker (2007) 19% ** 25% ** 48% ** 67% ** 81% **
Dislocated Worker (2009) 4% 54% ** 67% ** 66% ** 73% **
Dislocated Worker (2012) -59% ** -50% ** -16% **
WIA Adult (2007) 63% ** 35% 36% 48% 69% *
WIA Adult (2009) 62% ** 120% ** 65% ** 55% * 56% *
WIA Adult (2012) -22% -14% -8%
FastTRAC (2012) 57% 90% * 100% *
Significance levels: ** = 1%; * = 5%
Table 2. Net impact: change in yearly earnings, in dollars among all participants
Year 1 Year 2 Year 3 Year 4 Year 5
Dislocated Worker (2007) $6,157 ** $8,053 ** $15,308 ** $21,236 ** $25,751 **
Dislocated Worker (2009) $1,435 $20,508 ** $25,450 ** $24,944 ** $27,712 **
Dislocated Worker (2012) -$21,428 ** -$18,409 ** -$5,823 **
WIA Adult (2007) $5,769 ** $3,221 $3,270 $4,327 $6,314 *
WIA Adult (2009) $5,400 ** $10,399 ** $5,627 ** $4,753 * $4,834 *
WIA Adult (2012) -$1,912 -$1,213 -$673
FastTRAC (2012) $4,634 $7,296 * $8,068 *
Significance levels: ** = 1%; * = 5%
These programs tend to have large and
lasting positive effects on earnings. The
exceptions to this suggest that their
effects may be especially pronounced
during periods of economic downturn.
Page 12
Net impact on employment The results presented above could be consistent with one of two stories: participants are employed at
about the same rate as comparison individuals but in higher-paying jobs, or participants are employed at
a higher rate than comparison individuals. The evidence suggests the latter.
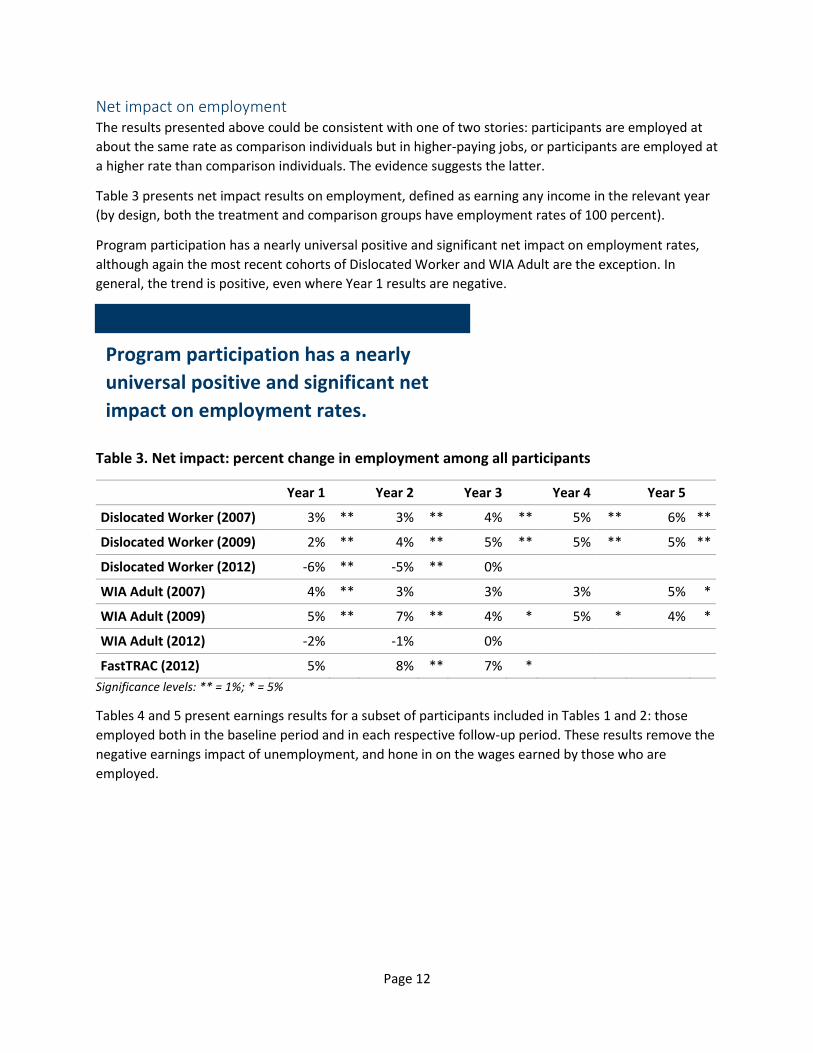
Table 3 presents net impact results on employment, defined as earning any income in the relevant year
(by design, both the treatment and comparison groups have employment rates of 100 percent).
Program participation has a nearly universal positive and significant net impact on employment rates,
although again the most recent cohorts of Dislocated Worker and WIA Adult are the exception. In
general, the trend is positive, even where Year 1 results are negative.
Table 3. Net impact: percent change in employment among all participants
Year 1 Year 2 Year 3 Year 4 Year 5
Dislocated Worker (2007) 3% ** 3% ** 4% ** 5% ** 6% **
Dislocated Worker (2009) 2% ** 4% ** 5% ** 5% ** 5% **
Dislocated Worker (2012) -6% ** -5% ** 0%
WIA Adult (2007) 4% ** 3% 3% 3% 5% *
WIA Adult (2009) 5% ** 7% ** 4% * 5% * 4% *
WIA Adult (2012) -2% -1% 0%
FastTRAC (2012) 5% 8% ** 7% *
Significance levels: ** = 1%; * = 5%
Tables 4 and 5 present earnings results for a subset of participants included in Tables 1 and 2: those
employed both in the baseline period and in each respective follow-up period. These results remove the
negative earnings impact of unemployment, and hone in on the wages earned by those who are
employed.
Program participation has a nearly
universal positive and significant net
impact on employment rates.

Page 13
Table 4. Net impact: percent change in yearly earnings among participants employed at baseline and follow up
Year 1 Year 2 Year 3 Year 4 Year 5
Dislocated Worker (2007) -8% ** -5% * 1% 8% ** 7% **
Dislocated Worker (2009) -20% ** 3% 4% * 5% ** 7% **
Dislocated Worker (2012) -31% ** -25% ** -19% **
WIA Adult (2007) 11% 2% -4% 10% 8%
WIA Adult (2009) 8% 7% 7% -8% -2%
WIA Adult (2012) -15% -12% -9%
FastTRAC (2012) 1% -14% -9%
Significance levels: ** = 1%; * = 5%
Table 5. Net impact: change in yearly earnings, in dollars among participants employed at baseline and follow up
Year 1 Year 2 Year 3 Year 4 Year 5
Dislocated Worker (2007) -$2,476 ** -$1,703 * $224 $2,513 ** $2,103 **
Dislocated Worker (2009) -$7,614 ** $1,184 $1,546 * $2,116 ** $2,860 **
Dislocated Worker (2012) -$11,862 ** -$9,599 ** -$7,260 **
WIA Adult (2007) $1,041 $148 -$403 $934 $753
WIA Adult (2009) $765 $644 $623 -$734 -$150
WIA Adult (2012) -$1,266 -$1,066 -$729
FastTRAC (2012) $75 -$1,206 -$772
Significance levels: ** = 1%; * = 5%
Results among WIA Adult and FastTRAC are not significant, and results for the most recent Dislocated
Worker cohort are negative (although trending positive).
For earlier Dislocated Worker cohorts, results turn positive and significant in the 3rd or 4th year after
enrollment, suggesting the program’s effect went beyond moving participants into any job to moving
participants into a higher-income job than they otherwise would have had.
For earlier Dislocated Worker cohorts, results
suggest the program’s effect went beyond
moving participants into any job to moving
participants into a higher-income job than
they otherwise would have had.
Page 14
What could explain the business cycle effects in these results? Enrollment patterns in Trade Adjustment Assistance (TAA) may have at least a small impact on
Dislocated Worker effects. The share of Dislocated Worker participants co-enrolled in TAA increased
across cohorts: from 6-7 percent in the 2007 and 2009 cohorts to 10 percent in the 2012 cohort.
Importantly, TAA has more generous benefits than Dislocated Worker which may delay job-seeking,
including extended unemployment insurance payments for participants engaged in training. Further
study is needed to determine how this increase in TAA enrollment impacts overall results, but this could
help explain the negative employment results in the first two years of the 2012 cohort.
Additionally, our methodology does not include the prior industry of employment. If participants and
comparison individuals differ by their industry of employment, and if that difference changes over the
business cycle and impacts employment outcomes, this could help explain our differing results through
the Great Recession and its aftermath. Data on industry is currently available, so further research with
this methodology will include industry of prior employment to explore this possibility.
Finally, new economic theory suggests, with budding empirical evidence, that employer perceptions of
workforce participants may change throughout the business cycle.6 Our methodology controls for
observable and unobservable characteristics about participants but not employer perceptions or the
“signal” that participation in a workforce program provides. It is plausible that, during business cycle
downturns when labor is plentiful, employers perceive workforce participants to be more motivated
than the average job seeker: motivated enough to enroll in a career-oriented program to make some
time investments in their future. During business cycle booms, when labor is scarce, employers may
perceive workforce participants to be less desirable than the average job seeker: these are now
participants that must require extra assistance to find employment in a tight labor market. This theory is
supported by anecdotal evidence that the programs serve harder to serve populations during business
cycle booms, suggesting that employer perceptions, if they do exist along these lines, may be
accurate. Although this theory can be partly tested with available data, further research may need to
include interviews with employers to determine how perceptions may change over time.
6 Morgan, John and Felix Vardy. 2009. “Diversity in the Workplace,” American Economic Review. Ewans, Michael et al. 2014. “Statistical Discrimination or Prejudice? A Large Sample Field Experiment,” Review of Economics and Statistics.
Economic theory suggests that employer
perceptions of workforce participants may
change throughout the business cycle,
favoring participants during downturns
and avoiding participants during tighter
labor markets.

Page 15
Net impact on earnings among participants engaged in classroom training Although it is valuable to know how much a program impacts all participants overall, it can also be
helpful to know what particular strategies have the greatest impact. This is especially true in a program
context with a wide range of possible services.
Some participants in Dislocated Worker and WIA Adult receive just job counseling and job search
services, while others receive a more intensive set of services: formal training and even a credential in
marketable skills. The level of services any given participant receives is based primarily on what they and
their job counselor decide is their best route to a good job.
As a way of investigating the effect of this more intensive set of services, we ran the same analysis
including in the treatment group just those participants who engaged in formal classroom training
intended to result in a credential. Because participants engaged in more intensive services are not
necessarily representative of all participants, the comparison group for each cohort was redrawn based
on their observed characteristics.
Compared to the main results presented in Tables 1 and 2, Tables 6 and 7 show much more negative
results in Year 1, when most participants engaged in training are likely unemployed while taking classes
at least part of the year. Economists term these forgone earnings the “opportunity cost” of attending
school and take them into account when calculating returns to education.
Longer term trends differ between the 2007 and 2009 cohorts: by Year 5, participants in the earlier
cohort who engage in credentialed training do not fare better than their treatment peers who did not,
but participants in the 2009 cohort who engage in credentialed training do. Because this trend exists in
both programs, this could suggest another Great Recession-driven result: that the returns to training are
depressed in a weak labor market.
Trends across the 2007 and 2009
cohorts in both programs suggest that
the returns to training may be
depressed in a weak labor market.
Page 16
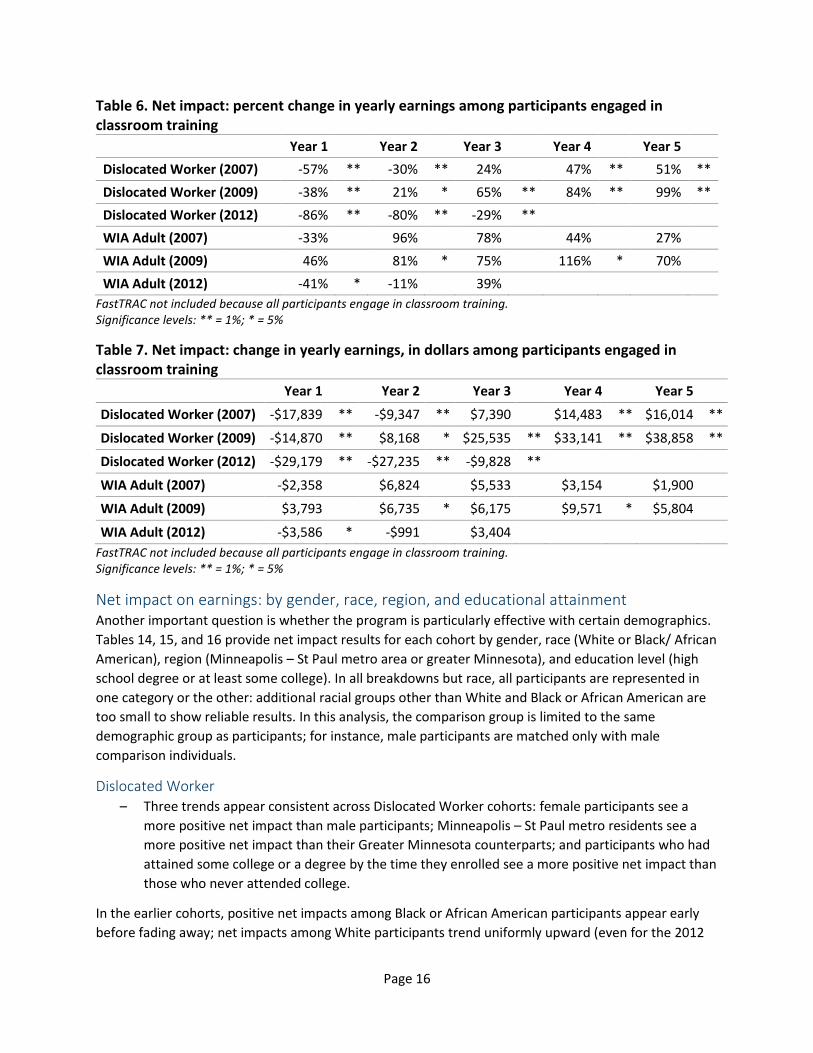
Table 6. Net impact: percent change in yearly earnings among participants engaged in classroom training
Year 1 Year 2 Year 3 Year 4 Year 5
Dislocated Worker (2007) -57% ** -30% ** 24% 47% ** 51% **
Dislocated Worker (2009) -38% ** 21% * 65% ** 84% ** 99% **
Dislocated Worker (2012) -86% ** -80% ** -29% **
WIA Adult (2007) -33% 96% 78% 44% 27%
WIA Adult (2009) 46% 81% * 75% 116% * 70%
WIA Adult (2012) -41% * -11% 39%
FastTRAC not included because all participants engage in classroom training. Significance levels: ** = 1%; * = 5%
Table 7. Net impact: change in yearly earnings, in dollars among participants engaged in classroom training
Year 1 Year 2 Year 3 Year 4 Year 5
Dislocated Worker (2007) -$17,839 ** -$9,347 ** $7,390 $14,483 ** $16,014 **
Dislocated Worker (2009) -$14,870 ** $8,168 * $25,535 ** $33,141 ** $38,858 **
Dislocated Worker (2012) -$29,179 ** -$27,235 ** -$9,828 **
WIA Adult (2007) -$2,358 $6,824 $5,533 $3,154 $1,900
WIA Adult (2009) $3,793 $6,735 * $6,175 $9,571 * $5,804
WIA Adult (2012) -$3,586 * -$991 $3,404
FastTRAC not included because all participants engage in classroom training. Significance levels: ** = 1%; * = 5%
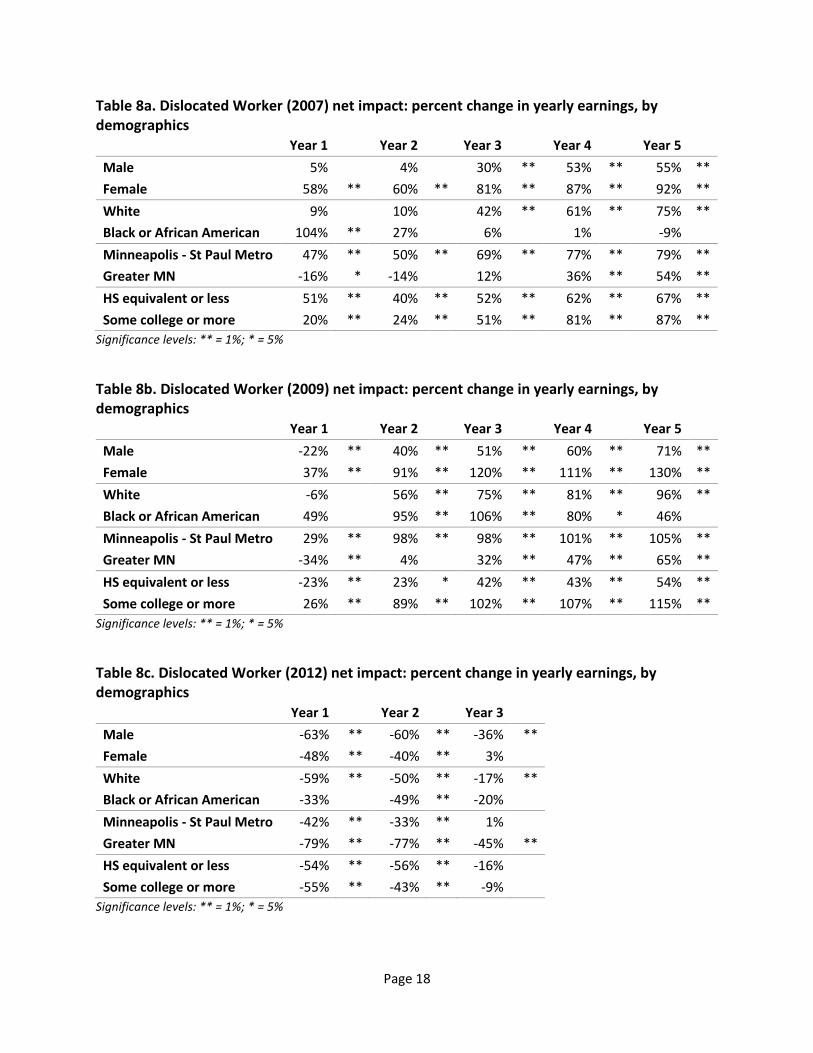
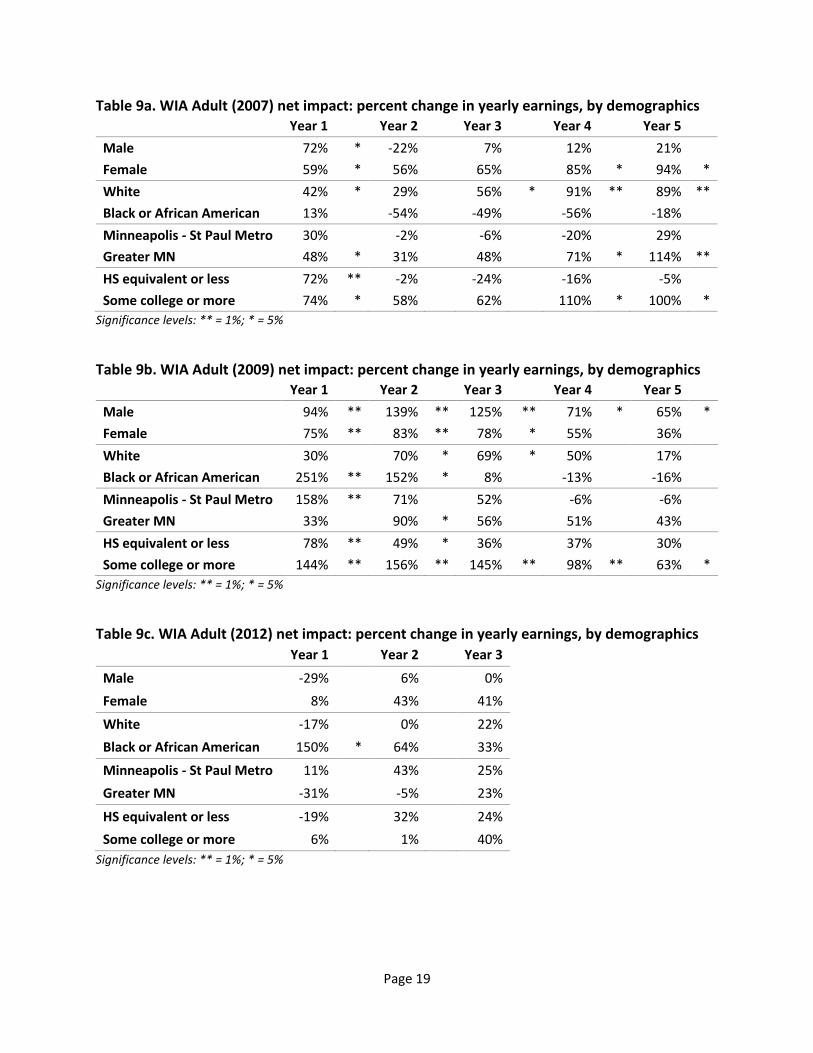
Net impact on earnings: by gender, race, region, and educational attainment Another important question is whether the program is particularly effective with certain demographics.
Tables 14, 15, and 16 provide net impact results for each cohort by gender, race (White or Black/ African
American), region (Minneapolis – St Paul metro area or greater Minnesota), and education level (high
school degree or at least some college). In all breakdowns but race, all participants are represented in
one category or the other: additional racial groups other than White and Black or African American are
too small to show reliable results. In this analysis, the comparison group is limited to the same
demographic group as participants; for instance, male participants are matched only with male
comparison individuals.
Dislocated Worker – Three trends appear consistent across Dislocated Worker cohorts: female participants see a
more positive net impact than male participants; Minneapolis – St Paul metro residents see a
more positive net impact than their Greater Minnesota counterparts; and participants who had
attained some college or a degree by the time they enrolled see a more positive net impact than
those who never attended college.
In the earlier cohorts, positive net impacts among Black or African American participants appear early
before fading away; net impacts among White participants trend uniformly upward (even for the 2012
Page 17
cohort). At its height, however, the net impact among Black or African American participants can exceed
that among White participants.
WIA Adult – The only consistent trend among WIA Adult participants is that those with some college or more
see a higher net impact than those who have never attended college. Other trends are more
variable.
Female WIA Adult participants in the 2007 and 2012 cohorts see a higher net impact than male
participants, but male participants see a higher earnings impact in the 2009 cohort.
The only positive and significant result from the 2012 cohort is among Black or African American
participants in Year 1. Similar to the Dislocated Worker trends by race, net impacts among Black or
African American participants are highest in the first year, fading away thereafter.
White participants tend to see an increasing net impact in the 2007 and 2012 cohorts, while the impact
peaks in Years 2 and 3 in the 2009 cohort.
In the earliest cohort, participants in Greater Minnesota are uniformly higher than those among
participants in the Minneapolis – St Paul metro area, although later trends are less clear.
FastTRAC – Male FastTRAC participants see a higher net impact than female, although the trend for both
groups is positive through the follow up period.
– Similar to trends in Dislocated Worker and WIA Adult, the positive net impacts among Black or
African American participants are high initially, fading out over time. However, these impacts
are higher than for White participants.
– Participants from the Minneapolis – St Paul metro area see higher net impacts than those from
Greater Minnesota, including the highest net impact result in percentage terms that we see
across all of the programs.
– Counter to trends in Dislocated Worker and WIA Adult, those who have never attended college
see higher impacts than those who have.
Across most cohorts, the positive net
impacts among Black or African
American participants are high initially
but fade out over time. White
participants see an opposite trend.
Page 18
Table 8a. Dislocated Worker (2007) net impact: percent change in yearly earnings, by demographics Year 1 Year 2 Year 3 Year 4 Year 5
Male 5% 4% 30% ** 53% ** 55% **
Female 58% ** 60% ** 81% ** 87% ** 92% **
White 9% 10% 42% ** 61% ** 75% **
Black or African American 104% ** 27% 6% 1% -9%
Minneapolis - St Paul Metro 47% ** 50% ** 69% ** 77% ** 79% **
Greater MN -16% * -14% 12% 36% ** 54% **
HS equivalent or less 51% ** 40% ** 52% ** 62% ** 67% **
Some college or more 20% ** 24% ** 51% ** 81% ** 87% **
Significance levels: ** = 1%; * = 5%
Table 8b. Dislocated Worker (2009) net impact: percent change in yearly earnings, by demographics Year 1 Year 2 Year 3 Year 4 Year 5
Male -22% ** 40% ** 51% ** 60% ** 71% **
Female 37% ** 91% ** 120% ** 111% ** 130% **
White -6% 56% ** 75% ** 81% ** 96% **
Black or African American 49% 95% ** 106% ** 80% * 46%
Minneapolis - St Paul Metro 29% ** 98% ** 98% ** 101% ** 105% **
Greater MN -34% ** 4% 32% ** 47% ** 65% **
HS equivalent or less -23% ** 23% * 42% ** 43% ** 54% **
Some college or more 26% ** 89% ** 102% ** 107% ** 115% **
Significance levels: ** = 1%; * = 5%
Table 8c. Dislocated Worker (2012) net impact: percent change in yearly earnings, by demographics Year 1 Year 2 Year 3
Male -63% ** -60% ** -36% **
Female -48% ** -40% ** 3%
White -59% ** -50% ** -17% **
Black or African American -33% -49% ** -20%
Minneapolis - St Paul Metro -42% ** -33% ** 1%
Greater MN -79% ** -77% ** -45% **
HS equivalent or less -54% ** -56% ** -16%
Some college or more -55% ** -43% ** -9%
Significance levels: ** = 1%; * = 5%
Page 19
Table 9a. WIA Adult (2007) net impact: percent change in yearly earnings, by demographics blank Year 1 blank Year 2 blank Year 3 blank Year 4 blank Year 5 blan
k
Male 72% * -22% blank 7% Blank 12% Blank 21% blank
Female 59% * 56% blank 65% Blank 85% * 94% *
White 42% * 29% Blank 56% * 91% ** 89% **
Black or African American 13% Blank -54% Blank -49% Blank -56% Blank -18% blank
Minneapolis - St Paul Metro 30% blank -2% Blank -6% Blank -20% Blank 29% blank
Greater MN 48% * 31% Blank 48% Blank 71% * 114% **
HS equivalent or less 72% ** -2% Blank -24% Blank -16% blank -5% blank
Some college or more 74% * 58% blank 62% blank 110% * 100% *
Significance levels: ** = 1%; * = 5%
Table 9b. WIA Adult (2009) net impact: percent change in yearly earnings, by demographics
blank Year 1 Year 2 Year 3 Year 4 Year 5
Male 94% ** 139% ** 125% ** 71% * 65% *
Female 75% ** 83% ** 78% * 55% Blank 36% blank
White 30% blank 70% * 69% * 50% Blank 17% blank
Black or African American 251% ** 152% * 8% blank -13% Blank -16% blank
Minneapolis - St Paul Metro 158% ** 71% blank 52% blank -6% Blank -6% blank
Greater MN 33% blank 90% * 56% blank 51% Blank 43% blank
HS equivalent or less 78% ** 49% * 36% blank 37% blank 30% blank
Some college or more 144% ** 156% ** 145% ** 98% ** 63% *
Significance levels: ** = 1%; * = 5%
Table 9c. WIA Adult (2012) net impact: percent change in yearly earnings, by demographics
blank Year 1 blank Year 2 blank Year 3 blank
Male -29% Blank 6% Blank 0% blank
Female 8% Blank 43% Blank 41% blank
White -17% Blank 0% Blank 22% blank
Black or African American 150% * 64% Blank 33% blank
Minneapolis - St Paul Metro 11% Blank 43% Blank 25% blank
Greater MN -31% Blank -5% Blank 23% blank
HS equivalent or less -19% Blank 32% Blank 24% blank
Some college or more 6% blank 1% blank 40% blank
Significance levels: ** = 1%; * = 5%

Page 20
Table 10. FastTRAC (2012) net impact: percent change in yearly earnings, by demographics blank b Year 1 blank Year 2 blank Year 3
Male 83% Blank 98% Blank 174% *
Female 30% Blank 37% Blank 57%
White 11% Blank 53% Blank 46%
Black or African American 102% Blank 78% Blank 35%
Minneapolis - St Paul Metro 142% Blank 186% Blank 354% *
Greater MN 72% Blank 104% Blank 202% *
HS equivalent or less 48% Blank 154% * 199% *
Some college or more 81% Blank 74% blank 149%
Significance levels: ** = 1%; * = 5%
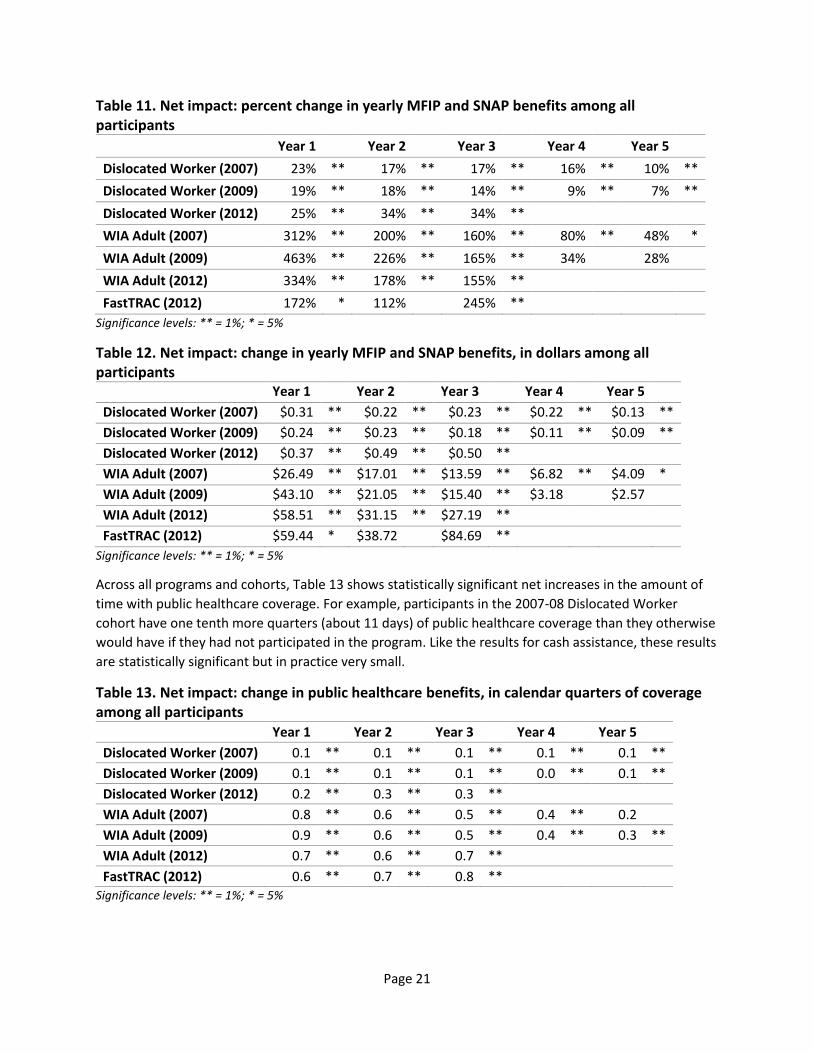
Net impact on public assistance programs Tables 11, 12, and 13 show the net impact on public assistance receipt, whether cash assistance or
public healthcare coverage through MinnesotaCare or Medical Assistance. Although we would hope
participants achieve self-sufficiency through employment gained by program services, we also know that
a steep decline in income precipitates enrollment in each of these workforce programs. We also know
job counselors provide direct referrals to any public benefits their clients may be eligible for. Therefore,
perhaps the best case scenario in these results would be an initial increase in benefits but a decline over
time as participants work toward self-sufficiency; this is indeed what we see.
Because the data linking process for this analysis does not include employment data sources, no
restriction is made on prior employment: this analysis includes all participants.
Table 11 shows statistically significant net increases in cash benefits awarded to participants after
enrolling in a workforce program; these increases tend to diminish over time. Table 12 shows the net
impact in dollar terms, showing in fact very small dollar amounts.
All cohorts see statistically significant
net increases in cash benefits after
enrolling in a workforce program; these
increases are small in dollar value and
tend to diminish over time.
Page 21
Table 11. Net impact: percent change in yearly MFIP and SNAP benefits among all participants Year 1 Year 2 Year 3 Year 4 Year 5
Dislocated Worker (2007) 23% ** 17% ** 17% ** 16% ** 10% **
Dislocated Worker (2009) 19% ** 18% ** 14% ** 9% ** 7% **
Dislocated Worker (2012) 25% ** 34% ** 34% **
WIA Adult (2007) 312% ** 200% ** 160% ** 80% ** 48% *
WIA Adult (2009) 463% ** 226% ** 165% ** 34% 28%
WIA Adult (2012) 334% ** 178% ** 155% **
FastTRAC (2012) 172% * 112% 245% **
Significance levels: ** = 1%; * = 5%
Table 12. Net impact: change in yearly MFIP and SNAP benefits, in dollars among all participants
Year 1
Year 2
Year 3
Year 4
Year 5
Dislocated Worker (2007) $0.31 ** $0.22 ** $0.23 ** $0.22 ** $0.13 **
Dislocated Worker (2009) $0.24 ** $0.23 ** $0.18 ** $0.11 ** $0.09 **
Dislocated Worker (2012) $0.37 ** $0.49 ** $0.50 **
WIA Adult (2007) $26.49 ** $17.01 ** $13.59 ** $6.82 ** $4.09 *
WIA Adult (2009) $43.10 ** $21.05 ** $15.40 ** $3.18
$2.57
WIA Adult (2012) $58.51 ** $31.15 ** $27.19 **
FastTRAC (2012) $59.44 * $38.72
$84.69 **
Significance levels: ** = 1%; * = 5%
Across all programs and cohorts, Table 13 shows statistically significant net increases in the amount of
time with public healthcare coverage. For example, participants in the 2007-08 Dislocated Worker
cohort have one tenth more quarters (about 11 days) of public healthcare coverage than they otherwise
would have if they had not participated in the program. Like the results for cash assistance, these results
are statistically significant but in practice very small.
Table 13. Net impact: change in public healthcare benefits, in calendar quarters of coverage among all participants Year 1 Year 2 Year 3 Year 4 Year 5
Dislocated Worker (2007) 0.1 ** 0.1 ** 0.1 ** 0.1 ** 0.1 **
Dislocated Worker (2009) 0.1 ** 0.1 ** 0.1 ** 0.0 ** 0.1 **
Dislocated Worker (2012) 0.2 ** 0.3 ** 0.3 **
WIA Adult (2007) 0.8 ** 0.6 ** 0.5 ** 0.4 ** 0.2
WIA Adult (2009) 0.9 ** 0.6 ** 0.5 ** 0.4 ** 0.3 **
WIA Adult (2012) 0.7 ** 0.6 ** 0.7 **
FastTRAC (2012) 0.6 ** 0.7 ** 0.8 **
Significance levels: ** = 1%; * = 5%

Page 22
Costs and benefits This section applies the cost framework developed by the Net Impact Advisory Group and published in
the pilot Net Impact report.
– The accounting of costs and benefits in this section includes direct program costs, earnings
increases (or decreases) and the associated tax revenue increases (or decreases), and increases
in public benefit usage.
Due to data limitations, we are not able to estimate the change in unemployment insurance payments
or incarceration costs, although those are included in the group’s theoretical framework. Under this
framework, benefits accrue to (or costs are born by) either participants or taxpayers; the total social
benefit (or cost) is the sum of these two parts. Costs and benefits are presented as estimated averages
per participant served. All dollar figures are presented in constant 2016 dollar terms and, following
federal practice, reflect a discount rate of seven percent.7
The pilot report contains a full discussion of the caveats to this approach, of which a few should be
summarized here.
– We do not have access to individual-level cost data, so all cost estimates are derived from
averages.
– Some potential program effects are hard to quantify and not included in this cost framework,
including economic multipliers, changes in mental and physical health, and changes in worker
productivity.
– Other potential program effects could be monetized but could not be estimated due to data
restrictions, including changes in subsidized housing benefits, child support payments, or
childcare assistance benefits.
– This cost framework does not account for employer costs and benefits, largely because we lack
information on changes in worker productivity.
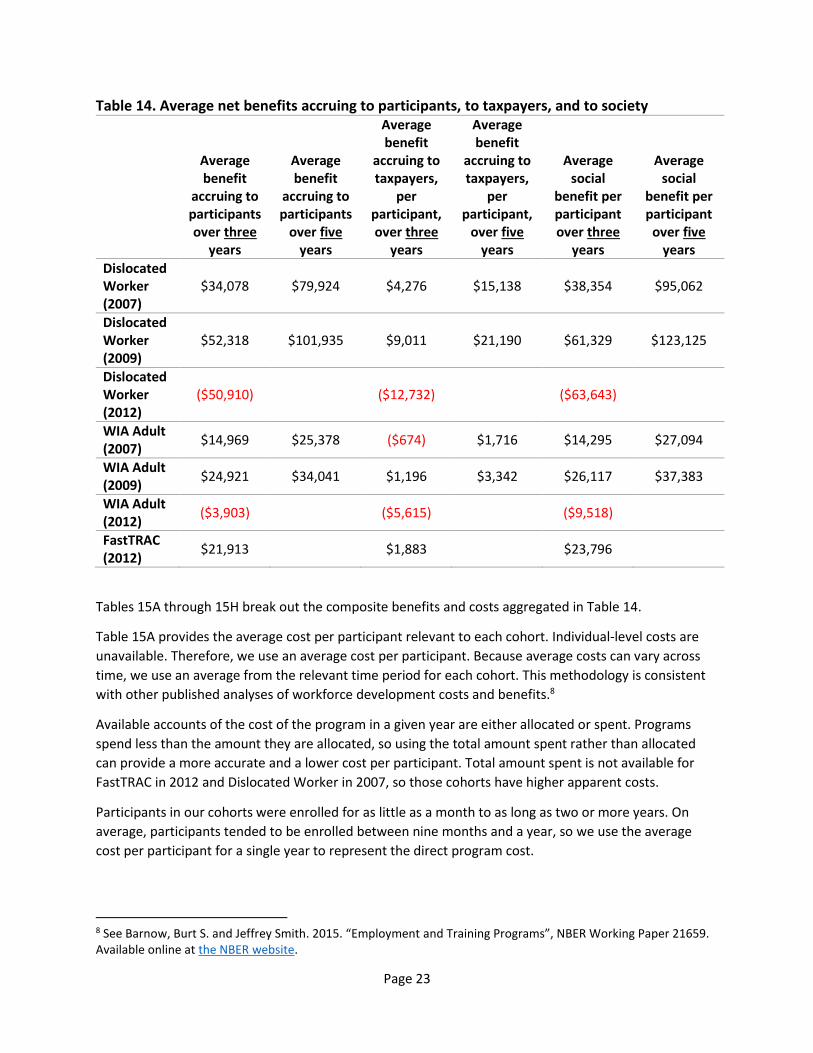
Table 14 presents the headline cost and benefit results for these cohorts, breaking out the total social
costs and benefits into its component parts: participant and taxpayer costs and benefits. In general,
these programs’ monetary benefits outweigh their costs.
7 “Guidelines and Discount Rates For Benefit-Cost Analysis of Federal Programs,” OMB Circular A-94, available online, accessed 10 Jan 2017.
In general, these programs’ monetary
benefits outweigh their costs.
Taxpayers see a strong return on
investment due to increased tax
revenues collected from participants.
Page 23
Table 14. Average net benefits accruing to participants, to taxpayers, and to society
Average benefit
accruing to participants over three
years
Average benefit
accruing to participants
over five years
Average benefit
accruing to taxpayers,
per participant, over three
years
Average benefit
accruing to taxpayers,
per participant,
over five years
Average social
benefit per participant over three
years
Average social
benefit per participant
over five years
Dislocated Worker (2007)
$34,078 $79,924 $4,276 $15,138 $38,354 $95,062
Dislocated Worker (2009)
$52,318 $101,935 $9,011 $21,190 $61,329 $123,125
Dislocated Worker (2012)
($50,910) ($12,732) ($63,643)
WIA Adult (2007)
$14,969 $25,378 ($674) $1,716 $14,295 $27,094
WIA Adult (2009)
$24,921 $34,041 $1,196 $3,342 $26,117 $37,383
WIA Adult (2012)
($3,903) ($5,615) ($9,518)
FastTRAC (2012)
$21,913 $1,883 $23,796
Tables 15A through 15H break out the composite benefits and costs aggregated in Table 14.
Table 15A provides the average cost per participant relevant to each cohort. Individual-level costs are
unavailable. Therefore, we use an average cost per participant. Because average costs can vary across
time, we use an average from the relevant time period for each cohort. This methodology is consistent
with other published analyses of workforce development costs and benefits.8
Available accounts of the cost of the program in a given year are either allocated or spent. Programs
spend less than the amount they are allocated, so using the total amount spent rather than allocated
can provide a more accurate and a lower cost per participant. Total amount spent is not available for
FastTRAC in 2012 and Dislocated Worker in 2007, so those cohorts have higher apparent costs.
Participants in our cohorts were enrolled for as little as a month to as long as two or more years. On
average, participants tended to be enrolled between nine months and a year, so we use the average
cost per participant for a single year to represent the direct program cost.
8 See Barnow, Burt S. and Jeffrey Smith. 2015. “Employment and Training Programs”, NBER Working Paper 21659. Available online at the NBER website.
Page 24
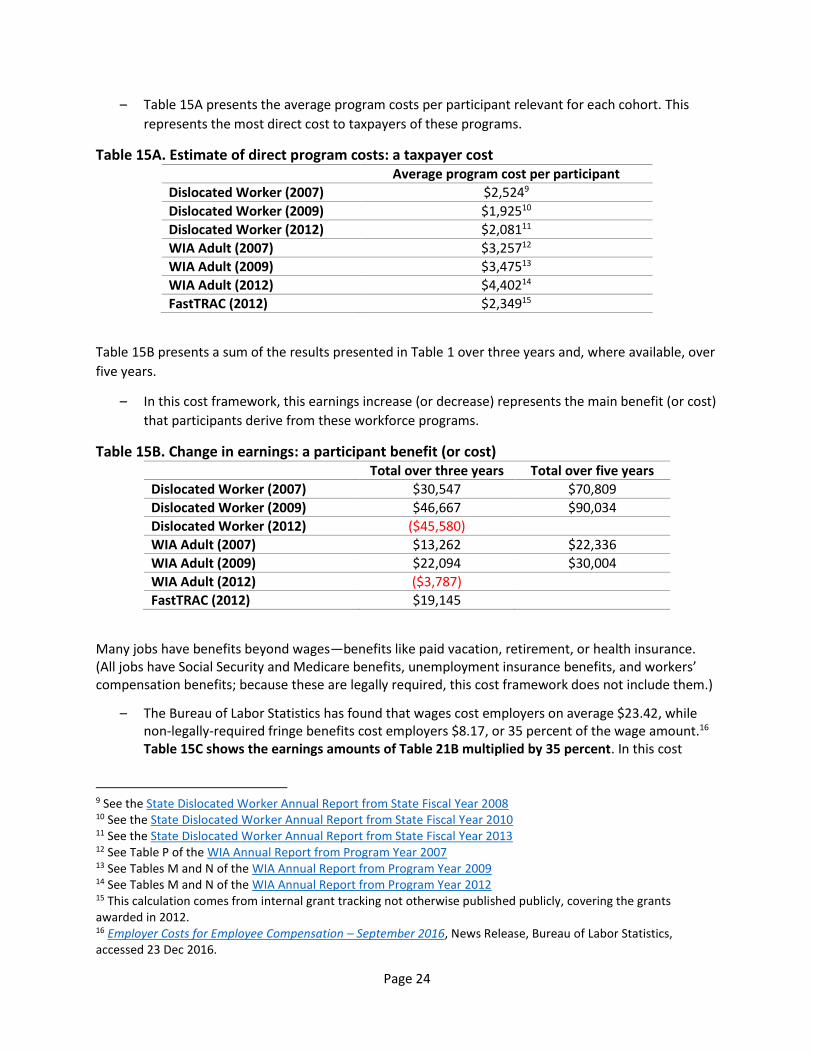
– Table 15A presents the average program costs per participant relevant for each cohort. This
represents the most direct cost to taxpayers of these programs.
Table 15A. Estimate of direct program costs: a taxpayer cost Average program cost per participant
Dislocated Worker (2007) $2,5249
Dislocated Worker (2009) $1,92510
Dislocated Worker (2012) $2,08111
WIA Adult (2007) $3,25712
WIA Adult (2009) $3,47513
WIA Adult (2012) $4,40214
FastTRAC (2012) $2,34915
Table 15B presents a sum of the results presented in Table 1 over three years and, where available, over
five years.
– In this cost framework, this earnings increase (or decrease) represents the main benefit (or cost)
that participants derive from these workforce programs.
Table 15B. Change in earnings: a participant benefit (or cost) Total over three years Total over five years
Dislocated Worker (2007) $30,547 $70,809
Dislocated Worker (2009) $46,667 $90,034
Dislocated Worker (2012) ($45,580)
WIA Adult (2007) $13,262 $22,336
WIA Adult (2009) $22,094 $30,004
WIA Adult (2012) ($3,787)
FastTRAC (2012) $19,145
Many jobs have benefits beyond wages—benefits like paid vacation, retirement, or health insurance. (All jobs have Social Security and Medicare benefits, unemployment insurance benefits, and workers’ compensation benefits; because these are legally required, this cost framework does not include them.)
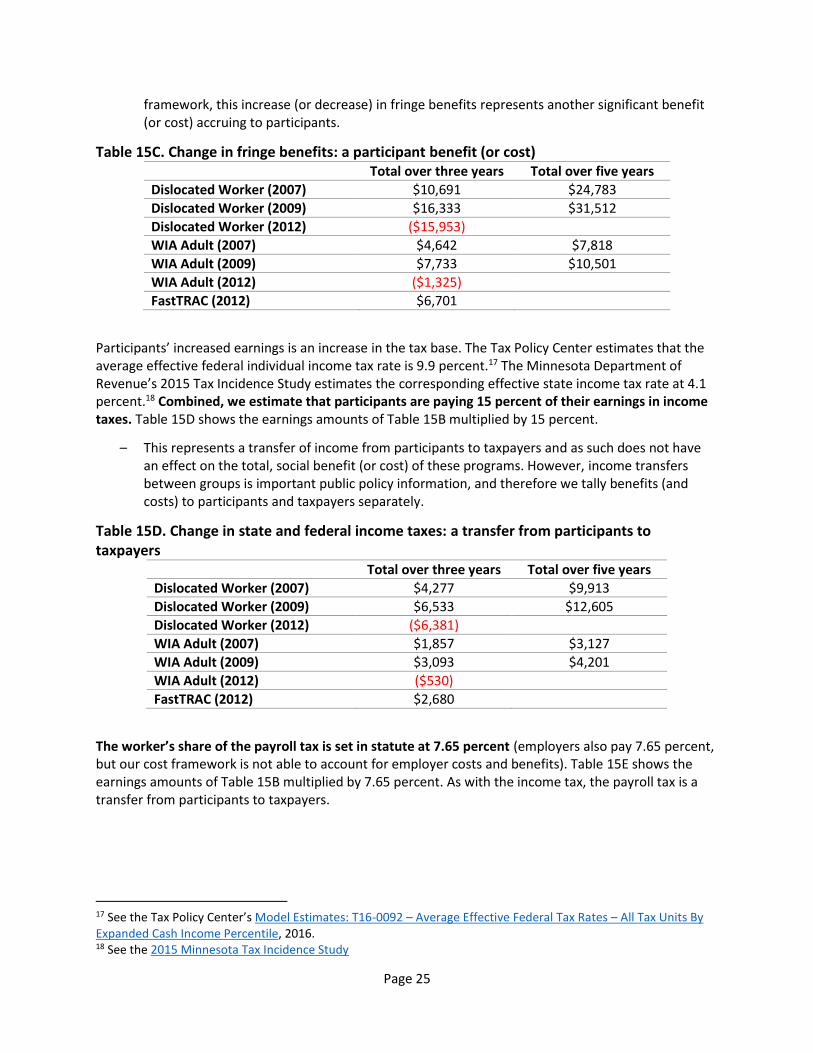
– The Bureau of Labor Statistics has found that wages cost employers on average $23.42, while non-legally-required fringe benefits cost employers $8.17, or 35 percent of the wage amount.16 Table 15C shows the earnings amounts of Table 21B multiplied by 35 percent. In this cost
9 See the State Dislocated Worker Annual Report from State Fiscal Year 2008 10 See the State Dislocated Worker Annual Report from State Fiscal Year 2010 11 See the State Dislocated Worker Annual Report from State Fiscal Year 2013 12 See Table P of the WIA Annual Report from Program Year 2007 13 See Tables M and N of the WIA Annual Report from Program Year 2009 14 See Tables M and N of the WIA Annual Report from Program Year 2012 15 This calculation comes from internal grant tracking not otherwise published publicly, covering the grants awarded in 2012. 16 Employer Costs for Employee Compensation – September 2016, News Release, Bureau of Labor Statistics, accessed 23 Dec 2016.
Page 25
framework, this increase (or decrease) in fringe benefits represents another significant benefit (or cost) accruing to participants.
Table 15C. Change in fringe benefits: a participant benefit (or cost) Total over three years Total over five years
Dislocated Worker (2007) $10,691 $24,783
Dislocated Worker (2009) $16,333 $31,512
Dislocated Worker (2012) ($15,953)
WIA Adult (2007) $4,642 $7,818
WIA Adult (2009) $7,733 $10,501
WIA Adult (2012) ($1,325)
FastTRAC (2012) $6,701
Participants’ increased earnings is an increase in the tax base. The Tax Policy Center estimates that the average effective federal individual income tax rate is 9.9 percent.17 The Minnesota Department of Revenue’s 2015 Tax Incidence Study estimates the corresponding effective state income tax rate at 4.1 percent.18 Combined, we estimate that participants are paying 15 percent of their earnings in income taxes. Table 15D shows the earnings amounts of Table 15B multiplied by 15 percent.
– This represents a transfer of income from participants to taxpayers and as such does not have an effect on the total, social benefit (or cost) of these programs. However, income transfers between groups is important public policy information, and therefore we tally benefits (and costs) to participants and taxpayers separately.
Table 15D. Change in state and federal income taxes: a transfer from participants to taxpayers
Total over three years Total over five years
Dislocated Worker (2007) $4,277 $9,913
Dislocated Worker (2009) $6,533 $12,605
Dislocated Worker (2012) ($6,381)
WIA Adult (2007) $1,857 $3,127
WIA Adult (2009) $3,093 $4,201
WIA Adult (2012) ($530)
FastTRAC (2012) $2,680
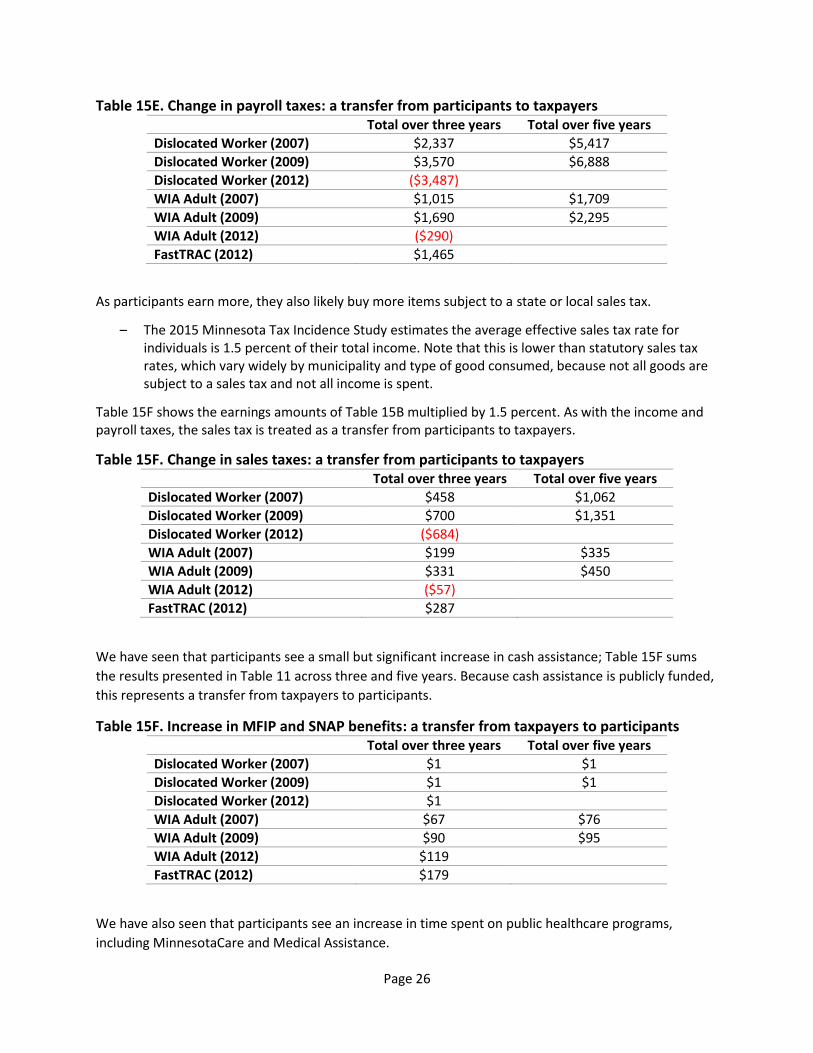
The worker’s share of the payroll tax is set in statute at 7.65 percent (employers also pay 7.65 percent, but our cost framework is not able to account for employer costs and benefits). Table 15E shows the earnings amounts of Table 15B multiplied by 7.65 percent. As with the income tax, the payroll tax is a transfer from participants to taxpayers.
17 See the Tax Policy Center’s Model Estimates: T16-0092 – Average Effective Federal Tax Rates – All Tax Units By Expanded Cash Income Percentile, 2016. 18 See the 2015 Minnesota Tax Incidence Study
Page 26
Table 15E. Change in payroll taxes: a transfer from participants to taxpayers Total over three years Total over five years
Dislocated Worker (2007) $2,337 $5,417
Dislocated Worker (2009) $3,570 $6,888
Dislocated Worker (2012) ($3,487)
WIA Adult (2007) $1,015 $1,709
WIA Adult (2009) $1,690 $2,295
WIA Adult (2012) ($290)
FastTRAC (2012) $1,465
As participants earn more, they also likely buy more items subject to a state or local sales tax.
– The 2015 Minnesota Tax Incidence Study estimates the average effective sales tax rate for individuals is 1.5 percent of their total income. Note that this is lower than statutory sales tax rates, which vary widely by municipality and type of good consumed, because not all goods are subject to a sales tax and not all income is spent.
Table 15F shows the earnings amounts of Table 15B multiplied by 1.5 percent. As with the income and payroll taxes, the sales tax is treated as a transfer from participants to taxpayers.
Table 15F. Change in sales taxes: a transfer from participants to taxpayers Total over three years Total over five years
Dislocated Worker (2007) $458 $1,062
Dislocated Worker (2009) $700 $1,351
Dislocated Worker (2012) ($684)
WIA Adult (2007) $199 $335
WIA Adult (2009) $331 $450
WIA Adult (2012) ($57)
FastTRAC (2012) $287
We have seen that participants see a small but significant increase in cash assistance; Table 15F sums
the results presented in Table 11 across three and five years. Because cash assistance is publicly funded,
this represents a transfer from taxpayers to participants.
Table 15F. Increase in MFIP and SNAP benefits: a transfer from taxpayers to participants Total over three years Total over five years
Dislocated Worker (2007) $1 $1
Dislocated Worker (2009) $1 $1
Dislocated Worker (2012) $1
WIA Adult (2007) $67 $76
WIA Adult (2009) $90 $95
WIA Adult (2012) $119
FastTRAC (2012) $179
We have also seen that participants see an increase in time spent on public healthcare programs,
including MinnesotaCare and Medical Assistance.

Page 27
– While we do not observe the actual medical payments associated with our participants’
coverage, we do know that on average the cost per enrollee per calendar quarter is $105.19
Table 15G presents the results from Table 13 summed across three and five years, multiplied by $105.
Table 15G. Increase in public health coverage benefits: a transfer from taxpayers to participants
Total over three years Total over five years
Dislocated Worker (2007) $34.79 $48.47
Dislocated Worker (2009) $36.43 $45.08
Dislocated Worker (2012) $75.64
WIA Adult (2007) $212.59 $266.74
WIA Adult (2009) $218.60 $275.13
WIA Adult (2012) $209.28
FastTRAC (2012) $205.76
In summary, most cohorts in all programs see an average net benefit per participant. This result
depends largely on the estimated earnings changes: where participants see higher earnings due to the
program, longer-term benefits are likely to outweigh the initial costs. This holds true from both the
participant and the taxpayer perspective.
For future estimates, we will explore using more granular tax estimates than the overall average. These
program participants tend to be on the lower end of the income scale, so using effective tax rates for
earners in the lower income deciles is likely to be more accurate.
19 See total calendar year 2015 payments compared to calendar year 2015 eligible individuals.
Page 28
Appendix Table A1. Dislocated Worker descriptive statistics, by cohort
2007 Cohort 2009 Cohort 2012 Cohort
Number of participants 8,491 11,625 8,563
80 percent enrolled between these dates Mar 2006 – Nov 2008
Dec 2007 – Nov 2009
Jul 2009 – Dec 2012
Percent employed in baseline year 96% 97% 96%
Average earnings in baseline year $38,254.76 $46,560.21 $45,635.39
Average hours worked in baseline year 1720 1764 1674
Percent received unemployment insurance in baseline year
not available not available 19%
Average amount of unemployment insurance received in baseline year
not available not available $1,349.09
Percent received public healthcare coverage in baseline year
8% 6% 7%
Average number of quarters of public healthcare coverage in baseline year
0.2 0.2 0.2
Percent received cash assistance in baseline year 4% 4% 6%
Average amount of cash assistance received in baseline year
$119.00 $78.61 $141.07
Average age at enrollment, in years 45 45 47
Percent women 47% 44% 50%
Percent live in Twin Cities metro area 64% 62% 70%
Percent veteran 8% 7% 8%
Percent with less than HS diploma 5% 4% 3%
Percent with HS diploma or GED 33% 28% 28%
Percent with some college but no degree 38% 36% 32%
Percent with a college certificate 1% 1% 2%
Percent with associate degree 0% 0% 3%
Percent with bachelor’s degree 17% 21% 22%
Percent with master’s or doctoral degree 6% 9% 10%
Percent American Indian 1% 1% 1%
Percent Asian or Pacific Islander 5% 4% 4%
Percent Black or African American 7% 6% 10%
Percent Hispanic or Latino 2% 2% 3%
Percent White 84% 87% 82%
Percent multiracial 1% 0% 1%
Percent receiving support services 29% 28% 33%
Average amount of support services received $307.93 $321.19 $404.05
Percent engaged in classroom training 19% 27% 32%
Percent engaged in on-the-job training 3% 3% 2%
Percent engaged in basic skills training 41% 34% 34%
Page 29
Table A2. WIA Adult descriptive statistics, by cohort 2007 Cohort 2009 Cohort 2012 Cohort
Number of participants 1,309 1,923 1,231
80 percent enrolled between these dates Oct 2005 – Jan 2008
Feb 2008 – Jan 2010
Dec 2009 – Jan 2013
Percent employed in baseline year 73% 73% 72%
Average earnings in baseline year $12,500.11 $11,888.25 $11,572.35
Average hours worked in baseline year 938 814 803
Percent received unemployment insurance in baseline year
not available not available 18%
Average amount of unemployment insurance received in baseline year
not available not available $1,183.88
Percent received public healthcare coverage in baseline year
40% 41% 48%
Average number of quarters of public healthcare coverage in baseline year
1.3 1.3 1.6
Percent received cash assistance in baseline year 29% 31% 38%
Average amount of cash assistance received in baseline year
$784.12 $967.22 $1,360.77
Average age at enrollment, in years 36 36 36
Percent women 56% 55% 61%
Percent live in Twin Cities metro area 42% 44% 44%
Percent veteran 3% 3% 4%
Percent with less than HS diploma 15% 13% 8%
Percent with HS diploma or GED 44% 45% 42%
Percent with some college but no degree 33% 32% 36%
Percent with a college certificate 0% 1% 2%
Percent with associate degree 0% 0% 2%
Percent with bachelor’s degree 6% 8% 8%
Percent with master’s or doctoral degree 2% 1% 2%
Percent American Indian 2% 2% 1%
Percent Asian or Pacific Islander 5% 5% 2%
Percent Black or African American 23% 24% 23%
Percent Hispanic or Latino 11% 6% 6%
Percent White 58% 62% 67%
Percent multiracial 1% 1% 1%
Percent receiving support services 25% 33% 39%
Average amount of support services received $162.12 $269.33 $403.62
Percent engaged in classroom training 24% 35% 49%
Percent engaged in on-the-job training 19% 7% 6%
Percent engaged in basic skills training 16% 27% 18%
Page 30
Table A3. FastTRAC descriptive statistics 2012 Cohort
Number of participants 585
80 percent enrolled between these dates Oct 2011 – Dec 2012
Percent employed in baseline year 68%
Average earnings in baseline year $9,217.56
Average hours worked in baseline year 732
Percent received unemployment insurance in baseline year 10%
Average amount of unemployment insurance received in baseline year
$570.33
Percent received public healthcare coverage in baseline year 51%
Average number of quarters of public healthcare coverage in baseline year
1.7
Percent received cash assistance in baseline year 45%
Average amount of cash assistance received in baseline year $2,067.21
Average age at enrollment, in years 32
Percent women 78%
Percent live in Twin Cities metro area 37%
Percent veteran 1%
Percent with less than HS diploma 14%
Percent with HS diploma or GED 58%
Percent with some college but no degree 20%
Percent with a college certificate 3%
Percent with associate degree 1%
Percent with bachelor’s degree 4%
Percent with master’s or doctoral degree 1%
Percent American Indian 3%
Percent Asian or Pacific Islander 3%
Percent Black or African American 28%
Percent Hispanic or Latino 9%
Percent White 55%
Percent multiracial 2%
Percent receiving support services 11%
Average amount of support services received $45.02
Percent engaged in classroom training 57%
Percent engaged in on-the-job training 3%
Percent engaged in basic skills training 49%

Page 31
Table A4. Dislocated Worker control group match diagnostics, by cohort Dislocated
Worker (2007) blank
Dislocated Worker (2009)
Dislocated Worker (2012)
Weighted Variables Difference P
value
blank
Difference P value Difference P value
Average (logged) earnings 0.01 0.19 blank -0.04 0.00 ** -0.01 0.28
Average hours worked 12.72 0.09 blank -4.29 0.54 -15.00 0.08
Average amount of unemployment insurance received NA NA blank NA NA 56.99 0.16
Average number of quarters of public healthcare coverage
0.00 0.93 blank
0.01 0.28 0.02 0.07
Average amount of cash assistance received 11.66 0.17 blank 10.48 0.13 -5.96 0.55
Average age, in years 0.10 0.45 blank 0.08 0.48 0.09 0.49
Percent with less than HS diploma 0.00 0.43 blank 0.00 0.11 0.00 0.46
Percent with HS diploma or GED 0.00 0.77 blank 0.00 0.63 -0.01 0.20
Percent with some college but no degree 0.01 0.17 blank 0.00 1.00 0.00 0.52
Percent with a college certificate 0.00 0.48 blank 0.00 0.60 0.00 0.01 **
Percent with associate degree NA NA blank 0.00 0.72 0.00 0.45
Percent with bachelor’s degree -0.01 0.05 blank -0.01 0.12 -0.01 0.32
Percent with master’s or doctoral degree 0.00 0.73 blank 0.01 0.06 0.00 0.27
Percent women 0.00 0.48 blank 0.00 0.42 -0.01 0.42
Percent live in Twin Cities metro area 0.01 0.27 blank 0.01 0.35 0.01 0.11
Percent American Indian 0.00 0.73 blank 0.00 0.93 0.00 0.87
Percent Asian or Pacific Islander 0.00 0.25 blank 0.00 0.83 0.00 0.68
Percent Black or African American 0.00 0.55 blank 0.00 0.25 0.00 0.85
Percent Hispanic or Latino 0.00 0.19 blank 0.00 0.86 0.00 0.90
Percent White 0.00 0.52 blank 0.00 0.37 0.00 0.96
Percent multiracial 0.00 0.34 blank 0.00 0.78 0.00 0.98
Percent veteran 0.00 0.30 blank 0.00 0.60 0.00 0.23
Significance levels: ** = 1%; * = 5%

Page 32
Table A5. WIA Adult control group match diagnostics, by cohort
WIA Adult
(2007) blank
WIA Adult (2009)
WIA Adult (2012)
Weighted Variable(s) Difference P value blank Difference P value Difference P value
Average (logged) earnings -0.09 0.07 blank -0.03 0.45 0.01 0.84
Average hours worked 31.62 0.30 blank 34.34 0.13 28.16 0.30
Average amount of unemployment insurance received NA NA blank NA NA 111.75 0.32
Average number of quarters of public healthcare coverage
-0.07 0.35 blank
-0.04 0.43 -0.02 0.75
Average amount of cash assistance received 78.17 0.30 blank 93.58 0.09 -144.08 0.14
Average age, in years -0.03 0.95 blank -0.10 0.80 0.80 0.07
Percent with less than HS diploma 0.01 0.73 blank 0.01 0.17 0.01 0.34
Percent with HS diploma or GED 0.01 0.58 blank -0.01 0.32 -0.03 0.12
Percent with some college but no degree -0.01 0.49 blank 0.00 0.91 0.01 0.49
Percent with a college certificate 0.00 0.51 blank 0.00 0.97 0.01 0.05 *
Percent with associate degree NA NA blank 0.00 0.95 0.00 0.93
Percent with bachelor’s degree 0.00 0.86 blank 0.00 0.67 0.00 0.69
Percent with master’s or doctoral degree 0.00 0.97 blank 0.00 0.77 0.00 0.78
Percent women 0.01 0.66 blank 0.04 0.01 ** 0.03 0.12
Percent live in Twin Cities metro area 0.00 0.97 blank -0.01 0.33 -0.01 0.45
Percent American Indian -0.01 0.12 blank 0.00 0.98 0.00 0.49
Percent Asian or Pacific Islander 0.00 0.80 blank 0.00 0.80 -0.02 0.00 **
Percent Black or African American 0.00 0.96 blank -0.03 0.01 * -0.01 0.49
Percent Hispanic or Latino -0.01 0.65 blank 0.00 0.68 -0.01 0.27
Percent White 0.02 0.40 blank 0.03 0.03 * 0.03 0.03 *
Percent multiracial 0.00 0.68 blank 0.00 0.74 0.00 0.54
Percent veteran 0.00 0.70 blank 0.00 0.79 0.00 0.78
Significance levels: ** = 1%; * = 5%
Page 33
Table A6. FastTRAC control group match diagnostics FastTRAC (2012)
Weighted Variable(s) Difference P value
Average (logged) earnings -0.03 0.66
Average hours worked 6.67 0.87
Average amount of unemployment insurance received -70.73 0.60
Average number of quarters of public healthcare coverage 0.00 0.99
Average amount of cash assistance received 185.88 0.21
Average age, in years 0.61 0.36
Percent with less than HS diploma 0.00 0.98
Percent with HS diploma or GED 0.06 0.04 *
Percent with some college but no degree 0.00 0.89
Percent with a college certificate -0.04 0.00 **
Percent with associate degree 0.00 0.62
Percent with bachelor’s degree -0.01 0.38
Percent with master’s or doctoral degree 0.00 0.66
Percent women -0.01 0.70
Percent live in Twin Cities metro area 0.02 0.41
Percent American Indian -0.02 0.12
Percent Asian or Pacific Islander 0.01 0.15
Percent Black or African American 0.00 0.87
Percent Hispanic or Latino 0.03 0.10
Percent White -0.03 0.32
Percent multiracial 0.00 0.57
Percent veteran 0.00 0.97
Significance levels: ** = 1%; * = 5%