Embed Size (px)
Citation preview

Net Analyte Signal Based
Multivariate Calibration Methods
By:
Bahram HemmateenejadMedicinal & Natural Products Chemistry Research Center,
Shiraz University of Medical Science

Multivariate Calibration
• CLS A = C S
• ILS c = A S
• PCR A = T P, c = T s
• PLS A = T P, C = Q U Q = T b

Main Problems
• Definition of figures of merit
• Optimization of conditions
• Optimum number of factors

Figure of merit• Sensitivity• Selectivity• Detection Limit
Univariate Calibration
0
0.2
0.4
0.6
0.8
1
1.2
0 5 10 15Concentration
Ab
sorb
ance
Optimization of conditions
• Effect of pH
• Effect of Temperature
• Effect of Ionic Strength
• Effect of Concentration
• …

Optimum number of factors
0
20
40
60
80
100
120
1 6Number of Factors
PR
ES
S
Cross Validation
External Validation
Minimum PRESS
F-Ratio
Over-fitting
Under-Fitting

Net Analyte Signal(NAS)
• A. Lorber, Anal. Chem. 58 (1986) 1167• The part of mixture spectrum that is useful
for model building• NAS is unique for the analyte of interest• NAS is a part of mixture spectrum which is
orthogonal to the spectrum of all existing components except analyte
• A part of mixture spectra which is directly related to the concentration of analyte

Net analyte signal, references
• 1986 Proposed by Lorber.• Spectra of pure compounds available (CLS model).
• 1997-2000 Extensions.• Inverse calibration (Lorber,Faber,Kowalski)• Figures of merit (sensitivity, selectivity, limit of detection) (Faber)
• 1998-2002 Applications, Software. • Outlier detection. (Faber, Xu, Ferre) • Biomedical & Pharmaceutical. (Goicoechea, Skibsted)• Spectral preprocessing. (Faber, Brown, Wentzell) • Wavelength selection. (Goicoechea, Xu) • Preprocessing and wavelength selection (Skibsted, Boelens)

x
y M1
2x 3x
M2 M3
y
2y
3y
x
M1
M2
M3
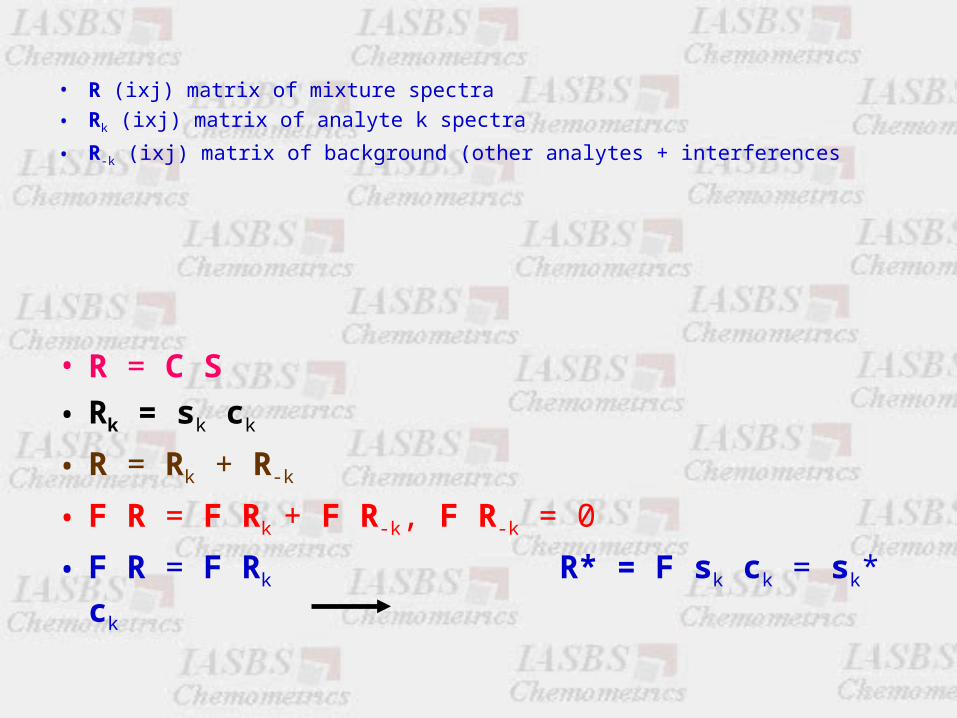
• R (ixj) matrix of mixture spectra
• Rk (ixj) matrix of analyte k spectra
• R-k (ixj) matrix of background (other analytes + interferences
• R = C S
• Rk = sk ck
• R = Rk + R-k
• F R = F Rk + F R-k, F R-k = 0
• F R = F Rk R* = F sk ck = sk* ck

• F = I – R-k+ R-k
• R* = (I – R-k+ R-k)R = R - R-k
+ R-k R
• (I – R-k+ R-k)R-k = 0
• Key Step R-k
• Rank Annihilation Factor Analysis
(RAFA)

• CLS approach
• Rk = sk ck
• R-k = R – Rk
• ILS approach
• R-k = R - r ck
• r is a linear combination of the rows of R
• ck = R R-1 ck
= 1/ rT R+ ck

• Another approach
• R-k = [ I – ck(ckT ck)-1 ck
T]R
• Other approaches• Xu & Schechter Anal. Chem. 69 (1997) 3722
• Faber Anal. Chem. 70(1998) 5108

Review of NAS calculation• Determining No. of analytes (p)
• Preparing mixture standard solutions (j)
• Recording absorbance spectra of solutions at (i) sensors (R matrix)
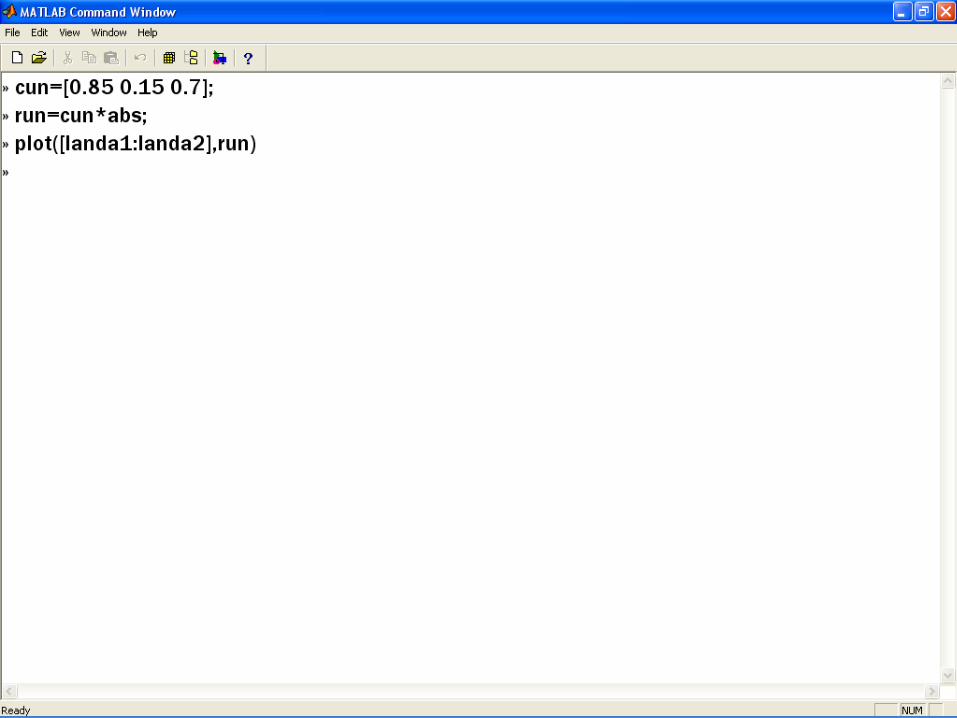
• Recording absorbance spectrum of unknown (run vector)
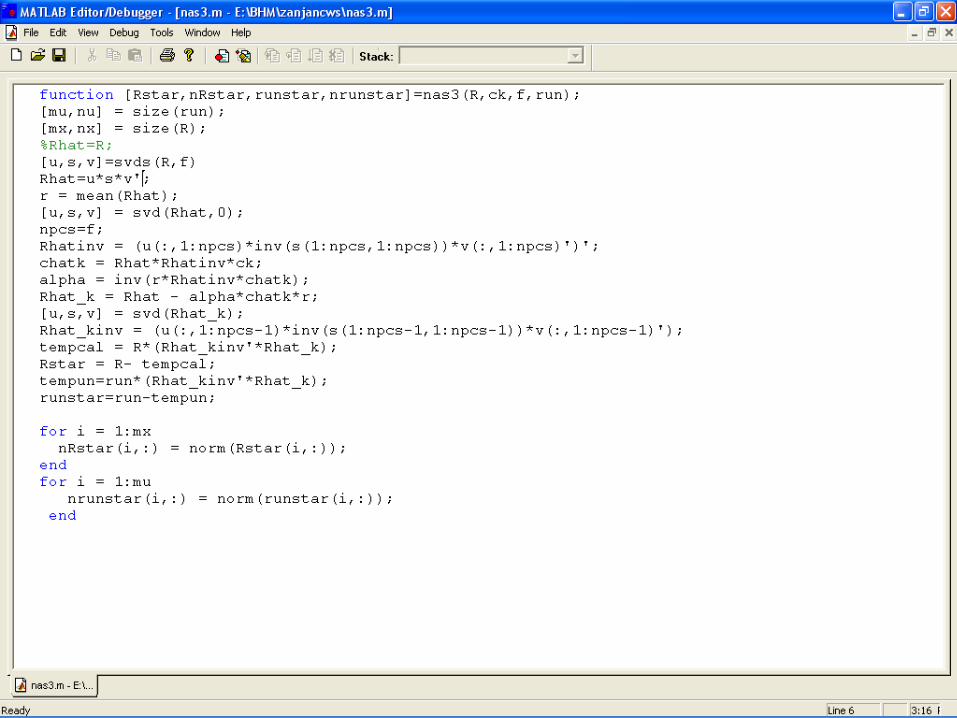
• Calculation of R-k

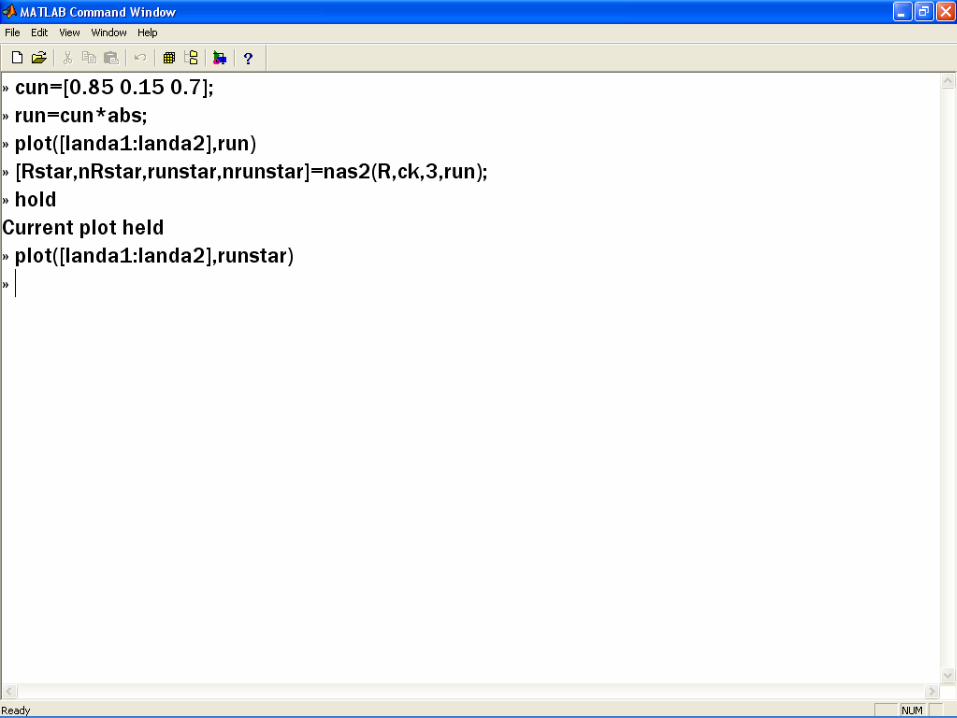
• Calculation of calibration NAS
• R* = (I – R-k+ R-k)R
• Calculation of the NAS for unknown
• r*un = (I – R-k+ R-k)run
• Calculation of the pure NAS
• s*k = (I – R-k+ R-k)sk


Effect of added noise


NAS-Multivariate calibration
• In some case, – Nonlinearity– Interaction between components– Other source of variables
• The rank of NAS will become greater than 1
• Simple NAS method dose not give perfect results
• MLR, PCR, PLS and … help to enhance the results of NAS calculation
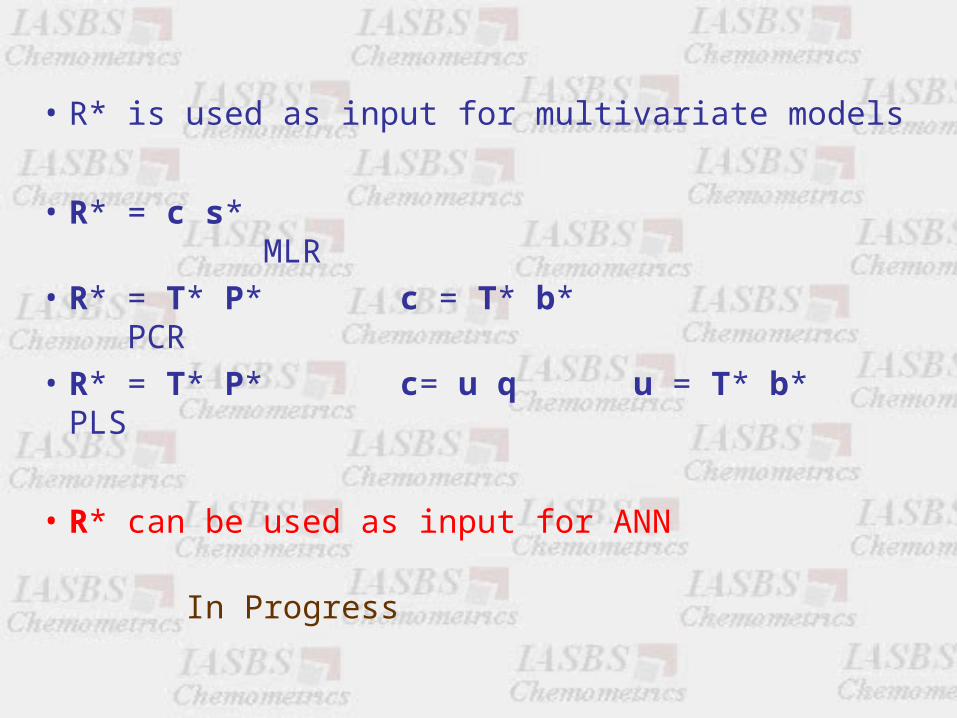
• R* is used as input for multivariate models
• R* = c s* MLR
• R* = T* P* c = T* b* PCR
• R* = T* P* c= u q u = T* b* PLS
• R* can be used as input for ANN
In Progress
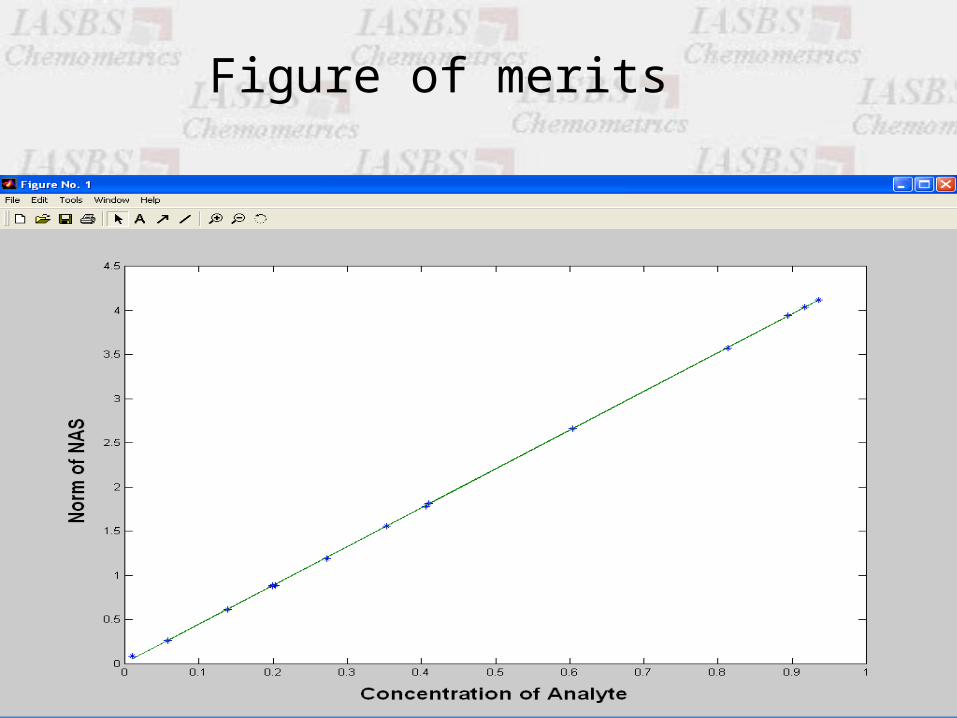
Figure of merits
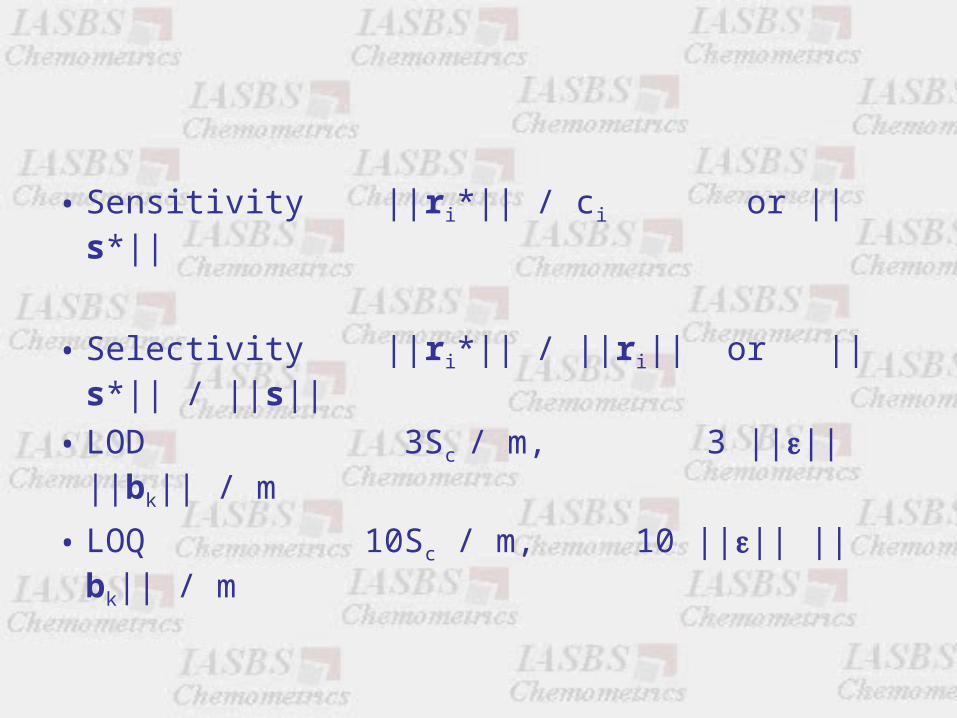
• Sensitivity ||ri*|| / ci or ||s*||
• Selectivity ||ri*|| / ||ri|| or ||s*|| / ||s||
• LOD 3Sc / m, 3 |||| ||bk|| / m
• LOQ 10Sc / m, 10 |||| ||bk|| / m

Applications• Wavelength region selection
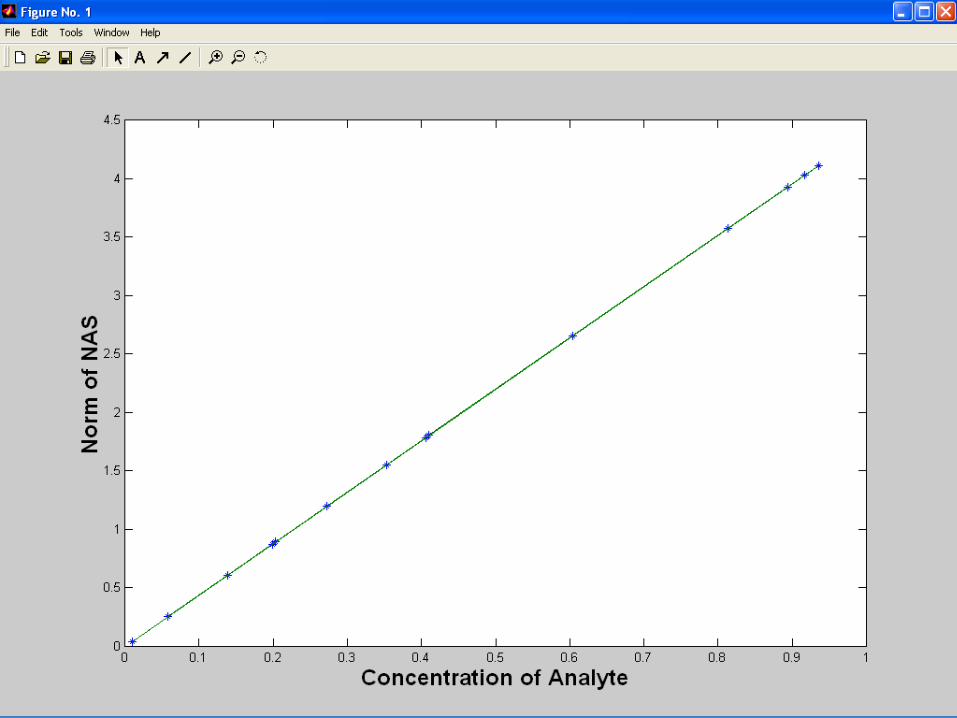
Net Analyte Signal Regression Plot
(NASRP)

• Error Indicator (EI)• Goicoechea and Olivieri, Analyst 124 (1999) 725
• EI = {s2 [1+(N2s2) / 4 ||r*|| )]}0.5 / ||r*||
• s: standard deviation of the best fitted line
• N: Number of point in the best fitted line

• Temperature insensitive determination of proteins in electrolyte solutions
• Anal. Chem. 72 (2000) 4985
• Determination of Tetracycline in blood serum• Anal. Chem. 71 (1999) 4361.
• Determination of drugs in pharmaceutics
• Determination of drugs in serum
• Determination of sorbic and benzoic acids in fruit juices
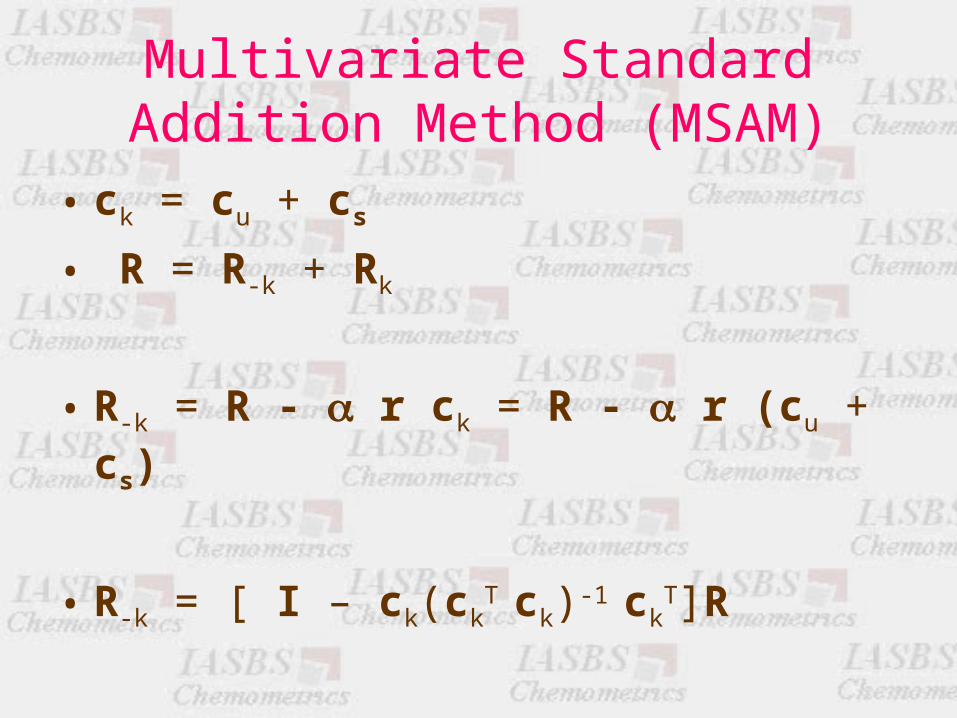
Multivariate Standard Addition Method (MSAM)
• ck = cu + cs
• R = R-k + Rk
• R-k = R - r ck = R - r (cu + cs)
• R-k = [ I – ck(ckT ck)-1 ck
T]R


• Thanks for you attention