Embed Size (px)
Citation preview
7/28/2019 Net an Export Flws
http://slidepdf.com/reader/full/net-an-export-flws 1/11
A Network Analysis of Countries’ Export Flows: FirmGrounds for the Building Blocks of the Economy
Guido Caldarelli1,2,3, Matthieu Cristelli2,4*, Andrea Gabrielli2,3, Luciano Pietronero2,4,3, Antonio Scala2,3,
Andrea Tacchella4,2
1 IMT - Institutions Market Technology, Lucca, Italy, 2 ISC-CNR - Institute of Complex Systems, Rome, Italy, 3 LIMS - London Institute for Mathematical Sciences, London,
United Kingdom, 4 Department of Physics, University of Rome ‘‘Sapienza’’, Rome, Italy
Abstract
In this paper we analyze the bipartite network of countries and products from UN data on country production. We definethe country-country and product-product projected networks and introduce a novel method of filtering information basedon elements’ similarity. As a result we find that country clustering reveals unexpected socio-geographic links among themost competing countries. On the same footings the products clustering can be efficiently used for a bottom-upclassification of produced goods. Furthermore we mathematically reformulate the ‘‘reflections method’’ introduced byHidalgo and Hausmann as a fixpoint problem; such formulation highlights some conceptual weaknesses of the approach.To overcome such an issue, we introduce an alternative methodology (based on biased Markov chains) that allows to rank countries in a conceptually consistent way. Our analysis uncovers a strong non-linear interaction between the diversificationof a country and the ubiquity of its products, thus suggesting the possible need of moving towards more efficient anddirect non-linear fixpoint algorithms to rank countries and products in the global market.
Citation: Caldarelli G, Cristelli M, Gabrielli A, Pietronero L, Scala A, et al. (2012) A Network Analysis of Countries’ Export Flows: Firm Grounds for the BuildingBlocks of the Economy. PLoS ONE 7(10): e47278. doi:10.1371/journal.pone.0047278
Editor: Alessandro Flammini, Indiana University, United States of America
Received August 12, 2011; Accepted September 14, 2012; Published October 19, 2012
Copyright: ß 2012 Caldarelli et al. This is an open-access article distributed under the terms of the Creative Commons Attribution License, which permitsunrestricted use, distribution, and reproduction in any medium, provided the original author and source are credited.
Funding: Supporting Grant: EU Future and Emerging Technologies (FET) Open project FOC nr.255987. The funders had no role in study design, data collectionand analysis, decision to publish, or preparation of the manuscript.
Competing Interests: The authors have declared that no competing interests exist.
* E-mail: [email protected]
Introduction
Complex NetworksNetworks emerged in the recent years as the main mathematical
tool for the description of complex systems. In particular, the
mathematical framework of graph theory made possible to extract
relevant information from different biological and social systems
[1–3]. In this paper we use some concepts of network theory to
address the problem of economic complexity [4–7].
Our activity is in the track of a long-standing interaction
between economics and physical sciences [8–12] and it explains,
extends and complements a recent analysis done on the network of
trades between nations [13,14]. Hidalgo and Hausmann (HH)
address the problem of competitiveness and robustness of different
countries in the global economy by studying the differences in the
Gross Domestic Product and assuming that the development of a
country is related to different ‘‘capabilities’’. While countriescannot directly trade capabilities, it is the specific combination of
those capabilities that results in different products traded. More
capabilities are supposed to bring higher returns and the
accumulation of new capabilities provides an exponentially
growing advantage. Therefore the origin of the differences in the
wealth of countries can be inferred by the record of trading
activities analyzed as the expressions of the capabilities of the
countries.
Revealed Competitive Advantage and the country-
product MatrixWe consider here the Standard Trade Classification data for the
years in the interval 1992{2000. In the following we shall analyze
the year 2000, but similar results apply for the other snapshots. For
the year 2000 the data provides information on N c~129 different
countries and N p~772 different products.
To make a fair comparison between the trades, it is useful to
employ Balassa’s Revealed Comparative Advantage (RCA) [15]
i.e. the ratio between the export share of product p in country c
and the share of product p in the world market
RCAcp~X cp
P p’X cp’
=
Pc’
X c’ p
Pc’, p’X c’ p’
ð1Þ
where X cp represents the dollar exports of country c in product p.
We consider country c to be a competitive exporter of product p
if its RCA is larger than some threshold value, which we take as 1
as in standard economics literature; previous studies have verified
that small variations around such threshold do not qualitatively
change the results.
The network structure of the country-product competition is
given by the semipositive matrix M M defined as
PLOS ONE | www.plosone.org 1 October 2012 | Volume 7 | Issue 10 | e47278
7/28/2019 Net an Export Flws
http://slidepdf.com/reader/full/net-an-export-flws 2/11
M cp~1 if RCAcpwRÃ
0 if RCAcpvRÃ
&ð2Þ
where RÃ is the threshold ( RÃ =1).
To such matrix M M we can associate a graph whose nodes are
divided into two sets fcg of N c nodes (the countries) and f pg of N pnodes (the products) where a link between a node c and a node p
exists if and only if M cp~1, i.e. a bipartite graph. The matrix M M is
strictly related to the adjacency matrix of the country-product
bipartite network.
The fundamental structure of the matrix M M is revealed by
ordering the rows of the matrix by the number of exported
products and the columns by the number of exporting countries:
doing so, M M assumes a substantially triangular structure. Such
structure reflects the fact that some countries export a large
fraction of all products (highly diversified countries), and some
products appear to be exported by most countries (ubiquitous
products). Moreover, the countries that export few products tend
to export only ubiquitous products, while highly diversified
countries are the only ones to export the products that only few
other countries export.
This triangular structure is therefore revealing us that there is asystematic relationship between the diversification of countries and
the ubiquity of the products they make. Poorly diversified
countries have a revealed comparative advantage (RCA) almost
exclusively in ubiquitous products, whereas the most diversified
countries appear to be the only ones with RCAs in the less
ubiquitous products which in general are of higher value on the
market. It is therefore plausible that such structure reflects a
ranking among the nations.
The fact that the matrix is triangular rather than block-diagonal
suggests that some successful countries are more diversified than
expected. Countries add more new products to the export mix
while keeping, at the same time, their traditional productions. The
structure of M M therefore contradicts most of classical macro-
economical models that always predict a specialization of countriesin particular sectors of production (i.e. countries should aggregate
in communities producing similar goods) that would result in a
more or less block-diagonal matrix M M .
In the following, we are going to analyze the economical
consequences of the structure of the bipartite country-product
graph described by M M . In particular, we analyze the community
structure induced by M M on the countries and products projected
networks. As a second step, we reformulate as a linear fixpoint
algorithm the HH’s reflection method to determine the countries and
products respective rankings induced by M M . In this way we are
able to clarify the critical aspects of this method and its
mathematical weakness. Finally, to assign proper weights to the
countries, we formulate a mathematically well defined biased
Markov chain process on the country-product network; to accountfor the bipartite structure of the network, we introduce a two
parameter bias in this method. To select the optimal bias, we
compare the results of our algorithm with a standard economic
indicator, the gross domestic product GDP . The optimal values of
the parameters suggests a highly non-linear interaction between
the number of different products produced by each country
( diversification ) and the number of different countries producing
each product ( ubiquity ) in determining the competitiveness of
countries and products. This fact suggests that, to better capture
the essential features of economical competition of countries, we
need a more direct and efficient non-linear approach.
Results
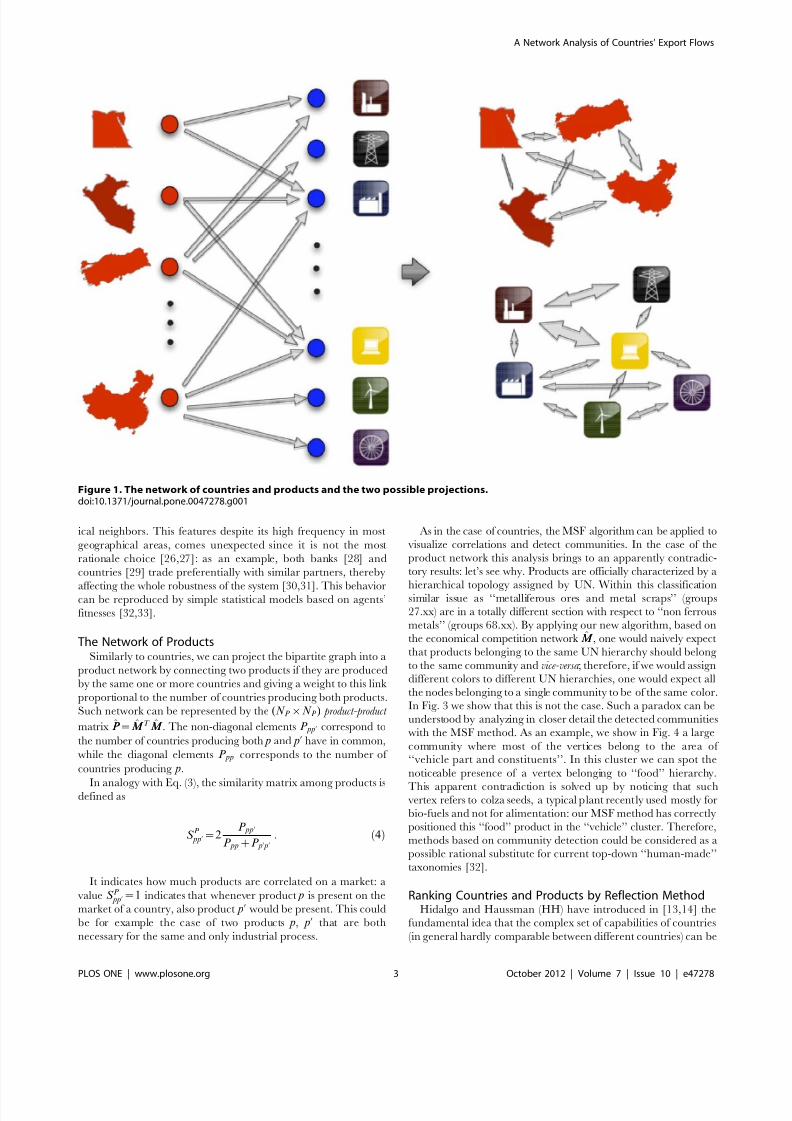
The Network of CountriesIn order to obtain an immediate understanding of the economic
relations between countries induced by their products a possible
approach is to define a projection graph obtained from the original
set of bipartite relations represented by the matrix M M [16]. Theidea is to connect the various countries with a link whose strength
is given by the number of products they mutually produce. In such
a way the information stored in the matrix M M is projected into the
network of countries as shown in Fig. 1.
The country network can be characterized by the (N C |N C )
country-country matrix C C ~M M M M T . The non-diagonal elements C cc’
correspond to the number of products that countries c and c’ have
in common (i.e. are produced by both countries). They are a
measure of their mutual competition, allowing a quantitative
comparison between economic and financial systems [17]; the
diagonal elements C cc corresponds to the number of products
produced by country c and are a measure of the diversification of
country c.
To quantify the competition among two countries, we can
define the similarity matrix among countries as
S C cc’~2
C cc’
C cczC c’c’: ð3Þ
Note that 0ƒS C cc’ƒ1 and that small (large) values indicate small
(large) correlations between the products of the two countries cand c’. Similar approaches to define a correlation between vertices
or a distance [18] have often been employed in the field of
complex networks, for example to detect protein correlations [19]
or to characterize the interdependencies among clinical traits of
the orofacial system [20,21].
The first problem for large correlation networks is how to
visualize the relevant structure. The simplest approach to visualize
the most similar vertices is realized by building a Minimal
Spanning Tree (MST) [22,23]. In this method, starting from anempty graph, edges (c,c’) are added in order of decreasing
similarity until all the nodes are connected; to obtain a tree, edges
that would introduce a loop are discarded. A further problem is to
split the graph in smaller sub-graphs (communities) that share
important common feature, i.e. have strong correlations. Similarity,
like analogous correlation indicators, can be used to detect the
inner structure of a network; while different methods for
community detection vary in their detailed implementation
[24,25], they give reasonably similar qualitative results when the
indicators contain the same information.
The MST method can be thus generalized in order to detect the
presence of communities by adding the extra condition that noedge between two nodes that have been already connected to some
other node is allowed. In this way we obtain a set of disconnected
sub-trees (i.e. a forest) embedded in the MST. This Minimal Spanning Forest (MSF) method naturally splits the network of
countries into separate subsets. This method allows for the
visualization of correlations in a large network and at the same
time performs a sort of community detection if not precise,
certainly very fast.
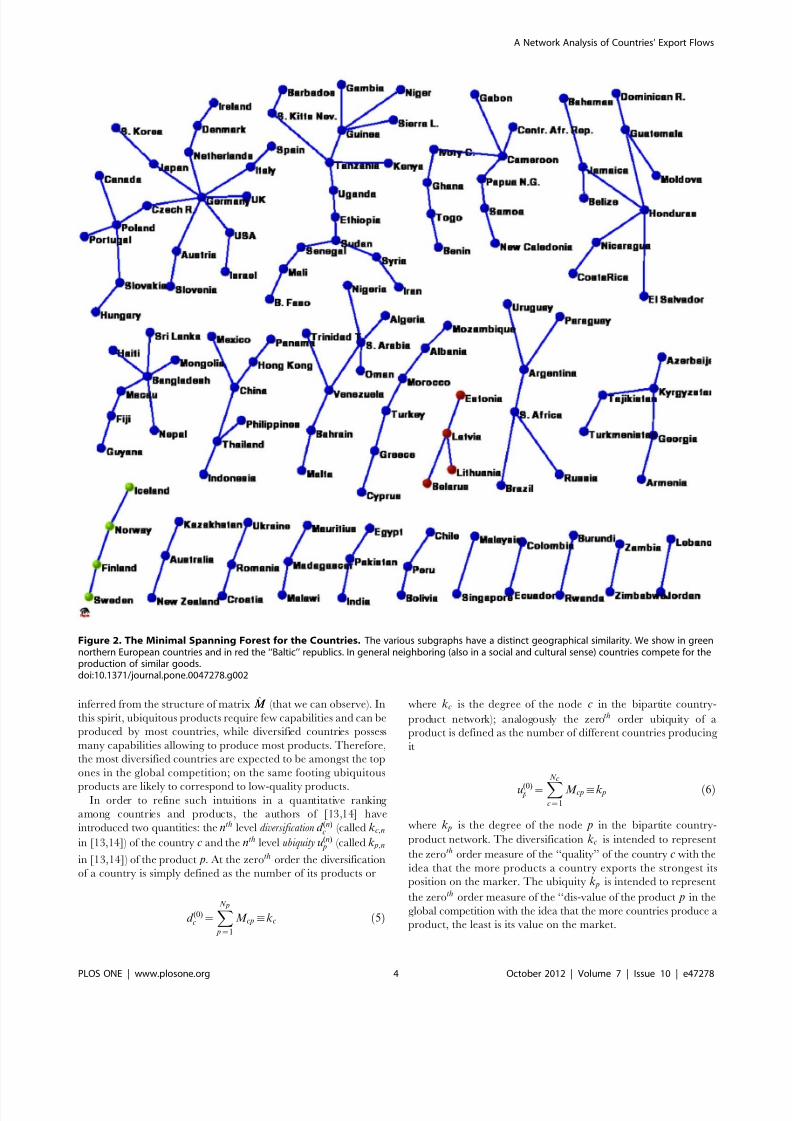
By visual inspection in Fig. 2 we can spot a large subtree
composed by developed countries and some other subtrees in
which clear geographical correlations are present. Notice that each
subtree contains countries with very similar products, i.e. countries
that are competing on the same markets. In particular, developing
countries seem to be mostly direct competitors of their geograph-
A Network Analysis of Countries’ Export Flows
PLOS ONE | www.plosone.org 2 October 2012 | Volume 7 | Issue 10 | e47278
7/28/2019 Net an Export Flws
http://slidepdf.com/reader/full/net-an-export-flws 3/11
ical neighbors. This features despite its high frequency in most
geographical areas, comes unexpected since it is not the most
rationale choice [26,27]: as an example, both banks [28] and
countries [29] trade preferentially with similar partners, thereby
affecting the whole robustness of the system [30,31]. This behaviorcan be reproduced by simple statistical models based on agents’
fitnesses [32,33].
The Network of ProductsSimilarly to countries, we can project the bipartite graph into a
product network by connecting two products if they are produced
by the same one or more countries and giving a weight to this link
proportional to the number of countries producing both products.
Such network can be represented by the (N P |N P ) product-product
matrix P P ~M M T M M . The non-diagonal elements P pp’ correspond to
the number of countries producing both p and p’ have in common,
while the diagonal elements P pp corresponds to the number of
countries producing p.
In analogy with Eq. (3), the similarity matrix among products isdefined as
S P pp’~2
P pp’
P ppzP p’ p’: ð4Þ
It indicates how much products are correlated on a market: a
value S P pp’~1 indicates that whenever product p is present on the
market of a country, also product p’ would be present. This could
be for example the case of two products p, p’ that are both
necessary for the same and only industrial process.
As in the case of countries, the MSF algorithm can be applied to
visualize correlations and detect communities. In the case of the
product network this analysis brings to an apparently contradic-
tory results: let’s see why. Products are officially characterized by a
hierarchical topology assigned by UN. Within this classificationsimilar issue as ‘‘metalliferous ores and metal scraps’’ (groups
27.xx) are in a totally different section with respect to ‘‘non ferrous
metals’’ (groups 68.xx). By applying our new algorithm, based on
the economical competition network M M , one would naively expect
that products belonging to the same UN hierarchy should belong
to the same community and vice-versa ; therefore, if we would assign
different colors to different UN hierarchies, one would expect all
the nodes belonging to a single community to be of the same color.
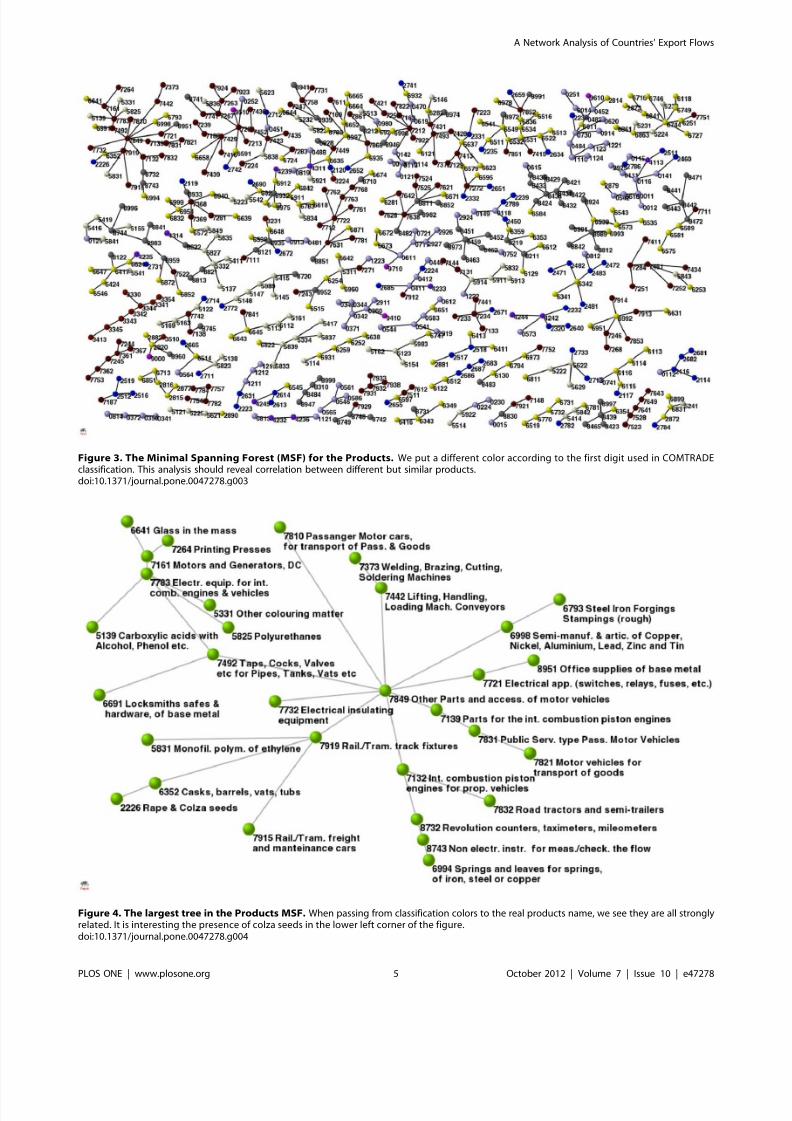
In Fig. 3 we show that this is not the case. Such a paradox can be
understood by analyzing in closer detail the detected communities
with the MSF method. As an example, we show in Fig. 4 a large
community where most of the vertices belong to the area of ‘‘vehicle part and constituents’’. In this cluster we can spot the
noticeable presence of a vertex belonging to ‘‘food’’ hierarchy.
This apparent contradiction is solved up by noticing that such vertex refers to colza seeds, a typical plant recently used mostly for
bio-fuels and not for alimentation: our MSF method has correctly
positioned this ‘‘food’’ product in the ‘‘vehicle’’ cluster. Therefore,
methods based on community detection could be considered as a
possible rational substitute for current top-down ‘‘human-made’’
taxonomies [32].
Ranking Countries and Products by Reflection MethodHidalgo and Haussman (HH) have introduced in [13,14] the
fundamental idea that the complex set of capabilities of countries
(in general hardly comparable between different countries) can be
Figure 1. The network of countries and products and the two possible projections.doi:10.1371/journal.pone.0047278.g001
A Network Analysis of Countries’ Export Flows
PLOS ONE | www.plosone.org 3 October 2012 | Volume 7 | Issue 10 | e47278
7/28/2019 Net an Export Flws
http://slidepdf.com/reader/full/net-an-export-flws 4/11
inferred from the structure of matrix M M (that we can observe). In
this spirit, ubiquitous products require few capabilities and can be
produced by most countries, while diversified countries possess
many capabilities allowing to produce most products. Therefore,
the most diversified countries are expected to be amongst the top
ones in the global competition; on the same footing ubiquitous
products are likely to correspond to low-quality products.In order to refine such intuitions in a quantitative ranking
among countries and products, the authors of [13,14] have
introduced two quantities: the nth level diversification d (n)c (called k c,n
in [13,14]) of the country c and the nth level ubiquity u(n) p (called k p,n
in [13,14]) of the product p. At the zeroth order the diversification
of a country is simply defined as the number of its products or
d (0)c ~
XN p
p~1
M cp:k c ð5Þ
where k c is the degree of the node c in the bipartite country-
product network); analogously the zeroth order ubiquity of a
product is defined as the number of different countries producing
it
u(0) p ~
XN c
c~1
M cp:k p ð6Þ
where k p is the degree of the node p in the bipartite country-
product network. The diversification k c is intended to represent
the zeroth order measure of the ‘‘quality’’ of the country c with the
idea that the more products a country exports the strongest its
position on the marker. The ubiquity k p is intended to represent
the zeroth order measure of the ‘‘dis-value of the product p in the
global competition with the idea that the more countries produce a
product, the least is its value on the market.
Figure 2. The Minimal Spanning Forest for the Countries. The various subgraphs have a distinct geographical similarity. We show in greennorthern European countries and in red the ‘‘Baltic’’ republics. In general neighboring (also in a social and cultural sense) countries compete for theproduction of similar goods.doi:10.1371/journal.pone.0047278.g002
A Network Analysis of Countries’ Export Flows
PLOS ONE | www.plosone.org 4 October 2012 | Volume 7 | Issue 10 | e47278
7/28/2019 Net an Export Flws
http://slidepdf.com/reader/full/net-an-export-flws 5/11
Figure 3. The Minimal Spanning Forest (MSF) for the Products. We put a different color according to the first digit used in COMTRADEclassification. This analysis should reveal correlation between different but similar products.doi:10.1371/journal.pone.0047278.g003
Figure 4. The largest tree in the Products MSF. When passing from classification colors to the real products name, we see they are all stronglyrelated. It is interesting the presence of colza seeds in the lower left corner of the figure.doi:10.1371/journal.pone.0047278.g004
A Network Analysis of Countries’ Export Flows
PLOS ONE | www.plosone.org 5 October 2012 | Volume 7 | Issue 10 | e47278
7/28/2019 Net an Export Flws
http://slidepdf.com/reader/full/net-an-export-flws 6/11
In the original approach these two initial quantities are refined
in an iterative way via the so-called ‘‘reflections method’’,
consisting in defining the diversification of a country at the
(nz1)th iteration as the average ubiquity of its product at the nth
iteration and the ubiquity of a country at the (nz1)th iteration as
the average diversification of its producing countries at the nth
iteration:
d (nz1)c ~
1
k c
XN p
p~1M cpu(n)
p
u(nz1) p ~
1
k p
XN c
c~1M cpd (n)
c
8>>><>>>:
ð7Þ
In vectorial form, this can be cast in the following form
d (n)~J J Au(n{1)
u(n)~J J B d (n{1)
8><>: ð8Þ
where d
(n)
is the N c{
dimensional vector of components d
(n)
c , u
(n)
is the N p{dimensional vector of components u(n) p , and where we
have called J J A~C C M M and J J B ~P P M M t (the upper suffix t stands for
‘‘transpose’’), with C C and P P respectively the N c|N c and N p|N p
square diagonal matrices defined by C cc’~k {1c dcc’ and
P pp’~k {1 p d pp’.
Such an approach suffers from some problems. The first one is
related to the fact that the process is defined in a bipartite networks
and therefore even and odd iterations have different meanings. In
fact, let us consider the diversification d (1)c of the cth country: as
prescribed by the algorithm, d (1)c is the average ubiquity of the
products of the cth country at the 0-th iteration. Therefore
countries with most ubiquitous (less valuable) products would get
an highest 1st order diversification. On the other hand, the
approximately triangular structure of M M tells us that these
countries are the same ones with a small degree and therefore
with a low value of the 0{th order diversification d (0). As shown
to by [13,14], this is the case also to higher orders; therefore the
diversifications at even and odd iterations are substantially an anti-
correlated. Conversely, successive even iterations are positively
correlated so that d (2)c looks a refinement of d (0)
c , d (4)c a refinement
of d (2)c and so on. Same considerations apply to the iterations for
the ubiquity of products.
The major problem in the HH algorithm is that it is a case of a
consensus dynamics [34], i.e. the state of a node at iteration t is just
the average of the state of its neighbors at iteration t{1. It is well
known that such iterations have the uniform state (all the nodes
equal) as the natural fixpoint. It is therefore puzzling how such
‘‘equalizing’’ procedure could lead to any form of ranking. To
solve such a puzzle, let’s write the HH algorithm as a simple
iterative linear system and analyze its behavior.
Focusing only on even iterations and on diversifications, we can
write HH procedure as:
d (2n)~J J AJ J B d (2n{2)
~(J J AJ J B )nd (0)~H H nd (0) , ð9Þ
where H H ~J J AJ J B ~C C M M P P M M t is a N c|N c squared matrix.
The matrix H H in Eq.9 is a Markovian stochastic matrix when it
acts from the right on positive vectors, in the sense that every element
H cc’§0 and
XN c
c~1
H cc’~1 :
In particular for the given M M adjacency matrix it is also ergodic.
Therefore, its spectrum of eigenvalues is bounded in absolute
value by its unique upper eigenvalue l1~1. Since H H acts on
d (2n{2) from the left, the right eigenvector e1 corresponding to the
largest eigenvalue l1~1 is simply a uniform vector with identical
components, i.e. in the n?? limit d (2n) converges to the fixpoint
e1 where all countries have the same asymptotic diversification.
It is therefore not a case that HH prescribe to stop their
algorithm at a finite number of iterations and that they introduce
as a recipe to consider as the ranking of a country the rescaled version of the 2nth level diversifications [14]
~d d (2n)c ~
d (2n)c {d (2n)
s(2n)d
, ð10Þ
where d (2n) is the arithmetic mean of all d (2n)c and s(2n)d thestandard deviation of the same set. With these prescription, HH
algorithm seems to converge to an approximately constant value
after *16 steps.
This observed behavior can be easily be explained by noticing
that, in contrast with the erroneous statement in [14], finding the
fitness by the reflection method can be reformulated as a fix-point
problem (our Eq. 9) and solved using the spectral properties of a
linear system. In fact,since the ergodic Markovian nature of
H H we can order eigenvalues/eigenvectors such that
DlN c DƒDlN c Dƒ:::ƒDl2Dvl1~1. Therefore, expanding d (0) in terms
of the right eigenvectors fe1,e2,:::,eN c g of H H the initial condition
d (0)~a1e1za2e2z:::zaN
ceN
c
,
we can write the 2n-th iterate as
d (2n)~a1e1za2l
n2e2z:::zaN cl
nN c
eN c
~a1e1za2ln2e2zO (l3=l2)nð Þ :
ð11Þ
Therefore, at sufficiently large n the ordering of the countries is
completely determined by the components of e2; notice that such
an asymptotic ordering is independent from the initial condition
d (0) and therefore should be considered as the appropriate fixpoint
renormalized fitness d à for all countries.
What happens to the HH scheme? At sufficiently large n,
Sd (2n)T&ae1 and sd (2n)!a2ln2e2z0 (l3=l2)nð Þ; therefore d (2n)
becomes proportional to e2 (Eq. 10). The number of iterations itneeded to converge is given by the ratio between l2 and l3
( (l3=l2)it%1); therefore the it*16 iterations prescribed by HH
are not a general prescription but depend on the spectrum of the
network analyzed.
Notice also that when the numerical reflection method is used,
the renormalized fitness represents a deviation O(ln2) from a
constant and can be detected only if it is bigger than the numerical
error; therefore only ‘‘not too big’’ it can be employed. On the
other hand, the spectral characterization we propose does not
suffer from such a pitfall even when. Similar considerations can be
A Network Analysis of Countries’ Export Flows
PLOS ONE | www.plosone.org 6 October 2012 | Volume 7 | Issue 10 | e47278
7/28/2019 Net an Export Flws
http://slidepdf.com/reader/full/net-an-export-flws 7/11
developed for the even iterations of the reflection method for the
products.
Biased Markov Chain Approach and Non-linearInteractions
Having assessed the problems of HH’s method, we investigate
the possibility of defining alternative linear algorithms able to
implement similar economical intuitions about the ranking of the
countries while keeping a more robust mathematical foundation.In formulating such a new scheme we will keep the approximation
of linearity for the iterations even though we shall find in the
results hints of the non-linear nature of the problem.
Our approach is inspired to the well-known PageRank
algorithm [35]. PageRank (named after the WWW, where vertices
are the pages) is one of the most famous of Bonacich centrality
measures [36]. In the original PageRank method the ranking of a
vertex is proportional to the time spent on it by an unbiased
random walker (in different contexts [11] analogous measures
assess the stability of a firm in a business firm network).
We define the weights of vertices to be proportional to the time
that an appropriately biased random walker on the network spends on
them in the large time limit [37]. As shown below, such weights,
being the generalization of k c and k p, give a measure respectivelyof competitiveness of countries and ‘‘dis-quality’’ (or lack of
competitiveness) of products. As the nodes of our bipartite network
are entities that are logically and conceptually separated (countries
and products), we assign to the random walker a different bias
when jumping from countries to products respect to jumping from
products to countries.
Let us call w(n)c weight of country c at the nth iteration and w(n)
p
fitness of product p at the nth iteration. We define the following
Markov process on the country-product bipartite network
w(nz1)c (a,b)~
PN p p~1 G cp(b)w(n)
p (a,b)
w
(nz1)
p (a,b)~PN c
c~1 G pc(a)w
(n)
c (a,b)
8><>:
ð12Þ
where the Markov transition matrix G G is given by
G cp(b)~M cpk {b
cPN cc’~1 M c’ pk
{bc’
G pc(a)~M cpk {a
pPN p p’~1 M cp’k {a
p’
8>>>>><>>>>>:
ð13Þ
Here G cp gives the probability to jump from product p to country c
in a single step, and G pc the probability to jump from country c to
product p also in a single step. Note that Eqs.(13) define a
(N czN p){dimensional connected Markov chain of period two.Therefore, random walkers initially starting from countries, will be
found on products at odd steps and on countries at even ones; the
reverse happens for random walkers starting from products. By
considering separately the random walkers starting from countries
and from products, we can reduce this Markov chain to two
ergodic Markov chains of respective dimension N c and N p. In
particular, if the walker starts from a country, using a vectorial
formalism, we can write for the weights of countries
w(nz1)c (a,b)~T T (a,b)w(n)
c (a,b) ð14Þ
where the N c|N c ergodic stochastic matrix T T is defined by
T cc’(a,b)~XN p
p~1
G cp(b)G pc’(a) : ð15Þ
At the same time for products we can write
w(nz1) p (a,b)~S S (a,b)w(n)
p (a,b) , ð16Þ
where the N p|N p ergodic stochastic matrix S S is given by
S pp’(a,b)~XN c
c~1
G pc(a)G cp’(b) : ð17Þ
Given the structure of T T and S S , it is simple to show that the two
matrices share the same spectrum which is upper bounded in
modulus by the unique eigenvalue m1~1. For both matrices, the
eigenvectors corresponding to m1 are the stationary and asymptotic
weights fwÃc (a,b)g and fwÃ
p(a,b)g of the Markov chains. In order
to find analytically such asymptotic values, we apply the detailed
balance condition:
G pcwÃc~G cpwÃ
p V(c, p) ð18Þ
which gives
wÃc~A
PN p p~1 M cpk {a
p
k {b
c
wà p~B
PN cc~1 M cpk {b
c
k {a
p
8
>><>>:ð19Þ
where A and B are normalization constants. Note that for
a~b~0 Eq. (13) gives the completely unbiased random walk for
which T T ~H H t where H H is given in Eq. (9). Therefore, in this case
Eqs. (19) become
wÃc (0,0)*k c
wà p(0,0)*k p ,
8><>: ð20Þ
as for the case of unbiased random walks on a simple connected
network the asymptotic weight of a node is proportional to its
connectivity. Thus, in the case of a~b~0 we recover the zeroth
order iteration of the HH’s reflection method. Note that, in the
same spirit of HH, wÃc (0,0) gives a rough measure of the
competitiveness of country c while wà p gives an approximate
measure of the dis-quality in the market of product p. By
continuity, we associate the same meaning of competitiveness/
disquality to the stationary states wÃc /wÃ
p(0,0) at different values of
a and b.
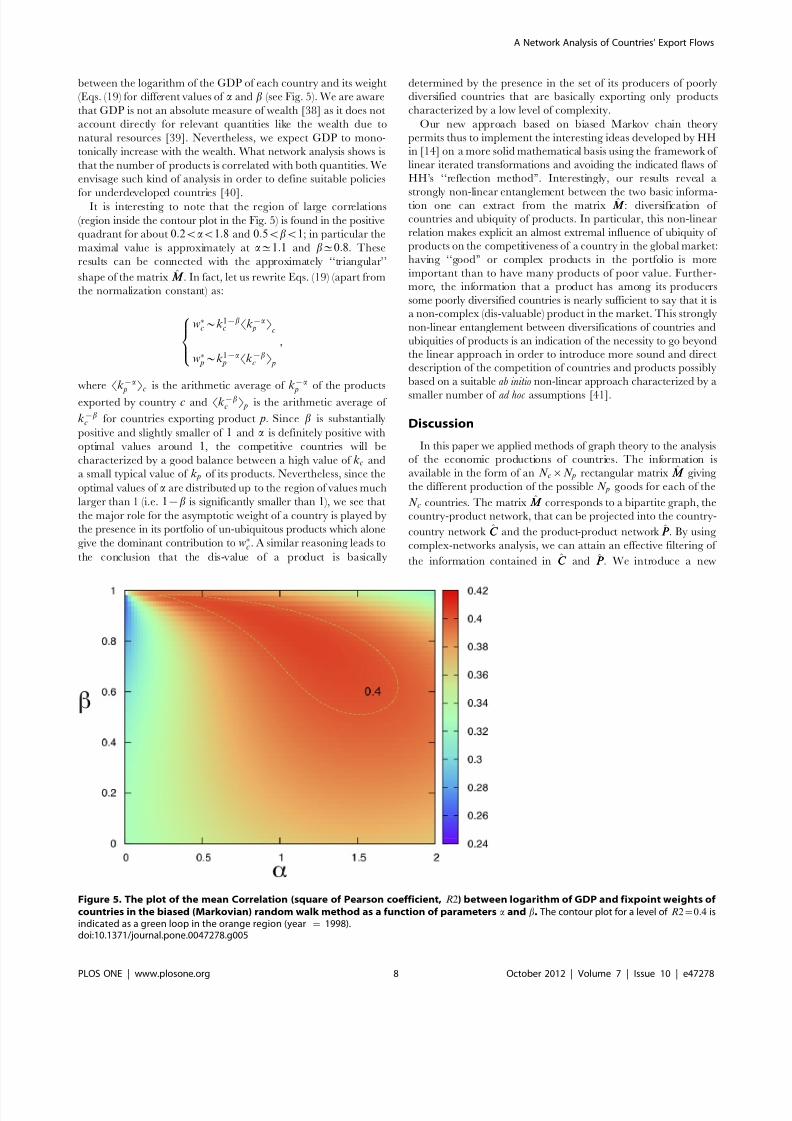
To understand the behavior of our ranking respect to the bias,
we have analyzed the mean correlation (square of the Pearson
coefficient) for the year 1998 (other years give analogous results)
A Network Analysis of Countries’ Export Flows
PLOS ONE | www.plosone.org 7 October 2012 | Volume 7 | Issue 10 | e47278
7/28/2019 Net an Export Flws
http://slidepdf.com/reader/full/net-an-export-flws 8/11
between the logarithm of the GDP of each country and its weight
(Eqs. (19) for different values of a and b (see Fig. 5). We are aware
that GDP is not an absolute measure of wealth [38] as it does not
account directly for relevant quantities like the wealth due to
natural resources [39]. Nevertheless, we expect GDP to mono-
tonically increase with the wealth. What network analysis shows is
that the number of products is correlated with both quantities. We
envisage such kind of analysis in order to define suitable policies
for underdeveloped countries [40].It is interesting to note that the region of large correlations
(region inside the contour plot in the Fig. 5) is found in the positive
quadrant for about 0:2vav1:8 and 0:5vbv1; in particular the
maximal value is approximately at a^1:1 and b^0:8. These
results can be connected with the approximately ‘‘triangular’’
shape of the matrix M M . In fact, let us rewrite Eqs. (19) (apart from
the normalization constant) as:
wÃc*k 1{b
c Sk {a p T
c
wà p*k 1{a
p Sk {bc T p
8><>: ,
where Sk {a
p
Tc
is the arithmetic average of k {a
p
of the products
exported by country c and Sk {bc T p is the arithmetic average of
k {bc for countries exporting product p. Since b is substantially
positive and slightly smaller of 1 and a is definitely positive with
optimal values around 1, the competitive countries will be
characterized by a good balance between a high value of k c and
a small typical value of k p of its products. Nevertheless, since the
optimal values of a are distributed up to the region of values much
larger than 1 (i.e. 1{b is significantly smaller than 1 ), we see that
the major role for the asymptotic weight of a country is played by
the presence in its portfolio of un-ubiquitous products which alone
give the dominant contribution to wÃc . A similar reasoning leads to
the conclusion that the dis-value of a product is basically
determined by the presence in the set of its producers of poorly
diversified countries that are basically exporting only products
characterized by a low level of complexity.
Our new approach based on biased Markov chain theory
permits thus to implement the interesting ideas developed by HH
in [14] on a more solid mathematical basis using the framework of
linear iterated transformations and avoiding the indicated flaws of
HH’s ‘‘reflection method’’. Interestingly, our results reveal a
strongly non-linear entanglement between the two basic informa-tion one can extract from the matrix M M : diversification of
countries and ubiquity of products. In particular, this non-linear
relation makes explicit an almost extremal influence of ubiquity of
products on the competitiveness of a country in the global market:
having ‘‘good’’ or complex products in the portfolio is more
important than to have many products of poor value. Further-
more, the information that a product has among its producers
some poorly diversified countries is nearly sufficient to say that it is
a non-complex (dis-valuable) product in the market. This strongly
non-linear entanglement between diversifications of countries and
ubiquities of products is an indication of the necessity to go beyond
the linear approach in order to introduce more sound and direct
description of the competition of countries and products possibly
based on a suitable ab initio non-linear approach characterized by a
smaller number of ad hoc assumptions [41].
Discussion
In this paper we applied methods of graph theory to the analysis
of the economic productions of countries. The information is
available in the form of an N c|N p rectangular matrix M M giving
the different production of the possible N p goods for each of the
N c countries. The matrix M M corresponds to a bipartite graph, the
country-product network, that can be projected into the country-
country network C C and the product-product network P P . By using
complex-networks analysis, we can attain an effective filtering of
the information contained in C C and P P . We introduce a new
Figure 5. The plot of the mean Correlation (square of Pearson coefficient, R2) between logarithm of GDP and fixpoint weights of
countries in the biased (Markovian) random walk method as a function of parameters a and b. The contour plot for a level of R2~0:4 isindicated as a green loop in the orange region (year ~ 1998).doi:10.1371/journal.pone.0047278.g005
A Network Analysis of Countries’ Export Flows
PLOS ONE | www.plosone.org 8 October 2012 | Volume 7 | Issue 10 | e47278
7/28/2019 Net an Export Flws
http://slidepdf.com/reader/full/net-an-export-flws 9/11
filtering algorithm that identifies communities of countries with
similar production. As an unexpected result, this analysis shows
that neighboring countries tend to compete over the same markets
instead of diversifying. We also show that a classification of goods
based on such filtering provides an alternative product taxonomy
determined by the countries’ activity. We then study the ranking of
the countries induced by the country-product bipartite network.
We first show that HH’s ranking is the fix-point of a linear process;in this way we can avoid some logical and numerical pitfalls and
clarify some of its weak theoretical points. Finally, in analogy with
the Google PageRank algorithm, we define a biased, two
parameters Markov chain algorithm to assign ranking weights to
countries and products by taking into account the structure of the
adjacency matrix of the country-product bipartite network. By
correlating the fix-point ranking (i.e. competitiveness of countries
and products) with the GDP of each country, we find that the
optimal bias parameters of the algorithm indicate a strongly non-
linear interaction between the diversification of the countries and
the ubiquity of the products. The fact that we still find some
discrepancies between fitnesses and GDP is related to the fact that
they measure related but different things. In particular while GDP
is a measure of the richness of a country, the fitness measures thepossibility of a certain country to sustain its growth or to recover
from crises.
Materials and Methods
Graphs A graph is a couple G ~(V ,E ) where V ~ vi Di ~1 . . . nAf g is the
set of vertices, and E (V |V is the set of edges. A graph G can be
represented via its adjacency matrix A.
Aij ~1 if an edge exists between vi and v j
0 otherwise :
&ð21Þ
The degree k i of the node vi is the number
P j Aij of its
neighbors.
An unbiased random walk on a graph G is characterized by a
probability pij ~1=k i of jumping from a vertex vi to one of its k i neighbors and is described by the jump matrix
J G ~K {1A , ð22Þ
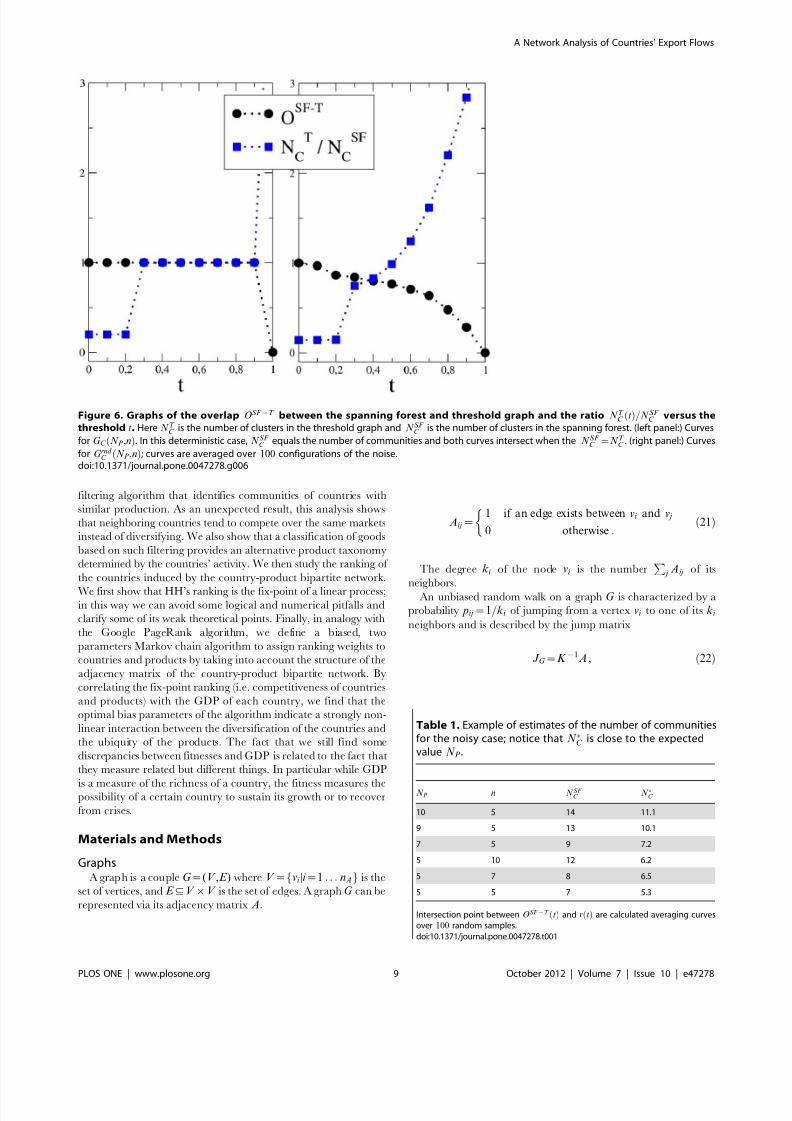
Figure 6. Graphs of the overlap OSF {T between the spanning forest and threshold graph and the ratio N T C tð Þ=N SF
C versus the
threshold t. Here N T C is the number of clusters in the threshold graph and N SF
C is the number of clusters in the spanning forest. (left panel:) Curves
for G C N P ,nð Þ. In this deterministic case, N SF C equals the number of communities and both curves intersect when the N SF
C ~N T C . (right panel:) Curves
for G rnd C N P ,nð Þ; curves are averaged over 100 configurations of the noise.
doi:10.1371/journal.pone.0047278.g006
Table 1. Example of estimates of the number of communitiesfor the noisy case; notice that N ÃC is close to the expectedvalue N P .
N P n N SF C N ÃC
10 5 14 11.1
9 5 13 10.1
7 5 9 7.2
5 10 12 6.2
5 7 8 6.5
5 5 7 5.3
Intersection point between OSF {T tð Þ and r tð Þ are calculated averaging curvesover 100 random samples.doi:10.1371/journal.pone.0047278.t001
A Network Analysis of Countries’ Export Flows
PLOS ONE | www.plosone.org 9 October 2012 | Volume 7 | Issue 10 | e47278
7/28/2019 Net an Export Flws
http://slidepdf.com/reader/full/net-an-export-flws 10/11
where K is the diagonal matrix K ij ~k i dij corresponding to the
nodes degrees.
Bipartite Graphs A bipartite graph is a triple G ~(A,B ,E ) where
A~ ai Di ~1 . . . nAf g and B ~ b j D j ~1 . . . nB
È Éare two disjoint sets
of vertices, and E (A|B is the set of edges, i.e. edges exist only
between vertices of the two different sets A and B .
The bipartite graph G can be described by the matrix M M defined as
M ij ~1 if an edge exists between ai and b j
0 otherwise :
&ð23Þ
In terms of M M , it is possible to define the adjacency matrix A of
G as
A~0 M
M T 0 :
!ð24Þ
It is also useful to define the co-occurrence matrices P A~MM T
and P B ~M T M that respectively count the number of common
neighbors between two vertices of A or of B . P A is the weighted
adjacency matrix of the co-occurrence graph C A with vertices on
A and where each non-zero element of P A corresponds to an edge
among vertices ai and a j with weight P Aij . The same is valid for the
co-occurrence matrix P B and the co-occurrence graph C B .
Many projection schemes for a bipartite graph G start from
constructing the graphs C A or C B and eliminating the edges
whose weights are less than a given threshold or whose statistical
significance is low.
Matrix from RCA
To make a fair comparison between the exports, it is useful toemploy Balassa’s Revealed Comparative Advantage (RCA) [15]
i.e. the ratio between the export share of product p in country c
and the share of product p in the world market
RCAcp~X cpP
p’
X cp’
=
Pc’
X c’ pPc’, p’
X c’ p’ð25Þ
where X cp represents the dollar exports of country c in product p.
The network structure is given by the country-product
adjacency matrix M M defined as
M cp~ 1 if RCAcpw
RÃ
0 if RCAcpvRÃ
&ð26Þ
where RÃ is the threshold. A positive entry, M cp~1 tells us that
country c is a competitive exporter of the product p.
Minimal Spanning ForestThe spanning forest algorithm (SFA) is a computationally less-
demanding variant of the Spanning Tree Algorithm (STA) where
single operations can take up to O log DV Dð Þ respect to the STA
case where all operations are O 1ð Þ. Here cluster is a synonymous
for connected component.To analyze the performance of the SFA, we use as a benchmark
a weighted network with well defined communities. We consider
the graph G C N P ,nð Þ composed joining N P communities each
consisting in a clique of n nodes; the total number of nodes is
N G ~n:N P . A function f : 1 . . . N G f g? 1 . . . N P f g associates to
each node i its community f i ; links between nodes i and j have
weight wij ~2{D f i { f j D. Thus, links inside a community have weight
one, while links among separate communities have smaller
weights. We also consider the extremely noisy case G rnd C N P ,nð Þ
where weights between nodes i and j are random variables
uniformily distributed in the interval 0,2{D f i { f j DÂ Ã
.
Furthermore we shall also consider for a weighted graph
G ~ V ,E ,W ð Þ the associate threshold graph T G ,tð Þ~ V ,E ’ð Þ
whereE ’
is the subset of edges inE
having weight higher thanthe threshold t. The threshold graph T G C N P ,nð Þ,1{Eð Þ corre-
sponds to the separated N P communities for Ev2{N P .
Finally, to compare the minimum spanning forest MSF G ð Þwith a threshold graph T G ,tð Þ, we consider the overlap OSF {T to
be the fraction of links in MSF G ð Þ that belong to the same clusterof T G ,tð Þ.
In the non-random case, the SFA individuates correctly the
communities and N P equals the number of clusters N SF C of
MSF G C N P ,nð Þð Þ. Notice that the ratio r tð Þ~N T C tð Þ=N SF
C
between the number of clusters N T C tð Þ of T G C N P ,nð Þ,tð Þ versus
the threshold t intersects the overlap OSF {T when N T C ~N P is the
correct number of communities. The left panel of Fig. 6 shows
such behavior for N P ~n~5.
In the noisy case, we find that N SF
C
overestimates N P ; on the
other hand, r tð Þ intersect OSF {T tð Þ at t~tà for values r tÃð Þ less
than one and N ÃC ~r tÃð Þ:N SF C gives a better estimate of N p. Such
an effect is shown in Table 1 that shows for several values of N P , nthe proximity of N ÃC to the expected number of communities N P .
The right panel of fig. 6 shows the intersection of curves for
N P ~n~5 in the noisy case.
Acknowledgments
We thank EU FET Open project FOC nr.255987 and CNR-PNR
National Project ‘‘Crisis-Lab’’ for support.
Author Contributions
Analyzed the data: GC MC AG LP AS AT. Contributed reagents/
materials/analysis tools: GC MC AG LP AS AT. Wrote the paper: GCMC AG LP AS AT.
References
1. Caldarelli G (2007) Scale-Free Networks: Complex Webs in Nature and
Technology. Oxford University Press.
2. Battiston S, Delli Gatti D, Gallegati M, Greenwald B, Stiglitz JE (2007) Credit
chains and bankruptcy propagation in production networks. Journal of
Economic Dynamics and Control 31: 2061–2084.
3. Gabrielli A, Caldarelli G (2007) Invasion percolation and critical transient in the
Barabasi model of human dynamics. Physical Review Letters 98: 208701.
4. Galluccio S, Caldarelli G, Marsili M, Zhang YC (1997) Scaling in currency
exchange. Physica A 245: 423.
5. Jackson MO (2008) Social and Economic Networks. Princeton University Press.
6. Borgatti SP, Mehra A, Brass DJ, Labianca G (2009) Network Analysis in the
Social Sciences. Science 323: 892–895.
7. Haldane AG, May RM (2011) Systemic risk in banking ecosystems. Nature 469:
351–355.
A Network Analysis of Countries’ Export Flows
PLOS ONE | www.plosone.org 10 October 2012 | Volume 7 | Issue 10 | e47278
7/28/2019 Net an Export Flws
http://slidepdf.com/reader/full/net-an-export-flws 11/11
8. Stanley HE, Amaral LAN, Buldyrev SV, Gopikrishnan P, Plerou V, et al. (2002)Self-organized complexity in economics and finance. Proceedings of theNational Academy of Sciences of the United States of America 99: 2561–2565.
9. MA S, Boguna M (2003) Topology of the world trade web. Phys Rev E 68:15101.
10. Schweitzer F, Fagiolo G, Sornette D, Vega-Redondo F, Vespignani A, et al.(2009) Economic Networks: The New Challenges. Science 325: 422–425.
11. Fu D, Pammolli F, Buldyrev SV, Riccaboni M, Matia K, et al. (2005) Thegrowth of business firms: Theoretical framework and empirical evidence.Proceedings of the National Academy of Sciences of the United States of
America 102: 18801–18806.
12. Majumder SR, Diermeier D, Rietz TA, Amaral LA (2009) Price dynamics inpolitical prediction markets. Proceedings of the National Academy of Sciences106: 679–684.
13. Hidalgo CA, Klinger B, Barabasi AL, Hausmann R (2007) The Product SpaceConditions the Development of Nations. Science 317: 482–487.
14. Hidalgo CA, Hausmann R (2009) The building blocks of economic complexity.Proceedings of the National Academy of Sciences 106: 10570–10575.
15. Balassa B (1965) Trade liberalization and ‘revealed’ comparative advantage.Manchester School 33: 99–123.
16. Bellman R (1997) Introduction to matrix analysis (2nd ed.). Philadelphia, PA,USA: Society for Industrial and Applied Mathematics.
17. Johnson N, Lux T (2011) Financial systems: Ecology and economics. Nature469: 302–303.
18. Bonanno G, Caldarelli G, Lillo F, Mantegna RN (2003) Topology of correlation-based minimal spanning trees in real and model markets. PhysRev E 68: 46130.
19. Brun C, Chevenet F, Martin D, Wojcik J, Guenoche A, et al. (2003) Functionalclassification of proteins for the prediction of cellular function from a protein-protein interaction network. Genome biology 5.
20. Auconi P, Caldarelli G, Scala A, Ierardo G, Polimeni A (2011) A network approach to orthodontic diagnosis. Orthodontics & Craniofacial Research 14:189–197.
21. Scala A, Auconi P, Scazzocchio M, Caldarelli G, McNamara J, et al. (2012)Using networks to understand medical data: the case of class iii malocclusions.PLoS ONE.
22. Mantegna RN (1999) Hierarchical structure in financial markets. EuropeanPhysical Journal B 11: 193–197.
23. Mantegna RN, Stanley HE (2000) An Introduction to Econophysics:Correlations and Complexity in Finance. Cambridge Univ. Press, CambridgeUK.
24. Girvan M, Newman MEJ (2002) Community structure in social and biologicalnetworks. Proceedings of the National Academy of Sciences 99: 7821–7826.
25. Fortunato S (2010) Community detection in graphs. Physics Reports 486: 75– 174.
26. Farmer JD, Lo AW (1999) Frontiers of finance: Evolution and efficient markets.Proceedings of the National Academy of Sciences 96: 9991–9992.
27. Chi Ho Yeung YCZ (2009) Minority Games, Springer. 5588–5604.28. De Masi G, Iori G, Caldarelli G (2006) Fitness model for the Italian interbank
money market. Phys Rev E 74: 66112.29. Garlaschelli D, Loffredo MI (2004) Fitness-Dependent Topological Properties of
the World Trade Web. Phys Rev Lett 93: 188701.
30. Podobnik B, Horvatic D, Petersen AM, Urosevic B, Stanley HE (2010)Bankruptcy risk model and empirical tests. Proceedings of the National Academyof Sciences.
31. Buldyrev SV, Parshani R, Paul G, Stanley HE, Havlin S (2010) Catastrophiccascade of failures in interdependent networks. Nature 464: 1025–1028.
32. Capocci A, Caldarelli G (2008) Taxonomy and clustering in collaborativesystems: the case of the on-line encyclopedia Wikipedia, EPL 81: 28006.
33. Garlaschelli D, Capocci A, Caldarelli G (2007) Self–organized network evolutioncoupled to extremal dynamics. Nature Physics 3: 813–817.
34. Shamma JS (2008) Cooperative Control of Distributed Multi-Agent Systems.Wiley-Interscience. ISBN 978-0-470-06031-5.
35. Page L, Brin S, Motwami R, Winograd T (1999) The PageRank citationranking: bringing order to the web. Standford InfoLab University website,
Accessed 2012 Sep 19. URL http://dbpubs.stanford.edu:8090/pub/1999-66.36. Bonacich P (1987) Power and Centrality: A Family of Measures. American
Journal of Sociology 92: 1170–1182.37. Zlatic V, Gabrielli A, Caldarelli G (2010) Topologically biased random walk and
community finding in networks. Physical Review E 82: 066109+.38. Arrow KJ, Dasgupta P, Goulder LH, Mumford KJ, Oleson K (2010)
Sustainability and the Measurement of Wealth. National Bureau of EconomicResearch Working Paper Series : 16599+.
39. Dasgupta P (2009) The Place of Nature in Economic Development. IdeasWebsite, Accessed 2012 Sep 19. Technical report. URL http://ideas.repec.org/p/ess/wpaper/id2233.html.
40. Dasgupta P (2010) Poverty traps: Exploring the complexity of causation.International Food Policy Research Institute (IFPRI) 2010 Vision briefs BB07Special Edition.
41. Tacchella A, Cristelli M, Caldarelli G, Gabrielli A, Pietronero L (2012)Economic complexity: a new metric for countries’ competitiveness and products’complexity. submitted to Journal of Economic Dynamics and Control.
A Network Analysis of Countries’ Export Flows
PLOS ONE | www.plosone.org 11 October 2012 | Volume 7 | Issue 10 | e47278


![g]kfn gful/s p•og k|flws/0f, aa/dxn · g]kfn gful/s p•og k|flws/0f, aa/dxn 20 20 Rupesh Murarka Male Internal Application Dilip Murarka Rupa Murarka Banarshi Lal Murarka 9860076312](https://img.pdfslide.us/doc/110x75/5f74ef3cc82bfc55af1e952d/gkfn-gfuls-paog-kflws0f-aadxn-gkfn-gfuls-paog-kflws0f-aadxn-20-20.jpg)


![g]kfn gful/s p•og k|flws/0f, aa/dxncaanepal.gov.np/storage/app/media/AdminUploaded/a... · g]kfn gful/s p•og k|flws/0f, aa/dxn 20 20 Rupesh Murarka Male Internal Application Dilip](https://img.pdfslide.us/doc/110x75/5e95bf6fd757a73b09223697/gkfn-gfuls-paog-kflws0f-aa-gkfn-gfuls-paog-kflws0f-aadxn-20-20-rupesh.jpg)