Embed Size (px)
Citation preview
www.nesdb.go.th
962 Krung Kasem Road, Pomprab, Bangkok 10100 Office of the National Economic and Social Development Board (NESDB)
NESDB ECONOMIC REPORT
Press Release 9.30 a.m. Nov 20, 2017
Thai Economic Performance in Q3 and Outlook for 2017 - 2018
NESDB ECONOMIC REPORT
Macroeconomic Strategy and Planning Office
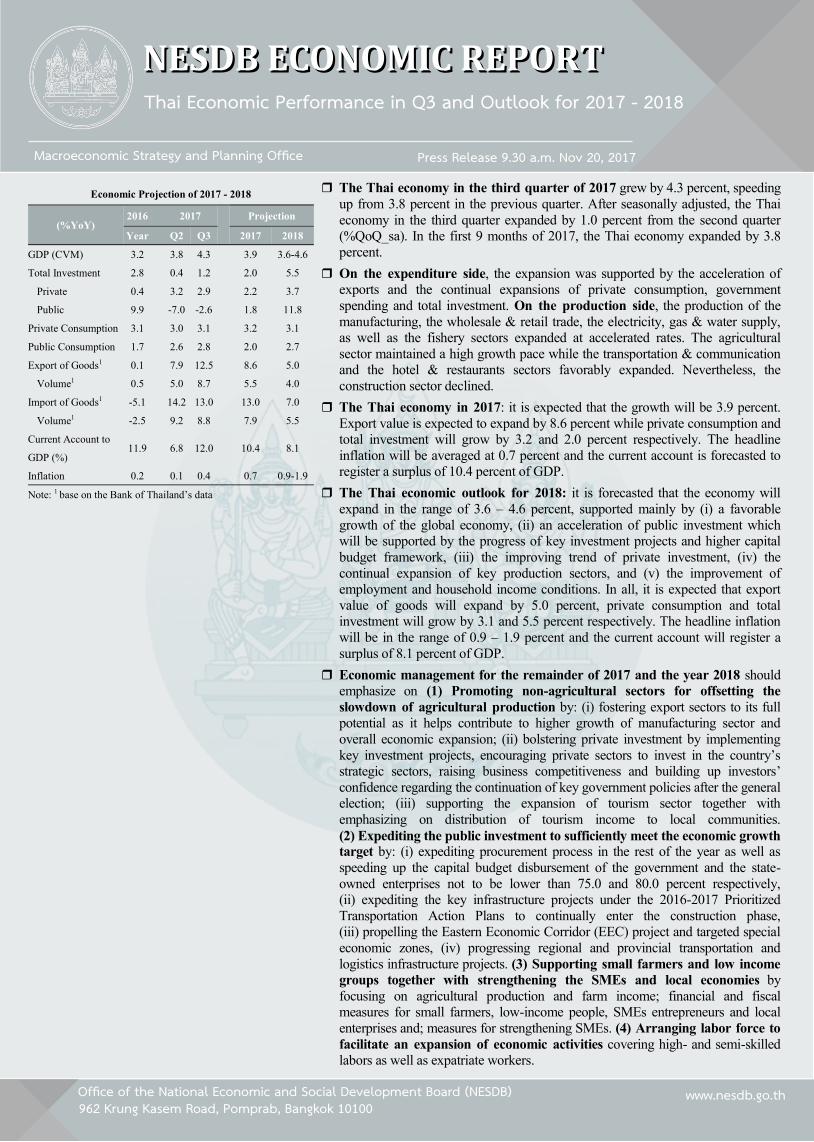
The Thai economy in the third quarter of 2017 grew by 4.3 percent, speeding
up from 3.8 percent in the previous quarter. After seasonally adjusted, the Thai
economy in the third quarter expanded by 1.0 percent from the second quarter
(%QoQ_sa). In the first 9 months of 2017, the Thai economy expanded by 3.8
percent.
On the expenditure side, the expansion was supported by the acceleration of
exports and the continual expansions of private consumption, government
spending and total investment. On the production side, the production of the
manufacturing, the wholesale & retail trade, the electricity, gas & water supply,
as well as the fishery sectors expanded at accelerated rates. The agricultural
sector maintained a high growth pace while the transportation & communication
and the hotel & restaurants sectors favorably expanded. Nevertheless, the
construction sector declined.
The Thai economy in 2017: it is expected that the growth will be 3.9 percent.
Export value is expected to expand by 8.6 percent while private consumption and
total investment will grow by 3.2 and 2.0 percent respectively. The headline
inflation will be averaged at 0.7 percent and the current account is forecasted to
register a surplus of 10.4 percent of GDP.
The Thai economic outlook for 2018: it is forecasted that the economy will
expand in the range of 3.6 – 4.6 percent, supported mainly by (i) a favorable
growth of the global economy, (ii) an acceleration of public investment which
will be supported by the progress of key investment projects and higher capital
budget framework, (iii) the improving trend of private investment, (iv) the
continual expansion of key production sectors, and (v) the improvement of
employment and household income conditions. In all, it is expected that export
value of goods will expand by 5.0 percent, private consumption and total
investment will grow by 3.1 and 5.5 percent respectively. The headline inflation
will be in the range of 0.9 – 1.9 percent and the current account will register a
surplus of 8.1 percent of GDP.
Economic management for the remainder of 2017 and the year 2018 should
emphasize on (1) Promoting non-agricultural sectors for offsetting the
slowdown of agricultural production by: (i) fostering export sectors to its full
potential as it helps contribute to higher growth of manufacturing sector and
overall economic expansion; (ii) bolstering private investment by implementing
key investment projects, encouraging private sectors to invest in the country’s
strategic sectors, raising business competitiveness and building up investors’
confidence regarding the continuation of key government policies after the general
election; (iii) supporting the expansion of tourism sector together with
emphasizing on distribution of tourism income to local communities.
(2) Expediting the public investment to sufficiently meet the economic growth target by: (i) expediting procurement process in the rest of the year as well as
speeding up the capital budget disbursement of the government and the state-
owned enterprises not to be lower than 75.0 and 80.0 percent respectively,
(ii) expediting the key infrastructure projects under the 2016-2017 Prioritized
Transportation Action Plans to continually enter the construction phase,
(iii) propelling the Eastern Economic Corridor (EEC) project and targeted special
economic zones, (iv) progressing regional and provincial transportation and
logistics infrastructure projects. (3) Supporting small farmers and low income
groups together with strengthening the SMEs and local economies by
focusing on agricultural production and farm income; financial and fiscal measures for small farmers, low-income people, SMEs entrepreneurs and local
enterprises and; measures for strengthening SMEs. (4) Arranging labor force to
facilitate an expansion of economic activities covering high- and semi-skilled
labors as well as expatriate workers.
Economic Projection of 2017 - 2018
(%YoY) 2016 2017
Projection
Year Q2 Q3 2017 2018
GDP (CVM) 3.2 3.8 4.3 3.9 3.6-4.6
Total Investment 2.8 0.4 1.2 2.0 5.5
Private 0.4 3.2 2.9 2.2 3.7
Public 9.9 -7.0 -2.6 1.8 11.8
Private Consumption 3.1 3.0 3.1 3.2 3.1
Public Consumption 1.7 2.6 2.8 2.0 2.7
Export of Goods1 0.1 7.9 12.5 8.6 5.0
Volume1 0.5 5.0 8.7 5.5 4.0
Import of Goods1 -5.1 14.2 13.0 13.0 7.0
Volume1 -2.5 9.2 8.8 7.9 5.5
Current Account to 11.9
6.8 12.0
10.4 8.1
GDP (%)
Inflation 0.2 0.1 0.4 0.7 0.9-1.9
Note: 1 base on the Bank of Thailand’s data
Macroeconomic Strategy and Planning Office
NESDB Economic Outlook
Nov 20, 2017 2
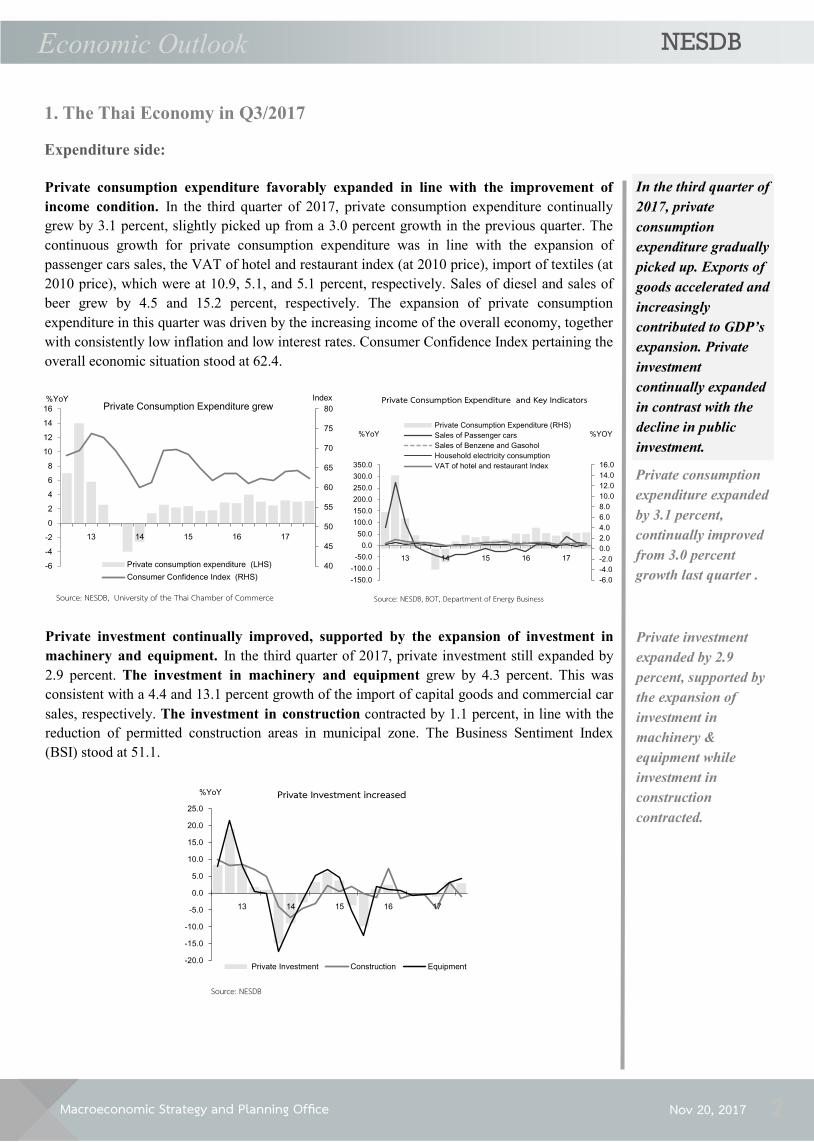
Private consumption expenditure favorably expanded in line with the improvement of
income condition. In the third quarter of 2017, private consumption expenditure continually
grew by 3.1 percent, slightly picked up from a 3.0 percent growth in the previous quarter. The
continuous growth for private consumption expenditure was in line with the expansion of
passenger cars sales, the VAT of hotel and restaurant index (at 2010 price), import of textiles (at
2010 price), which were at 10.9, 5.1, and 5.1 percent, respectively. Sales of diesel and sales of
beer grew by 4.5 and 15.2 percent, respectively. The expansion of private consumption
expenditure in this quarter was driven by the increasing income of the overall economy, together
with consistently low inflation and low interest rates. Consumer Confidence Index pertaining the
overall economic situation stood at 62.4.
Private investment continually improved, supported by the expansion of investment in
machinery and equipment. In the third quarter of 2017, private investment still expanded by
2.9 percent. The investment in machinery and equipment grew by 4.3 percent. This was
consistent with a 4.4 and 13.1 percent growth of the import of capital goods and commercial car
sales, respectively. The investment in construction contracted by 1.1 percent, in line with the
reduction of permitted construction areas in municipal zone. The Business Sentiment Index
(BSI) stood at 51.1.
1. The Thai Economy in Q3/2017
In the third quarter of
2017, private
consumption
expenditure gradually
picked up. Exports of
goods accelerated and
increasingly
contributed to GDP’s
expansion. Private
investment
continually expanded
in contrast with the
decline in public
investment.
Expenditure side:
Private consumption
expenditure expanded
by 3.1 percent,
continually improved
from 3.0 percent
growth last quarter .
Private investment
expanded by 2.9
percent, supported by
the expansion of
investment in
machinery &
equipment while
investment in
construction
contracted.
Source: NESDB, University of the Thai Chamber of Commerce
40
45
50
55
60
65
70
75
80
-6
-4
-2
0
2
4
6
8
10
12
14
16
Index%YoYPrivate Consumption Expenditure grew
Private consumption expenditure (LHS)
Consumer Confidence Index (RHS) -6.0
-4.0
-2.0
0.0
2.0
4.0
6.0
8.0
10.0
12.0
14.0
16.0
-150.0
-100.0
-50.0
0.0
50.0
100.0
150.0
200.0
250.0
300.0
350.0
%YOY%YoY
Private Consumption Expenditure and Key Indicators
Private Consumption Expenditure (RHS)
Sales of Passenger cars
Sales of Benzene and Gasohol
Household electricity consumption
VAT of hotel and restaurant Index
Source: NESDB, BOT, Department of Energy Business
Source: NESDB
-20.0
-15.0
-10.0
-5.0
0.0
5.0
10.0
15.0
20.0
25.0
%YoY Private Investment increased
Private Investment Construction Equipment
Macroeconomic Strategy and Planning Office
NESDB Economic Outlook
Nov 20, 2017 3
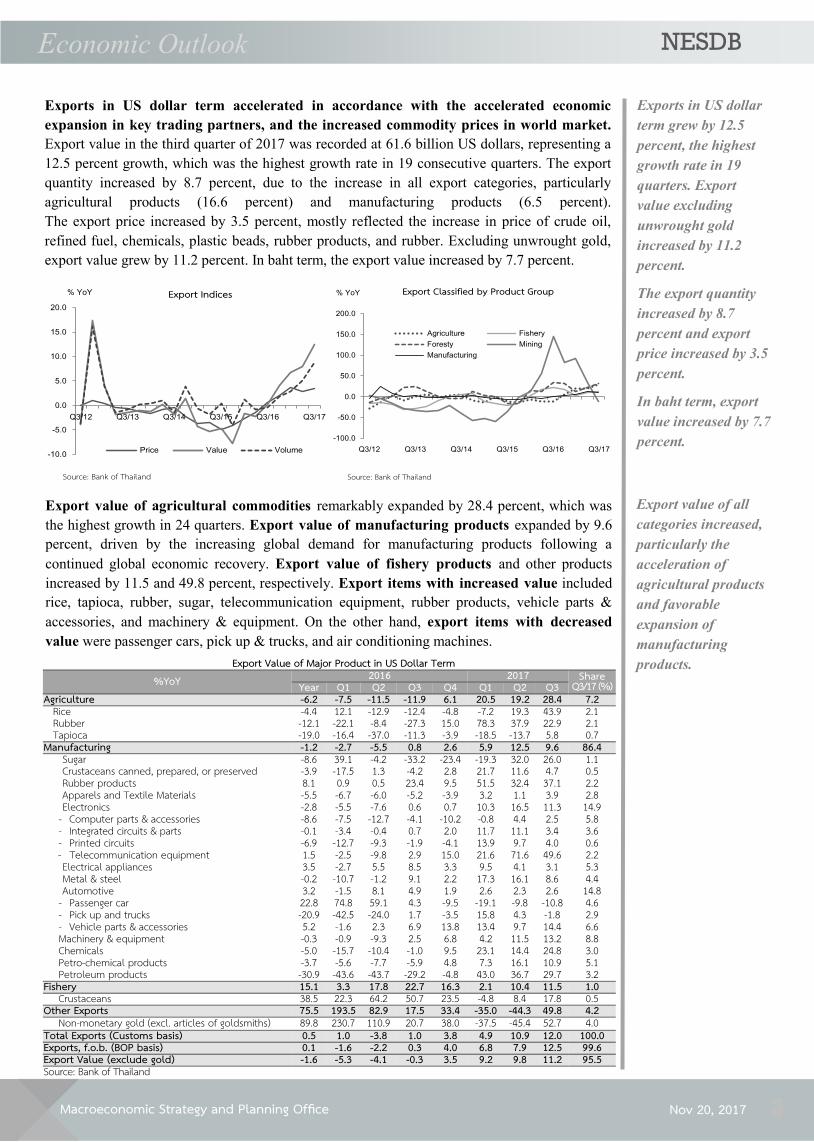
Exports in US dollar term accelerated in accordance with the accelerated economic
expansion in key trading partners, and the increased commodity prices in world market.
Export value in the third quarter of 2017 was recorded at 61.6 billion US dollars, representing a
12.5 percent growth, which was the highest growth rate in 19 consecutive quarters. The export
quantity increased by 8.7 percent, due to the increase in all export categories, particularly
agricultural products (16.6 percent) and manufacturing products (6.5 percent).
The export price increased by 3.5 percent, mostly reflected the increase in price of crude oil,
refined fuel, chemicals, plastic beads, rubber products, and rubber. Excluding unwrought gold,
export value grew by 11.2 percent. In baht term, the export value increased by 7.7 percent.
Export value of agricultural commodities remarkably expanded by 28.4 percent, which was
the highest growth in 24 quarters. Export value of manufacturing products expanded by 9.6
percent, driven by the increasing global demand for manufacturing products following a
continued global economic recovery. Export value of fishery products and other products
increased by 11.5 and 49.8 percent, respectively. Export items with increased value included
rice, tapioca, rubber, sugar, telecommunication equipment, rubber products, vehicle parts &
accessories, and machinery & equipment. On the other hand, export items with decreased
value were passenger cars, pick up & trucks, and air conditioning machines.
Exports in US dollar
term grew by 12.5
percent, the highest
growth rate in 19
quarters. Export
value excluding
unwrought gold
increased by 11.2
percent.
The export quantity
increased by 8.7
percent and export
price increased by 3.5
percent.
In baht term, export
value increased by 7.7
percent.
Export value of all
categories increased,
particularly the
acceleration of
agricultural products
and favorable
expansion of
manufacturing
products.
Source: Bank of Thailand
-10.0
-5.0
0.0
5.0
10.0
15.0
20.0
Q3/12 Q3/13 Q3/14 Q3/15 Q3/16 Q3/17
% YoY Export Indices
Price Value Volume
Source: Bank of Thailand
-100.0
-50.0
0.0
50.0
100.0
150.0
200.0
Q3/12 Q3/13 Q3/14 Q3/15 Q3/16 Q3/17
% YoY Export Classified by Product Group
Agriculture Fishery
Foresty Mining
Manufacturing
Export Value of Major Product in US Dollar Term %YoY 2016 2017 Share
Q3/17 (%) Year Q1 Q2 Q3 Q4 Q1 Q2 Q3 Agriculture -6.2 -7.5 -11.5 -11.9 6.1 20.5 19.2 28.4 7.2
Rice -4.4 12.1 -12.9 -12.4 -4.8 -7.2 19.3 43.9 2.1 Rubber -12.1 -22.1 -8.4 -27.3 15.0 78.3 37.9 22.9 2.1 Tapioca -19.0 -16.4 -37.0 -11.3 -3.9 -18.5 -13.7 5.8 0.7
Manufacturing -1.2 -2.7 -5.5 0.8 2.6 5.9 12.5 9.6 86.4 Sugar -8.6 39.1 -4.2 -33.2 -23.4 -19.3 32.0 26.0 1.1 Crustaceans canned, prepared, or preserved -3.9 -17.5 1.3 -4.2 2.8 21.7 11.6 4.7 0.5 Rubber products 8.1 0.9 0.5 23.4 9.5 51.5 32.4 37.1 2.2 Apparels and Textile Materials -5.5 -6.7 -6.0 -5.2 -3.9 3.2 1.1 3.9 2.8 Electronics -2.8 -5.5 -7.6 0.6 0.7 10.3 16.5 11.3 14.9
- Computer parts & accessories -8.6 -7.5 -12.7 -4.1 -10.2 -0.8 4.4 2.5 5.8 - Integrated circuits & parts -0.1 -3.4 -0.4 0.7 2.0 11.7 11.1 3.4 3.6 - Printed circuits -6.9 -12.7 -9.3 -1.9 -4.1 13.9 9.7 4.0 0.6 - Telecommunication equipment 1.5 -2.5 -9.8 2.9 15.0 21.6 71.6 49.6 2.2 Electrical appliances 3.5 -2.7 5.5 8.5 3.3 9.5 4.1 3.1 5.3 Metal & steel -0.2 -10.7 -1.2 9.1 2.2 17.3 16.1 8.6 4.4 Automotive 3.2 -1.5 8.1 4.9 1.9 2.6 2.3 2.6 14.8
- Passenger car 22.8 74.8 59.1 4.3 -9.5 -19.1 -9.8 -10.8 4.6 - Pick up and trucks -20.9 -42.5 -24.0 1.7 -3.5 15.8 4.3 -1.8 2.9 - Vehicle parts & accessories 5.2 -1.6 2.3 6.9 13.8 13.4 9.7 14.4 6.6 Machinery & equipment -0.3 -0.9 -9.3 2.5 6.8 4.2 11.5 13.2 8.8 Chemicals -5.0 -15.7 -10.4 -1.0 9.5 23.1 14.4 24.8 3.0 Petro-chemical products -3.7 -5.6 -7.7 -5.9 4.8 7.3 16.1 10.9 5.1 Petroleum products -30.9 -43.6 -43.7 -29.2 -4.8 43.0 36.7 29.7 3.2
Fishery 15.1 3.3 17.8 22.7 16.3 2.1 10.4 11.5 1.0 Crustaceans 38.5 22.3 64.2 50.7 23.5 -4.8 8.4 17.8 0.5
Other Exports 75.5 193.5 82.9 17.5 33.4 -35.0 -44.3 49.8 4.2 Non-monetary gold (excl. articles of goldsmiths) 89.8 230.7 110.9 20.7 38.0 -37.5 -45.4 52.7 4.0
Total Exports (Customs basis) 0.5 1.0 -3.8 1.0 3.8 4.9 10.9 12.0 100.0 Exports, f.o.b. (BOP basis) 0.1 -1.6 -2.2 0.3 4.0 6.8 7.9 12.5 99.6 Export Value (exclude gold) -1.6 -5.3 -4.1 -0.3 3.5 9.2 9.8 11.2 95.5 Source: Bank of Thailand
Macroeconomic Strategy and Planning Office
NESDB Economic Outlook
Nov 20, 2017 4
Export markets: exports to the US, EU (15), China, Japan, ASEAN (9), and the Middle
East (15) expanded, while exports to Australia slightly declined. Export to the US, China,
Japan, and EU (15) increased by 8.1, 21.7, 10.4, and 4.5 percent, respectively, following the
improvement of the US, China, Japan, and EU economies. Exports to ASEAN (9) expanded by
9.6 percent, due to the expansion of export to ASEAN (5) of 5.3 percent and CLMV countries of
16.2 percent. Exports to the Middle East (15) expanded for the first time in 13 quarters by 0.7
percent, due to the expansion in phones & devices and rice export. Meanwhile, exports to
Australia slightly fell by 0.1 percent, due to the contraction in gold and iron & steel export.
Exports to the US, EU
(15), China, Japan
and ASEAN (9)
expanded favorably.
Meanwhile, exports to
the Middle East (15)
increased for the first
time in 13 quarters.
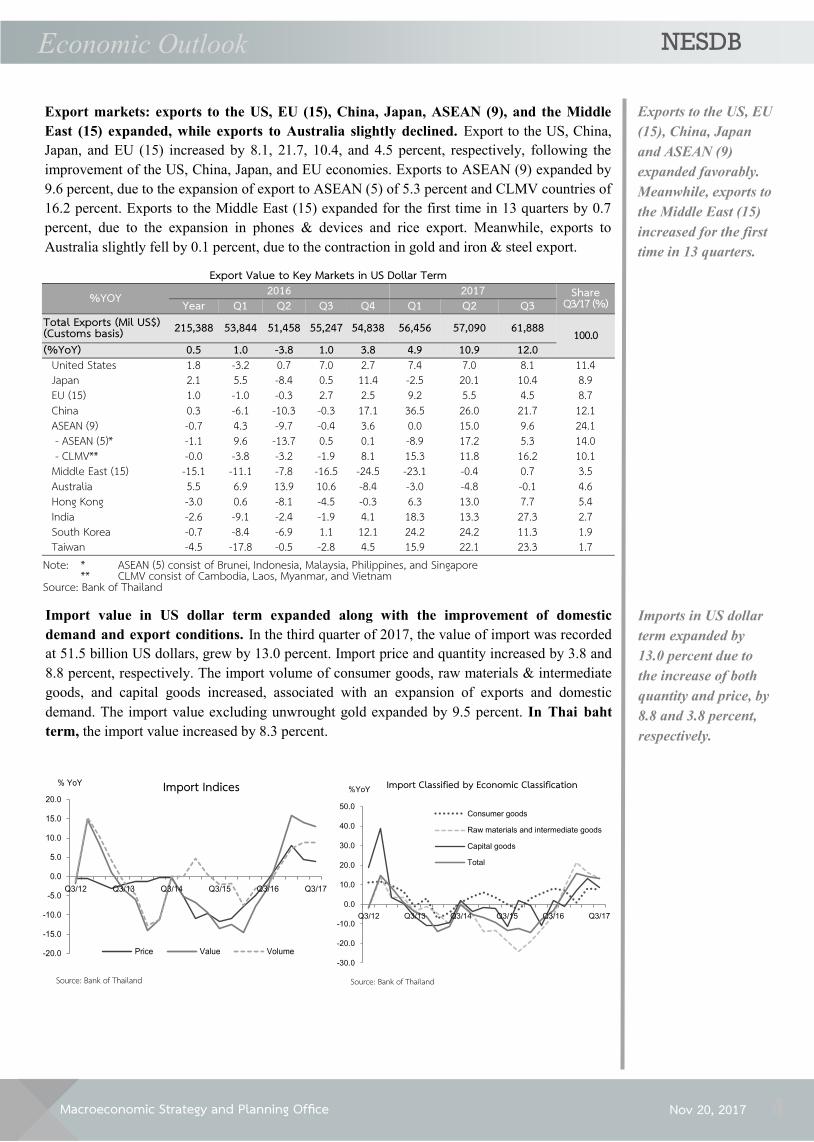
Import value in US dollar term expanded along with the improvement of domestic
demand and export conditions. In the third quarter of 2017, the value of import was recorded
at 51.5 billion US dollars, grew by 13.0 percent. Import price and quantity increased by 3.8 and
8.8 percent, respectively. The import volume of consumer goods, raw materials & intermediate
goods, and capital goods increased, associated with an expansion of exports and domestic
demand. The import value excluding unwrought gold expanded by 9.5 percent. In Thai baht
term, the import value increased by 8.3 percent.
Imports in US dollar
term expanded by
13.0 percent due to
the increase of both
quantity and price, by
8.8 and 3.8 percent,
respectively.
-20.0
-15.0
-10.0
-5.0
0.0
5.0
10.0
15.0
20.0
Q3/12 Q3/13 Q3/14 Q3/15 Q3/16 Q3/17
% YoY Import Indices
Price Value Volume
Source: Bank of Thailand Source: Bank of Thailand
-30.0
-20.0
-10.0
0.0
10.0
20.0
30.0
40.0
50.0
Q3/12 Q3/13 Q3/14 Q3/15 Q3/16 Q3/17
%YoYImport Classified by Economic Classification
Consumer goods
Raw materials and intermediate goods
Capital goods
Total
Export Value to Key Markets in US Dollar Term
%YOY 2016 2017 Share Q3/17 (%) Year Q1 Q2 Q3 Q4 Q1 Q2 Q3
Total Exports (Mil US$) (Customs basis) 215,388 53,844 51,458 55,247 54,838 56,456 57,090 61,888 100.0 (%YoY) 0.5 1.0 -3.8 1.0 3.8 4.9 10.9 12.0
United States 1.8 -3.2 0.7 7.0 2.7 7.4 7.0 8.1 11.4 Japan 2.1 5.5 -8.4 0.5 11.4 -2.5 20.1 10.4 8.9 EU (15) 1.0 -1.0 -0.3 2.7 2.5 9.2 5.5 4.5 8.7 China 0.3 -6.1 -10.3 -0.3 17.1 36.5 26.0 21.7 12.1 ASEAN (9) -0.7 4.3 -9.7 -0.4 3.6 0.0 15.0 9.6 24.1 - ASEAN (5)* -1.1 9.6 -13.7 0.5 0.1 -8.9 17.2 5.3 14.0 - CLMV** -0.0 -3.8 -3.2 -1.9 8.1 15.3 11.8 16.2 10.1 Middle East (15) -15.1 -11.1 -7.8 -16.5 -24.5 -23.1 -0.4 0.7 3.5 Australia 5.5 6.9 13.9 10.6 -8.4 -3.0 -4.8 -0.1 4.6 Hong Kong -3.0 0.6 -8.1 -4.5 -0.3 6.3 13.0 7.7 5.4 India -2.6 -9.1 -2.4 -1.9 4.1 18.3 13.3 27.3 2.7 South Korea -0.7 -8.4 -6.9 1.1 12.1 24.2 24.2 11.3 1.9 Taiwan -4.5 -17.8 -0.5 -2.8 4.5 15.9 22.1 23.3 1.7
Note: * ASEAN (5) consist of Brunei, Indonesia, Malaysia, Philippines, and Singapore ** CLMV consist of Cambodia, Laos, Myanmar, and Vietnam Source: Bank of Thailand
Macroeconomic Strategy and Planning Office
NESDB Economic Outlook
Nov 20, 2017 5
Overall, import value of all categories increased. Import value of raw materials and intermediate
goods expanded by 13.2 percent. Import of capital goods expanded by 8.6 percent, driven by the
improvement in private investment. Import of consumer goods and other imports expanded by
7.6 and 46.8 percent, respectively. Import items with increased value were crude oil, integrated
circuits & parts, materials of base metal, chemicals, other machinery & mechanical appliances
& parts, and non-monetary gold.
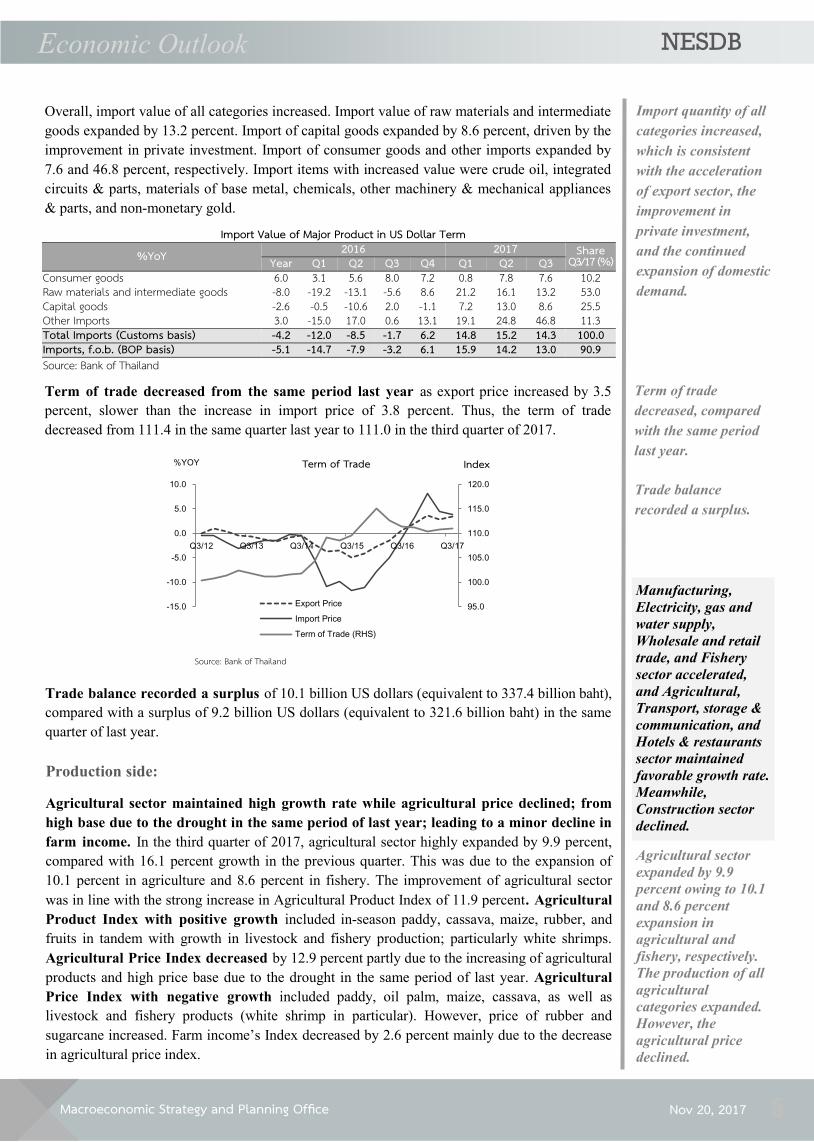
Term of trade decreased from the same period last year as export price increased by 3.5
percent, slower than the increase in import price of 3.8 percent. Thus, the term of trade
decreased from 111.4 in the same quarter last year to 111.0 in the third quarter of 2017.
Term of trade
decreased, compared
with the same period
last year.
Trade balance
recorded a surplus.
Trade balance recorded a surplus of 10.1 billion US dollars (equivalent to 337.4 billion baht),
compared with a surplus of 9.2 billion US dollars (equivalent to 321.6 billion baht) in the same
quarter of last year.
Import quantity of all
categories increased,
which is consistent
with the acceleration
of export sector, the
improvement in
private investment,
and the continued
expansion of domestic
demand.
Agricultural sector maintained high growth rate while agricultural price declined; from
high base due to the drought in the same period of last year; leading to a minor decline in
farm income. In the third quarter of 2017, agricultural sector highly expanded by 9.9 percent,
compared with 16.1 percent growth in the previous quarter. This was due to the expansion of
10.1 percent in agriculture and 8.6 percent in fishery. The improvement of agricultural sector
was in line with the strong increase in Agricultural Product Index of 11.9 percent. Agricultural
Product Index with positive growth included in-season paddy, cassava, maize, rubber, and
fruits in tandem with growth in livestock and fishery production; particularly white shrimps.
Agricultural Price Index decreased by 12.9 percent partly due to the increasing of agricultural
products and high price base due to the drought in the same period of last year. Agricultural
Price Index with negative growth included paddy, oil palm, maize, cassava, as well as
livestock and fishery products (white shrimp in particular). However, price of rubber and
sugarcane increased. Farm income’s Index decreased by 2.6 percent mainly due to the decrease
in agricultural price index.
Production side:
Manufacturing,
Electricity, gas and
water supply,
Wholesale and retail
trade, and Fishery
sector accelerated,
and Agricultural,
Transport, storage &
communication, and
Hotels & restaurants
sector maintained
favorable growth rate.
Meanwhile,
Construction sector
declined.
Source: Bank of Thailand
95.0
100.0
105.0
110.0
115.0
120.0
-15.0
-10.0
-5.0
0.0
5.0
10.0
Q3/12 Q3/13 Q3/14 Q3/15 Q3/16 Q3/17
IndexTerm of Trade
Export Price
Import Price
Term of Trade (RHS)
%YOY
Agricultural sector
expanded by 9.9
percent owing to 10.1
and 8.6 percent
expansion in
agricultural and
fishery, respectively.
The production of all
agricultural
categories expanded.
However, the
agricultural price
declined.
Import Value of Major Product in US Dollar Term %YoY 2016 Share
Q3/17 (%) 2017
Year Q1 Q2 Q3 Q4 Q1 Q2 Q3 Consumer goods 6.0 3.1 5.6 8.0 7.2 0.8 7.8 7.6 10.2 Raw materials and intermediate goods -8.0 -19.2 -13.1 -5.6 8.6 21.2 16.1 13.2 53.0 Capital goods -2.6 -0.5 -10.6 2.0 -1.1 7.2 13.0 8.6 25.5 Other Imports 3.0 -15.0 17.0 0.6 13.1 19.1 24.8 46.8 11.3 Total Imports (Customs basis) -4.2 -12.0 -8.5 -1.7 6.2 14.8 15.2 14.3 100.0 Imports, f.o.b. (BOP basis) -5.1 -14.7 -7.9 -3.2 6.1 15.9 14.2 13.0 90.9 Source: Bank of Thailand

Macroeconomic Strategy and Planning Office
NESDB Economic Outlook
Nov 20, 2017 6
Manufacturing sector
favorably improved by
4.3 percent in tandem
with the high
expansion in export
and the improvement
domestic demand.
Manufacturing sector expanded by 4.3 percent, the highest growth rate in 18 quarters, in
tandem with the strong expansion in export and the improvement of domestic demand. In
the third quarter of 2017, manufacturing sector expanded by 4.3 percent, remarkably accelerated
from 1.1 percent growth in the previous quarter along with the expansion of Manufacturing
Production Index. Manufacturing Production Index of the industries with 30-60 percent
export share to total production grew by 8.6 percent, accelerated from 0.4 percent in previous
quarter. Manufacturing Production Index of the domestic-oriented industry (with export
share of less than 30 percent to total production) expanded by 2.6 percent, improved from the
1.4 percent contraction in previous quarter. This is due to an increase in production of key
industries such as liquor & ethyl-alcohol products and vegetable oil, animal oil & animal fat.
While, Manufacturing Production Index of the export-oriented industries (with export
share of more than 60 percent to total production) contracted by 0.4, mostly owing to the decline
in the production of machinery for general purpose while most of other productions expanded.
The average capacity utilization rate stood at 62.0 percent, improved from 58.5 percent in the
same quarter last year. Manufacturing Production Index of most of key industries expanded
including automotive parts & engine, vehicle, integrated circuit (IC), petroleum and coal, rubber
& plastic product, other rubber products, and food & beverage. Manufacturing Production
Index with negative growth included machinery for general purpose, jewelry, ornaments, &
related items, and fabric fiber preparation and textile, etc.
Electricity, gas and
water supply sector
grew by 3.5 percent
following the
increased
consumption in
manufacturing,
wholesale and retail
trade, as well as hotel
and restaurant sector.
-20
-10
0
10
20
(%YoY)Agr. production index
Agr. price index
Farm income index
Source: Office of Agricultural Economics
Farmer’s Income Index decreased by 2.6 percent reflecting the reduction in prices
-75
-50
-25
0
25
50
75
100
125
Q3/13 Q3/14 Q3/15 Q3/16 Q3/17
(%YoY)Paddy Cassava
USS no.3 oil palm
Sugarcane
The prices of paddy, cassava and oil palm declined while prices of rubber and sugarcane increased.
Source: Office of Agricultural Economics
Manufacturing Production Index increased by 4.0 percent and the capacity utilization rate averaged at 62.0 percent.
Source : Office of Industrial Economics (OIE)
0.0
20.0
40.0
60.0
80.0
-40.0
-20.0
0.0
20.0
40.0
Q3/13 Q3/14 Q3/15 Q3/16 Q3/17
MPI Export<30%
Export 30-60% Export>60%
%Cap U (RHS)
(%YoY) %
Electricity, gas and water supply sector improved in line with an expansion of economic
activities. In the third quarter of 2017, electricity, gas and water supply sector grew by 3.5
percent, accelerated from a contraction of 1.3 percent in the previous quarter. Production and
sale of electricity generation increased by 4.4 percent due to the increase in consumption from
large-scale manufacturing such as (i) food, beverage and tobacco, and (ii) fundamental metal
product, along with wholesale and retail trade, as well as hotel and restaurant sector. Water
supply production and distribution increased by 2.0 percent, following a 2.3 percent increase
Macroeconomic Strategy and Planning Office
NESDB Economic Outlook
Nov 20, 2017 7
in the number of regional water users. Meanwhile, gas separation declined due to a deceleration
in the supply of natural gas.
Construction sector declined following contraction in both public and private
construction. In the third quarter of 2017, construction sector declined by 1.7 percent improved
from a contraction of 6.2 percent in the previous quarter. The public construction decreased by
2.2 percent, compared to a 12.8 percent decline in the previous quarter. Meanwhile, the private
construction decreased by 1.1 percent, compared with 3.1 percent growth in the previous
quarter. Construction of residential buildings decreased by 1.6 percent. However, construction
of office and commercial buildings grew by 3.4 percent. Construction Materials Price Index
increased by 3.0 percent following an expansion in prices of wood and wood product as well as
others construction materials, especially metal and metal products which grew by 14.9 percent.
Wholesale and retail trade sector accelerated in line with the expansion of household
expenditures and the increase in the number of foreign tourists. In the third quarter of 2017,
wholesale and retail trade sector expanded by 6.4 percent, accelerating from 6.0 percent growth
in the previous quarter. Wholesales Index grew by 5.8 percent due to expansion in wholesale-
volume of non-durable goods (such as food, pharmaceutical and medical goods, cosmetic and
toilet preparations), durable goods (such as electric household appliances and consumer
electronics), and intermediate goods. Retail Sales Index grew by 8.6 percent, owing to the
increase in all categories, mainly driven by retail sale volume of; (i) non-durable goods (such as
beverages in specialized stores, tobacco products in specialized stores); (ii) durable goods (such
as beverages in specialized stores, tobacco products in specialized stores); (iii) department
stores, supermarkets, and general stores (such as stalls and markets of food, beverages and
tobacco products); (iv) motor vehicles sale, motor repairing service, and automotive fuel sector,
and; (v) other retailing sector.
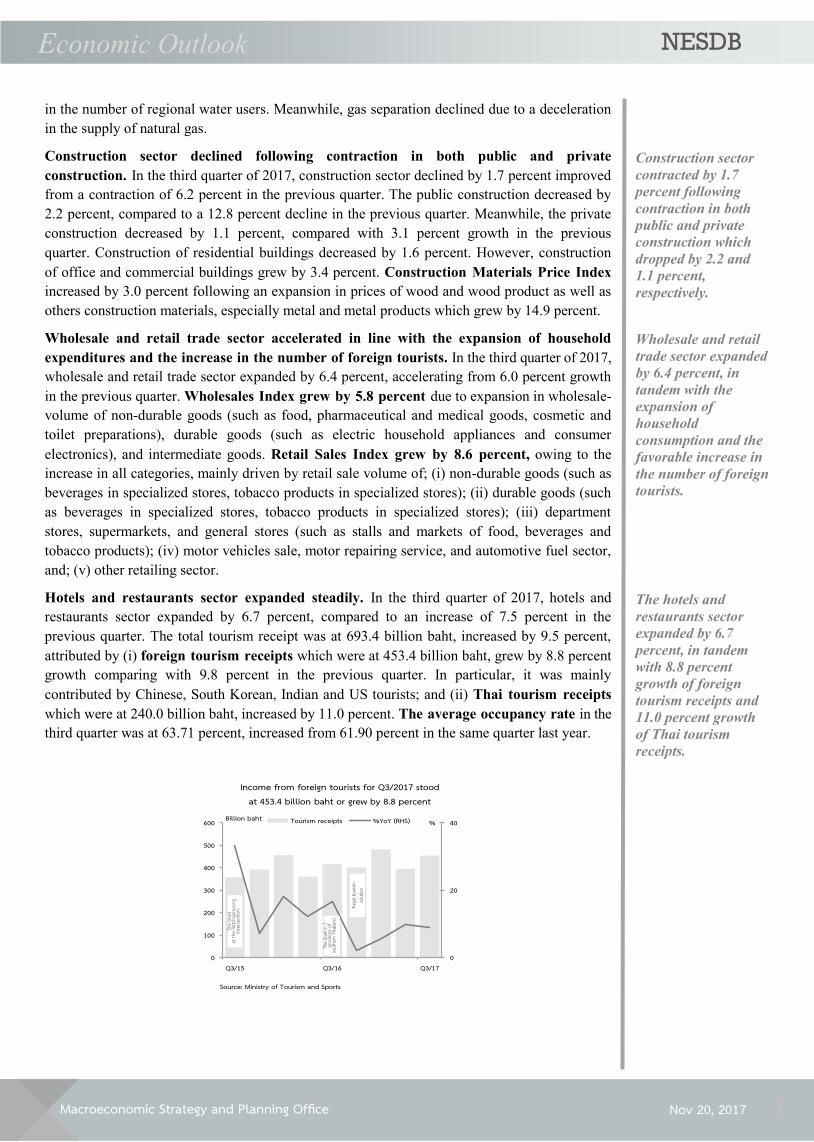
Hotels and restaurants sector expanded steadily. In the third quarter of 2017, hotels and
restaurants sector expanded by 6.7 percent, compared to an increase of 7.5 percent in the
previous quarter. The total tourism receipt was at 693.4 billion baht, increased by 9.5 percent,
attributed by (i) foreign tourism receipts which were at 453.4 billion baht, grew by 8.8 percent
growth comparing with 9.8 percent in the previous quarter. In particular, it was mainly
contributed by Chinese, South Korean, Indian and US tourists; and (ii) Thai tourism receipts
which were at 240.0 billion baht, increased by 11.0 percent. The average occupancy rate in the
third quarter was at 63.71 percent, increased from 61.90 percent in the same quarter last year.
Construction sector
contracted by 1.7
percent following
contraction in both
public and private
construction which
dropped by 2.2 and
1.1 percent,
respectively.
The hotels and
restaurants sector
expanded by 6.7
percent, in tandem
with 8.8 percent
growth of foreign
tourism receipts and
11.0 percent growth
of Thai tourism
receipts.
Wholesale and retail
trade sector expanded
by 6.4 percent, in
tandem with the
expansion of
household
consumption and the
favorable increase in
the number of foreign
tourists.
0
20
40
0
100
200
300
400
500
600
Q3/15 Q3/16 Q3/17
%Billion baht Tourism receipts %YoY (RHS)
Income from foreign tourists for Q3/2017 stood at 453.4 billion baht or grew by 8.8 percent
Source: Ministry of Tourism and Sports
The b
last
at th
e Ratc
hapr
ason
gint
erse
ction
The b
last in
7 pro
vince
s of
south
ern Th
ailand
Illegal
touri
sm
solut
ion
Macroeconomic Strategy and Planning Office
NESDB Economic Outlook
Nov 20, 2017 8
Transport, storage and communication sector favorably expanded following the
improvement in the number of tourists, agricultural & manufacturing production, and
international trade activities. In the third quarter of 2017, transport, storage and
communication sector grew by 8.1 percent, compared to 8.7 percent in the previous quarter.
Transport service grew by 8.6 percent, comparing with 8.9 percent in the previous quarter,
attributed by (i) 6.3 percent growth in land transport, (ii) 14.6 percent growth in air transport as
air flights increased by 9.2 percent, and (iii) 3.0 percent growth in water transport.
Telecommunication service expanded by 6.3 percent, comparing with 8.1 percent growth in the
previous quarter, in accordance with the better earnings performance of telecommunication
service providers, especially the fiber-optic internet services.
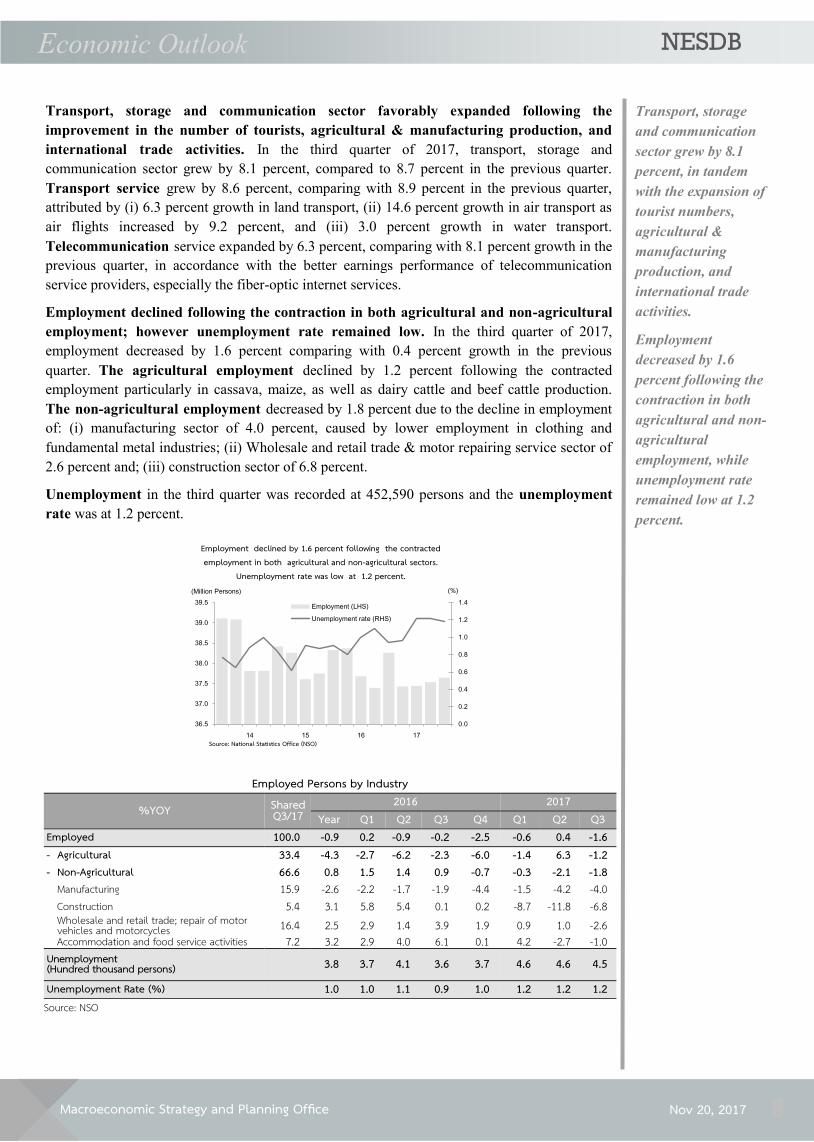
Employment declined following the contraction in both agricultural and non-agricultural
employment; however unemployment rate remained low. In the third quarter of 2017,
employment decreased by 1.6 percent comparing with 0.4 percent growth in the previous
quarter. The agricultural employment declined by 1.2 percent following the contracted
employment particularly in cassava, maize, as well as dairy cattle and beef cattle production.
The non-agricultural employment decreased by 1.8 percent due to the decline in employment
of: (i) manufacturing sector of 4.0 percent, caused by lower employment in clothing and
fundamental metal industries; (ii) Wholesale and retail trade & motor repairing service sector of
2.6 percent and; (iii) construction sector of 6.8 percent.
Unemployment in the third quarter was recorded at 452,590 persons and the unemployment
rate was at 1.2 percent.
Employment
decreased by 1.6
percent following the
contraction in both
agricultural and non-
agricultural
employment, while
unemployment rate
remained low at 1.2
percent.
Transport, storage
and communication
sector grew by 8.1
percent, in tandem
with the expansion of
tourist numbers,
agricultural &
manufacturing
production, and
international trade
activities.
0.0
0.2
0.4
0.6
0.8
1.0
1.2
1.4
36.5
37.0
37.5
38.0
38.5
39.0
39.5
Employment (LHS)
Unemployment rate (RHS)
(%)(Million Persons)
Employment declined by 1.6 percent following the contracted employment in both agricultural and non-agricultural sectors.
Unemployment rate was low at 1.2 percent.
Source: National Statistics Office (NSO)
Employed Persons by Industry
%YOY Shared Q3/17
2016 2017 Year Q1 Q2 Q3 Q4 Q1 Q2 Q3
Employed 100.0 -0.9 0.2 -0.9 -0.2 -2.5 -0.6 0.4 -1.6 - Agricultural 33.4 -4.3 -2.7 -6.2 -2.3 -6.0 -1.4 6.3 -1.2 - Non-Agricultural 66.6 0.8 1.5 1.4 0.9 -0.7 -0.3 -2.1 -1.8
Manufacturing 15.9 -2.6 -2.2 -1.7 -1.9 -4.4 -1.5 -4.2 -4.0 Construction 5.4 3.1 5.8 5.4 0.1 0.2 -8.7 -11.8 -6.8 Wholesale and retail trade; repair of motor vehicles and motorcycles 16.4 2.5 2.9 1.4 3.9 1.9 0.9 1.0 -2.6 Accommodation and food service activities 7.2 3.2 2.9 4.0 6.1 0.1 4.2 -2.7 -1.0
Unemployment (Hundred thousand persons) 3.8 3.7 4.1 3.6 3.7 4.6 4.6 4.5
Unemployment Rate (%) 1.0 1.0 1.1 0.9 1.0 1.2 1.2 1.2 Source: NSO
Macroeconomic Strategy and Planning Office
NESDB Economic Outlook
Nov 20, 2017 9
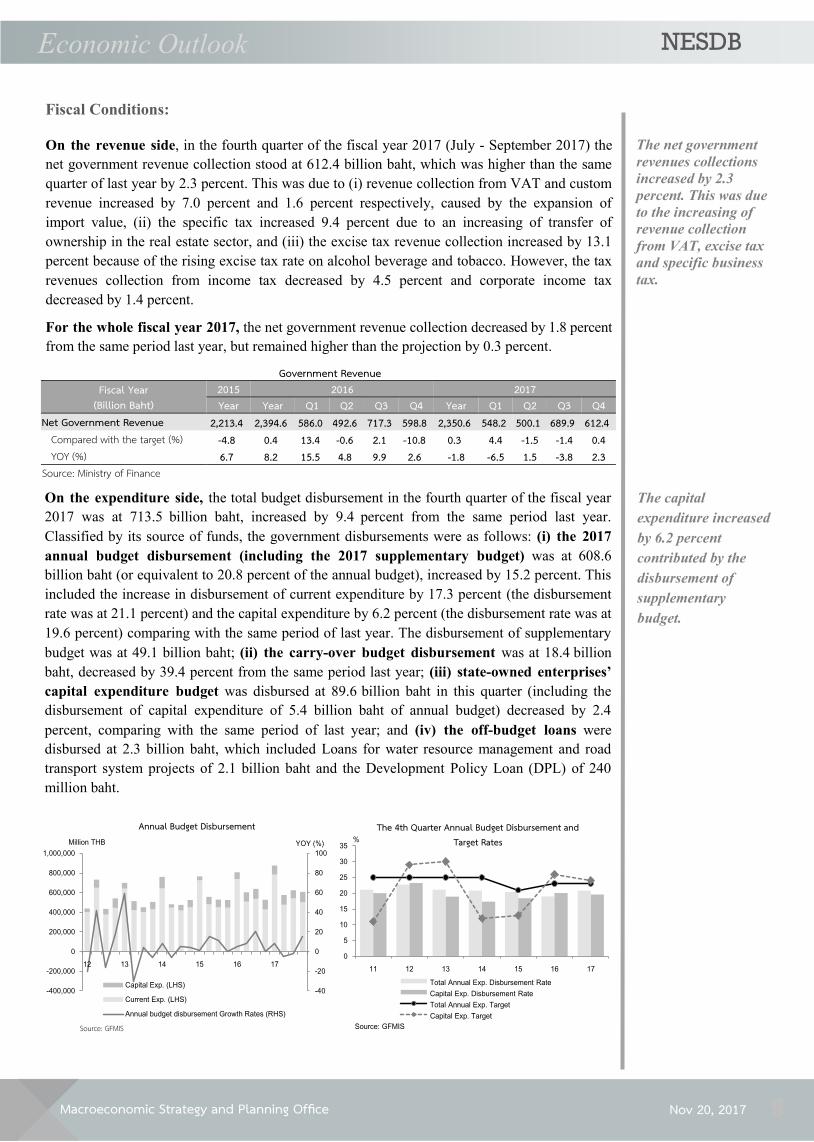
On the expenditure side, the total budget disbursement in the fourth quarter of the fiscal year
2017 was at 713.5 billion baht, increased by 9.4 percent from the same period last year.
Classified by its source of funds, the government disbursements were as follows: (i) the 2017
annual budget disbursement (including the 2017 supplementary budget) was at 608.6 billion baht (or equivalent to 20.8 percent of the annual budget), increased by 15.2 percent. This
included the increase in disbursement of current expenditure by 17.3 percent (the disbursement
rate was at 21.1 percent) and the capital expenditure by 6.2 percent (the disbursement rate was at
19.6 percent) comparing with the same period of last year. The disbursement of supplementary
budget was at 49.1 billion baht; (ii) the carry-over budget disbursement was at 18.4 billion
baht, decreased by 39.4 percent from the same period last year; (iii) state-owned enterprises’
capital expenditure budget was disbursed at 89.6 billion baht in this quarter (including the
disbursement of capital expenditure of 5.4 billion baht of annual budget) decreased by 2.4
percent, comparing with the same period of last year; and (iv) the off-budget loans were
disbursed at 2.3 billion baht, which included Loans for water resource management and road
transport system projects of 2.1 billion baht and the Development Policy Loan (DPL) of 240
million baht.
The capital
expenditure increased
by 6.2 percent
contributed by the
disbursement of
supplementary
budget.
On the revenue side, in the fourth quarter of the fiscal year 2017 (July - September 2017) the
net government revenue collection stood at 612.4 billion baht, which was higher than the same
quarter of last year by 2.3 percent. This was due to (i) revenue collection from VAT and custom
revenue increased by 7.0 percent and 1.6 percent respectively, caused by the expansion of
import value, (ii) the specific tax increased 9.4 percent due to an increasing of transfer of
ownership in the real estate sector, and (iii) the excise tax revenue collection increased by 13.1
percent because of the rising excise tax rate on alcohol beverage and tobacco. However, the tax
revenues collection from income tax decreased by 4.5 percent and corporate income tax
decreased by 1.4 percent.
For the whole fiscal year 2017, the net government revenue collection decreased by 1.8 percent
from the same period last year, but remained higher than the projection by 0.3 percent.
Fiscal Conditions:
The net government
revenues collections
increased by 2.3
percent. This was due
to the increasing of
revenue collection
from VAT, excise tax
and specific business
tax.
Government Revenue Fiscal Year
(Billion Baht) 2015 2016 2017 Year Year Q1 Q2 Q3 Q4 Year Q1 Q2 Q3 Q4
Net Government Revenue 2,213.4 2,394.6 586.0 492.6 717.3 598.8 2,350.6 548.2 500.1 689.9 612.4 Compared with the target (%) -4.8 0.4 13.4 -0.6 2.1 -10.8 0.3 4.4 -1.5 -1.4 0.4 YOY (%) 6.7 8.2 15.5 4.8 9.9 2.6 -1.8 -6.5 1.5 -3.8 2.3
Source: Ministry of Finance
-40
-20
0
20
40
60
80
100
-400,000
-200,000
0
200,000
400,000
600,000
800,000
1,000,000
YOY (%)Million THB
Source: GFMIS
Annual Budget Disbursement
Capital Exp. (LHS)
Current Exp. (LHS)
Annual budget disbursement Growth Rates (RHS)
0
5
10
15
20
25
30
35
%
Source: GFMIS
The 4th Quarter Annual Budget Disbursement and Target Rates
Total Annual Exp. Disbursement Rate
Capital Exp. Disbursement Rate
Total Annual Exp. Target
Capital Exp. Target
Macroeconomic Strategy and Planning Office
NESDB Economic Outlook
Nov 20, 2017 10
For the whole fiscal year 2017, (i) the annual budget disbursement amounted to 2,686.6 billion
baht, increased by 4.2 percent from the same period of previous year (the disbursement rate was
at 91.9 percent, lower than the same period last year rate of 92.9 percent). The increase in the
annual budget disbursement was contributed by the capital expenditure’s disbursement which
increased by 4.4 percent from the same period of last year; (ii) the carry-over budget
disbursement amounted to 182.5 billion baht (equivalent to 74.6 percent of total carry-over
budget); (iii) state-owned enterprises’ capital expenditure budget disbursement amounted to
345.9 billion baht; and (iv) the off-budget loans disbursement amounted to 9.4 billion baht.
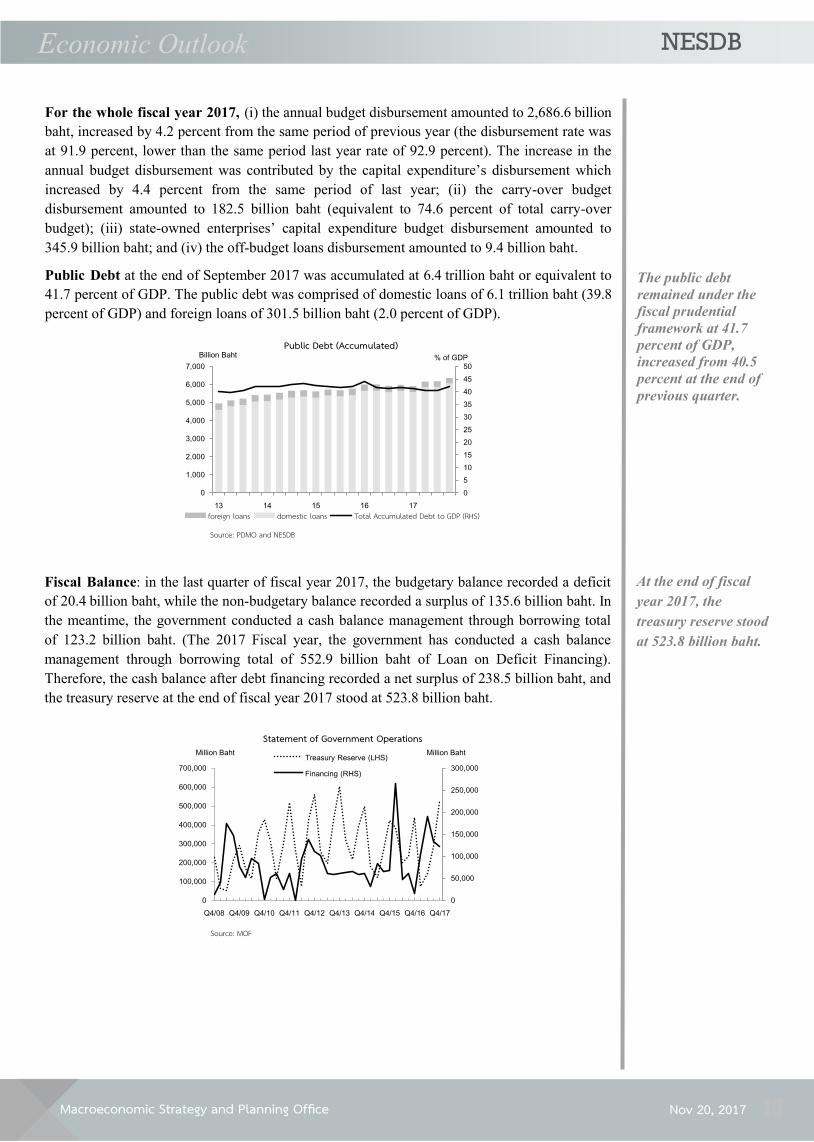
Public Debt at the end of September 2017 was accumulated at 6.4 trillion baht or equivalent to
41.7 percent of GDP. The public debt was comprised of domestic loans of 6.1 trillion baht (39.8
percent of GDP) and foreign loans of 301.5 billion baht (2.0 percent of GDP).
The public debt
remained under the
fiscal prudential
framework at 41.7
percent of GDP,
increased from 40.5
percent at the end of
previous quarter.
At the end of fiscal
year 2017, the
treasury reserve stood
at 523.8 billion baht.
0
5
10
15
20
25
30
35
40
45
50
0
1,000
2,000
3,000
4,000
5,000
6,000
7,000
% of GDPBillion Baht
Source: PDMO and NESDB
Public Debt (Accumulated)
foreign loans domestic loans Total Accumulated Debt to GDP (RHS)
0
50,000
100,000
150,000
200,000
250,000
300,000
0
100,000
200,000
300,000
400,000
500,000
600,000
700,000
Q4/08 Q4/09 Q4/10 Q4/11 Q4/12 Q4/13 Q4/14 Q4/15 Q4/16 Q4/17
Source: MOF
Statement of Government Operations
Treasury Reserve (LHS)
Financing (RHS)
Million BahtMillion Baht
Fiscal Balance: in the last quarter of fiscal year 2017, the budgetary balance recorded a deficit
of 20.4 billion baht, while the non-budgetary balance recorded a surplus of 135.6 billion baht. In
the meantime, the government conducted a cash balance management through borrowing total
of 123.2 billion baht. (The 2017 Fiscal year, the government has conducted a cash balance
management through borrowing total of 552.9 billion baht of Loan on Deficit Financing).
Therefore, the cash balance after debt financing recorded a net surplus of 238.5 billion baht, and
the treasury reserve at the end of fiscal year 2017 stood at 523.8 billion baht.

Macroeconomic Strategy and Planning Office
NESDB Economic Outlook
Nov 20, 2017 11
Policy interest rate
remained unchanged,
though policy
direction in the
advanced economies
became normalized.
The deposit and
lending rates of
commercial banks
and SFIs remained
stable. However, real
rates decreased,
following a pick up in
headline inflation
rate.
The policy rate was kept unchanged at 1.50 percent per annum throughout the third
quarter.
During the meeting on 16 August and 27 September, the Monetary Policy Committee
maintained its accommodative policy stance at 1.50 percent per annum as demand-pull
inflationary pressure still subdued. Meanwhile, Fed decided to leave policy rate on hold at a
range of 1.00 - 1.25 percent per annum at its 20 September meeting, and announced that it
would begin to reduce the size of Fed balance sheet towards 4.5 trillion dollars. The ECB, BOE
and BOJ also kept their policy rates and pursued their size of quantitative measures as in
previous quarter. Given inflation below their targets, several central banks in the region still held
their interest rates and some of them even further lowered policy rates. In particular, Bank of
Indonesia cut its policy rates twice during August to September, and then Bank of India together
with the Central of Russia also edged down their individual rates in August and September.
In October 2017, the ECB indicated a decision to extend its asset purchase program until
September 2018, but reducing the pace of monthly asset purchases to 30 billion Euros from
January 2018. At its 31 October meeting, Fed continued to keep existing policy rate at a range
of 1.00 - 1.25 percent per annum, however, it was expected another hike in December meeting.
All commercial banks and Specialized Financial Institutions (SFIs) kept their both 12-
month deposit rates and MLR lending rates at the same level as in the previous quarter. In
the meantime, Bank of Thailand tightened rules governing credit card and personal loan,
particularly limited credit line and reduced ceiling for interest charged on credit card loan.
Nonetheless, real deposit and lending rates decreased due to the increase in headline inflation
rate after a pick up in energy price and a slowdown declining in raw food prices.
Financial Conditions:
Policy Interest Rate
(%) At the end of
period
2016 2017
Year Q1 Q2 Q3 Q4 Q1 Q3 Jul Aug Sep Q2 Oct
USA 0.50-0.75 0.25-0.50 0.25-0.50 0.25-0.50 0.50-0.75 0.75-1.00 1.00-1.25 1.00-1.25 1.00-1.25 1.00-1.25 1.00-1.25 1.00-1.25
EU 0.00 0.00 0.00 0.00 0.00 0.00 0.00 0.00 0.00 0.00 0.00 0.00 England 0.25 0.50 0.50 0.25 0.25 0.25 0.25 0.25 0.25 0.25 0.25 0.25 Japan -0.10 -0.10 -0.10 -0.10 -0.10 -0.10 -0.10 -0.10 -0.10 -0.10 -0.10 -0.10 Australia 1.50 2.00 1.75 1.50 1.50 1.50 1.50 1.50 1.50 1.50 1.50 1.50 New Zealand 2.00 2.25 2.25 2.00 2.00 1.75 1.75 1.75 1.75 1.75 1.75 1.75 Russia 10.00 11.00 10.50 10.00 10.00 9.75 8.50 9.00 9.00 8.50 9.00 8.25 China 4.35 4.35 4.35 4.35 4.35 4.35 4.35 4.35 4.35 4.35 4.35 4.35 Taiwan 1.375 1.50 1.50 1.375 1.375 1.375 1.375 1.375 1.375 1.375 1.375 1.375 Korea, South 1.25 1.50 1.25 1.25 1.25 1.25 1.25 1.25 1.25 1.25 1.25 1.25 India 6.50 6.75 6.50 6.50 6.50 6.25 6.00 6.25 6.00 6.00 6.25 6.00 Indonesia (BI Rate) 6.50 6.75 6.50 - - - - - - - - -
Indonesia* (BI 7-Day RR Rate) 4.75 - 5.25 5.00 4.75 4.75 4.75 4.25 4.75 4.50 4.25 4.25
Philippines 3.00 4.00 3.00 3.00 3.00 3.00 3.00 3.00 3.00 3.00 3.00 3.00 Thailand 1.50 1.50 1.50 1.50 1.50 1.50 1.50 1.50 1.50 1.50 1.50 1.50 Source: Collected by NESDB Remark: In August 2016, Indonesia introduced a new policy rate known as the BI 7-Day (Reverse) Repo Rate in order to replace the former reference rate – BI Rate. The new policy rate was retroactive since April 2016.

Macroeconomic Strategy and Planning Office
NESDB Economic Outlook
Nov 20, 2017 12
Thai Baht against US Dollar appreciated. During the third quarter of 2017, an average
exchange rate was at 33.37 baht per US dollar, appreciating 2.7 percent relatively to the
previous quarter. The appreciation was a result of US dollar depreciation pressured by (i) the
uncertain pace of further the Federal Reserve (Fed)’s interest rate hike (ii) concerns over
possible delays of the US economic stimulus package caused by a slow progress of President
Trump’s healthcare reform proposal. In addition, Thai baht was also strengthened by current
account surplus as well as net buy of foreign portfolio investment especially in the bond market.
However, in the last week of the third quarter, the baht appreciation was slightly weighted down
after the US economic indicators showed a clearer sign of economic recovery. In the third
quarter of 2017, an average Thai baht against trading partners (NEER)1 appreciated by 1.2
Private loan of
Depository
Corporations
decelerated, due
mainly to a slowdown
in loan for large
firms. In contrast,
household loans
continually expanded.
Thai Baht against US
dollar appreciated as
a result of weakening
US dollar, current
account surplus and
inflow of foreign
portfolio investment.
In October 2017, the MLR and MRR lending rates of commercial banks slightly edged up,
which was due to a completion of retail loan transfer to a medium-sized commercial bank after
another foreign bank decided to change its business model. Meanwhile, deposit and lending
rates of other commercial banks and SFIs stayed at the same level as seen in the previous month.
Furthermore, the real deposit and lending rates were stable, following a steady headline inflation
rate.
In the third quarter of 2017, Private loan of Depository Corporations grew by 3.2 percent,
decelerated from a 3.4 percent growth in the previous quarter. Business loan in this quarter grew by
2.9 percent, slowed down from a 4.2-percent growth in the previous quarter, owing to the
deceleration of loan for large firms from commercial banks and a decrease in loan from Specialized
Financial Institutions (SFIs). In particular, the slowdown of loan from commercial banks found in
those for manufacturing, real estate business and accommodation and food service activities sector.
In contrast, household loans accelerated from the previous quarter following the expansion in credit
card loan, hire purchase loan and housing loan. Meanwhile, Non-Performing Loan to total
outstanding loan ratio rose from 2.95 percent to 2.98 in this quarter.
0
2
4
6
8
10
12
0
2
4
6
8
10
12
14 15 16 17
% YOY% YOY
private loan (excluding accrued interest)
Business loan (RHS)
Household loan (RHS)
Private loan of Depository Corporations decelerated, mainly from a slowdown in loan for large firms
Source: Bank of Thailand
-6
-4
-2
0
2
4
6
8
10
12
14
16
18
1
2
3
4
5
6
7
8
9
14 15 16 17
% YOY.% YOYBusiness loan
Manufacturing loan (RHS)
real estate business (RHS)
accommodation and food service activities (RHS)
Business loan slowed down from the acceleration in loan for large firms
Source: Bank of Thailand
-6
-4
-2
0
2
4
6
8
10
12
14
16
18
1
2
3
4
5
6
7
8
9
10
14 15 16 17
% YOY.% YOYHousehold loan
credit card (RHS)
hire purchase (RHS)
housing (RHS)
Household loan accelerated from the previous quarter
Source: Bank of Thailand
1 The BOT began using the new NEER and REER in March 2014. The base year would also be changed to 2012, that the indicators could capture the
true structure of trade in line with changing international dynamics.
Macroeconomic Strategy and Planning Office
NESDB Economic Outlook
Nov 20, 2017 13
percent compared with the same period of last year. This was in line with a 1.2-percent
appreciation of the real effective exchange rate (REER).
In October 2017, the average exchange rate was at 33.25 baht per US dollar, slightly
depreciating from September average. This was caused by strengthening US dollar supported by
(i) European Central Bank’s policy decision, which kept its policy rate on hold and decided to
scale down the pace of its stimulus program, effective on January – September 2018. (ii) further
progress of President Trump’s tax reform plans after the senate approved the 2018 budget
resolution.
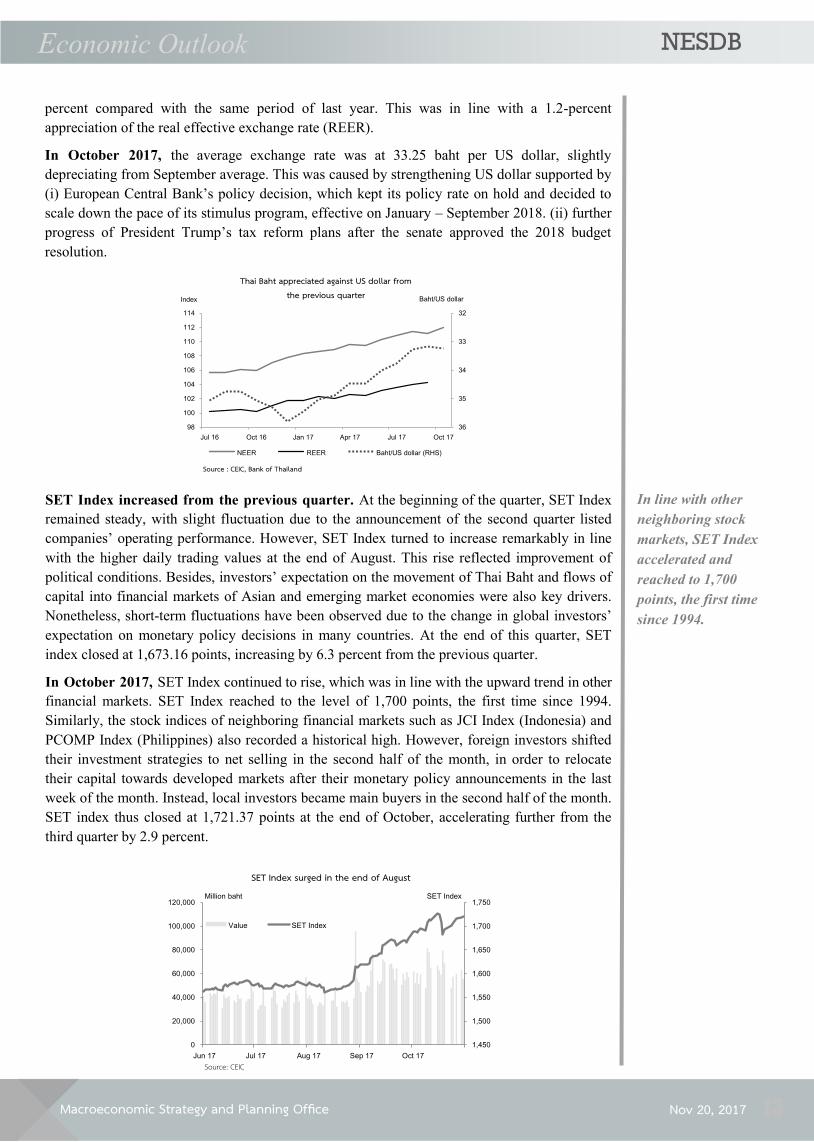
In line with other
neighboring stock
markets, SET Index
accelerated and
reached to 1,700
points, the first time
since 1994.
SET Index increased from the previous quarter. At the beginning of the quarter, SET Index
remained steady, with slight fluctuation due to the announcement of the second quarter listed
companies’ operating performance. However, SET Index turned to increase remarkably in line
with the higher daily trading values at the end of August. This rise reflected improvement of
political conditions. Besides, investors’ expectation on the movement of Thai Baht and flows of
capital into financial markets of Asian and emerging market economies were also key drivers.
Nonetheless, short-term fluctuations have been observed due to the change in global investors’
expectation on monetary policy decisions in many countries. At the end of this quarter, SET
index closed at 1,673.16 points, increasing by 6.3 percent from the previous quarter.
In October 2017, SET Index continued to rise, which was in line with the upward trend in other
financial markets. SET Index reached to the level of 1,700 points, the first time since 1994.
Similarly, the stock indices of neighboring financial markets such as JCI Index (Indonesia) and
PCOMP Index (Philippines) also recorded a historical high. However, foreign investors shifted
their investment strategies to net selling in the second half of the month, in order to relocate
their capital towards developed markets after their monetary policy announcements in the last
week of the month. Instead, local investors became main buyers in the second half of the month.
SET index thus closed at 1,721.37 points at the end of October, accelerating further from the
third quarter by 2.9 percent.
Thai Baht appreciated against US dollar from the previous quarter
Source : CEIC, Bank of Thailand
32
33
34
35
3698
100
102
104
106
108
110
112
114
Jul 16 Oct 16 Jan 17 Apr 17 Jul 17 Oct 17
Index
NEER REER Baht/US dollar (RHS)
Baht US dollar
1,450
1,500
1,550
1,600
1,650
1,700
1,750
0
20,000
40,000
60,000
80,000
100,000
120,000
Jun 17 Jul 17 Aug 17 Sep 17 Oct 17
SET IndexMillion baht
Value SET Index
SET Index surged in the end of August
Source: CEIC
Macroeconomic Strategy and Planning Office
NESDB Economic Outlook
Nov 20, 2017 14
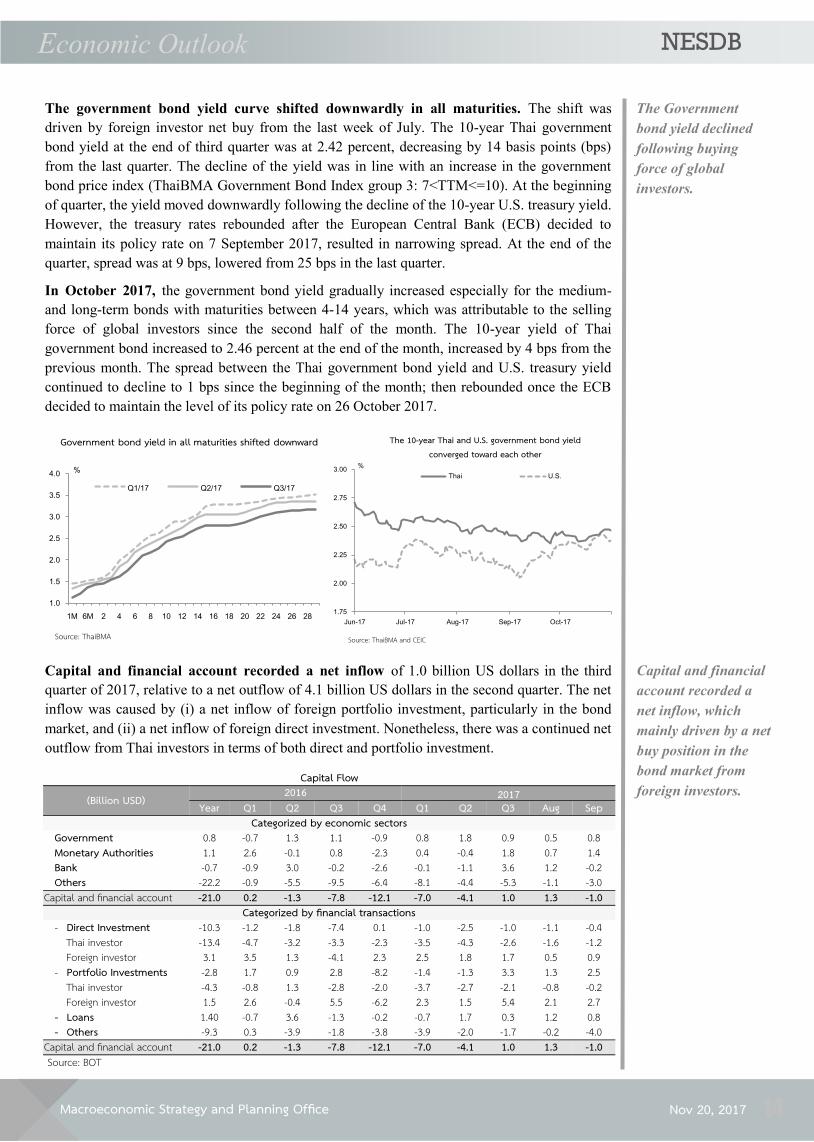
The government bond yield curve shifted downwardly in all maturities. The shift was
driven by foreign investor net buy from the last week of July. The 10-year Thai government
bond yield at the end of third quarter was at 2.42 percent, decreasing by 14 basis points (bps)
from the last quarter. The decline of the yield was in line with an increase in the government
bond price index (ThaiBMA Government Bond Index group 3: 7<TTM<=10). At the beginning
of quarter, the yield moved downwardly following the decline of the 10-year U.S. treasury yield.
However, the treasury rates rebounded after the European Central Bank (ECB) decided to
maintain its policy rate on 7 September 2017, resulted in narrowing spread. At the end of the
quarter, spread was at 9 bps, lowered from 25 bps in the last quarter.
In October 2017, the government bond yield gradually increased especially for the medium-
and long-term bonds with maturities between 4-14 years, which was attributable to the selling
force of global investors since the second half of the month. The 10-year yield of Thai
government bond increased to 2.46 percent at the end of the month, increased by 4 bps from the
previous month. The spread between the Thai government bond yield and U.S. treasury yield
continued to decline to 1 bps since the beginning of the month; then rebounded once the ECB
decided to maintain the level of its policy rate on 26 October 2017.
The Government
bond yield declined
following buying
force of global
investors.
Capital and financial
account recorded a
net inflow, which
mainly driven by a net
buy position in the
bond market from
foreign investors.
1.75
2.00
2.25
2.50
2.75
3.00
Jun-17 Jul-17 Aug-17 Sep-17 Oct-17
Thai U.S.
%
The 10-year Thai and U.S. government bond yield converged toward each other
Source: ThaiBMA and CEIC
Capital and financial account recorded a net inflow of 1.0 billion US dollars in the third
quarter of 2017, relative to a net outflow of 4.1 billion US dollars in the second quarter. The net
inflow was caused by (i) a net inflow of foreign portfolio investment, particularly in the bond
market, and (ii) a net inflow of foreign direct investment. Nonetheless, there was a continued net
outflow from Thai investors in terms of both direct and portfolio investment.
Capital Flow
(Billion USD) 2016 2017 Year Q1 Q2 Q3 Q4 Q1 Q2 Q3 Aug Sep
Categorized by economic sectors Government 0.8 -0.7 1.3 1.1 -0.9 0.8 1.8 0.9 0.5 0.8 Monetary Authorities 1.1 2.6 -0.1 0.8 -2.3 0.4 -0.4 1.8 0.7 1.4 Bank -0.7 -0.9 3.0 -0.2 -2.6 -0.1 -1.1 3.6 1.2 -0.2 Others -22.2 -0.9 -5.5 -9.5 -6.4 -8.1 -4.4 -5.3 -1.1 -3.0
Capital and financial account -21.0 0.2 -1.3 -7.8 -12.1 -7.0 -4.1 1.0 1.3 -1.0 Categorized by financial transactions
- Direct Investment -10.3 -1.2 -1.8 -7.4 0.1 -1.0 -2.5 -1.0 -1.1 -0.4 Thai investor -13.4 -4.7 -3.2 -3.3 -2.3 -3.5 -4.3 -2.6 -1.6 -1.2 Foreign investor 3.1 3.5 1.3 -4.1 2.3 2.5 1.8 1.7 0.5 0.9
- Portfolio Investments -2.8 1.7 0.9 2.8 -8.2 -1.4 -1.3 3.3 1.3 2.5 Thai investor -4.3 -0.8 1.3 -2.8 -2.0 -3.7 -2.7 -2.1 -0.8 -0.2 Foreign investor 1.5 2.6 -0.4 5.5 -6.2 2.3 1.5 5.4 2.1 2.7
- Loans 1.40 -0.7 3.6 -1.3 -0.2 -0.7 1.7 0.3 1.2 0.8 - Others -9.3 0.3 -3.9 -1.8 -3.8 -3.9 -2.0 -1.7 -0.2 -4.0
Capital and financial account -21.0 0.2 -1.3 -7.8 -12.1 -7.0 -4.1 1.0 1.3 -1.0 Source: BOT
1.0
1.5
2.0
2.5
3.0
3.5
4.0
1M 6M 2 4 6 8 10 12 14 16 18 20 22 24 26 28
%
Q1/17 Q2/17 Q3/17
Source: ThaiBMA
Government bond yield in all maturities shifted downward
Macroeconomic Strategy and Planning Office
NESDB Economic Outlook
Nov 20, 2017 15
Current account
registered a surplus.
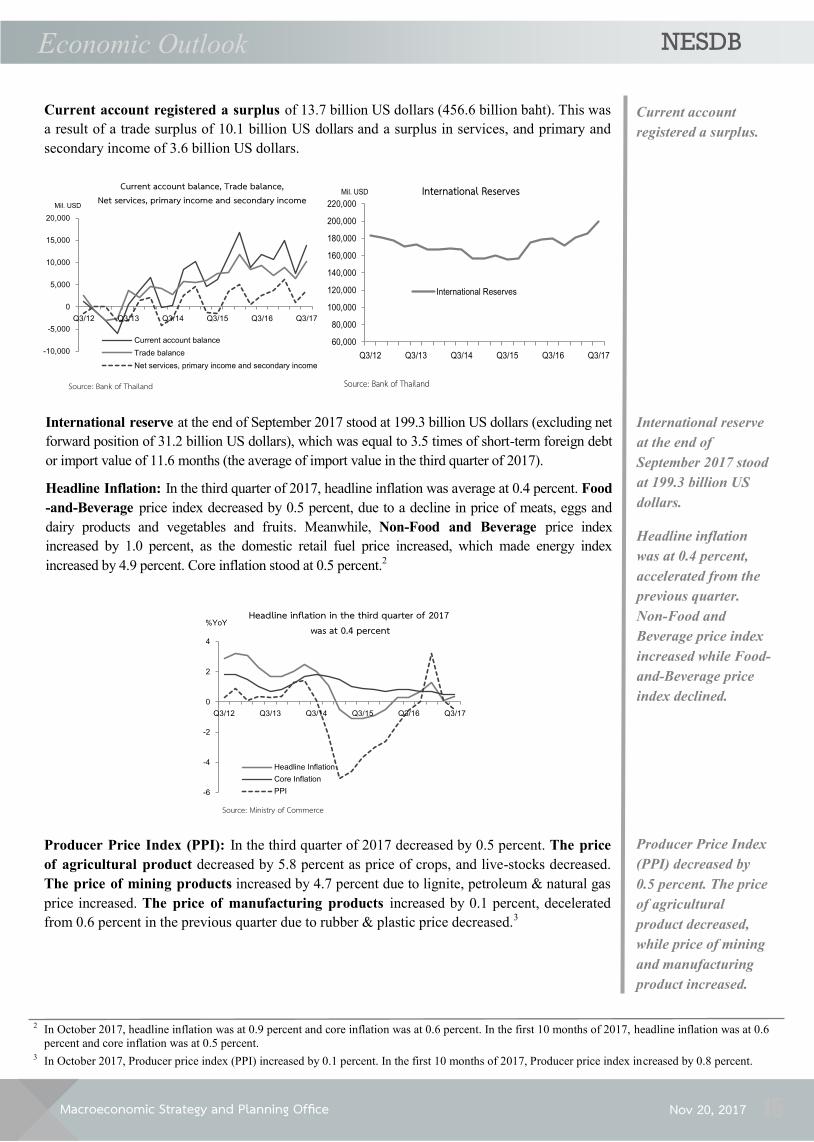
Current account registered a surplus of 13.7 billion US dollars (456.6 billion baht). This was
a result of a trade surplus of 10.1 billion US dollars and a surplus in services, and primary and
secondary income of 3.6 billion US dollars.
2 In October 2017, headline inflation was at 0.9 percent and core inflation was at 0.6 percent. In the first 10 months of 2017, headline inflation was at 0.6
percent and core inflation was at 0.5 percent. 3 In October 2017, Producer price index (PPI) increased by 0.1 percent. In the first 10 months of 2017, Producer price index increased by 0.8 percent.
International reserve
at the end of
September 2017 stood
at 199.3 billion US
dollars.
International reserve at the end of September 2017 stood at 199.3 billion US dollars (excluding net
forward position of 31.2 billion US dollars), which was equal to 3.5 times of short-term foreign debt
or import value of 11.6 months (the average of import value in the third quarter of 2017).
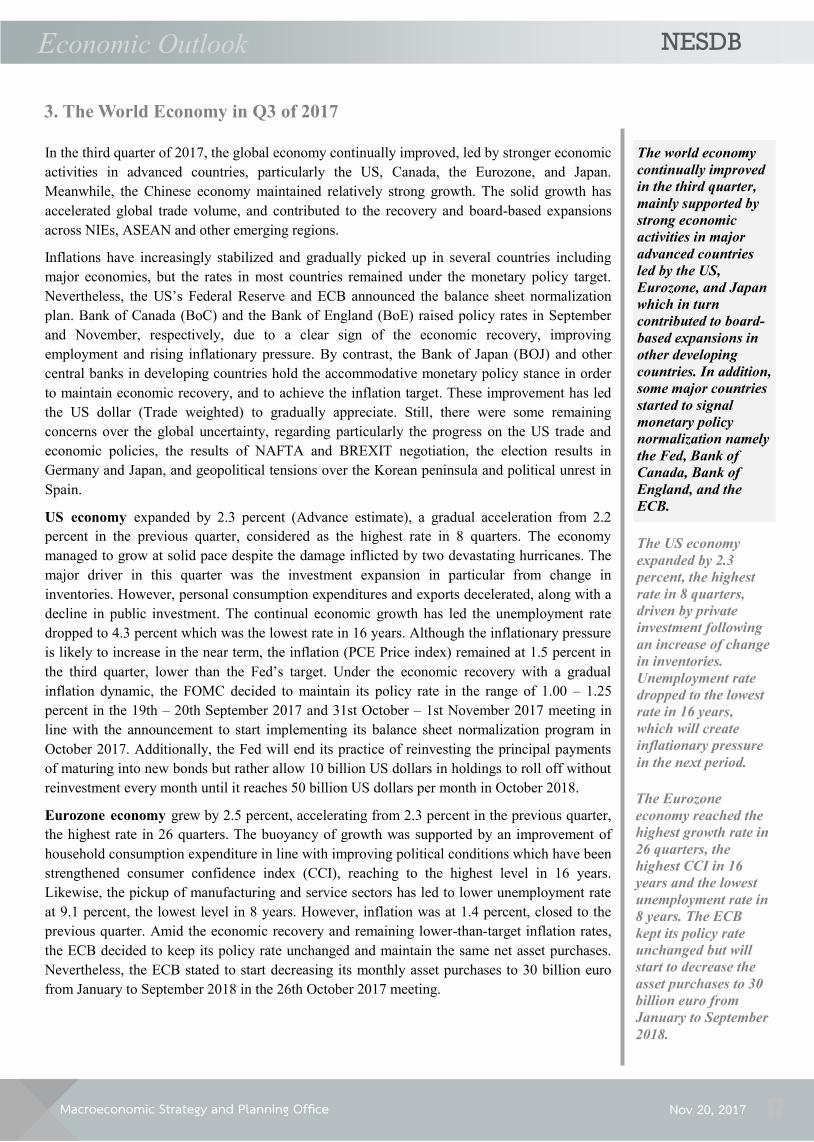
Headline Inflation: In the third quarter of 2017, headline inflation was average at 0.4 percent. Food
-and-Beverage price index decreased by 0.5 percent, due to a decline in price of meats, eggs and
dairy products and vegetables and fruits. Meanwhile, Non-Food and Beverage price index
increased by 1.0 percent, as the domestic retail fuel price increased, which made energy index
increased by 4.9 percent. Core inflation stood at 0.5 percent.2
Source: Bank of Thailand
-10,000
-5,000
0
5,000
10,000
15,000
20,000
Q3/12 Q3/13 Q3/14 Q3/15 Q3/16 Q3/17
Mil. USD
Current account balance, Trade balance,Net services, primary income and secondary income
Current account balance
Trade balance
Net services, primary income and secondary income
Source: Bank of Thailand
60,000
80,000
100,000
120,000
140,000
160,000
180,000
200,000
220,000
Q3/12 Q3/13 Q3/14 Q3/15 Q3/16 Q3/17
Mil. USD International Reserves
International Reserves
Headline inflation
was at 0.4 percent,
accelerated from the
previous quarter.
Non-Food and
Beverage price index
increased while Food-
and-Beverage price
index declined.
-6
-4
-2
0
2
4
Q3/12 Q3/13 Q3/14 Q3/15 Q3/16 Q3/17
%YoYHeadline inflation in the third quarter of 2017
was at 0.4 percent
Headline Inflation
Core Inflation
PPI
Source: Ministry of Commerce
Producer Price Index (PPI): In the third quarter of 2017 decreased by 0.5 percent. The price
of agricultural product decreased by 5.8 percent as price of crops, and live-stocks decreased.
The price of mining products increased by 4.7 percent due to lignite, petroleum & natural gas
price increased. The price of manufacturing products increased by 0.1 percent, decelerated
from 0.6 percent in the previous quarter due to rubber & plastic price decreased.3
Producer Price Index
(PPI) decreased by
0.5 percent. The price
of agricultural
product decreased,
while price of mining
and manufacturing
product increased.

Macroeconomic Strategy and Planning Office
NESDB Economic Outlook
Nov 20, 2017 16
2. Crude Oil price in Q3 of 2017
The crude oil price in the global market increased. In the third quarter of 2017, the average
crude oil price in the 4 major markets (Dubai, Oman, Brent, and WTI) stood at 50.33 USD per
barrel, increased from the same period last year by 12.6 percent, and from the previous quarter
by 1.4 percent.
The major factors contributed to the increase of global crude oil price included (i) the
improvement of global economy that raised demand for crude oil, especially in Europe and
China. Meanwhile, the US demand slightly decreased. (ii) The 9-month extension of oil
production cut of OPEC and Non-OPEC (until March of 2018). (iii) Hurricanes Harvey and
Irma, which disrupted US oil productions in late August and early September 2017.
The crude oil price
increased due to the
improvement of
global economy, and
OPEC and Non-
OPEC output cut.
Crude oil price
Year USD per Barrel (%YOY)
OMAN DUBAI BRENT WTI Average OMAN DUBAI BRENT WTI Average 2014 Year 96.82 96.48 99.49 92.71 96.38 -8.2 -8.5 -8.6 -5.6 -7.7 2015 Year 51.17 50.87 53.61 48.84 51.12 -47.1 -47.3 -46.1 -47.3 -47.0
2016
Q1 31.20 31.30 35.09 32.46 32.51 -40.9 -39.8 -36.2 -33.3 -37.6 Q2 43.30 43.03 46.96 45.61 44.73 -29.4 -29.6 -26.1 -21.3 -26.7 Q3 43.66 43.10 46.99 45.01 44.69 -12.5 -13.3 -8.4 -3.4 -9.5 Q4 48.68 48.19 51.12 49.32 49.33 19.6 18.7 14.6 17.0 17.4
Year 41.71 41.40 45.04 43.10 42.81 -18.5 -18.6 -16.0 -11.8 -16.3
2017
Q1 53.44 53.00 54.60 51.90 53.24 71.3 69.4 55.6 59.9 63.7 Q2 49.80 49.55 50.92 48.31 49.65 15.0 15.1 8.4 5.9 11.0 Q3 50.55 50.34 52.22 48.20 50.33 15.8 16.8 11.1 7.1 12.6 Jul. 47.56 47.55 49.28 46.83 47.80 10.1 12.1 6.0 4.1 8.0 Aug. 50.32 50.16 51.86 48.02 50.09 14.5 15.1 9.8 7.1 11.6 Sep. 53.76 53.32 55.51 49.75 53.09 22.6 23.2 17.5 10.1 18.3 9M 51.26 50.96 52.58 49.47 51.07 30.1 30.2 22.3 20.6 25.7 Oct. 55.50 55.46 57.68 51.62 55.07 13.1 13.6 12.3 3.5 10.6
Source: Thai Oil Plc and EPPO.
Macroeconomic Strategy and Planning Office
NESDB Economic Outlook
Nov 20, 2017 17
In the third quarter of 2017, the global economy continually improved, led by stronger economic
activities in advanced countries, particularly the US, Canada, the Eurozone, and Japan.
Meanwhile, the Chinese economy maintained relatively strong growth. The solid growth has
accelerated global trade volume, and contributed to the recovery and board-based expansions
across NIEs, ASEAN and other emerging regions.
Inflations have increasingly stabilized and gradually picked up in several countries including
major economies, but the rates in most countries remained under the monetary policy target.
Nevertheless, the US’s Federal Reserve and ECB announced the balance sheet normalization
plan. Bank of Canada (BoC) and the Bank of England (BoE) raised policy rates in September
and November, respectively, due to a clear sign of the economic recovery, improving
employment and rising inflationary pressure. By contrast, the Bank of Japan (BOJ) and other
central banks in developing countries hold the accommodative monetary policy stance in order
to maintain economic recovery, and to achieve the inflation target. These improvement has led
the US dollar (Trade weighted) to gradually appreciate. Still, there were some remaining
concerns over the global uncertainty, regarding particularly the progress on the US trade and
economic policies, the results of NAFTA and BREXIT negotiation, the election results in
Germany and Japan, and geopolitical tensions over the Korean peninsula and political unrest in
Spain.
US economy expanded by 2.3 percent (Advance estimate), a gradual acceleration from 2.2
percent in the previous quarter, considered as the highest rate in 8 quarters. The economy
managed to grow at solid pace despite the damage inflicted by two devastating hurricanes. The
major driver in this quarter was the investment expansion in particular from change in
inventories. However, personal consumption expenditures and exports decelerated, along with a
decline in public investment. The continual economic growth has led the unemployment rate
dropped to 4.3 percent which was the lowest rate in 16 years. Although the inflationary pressure
is likely to increase in the near term, the inflation (PCE Price index) remained at 1.5 percent in
the third quarter, lower than the Fed’s target. Under the economic recovery with a gradual
inflation dynamic, the FOMC decided to maintain its policy rate in the range of 1.00 – 1.25
percent in the 19th – 20th September 2017 and 31st October – 1st November 2017 meeting in
line with the announcement to start implementing its balance sheet normalization program in
October 2017. Additionally, the Fed will end its practice of reinvesting the principal payments
of maturing into new bonds but rather allow 10 billion US dollars in holdings to roll off without
reinvestment every month until it reaches 50 billion US dollars per month in October 2018.
Eurozone economy grew by 2.5 percent, accelerating from 2.3 percent in the previous quarter,
the highest rate in 26 quarters. The buoyancy of growth was supported by an improvement of
household consumption expenditure in line with improving political conditions which have been
strengthened consumer confidence index (CCI), reaching to the highest level in 16 years.
Likewise, the pickup of manufacturing and service sectors has led to lower unemployment rate
at 9.1 percent, the lowest level in 8 years. However, inflation was at 1.4 percent, closed to the
previous quarter. Amid the economic recovery and remaining lower-than-target inflation rates,
the ECB decided to keep its policy rate unchanged and maintain the same net asset purchases.
Nevertheless, the ECB stated to start decreasing its monthly asset purchases to 30 billion euro
from January to September 2018 in the 26th October 2017 meeting.
The US economy
expanded by 2.3
percent, the highest
rate in 8 quarters,
driven by private
investment following
an increase of change
in inventories.
Unemployment rate
dropped to the lowest
rate in 16 years,
which will create
inflationary pressure
in the next period.
The Eurozone
economy reached the
highest growth rate in
26 quarters, the
highest CCI in 16
years and the lowest
unemployment rate in
8 years. The ECB
kept its policy rate
unchanged but will
start to decrease the
asset purchases to 30
billion euro from
January to September
2018.
3. The World Economy in Q3 of 2017
The world economy
continually improved
in the third quarter,
mainly supported by
strong economic
activities in major
advanced countries
led by the US,
Eurozone, and Japan
which in turn
contributed to board-
based expansions in
other developing
countries. In addition,
some major countries
started to signal
monetary policy
normalization namely
the Fed, Bank of
Canada, Bank of
England, and the
ECB.
Macroeconomic Strategy and Planning Office
NESDB Economic Outlook
Nov 20, 2017 18
Japanese economy expanded by 1.7 percent, accelerated from 1.4 percent-growth in the
previous quarter. The pickup was mainly supported by better domestic demand, accommodative
fiscal stance, and the investment expansion prepared for the 2020 Tokyo Olympic Games.
Despite the slowdown of export due to the Yen appreciation, the favorable growth has brought
labor market reaching to the lowest unemployment rate in 23 years at 2.8 percent. While price
pressure has gradually improved to 0.6 percent of inflation, marked as highest rate within 10
quarters, the rate remained below the monetary policy target. Hence, the Bank of Japan (BOJ)
decided to keep the same level of key policy rate and asset buying at the monetary meeting on
October 31st, 2017.
Chinese economy expanded by 6.8 percent, relatively strong expansion compared to 6.9 percent
-growth in the first half of the year. Fixed asset investment and exports have decelerated in this
quarter. Nevertheless, manufacturing production and domestic consumption manifested by
favorably retail sales showed continual expansions and thus became key engines of the
economic growth. Meanwhile, the external economic stability has continued to improve in
which the foreign reserves increased for eight consecutive months, and resulting in the Yuan
appreciation by 2.8 percent compared with the previous quarter.
NIEs economies mostly accelerated from the previous quarter. This was mainly due to the more
robust export growths, along with the recovery in domestic demand which also brought about
stronger manufacturing production. In the meantime, the inflation rate of most countries have
increasingly stabilized and picked up gradually. The Singapore, Taiwan and South Korea
economies grew by 4.6 percent, 3.1 percent and 3.6 percent, accelerating from 2.9 percent, 2.1
percent and 2.7 percent in the previous quarter, respectively. There was only Hong Kong
economic growth experienced a slowdown with growth rate of 3.6 percent, lower than 3.9
percent in the previous quarter. Likewise, ASEAN economies also experienced economic
improvement due to the acceleration of export, household consumption and public investment.
The Vietnam, Indonesia, Malaysia and the Philippines economies expanded by 7.5 percent, 5.1
percent, 6.2 percent, and 6.9 percent as compared to 6.3, 5.0, 5.8 and 6.7 percent in the previous
quarter respectively.
In the fourth quarter of this year, major economies tend to exhibit favorable growths continuing
from a recovery momentum in the first three quarters as observed by better confidence, lower
unemployment, rising in asset prices and the world commodity prices. Under such supportive
environment together with high liquidity in major economies, it is expected that the world
economy will expand by 3.6 percent, improving from 3.2 percent in 2016 and upwardly revised
from 3.4 percent in the previous assumption.
The Chinese economy
expanded by 6.8
percent, slowing down
due to softened fixed
asset investment and
export while
manufacturing
production and retail
sales remained key
economic drivers.
Most of NIEs
economies
accelerated due to the
expansions of export
and the recovery in
domestic demand.
Likewise, ASEAN-4
economies also
experienced positive
improvement due to
stronger export,
household
consumption and
public investment.
The Japanese
economy continued to
expand, mainly
supported by stronger
domestic demand
both private and
public sectors while
export slowed down.
Inflation gradually
picked up though
remaining at low level
which thus made the
BOJ to keep its
monetary policy
unchanged.
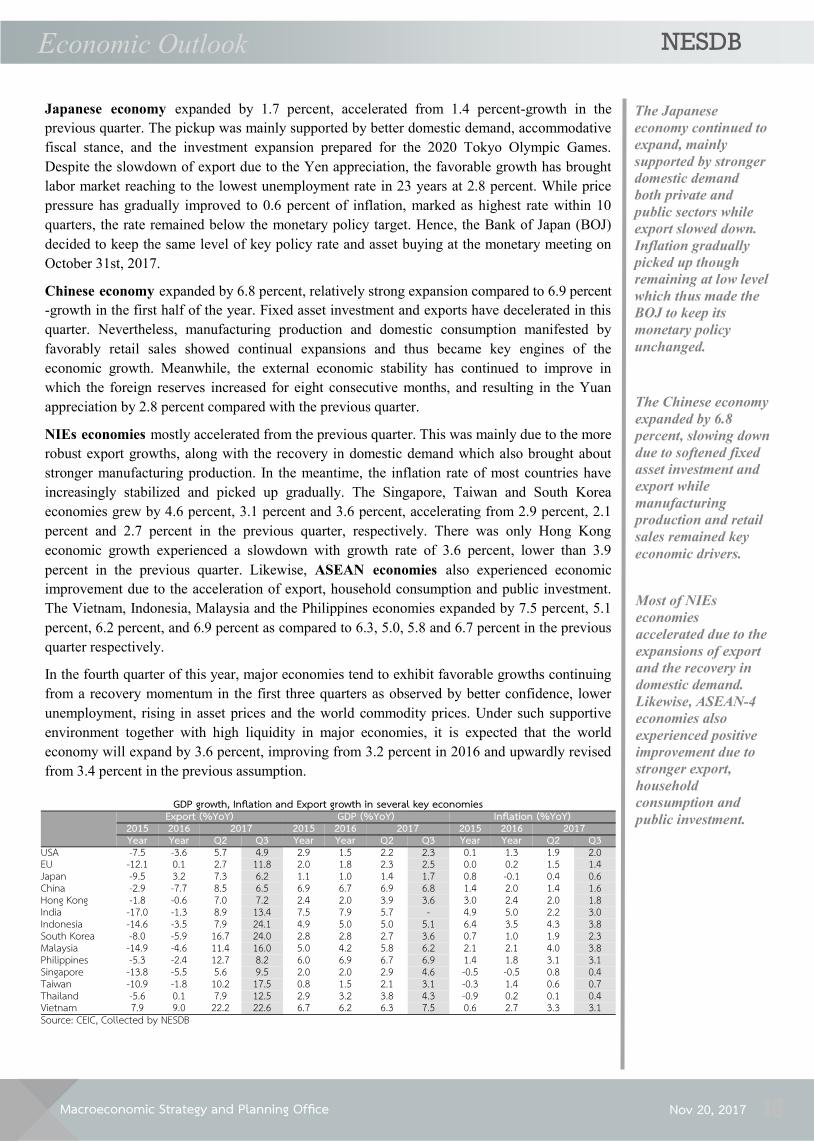
GDP growth, Inflation and Export growth in several key economies
Export (%YoY) GDP (%YoY) Inflation (%YoY)
2015 2016 2017 2015 2016 2017 2015 2016 2017 Year Year Q2 Q3 Year Year Q2 Q3 Year Year Q2 Q3
USA -7.5 -3.6 5.7 4.9 2.9 1.5 2.2 2.3 0.1 1.3 1.9 2.0 EU -12.1 0.1 2.7 11.8 2.0 1.8 2.3 2.5 0.0 0.2 1.5 1.4 Japan -9.5 3.2 7.3 6.2 1.1 1.0 1.4 1.7 0.8 -0.1 0.4 0.6 China -2.9 -7.7 8.5 6.5 6.9 6.7 6.9 6.8 1.4 2.0 1.4 1.6 Hong Kong -1.8 -0.6 7.0 7.2 2.4 2.0 3.9 3.6 3.0 2.4 2.0 1.8 India -17.0 -1.3 8.9 13.4 7.5 7.9 5.7 - 4.9 5.0 2.2 3.0 Indonesia -14.6 -3.5 7.9 24.1 4.9 5.0 5.0 5.1 6.4 3.5 4.3 3.8 South Korea -8.0 -5.9 16.7 24.0 2.8 2.8 2.7 3.6 0.7 1.0 1.9 2.3 Malaysia -14.9 -4.6 11.4 16.0 5.0 4.2 5.8 6.2 2.1 2.1 4.0 3.8 Philippines -5.3 -2.4 12.7 8.2 6.0 6.9 6.7 6.9 1.4 1.8 3.1 3.1 Singapore -13.8 -5.5 5.6 9.5 2.0 2.0 2.9 4.6 -0.5 -0.5 0.8 0.4 Taiwan -10.9 -1.8 10.2 17.5 0.8 1.5 2.1 3.1 -0.3 1.4 0.6 0.7 Thailand -5.6 0.1 7.9 12.5 2.9 3.2 3.8 4.3 -0.9 0.2 0.1 0.4 Vietnam 7.9 9.0 22.2 22.6 6.7 6.2 6.3 7.5 0.6 2.7 3.3 3.1 Source: CEIC, Collected by NESDB
Macroeconomic Strategy and Planning Office
NESDB Economic Outlook
Nov 20, 2017 19
The world economy in 2018 tends to stay on the upward trend due to notable acceleration of the US
economy and broad-based economic recovery in developing economies, supported by improving
commodity prices and fiscal balance; in particular India, Russia, Brazil and the Middle East
countries that tend to show accelerating growths. In addition, the Eurozone, Japanese and Chinese
economies will continue their expansions, despite an anticipated moderate slowdown.
The continual growths of major advanced economies and synchronized recovery of the global
economy will put higher pressures on primary commodity prices and inflation dynamic in major
economies to increase gradually. Consequently, major economies will be likely to normalize their
monetary policy stances including the US Fed that tends to continue raising policy rates along with
gradually reducing its securities holdings and also the ECB that will start to implement its monthly
asset purchases reduction plan. Meanwhile for other developing economies, the central banks are
anticipated to adjust monetary policy direction during the latter half of the year, following increasing
inflationary pressure and US interest rate. Nonetheless, the Bank of Japan appeared to remain the
policy rate and keep the same level of asset buying as in the previous year.
Under the baseline scenario, the world economy and global trade volume are projected to grow by
3.6 percent and 4.0 percent, respectively. The US economy is projected to grow by 2.3 percent,
gradually accelerating from 2.2 percent in 2017. The economic growth will be underpinned mainly
by household spending supported by improving employment conditions, an increase in wages, and
higher asset prices. Expansion of corporate profits and private investment will also become another
key growth driver. Meanwhile, the inflationary pressure is likely to increase following the decline of
the unemployment rate which marked as the lowest rate since 2000. As a result, the FOMC is likely
to continually hike its policy rate in December 2017, June and December 2018, together with its
balance sheet normalization program. The Eurozone economy is estimated to expand by 2.0
percent, gradually slowing down from 2.3 percent in 2017. The slowdown is due to the normalizing
monetary policy and the uncertainty from the Brexit negotiation. However, the growth will be
supported by the improvement of employment condition, easing liquidity condition, and improving
economic confidence, which will support economic expansion. As inflation tends to pick up on a
gradual pace, ECB thus tends to keep its policy rate unchanged for at least in the first three quarters,
and simultaneously maintain the QE tapering. The Japanese economy is anticipated to grow at the
rate of 1.2 percent in 2018, compared to 1.5 percent in 2017. The growth will continue to be driven
by easing liquidity condition under improving political sentiment as well as investment in
preparation for the 2020 Tokyo Olympic Games. Nonetheless, the conflict around Korean peninsula
could lead to the appreciation of Yen, and thus continue to hinder exports. Meanwhile, the inflation
will remain low and rise only gradually. Therefore, the BOJ is likely to hold the key policy rate and
continually maintain asset purchases. The Chinese economy is estimated to expand by 6.6 percent,
decelerating from 6.8 percent in 2017. This is owing to the deceleration of fixed asset investment,
caused by the economic restructuring policy and resolving financial instability. Nevertheless, the
supporting factors from fiscal stimulus packages on infrastructure investment and the improvement
of manufacturing production and exports following the recovery of global economy will continue to
support economic growth. The NIEs is anticipated to expand at a favorable pace. The Hong Kong,
Taiwan and Singapore economies are estimated to grow by 2.8, 2.1, and 2.7 percent, compared to
3.7, 2.5, and 2.9 percent in 2017, respectively. Meanwhile, The South Korea economy is likely to
grow by 3.0 percent, same rate in the previous year. Similarly, the ASEAN economies are expected
to grow continuously owing to strong export sector and improving domestic demand, particularly
public expenditure and investment which will lead to an improvement in manufacturing production.
It is projected that the Malaysia, Indonesia, Philippines and Vietnam will grow by 5.5, 5.6, 6.9, and
6.4 percent in 2018, compared to growths of 5.9, 5.2, 6.7 and 6.2 percent in 2017, respectively. For
other developing economies, the growth outlook has started to accelerate and is expected to be one
4. The World Economic Outlook for 2018
Macroeconomic Strategy and Planning Office
NESDB Economic Outlook
Nov 20, 2017 20
among the key engines for global economic growth, in particular India, Brazil and Middle East
economies which are forecasted to expand by 7.2, 1.5, and 3.5 in 2018, compared with the growth of
6.7, 0.7 and 2.6 in 2017 respectively.
Nevertheless, over the remainder of 2017 and 2018 there remain some limitations and risk factors
that could pose some challenges to the global economy and monetary policy directions in major
economies to diverge from the baseline scenario, and lead to fluctuations of the key currencies and
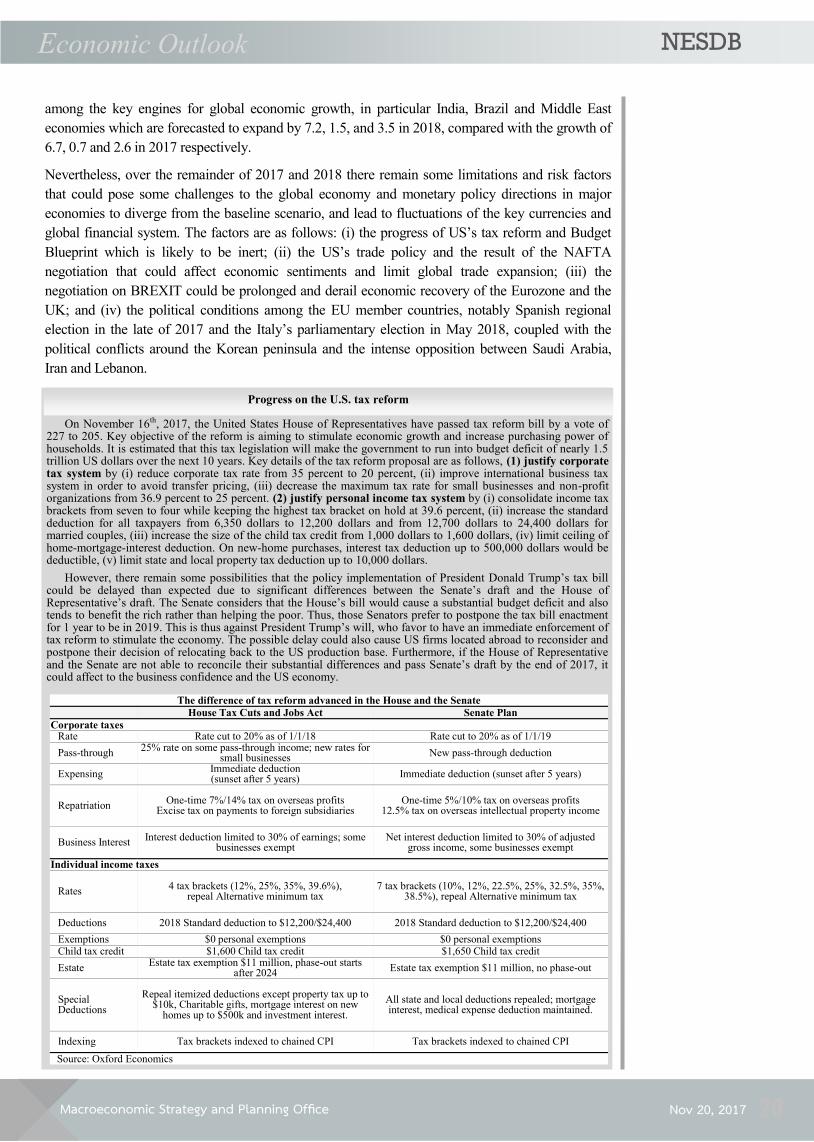
global financial system. The factors are as follows: (i) the progress of US’s tax reform and Budget
Blueprint which is likely to be inert; (ii) the US’s trade policy and the result of the NAFTA
negotiation that could affect economic sentiments and limit global trade expansion; (iii) the
negotiation on BREXIT could be prolonged and derail economic recovery of the Eurozone and the
UK; and (iv) the political conditions among the EU member countries, notably Spanish regional
election in the late of 2017 and the Italy’s parliamentary election in May 2018, coupled with the
political conflicts around the Korean peninsula and the intense opposition between Saudi Arabia,
Iran and Lebanon.
On November 16th, 2017, the United States House of Representatives have passed tax reform bill by a vote of 227 to 205. Key objective of the reform is aiming to stimulate economic growth and increase purchasing power of households. It is estimated that this tax legislation will make the government to run into budget deficit of nearly 1.5 trillion US dollars over the next 10 years. Key details of the tax reform proposal are as follows, (1) justify corporate tax system by (i) reduce corporate tax rate from 35 percent to 20 percent, (ii) improve international business tax system in order to avoid transfer pricing, (iii) decrease the maximum tax rate for small businesses and non-profit organizations from 36.9 percent to 25 percent. (2) justify personal income tax system by (i) consolidate income tax brackets from seven to four while keeping the highest tax bracket on hold at 39.6 percent, (ii) increase the standard deduction for all taxpayers from 6,350 dollars to 12,200 dollars and from 12,700 dollars to 24,400 dollars for married couples, (iii) increase the size of the child tax credit from 1,000 dollars to 1,600 dollars, (iv) limit ceiling of home-mortgage-interest deduction. On new-home purchases, interest tax deduction up to 500,000 dollars would be deductible, (v) limit state and local property tax deduction up to 10,000 dollars.
However, there remain some possibilities that the policy implementation of President Donald Trump’s tax bill could be delayed than expected due to significant differences between the Senate’s draft and the House of Representative’s draft. The Senate considers that the House’s bill would cause a substantial budget deficit and also tends to benefit the rich rather than helping the poor. Thus, those Senators prefer to postpone the tax bill enactment for 1 year to be in 2019. This is thus against President Trump’s will, who favor to have an immediate enforcement of tax reform to stimulate the economy. The possible delay could also cause US firms located abroad to reconsider and postpone their decision of relocating back to the US production base. Furthermore, if the House of Representative and the Senate are not able to reconcile their substantial differences and pass Senate’s draft by the end of 2017, it could affect to the business confidence and the US economy.
Progress on the U.S. tax reform
The difference of tax reform advanced in the House and the Senate House Tax Cuts and Jobs Act Senate Plan
Corporate taxes Rate Rate cut to 20% as of 1/1/18 Rate cut to 20% as of 1/1/19
Pass-through 25% rate on some pass-through income; new rates for
small businesses New pass-through deduction
Expensing Immediate deduction (sunset after 5 years)
Immediate deduction (sunset after 5 years)
Repatriation One-time 7%/14% tax on overseas profits
Excise tax on payments to foreign subsidiaries One-time 5%/10% tax on overseas profits
12.5% tax on overseas intellectual property income
Business Interest Interest deduction limited to 30% of earnings; some
businesses exempt Net interest deduction limited to 30% of adjusted
gross income, some businesses exempt
Individual income taxes
Rates 4 tax brackets (12%, 25%, 35%, 39.6%),
repeal Alternative minimum tax 7 tax brackets (10%, 12%, 22.5%, 25%, 32.5%, 35%,
38.5%), repeal Alternative minimum tax
Deductions 2018 Standard deduction to $12,200/$24,400 2018 Standard deduction to $12,200/$24,400
Exemptions $0 personal exemptions $0 personal exemptions Child tax credit $1,600 Child tax credit $1,650 Child tax credit
Estate Estate tax exemption $11 million, phase-out starts
after 2024 Estate tax exemption $11 million, no phase-out
Special Deductions
Repeal itemized deductions except property tax up to $10k, Charitable gifts, mortgage interest on new
homes up to $500k and investment interest.
All state and local deductions repealed; mortgage interest, medical expense deduction maintained.
Indexing Tax brackets indexed to chained CPI Tax brackets indexed to chained CPI
Source: Oxford Economics

Macroeconomic Strategy and Planning Office
NESDB Economic Outlook
Nov 20, 2017 21
The Thai economy in 2017 is projected to grow by 3.9 percent, improving continually from 2.9
percent and 3.2 percent of growth in 2015 and 2016, respectively. Average headline inflation is
projected to be 0.7 percent, increasing from an average of 0.2 percent in 2016. Current account
balance is forecasted to register a surplus of 10.4 percent to GDP, comparing with a surplus of
11.9 percent to GDP in 2016.
In the press release dated on 20th November 2017, NESDB forecasted that Thai economy will
expand by 3.9 percent, increasing from a 3.7-percent midpoint in the projection range of 3.5 –
4.0 percent in a press release dated on 21st August 2017. The upward revision is based on the
fact that growth contribution from export sector are higher than previously forecasted thus
makes the 2017’s growth projection to be higher than the 3.7-percent midpoint and move closer
to the 4.0 percent upper bound in the prior projection. The public investment, however, tends to
contribute less than previously estimated. The justifications for the projection revision are as
follows:
1) Public investment is expected to grow by 1.8 percent, revised downward from the growth
of 8.0 percent in the previous projection. This was owing to the actual value of public
investment in the third quarter of 2017, which declined from (i) decreasing capital budget
disbursement due to the end period of short-term stimulus packages such as the Water
Resource and Road Network Management Project (urgent phase) and measures to boost
Small-Scale Public Investment Projects Nationwide. (ii) slow growth of capital budget
disbursement under FY2017 annual budget, which partly caused by redundant rainfalls and
flood impact. As a result, the disbursement rate in the third quarter of 2017 was slightly
lower than the same period of last year. (iii) less disbursement of state-owned enterprises’
capital expenditure budget which was the result of the disbursement expedition prior to this
quarter. This is confirmed by the growth of state-owned enterprises’ investment in the first
six months and first nine months of 2017, which were recorded at 21.3 and 12.1 percent,
respectively. (iv) the mega investment projects which were partly in the initial phase and
some expenditures were not included in gross fixed capital formation (GFCF) under System
of National Account (SNA)4. Thus, as public expenditure of the third quarter of 2017
declined, together with possible delay of fiscal disbursement in the first quarter of FY2018,
growth driver from public expenditure is prone to be less than the previous estimation.
2) Export value is projected to expand by 8.6 percent, revised upward from 5.7 percent
growth in the previous estimation. The revision was a result of a 12.5-percent growth of
export value in the third quarter of 2017 (the highest rate in 19 quarters), which was higher
than the previous projection in both export price and quantity. This was in line with the
upward revision of the world economic growth of 3.6 percent, from 3.4 percent in previous
projection. Regarding the higher-than-expected growth of export price and quantity,
together with the robust trend of export growth in the fourth quarter, the export value of
2017 is expected to grow by 8.6 percent, higher than the previous forecast. The upward
revision of export value would offset the downward revision of public investment, and thus
resulted in higher economic growth and current account compared to the previous projection
in the press release dated on 21st August 2017.
5. Thai Economic Outlook for 2017
4 The definition of gross fixed capital formation in System of National Account is different from the definition of capital expenditure under Budget System.
Macroeconomic Strategy and Planning Office
NESDB Economic Outlook
Nov 20, 2017 22
The Thai economy in 2018 tends to grow well with a gradual acceleration, mainly supported by
stronger global economic recovery and continual expansion in exports which, in turn, will
further stimulate the manufacturing sector to clearly recover and further support overall
economic growth. Likewise, total investment is likely to expand at the faster pace contributed by
continual improvement of private investment which will be supported by a reduction in excess
capacity in several key industries, better economic confidence, as well as accelerating public
investment in line with significant progress of key infrastructure investment projects and an
increase of capital budget framework. Meanwhile, other major production sectors are likely to
continue their favorable growth pace from the previous year. Nevertheless, the contribution
from agricultural sector tends to be softened as the growth returns to its normal level, implying
that an economic growth would thus requires more contributions from non-agricultural sector.
Besides, the global economy and financial system might be exposed to volatility risk, which
thus requires close monitoring and assessment.
6. Thai Economic Outlook for 2018
Supporting factors for the economic growth:
1) The favorable global economic recovery will sustain the robust growth of export and
subsequently support the recovery of manufacturing sector which will thus be able to
contribute more to the economic growth. Although the world economic expansion has
turned export to an upward trend since early of 2017, the manufacturing sector, accounted
for 28 percent of GDP, recovered sluggishly in the first half of the year as the recovery was
less broad-based while some producers export the inventories instead of expanding their
production. The continual strong and broader growth of export in the third quarter resulted
in running down of inventories, and markedly started accelerating manufacturing
production. In 2018, the world economy is likely to stay on the upward trend which will
support a continual robust in export of goods, tourism and other related-services, as well as
accelerate manufacture productions and thus achieve higher economic growth.
2) Public investment expansion tends to accelerate following a further progress of key
infrastructure projects and the larger 2018 annual capital budget framework. The
infrastructure projects under the Transportation Action Plans have made a continual
progress. However, the public investment in the third quarter manifested a decrease and
lower than previously estimated. The key reasons are as follows: (i) decrease in capital
budget disbursement after the completion of short-term stimulus packages such as the water
resource and road network management project (urgent phase), measures to boost small-
scale public investment projects nationwide, and living standard promotion measure at
district level project; (ii) a slow growth of capital budget disbursement under FY2017
annual budget, which partly caused by redundant rainfalls and flooding impact. As a result,
the disbursement rate in the third quarter of 2017 was slightly lower than the same period of
last year; (iii) the mega investment projects which were partly in the initial phase and some
expenditures were not included in gross fixed capital formation (GFCF) under System of
National Account (SNA); and (iv) the possibility of a delay in fiscal disbursement in the
first quarter of FY2018. Nonetheless, the public investment in 2018 tends to accelerate and
significantly contribute to economic growth, mainly supported by (i) increasing capital
budget framework under annual budget and state-owned enterprise’s budget by 21.8 and
45.7 percent, respectively; (ii) the progress of key public investment project under the 2016-
2017 Transportation Action Plan. The recent data as of 31st October of 2017 showed that
there are 10 projects already under construction, worth 341,104 million baht (8 projects
under 2016 Action Plan and 2 projects under 2017 Action Plan). Meanwhile, it is expected
Macroeconomic Strategy and Planning Office
NESDB Economic Outlook
Nov 20, 2017 23
that for the remainder of 2017 and throughout the year 2018, there will be more projects to
undertake the constructions, and (iii) the growth base of government disbursement growth
tends to become normalized after the completion of the short-term stimulus packages such
as the Stimulus Package through Water Management and Road System Improvement,
Measure to Stimulate Small Investment and Measure to Promote Living Conditions at Sub-
district Level.
3) More pronounced recovery of private investment. Though private investment in 2017
became more stabilized and slowly recovered in the second quarter of 2017, the expansion
was low under the constraints of high excess capacity in manufacturing sector in the first
half of the year. It is expected that private investment in 2018 will accelerate with these
following supporting factors; (i) an increase in capacity utilization rate in the manufacturing
sector, which recently increased to 62.0 percent, from 59.1 percent in the previous quarter
and 58.5 percent in the same period last year. Evidently, several key industries reached
capacity utilization rate of 65-70 percent, namely electronic tubes and electronic
components. Some industries even remained over 80 percent of capacity utilization rate,
such as components and accessories for motor vehicles and engines, refined petroleum
production, meat production and meat processing, and automotive production. The
improving capacity utilization, coupled with the continual recovery of the global economy
and robust exports would encourage private businesses to start expanding their investment
in order to expand production capacity (ii) more progress in public investment projects,
which then would both directly and indirectly stimulate private investment. (iii) the
improvement in the confidence in economic performance with supporting factors from
better political conditions in the country, the recovery of exports and overall economy,
several measures and policies implemented by the government to drive domestic economy
and enhance further economic growth potential.
4) Major economic sectors as key growth engines in 2017 are likely to favorably expand
further including (i) the tourism sector, which gain from the global economic recovery, not
only from major advanced economies but also from other major Asian economies, which
would in turn support further expansion of long distance and other regional tourists,
including also those from Russia, India and Middle East economies which clearly tend to
experience with stronger growth, (ii) the export sector, which the export volume is expected
to continue to grow well aligning with a recovery in global demand although export value
would likely slowdown from the previous year due to a slower growth in oil price compared
with last year. (iii) The transport and communication sector which is expected to grow
favorably, following the expansion of tourism activities, agricultural and industrial
production, including exports and imports. Besides, the success of Thai government in
resolving the Significant Safety Concerns (SSC) of the International Civil Aviation
Organization (ICAO) would also be another supporting factor since it allows Thai airlines
to launch new international routes, starting from the second quarter of 2018, and (iv)
household expenditure, which will be supported by higher income base due to the continual
and more broad-based economic growth as well as supportive government measures that
focus on farmers and low-income groups.

Macroeconomic Strategy and Planning Office
NESDB Economic Outlook
Nov 20, 2017 24
5) The improvement in employment and household income base, supported by (i) the
expected expansion in production and employment in the agricultural sector, as a result of
higher levels of water in the major dams above the average level over the past 30 years, (ii)
the recovery of industrial production, especially some industries that will move towards
higher investment in order to expand production capacity, and thus be able to absorb more
labor force, and (iii) the continual expansion of key service sectors.
Public infrastructure investment projects have been progressing. They were consisted of projects under the 2016
Transport Action Plan, and those under the 2017 Transport Action Plan.
On October 31, 2017, there were a total of 10 projects already under constructions, with a total budget of 341,104
million baht; 8 projects are under the 2016 Transport Action Plan with 331,053 million baht total budget, and 2
projects are under the 2017 Transport Action Plan with 10,051 million baht total budget. In addition, before the end
of the year 2017, 2 projects under the 2016 plan will proceed to the construction phase which are (1) Mass Rapid
Transit Pink Line: Khae Rai – Minburi, which is worth 56,691 million baht and (2) Mass Rapid Transit Yellow Line:
Lat Phrao – Samrong, which is worth 54,644 million baht. Both are under the stage of land ownership management
and initial construction preparation. Therefore, it is expected that there will be a total of 12 projects under the
construction phase within 2017, with a total budget of 452,439 million baht.
As for 2018, it is expected that there will be more projects proceeding to the phase of construction, especially
projects in the bidding process; 6 projects under the 2016 plan and 2 projects under the 2017 plan, with total budget
of 222,578 and 10,790 million baht, respectively.
Source: Ministry of Transport, evaluated by NESDB
Progress of Major Public Investment Projects
1. Intermodal Facility – Chiang Khong(2,365.81 million baht budget)
2. Regional airport development (7,685.50 million baht budget)
Progress of 36 public investment projects under Transport Action Plan Year 2017,895,757.55 million baht budget (13 Dec 2016 cabinet decisions) Last Updated: 31 Oct 2017
1. Ferry Service across Gulf of Thailand 2. Common Ticket System
(1,355.34 million baht budget)
1. Double Track Rail Network: Huahin – Prachuap KhiriKhan (10,239.58 million baht budget)
2. Truck Rest Area on the main routes(550.00 million baht budget)
1. Baggage System Upgrade at BKK Airport(3,264.61 million baht budget)
2. Express Way Rama 3 – Dao Kanong – Outer Ring (West) (31,244.00 million baht budget)
1.-9. Dual Track Rail: Stage 2 Paknampho – Den Chai/ Jira –Ubonratchathani/ Khonkaen – Nong Khai/ Chumporn –Surat Thani/ Surat Thani – Songkha/ DenChai – Chiang Mai/ Den Chai – Chiang Rai – Chiang Khong/ Ban Pai –Nakorn Phanom/ Hat Yai – Padang Beza:(398,377.25 million baht budget)
10. Mass Rapid Transit Light Red Extension: Taling Chan –Siriraj and Taling Chan – Saraya(19,042.13 million baht budget)
11. Commuter Train : Dark Red : Rangsit – TU Rangsit(7,596.94 million baht budget)
12. Northern Route N2 and E-W Corridor (14,382 million baht budget)
13. Public Bus Procurement and Stations(2,272.22 million baht budget)
1. Intercity Motorway (Nakorn Phatom – Cha Am) (80,600.00 million baht budget)
2. Motorway Hat Yat – Thailand – Malaysia Border (30,500.00 million baht budget)
3. Exp. Kratu – Patong (10,496.65 million baht budget)4. Cross-border Logistics Center at Nakorn Phanom
(1,053.62 million baht budget.)5-6 Regional Logistics Center in regional cities and Border
provinces: (17,503.86 million baht budget)7. Mass Rapid Transit: Blue Line Bang kae – Sai 4
(21,197 million baht budget.)8. Orange Line West Side: (120,459 million baht budget)9. Aircraft Maintenance, Repair, and Overhaul Facility
Development at U-Tapao Airport 10. Lam Cha Bang Phase 3 (35,099.54 million baht budget)
1.-2 Mass Rapid Transit: Dark Green Samutprakarn– Bang Pu and Dark Green Kukot – Lumluka(21,949 million baht budget)
3. Airport Rail Link Extension(31,159.35 million baht budget)
4. Mass Transit in Phuket(23,499.00 million baht budget)
5. Development of Ferry Terminal(990 million baht budget)
In Service1,355.34 MB
Constructing Stage 10,051.31 MB.
Procurement10,789.58 MB.
Pre-Procurement34,507.61 MB..
Cabinet Approval Process
441,670.54 MB.
Project Proposal Development319,804.67 MB.
Feasibility Study and Overall Preparation
77,597.35 MB.
1. Mass Rapid Transit Light Red Line and Dark Red Line (44,157 million baht budget)
1. Meter gauge (1 meter) Rail development Prachuab –Chumporn (17,249 million baht budget)
2. Meter gauge (1 meter) Rail development Mab Kabao –Jira (29,449 million baht budget)
3. Meter gauge (1 meter) Rail development Nakhon Pathom– Huahin (20,036 million baht budget)
4. Meter gauge (1 meter) Rail development Lopburi – Pak Nam Pho (24,840 million baht budget)
5. Bangkok – Nakhon Ratchasima (Thai – China Cooperation)6. Mass Rapid Transit Purple Line: Tao Pun – Rat Burana
(131,004 million baht budget)
Construction Process (As of 31 Oct 2017X1. Dual-track rail: Jira – Khon Kaen
(23,802 million baht budget)2. Coastal port (Port A) at Laem Chabang Port
(1,819 million baht budget)3. Container Depot at Laem Chabang : Stage I
(2,031 million baht budget)4. Intercity Motorway: Pattaya – Map Ta Phut
(17,819 million baht budget)5. Intercity Motorway: Bang Pa In – Saraburi –
Nakhon Ratchasima (76,600 million baht budget)6. Intercity Motorway: Bang Yai – Kanchanaburi
(49,120 million baht budget)7. Mass Rapid Transit Orange Line: Thailand
Cultural Centre – Minburi (109,540 million baht budget)
8. Suvarnabhumi Airport: Stage II(50,322 million baht budget)
Expected to be constructed within 2018 1. Mass Rapid Transit (Pink Line: Khae Rai – Minburi)
(56,691 million baht budget)2. Mass Rapid Transit Yellow Line: Lat Phrao –
Samrong (54,644 million baht budget
Progress of 20 public investment projects under Transport Action Plan Year 2016,1,383,938.89 million baht budget (Initially 1,796,385.78 million baht, 1 Dec 2015 cabinet decisions)
On process of Committee on Public and Private Partnership’s considerationStandard Gauge (1.435 meter) Rail Development1. Bangkok – Hua Hin (94,673 million baht budget)2. Bangkok – Rayong (152,528 million baht budget )
On process of feasibility studies1. Bangkok – Phitsanulok (Thai – Japan Cooperation)
Last Updated: 31 Oct 2017
Under construction/Prep
aring for construction442,388 MB.
• Under construction331,053 MB.
• Preparing for construction111,355 MB.
BiddingProcess
222,578 MB.
Cabinet Approval Process
44 157 MB.
PPP Committee’s consideration
process /Feasibility
studyprocess
247 201 MB.
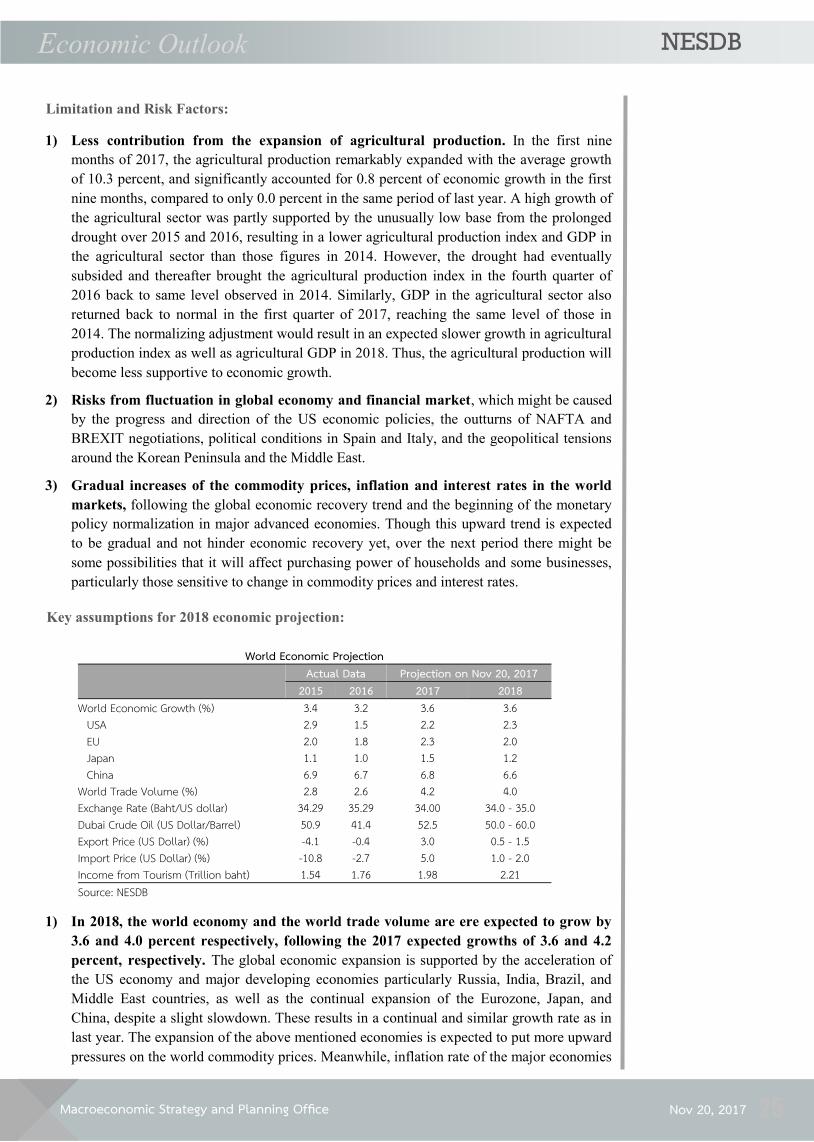
Macroeconomic Strategy and Planning Office
NESDB Economic Outlook
Nov 20, 2017 25
1) Less contribution from the expansion of agricultural production. In the first nine
months of 2017, the agricultural production remarkably expanded with the average growth
of 10.3 percent, and significantly accounted for 0.8 percent of economic growth in the first
nine months, compared to only 0.0 percent in the same period of last year. A high growth of
the agricultural sector was partly supported by the unusually low base from the prolonged
drought over 2015 and 2016, resulting in a lower agricultural production index and GDP in
the agricultural sector than those figures in 2014. However, the drought had eventually
subsided and thereafter brought the agricultural production index in the fourth quarter of
2016 back to same level observed in 2014. Similarly, GDP in the agricultural sector also
returned back to normal in the first quarter of 2017, reaching the same level of those in
2014. The normalizing adjustment would result in an expected slower growth in agricultural
production index as well as agricultural GDP in 2018. Thus, the agricultural production will
become less supportive to economic growth.
2) Risks from fluctuation in global economy and financial market, which might be caused
by the progress and direction of the US economic policies, the outturns of NAFTA and
BREXIT negotiations, political conditions in Spain and Italy, and the geopolitical tensions
around the Korean Peninsula and the Middle East.
3) Gradual increases of the commodity prices, inflation and interest rates in the world
markets, following the global economic recovery trend and the beginning of the monetary
policy normalization in major advanced economies. Though this upward trend is expected
to be gradual and not hinder economic recovery yet, over the next period there might be
some possibilities that it will affect purchasing power of households and some businesses,
particularly those sensitive to change in commodity prices and interest rates.
Key assumptions for 2018 economic projection:
Limitation and Risk Factors:
1) In 2018, the world economy and the world trade volume are ere expected to grow by
3.6 and 4.0 percent respectively, following the 2017 expected growths of 3.6 and 4.2
percent, respectively. The global economic expansion is supported by the acceleration of
the US economy and major developing economies particularly Russia, India, Brazil, and
Middle East countries, as well as the continual expansion of the Eurozone, Japan, and
China, despite a slight slowdown. These results in a continual and similar growth rate as in
last year. The expansion of the above mentioned economies is expected to put more upward
pressures on the world commodity prices. Meanwhile, inflation rate of the major economies
World Economic Projection
Actual Data Projection on Nov 20, 2017 2015 2016 2017 2018
World Economic Growth (%) 3.4 3.2 3.6 3.6 USA 2.9 1.5 2.2 2.3 EU 2.0 1.8 2.3 2.0 Japan 1.1 1.0 1.5 1.2 China 6.9 6.7 6.8 6.6
World Trade Volume (%) 2.8 2.6 4.2 4.0 Exchange Rate (Baht/US dollar) 34.29 35.29 34.00 34.0 - 35.0 Dubai Crude Oil (US Dollar/Barrel) 50.9 41.4 52.5 50.0 - 60.0 Export Price (US Dollar) (%) -4.1 -0.4 3.0 0.5 - 1.5 Import Price (US Dollar) (%) -10.8 -2.7 5.0 1.0 - 2.0 Income from Tourism (Trillion baht) 1.54 1.76 1.98 2.21 Source: NESDB

Macroeconomic Strategy and Planning Office
NESDB Economic Outlook
Nov 20, 2017 26
will revert to their monetary policy target which will result in an continually upward
adjustment of the US Fed rate and a normalization of its balance sheets. Similarly, other
major central banks (except BOJ) are more likely to signal a change in monetary policy
direction in the second half of 2018.
2) The average value of Thai baht in 2018 is expected to be in the range of 34.0 to 35.0
baht per US dollar, slightly depreciating from 34.0 baht per US dollar in in 2017. This
is in line with the continuous Fed rate hike and reduction of the balance sheet, as well as
major economies’ signals of monetary policy adjustment, which are expected be more
evident in the latter half of 2018. These will result in a gradual increase in world market
interest rates and thus pressure on Thai baht depreciation. For the base case scenario, it is
expected that the US Fed will adjust its policy rate in December 2017, before continues to
hike twice in June and December of 2018, respectively. Moreover, it is possible that
European Central Bank (ECB) is going to signal monetary policy change again in the fourth
quarter of 2018. Nevertheless, the high surplus of the current account and the recovery of
the Thai economy under improving political conditions will curb the depreciation pace of
Thai baht to be in a limited range.
3) The average Dubai crude oil price in 2018 is expected to be in the range of 50.0 – 60.0
US dollar per barrel, a gradual rise from 52.5 US dollar per barrel in 2017. The factors
that will support the rise include: (i) increasing oil demand as a result of a more pronounced
recovery of the world economy, (ii) continuous production reduction of OPEC and non-
OPEC countries amidst the rise in world demand for oil, will reduce excess supply and oil
inventories in the global market, (iii) investors’ speculation on the possibility of extending
oil production cut agreement of the OPEC and non-OPEC countries, which will be
terminated in March of 2018, for 3 – 9 more months, and (iv) The persistent geopolitical
tensions over Korean Peninsula and the Middle East. However, there are limitations causing
the oil price to rise at a slow pace including (i) a rise in oil production of non-OPEC,
especially the US and Canada, and (ii) the US Dollar appreciation following the Fed’s
monetary policy normalization.
4) The export and import price in US dollar term increases by 0.5 – 1.5 and by 1.0 – 2.0
percent, lower than 3.0 and 5.0 percent in 2017, respectively. This is in line with the
world oil price assumption that it will rise at a slower rate from 26.8 percent in 2017 (From
41.4 US dollars per barrel in 2016 to 52.5 US dollars per barrel in 2017) to 4.7 percent in
2018. (From 52.5 US dollars per barrel in 2017 to 50.0 – 60.0 US dollars per barrel in 2018)
5) Revenue from foreign tourists is likely to be 2.21 trillion baht, increasing by 11.6
percent from 1.98 trillion baht in 2017. Key supporting factors are (i) the pickup of the
world economy, including advanced countries, and major economies in Asia which will
support a continuous positive growth of long-distance tourists and tourists within the region
particularly those from Russia, India, and the Middle East countries where the economies
are clearly improving, (ii) low traveling costs, in line with the world oil price trend and
intense competitions among the airline industry, (iii) ongoing government’s measures to
stimulate the tourism sector and the continual improvement of domestic political stability,
(iv) Thailand is regarded as one of the world’s important tourism destination, (v) the
expansion of short-haul international operations by low cost airlines, and (vi) the capacity
extension of major airports to accommodate increasing number of aircrafts and tourists.
6) Government Budget is expected to be disbursed as follows; (i) the FY2018’s annual
budget disbursement rate of 92.0 percent of overall budget, compared with the FY2017
actual disbursement rate of 91.9 percent. In FY2018, it is expected that current budget
disbursement rate will be 97.0 percent while capital budget disbursement rate will be 75.0

Macroeconomic Strategy and Planning Office
NESDB Economic Outlook
Nov 20, 2017 27
percent, compared with 96.8 and 70.3 percent, respectively, in FY2017, (ii) the state-owned
enterprise’s capital budget disbursement of 80.0 percent, (iii) the carry-over budget
disbursement of 75.0 percent, (iv) the off-budget loans consisted of water resources
management and road transport system projects, and others, of approximately 8,530.1
million baht, reduced from 9,398.4 million baht in FY 2017, and (v) the annual budget
disbursement in the first quarter of FY 2019 (October – December 2018) of 30.0 percent of
overall budget.
Key components of the economic growth :
The Thai economy in 2018 is projected to expand in the range of 3.6 – 4.6 percent, with the
midpoint of 4.1 percent, increasing from 3.9 and 3.2 percent of growth in 2017 and 2016,
respectively. The headline inflation is projected to be in the range of 0.9 – 1.9 percent and
the current account balance is forecasted to register a surplus of 8.1 percent of GDP
Economic Projection for 2018:
1) Consumption: Private consumption expenditure is estimated to grow by 3.1 percent,
continuously increasing from a growth of 3.2 percent in 2017, due to the improvement of
overall income condition in the economy. Meanwhile, government expenditure is
anticipated to expand by 2.7 percent, accelerating from 2.0 percent-growth in 2017.
2) Total investment is projected to grow by 5.5 percent, an increase from 2.0 percent in 2017.
Public investment is estimated to expand by 11.8 percent, accelerating from 1.8 percent in
2017. The revision is mainly a result of an increase in capital budget from both annual
budget and state-owned enterprise’s capital budget by 21.8 percent and 45.7 percent,
respectively. In additions, key public infrastructure projects in particular mega projects
under Transportation Action Plans in Year 2016 and 2017 is expected to make more
progress and start to undertake a construction. There will also be acceleration in capital
budget disbursement from ongoing projects under construction process. Private Investment
is likely to grow by 3.7 percent, accelerating from a growth of 2.2 percent in 2017,
contributing primarily by (i) increasing capacity utilization trend due to favorable export
growths which will stimulate new investment for expanding production capacity,
particularly in the industrial sectors with the current capacity utilization rate of higher than
75 percent, (ii) the improvement of investors’ sentiment towards economic recovery and
improving domestic political conditions, and (iii) a further progress of measures and key
public investment projects which will enhance economic confidence and support private
investment.
3) Export value of goods in US dollar term is projected to expand by 5.0 percent, increasing
from a growth of 8.6 percent in 2017. Export volume of growth is projected to grow by 4.0
percent, following the continual recovery of the world economy and global trade volume.
Meanwhile, export price is forecasted to grow by 1.0 percent, lower than 3.0 percent in
2017, following a diminishing increase in global oil price which will lead to lower growth
of export price and eventually lead to a deceleration of overall export value. Together with
continual expansion of export of service in line with increases in receipts and numbers of
foreign tourists, the export quantity of goods and services is projected to grow by 5.3
percent.
4) Import value of goods in US dollar term is anticipated to grow by 7.0 percent, compared
to a 13.0 percent growth in 2017. It is forecasted that the import volume will expand by 5.5
percent owing to the acceleration of export and investment, despite a slight decrease from
Macroeconomic Strategy and Planning Office
NESDB Economic Outlook
Nov 20, 2017 28
7.9-percent growth in the previous year due to the fact that growth began to adjust to its
normal trend (import volume in the first nine months of 2017 increased by 8.5 percent,
partly supported by a decrease of 4.3-percent at the same period in 2016). Likewise, import
price is forecasted to grow by 1.5 percent, a moderate slowdown from 5.0 percent-growth in
2017. After adding up import of services, it is projected that the import volumes of goods
and services will grow by 5.6 percent.
5) Trade balance is estimated to register a surplus of 29.4 billion US dollars, lower than a
surplus of 31.9 billion US dollars in 2017. A smaller surplus is due to the fact that the
import value is projected to increase faster than the export value. After combining with the
service account surplus, the current account is projected to register a surplus of
approximately 38.1 billion US dollars, an equivalent of 8.1 percent of GDP.
6) Economic stability will remain favorable. The average headline inflation across 2018 is
expected to be in the range of 0.9 – 1.9 percent, increasing from 0.7 percent in 2017. This is
supported by the improvement of domestic demand, the continual increase in oil price and
primary commodity prices, a gradual pace of Thai baht depreciation and a normalization of
raw food price.
Macroeconomic Strategy and Planning Office
NESDB Economic Outlook
Nov 20, 2017 29
The recovery of global economy and the impact of key fiscal measures have contributed
significantly to the accelerating pace of Thai economy in 2017, as well as the improvements of
key economic fundamentals and stability. In 2018, the dynamic of Thai economic growth tends
to be strengthened further. The supporting factors include acceleration of public and private
investment and the expansion of export, tourism and related services sector driven by the world
economic recovery. The recovery of the manufacturing sector tends to be strengthened by the
continued recovery of exports and further support the growth of overall economy. However, the
growth contribution from the agricultural sector tends to soften as the output level becomes
normalized. Therefore, Thai economy needs to be driven by non-agricultural sectors. Under the
outlooks that the development of global economic recovery and financial system still prone to
volatility amidst the rising trends of commodity price level and interest rates, the
macroeconomic policy management should be given to the following guidelines:
1) Promoting non-agricultural sectors to offset the declining growth contribution from
the agricultural production by: (i) fostering export sectors to its full potential as it helps
contribute to the growth of manufacturing sector which minimizes idle capacities and foster
manufacturing production; (ii) building up confidence and conducting measures to bolster
private capital accumulation. The focuses should be on encouraging private sector to invest
in the country’s strategic sector, improving economic competitiveness and ensuring
investors that the important policy directions are mandate to continue implementation, as
legislatively stipulated in the Making of National Strategy and National Reform Plan and
Process acts; (iii) supporting the expansion of tourism sector by maintaining public
securities and improving facilities in tourist attraction areas, strategizing on high-income
and long distance travel segments and emphasizing on income distribution from tourist
sector to local communities.
2) Expediting the public investment for enhancing investor confidence, fostering economic
expansion and, ultimately, achieving the long-term economic growth target as stipulated in
the 20-year National Strategy. For achieving these targets, the emphases shall be placed on:
(i) improving the efficacy of the government’s and state-owned enterprises’ capital budget
disbursement to reach the disbursement rate of not less than 75 and 80 percent, respectively,
of their owned capital budget; (ii) expediting procurement processes of the key
infrastructure projects under the 2016-2017 Transportation Action Plan to continually enter
construction phase; (iii) Developing targeted special economic zones including Eastern
Economic Corridor (EEC) as well as conducting measures to promote investment in those
strategic development areas and; (iv) Progressing key transportation and logistics
infrastructure projects to bolster economic expansions and to disseminate economic
activities.
3) Supporting small farmers and low income groups and strengthening the SMEs and
local economies: (i) On agricultural production and farm incomes, the emphases shall be on
increasing export of agricultural product from the level in 2017, supporting measures for
agricultural crops that will be released to the markets, supporting a large-scale farming in
minimizing cost and increasing output, empowering bargaining power of small farmers, and
adopting proper crop plantation and production methods suitable for each particular area as
well as shifting to grow higher-market-value crops; (ii) On financial and fiscal measures,
the measures shall aim at resolving and mitigating the impacts of flood, ensuring sufficient
funds for the existing measures that aim to support small farmers, local enterprises and
7. Economic Management for the year 2018
Macroeconomic Strategy and Planning Office
NESDB Economic Outlook
Nov 20, 2017 30
SMEs, particularly the groups that are vulnerable to the rise of commodity price level and
cost of productions; (iii) On strengthening the SMEs and local enterprises, the measures
should: encourage SMEs to adopt tax accounting standard and to implement high
technology in production, management and marketing system, to establish the link with
larger-scale business and manufacturers, to develop product corresponding to customer
demand and to invest in special economic zones for tax benefits and expatriate workers,
including the promotion of dual education system for resolving labor shortage and
regulating expatriate workers.
4) Arranging labor force to facilitate an expansion of economic activities covering high-
and semi-skilled labors as well as expatriate workers, the measures should aim at: (i)
training fresh graduates, (ii) developing skillsets for adaptation to disruptive technology,
(iii) promoting the use of platform mobile application in labor market, (iv) promoting job
market platform where job seekers, academic institutes and employers are met in order to
minimize transaction costs of seeking and, (v) developing specialized labor training
institutes for the strategic industry.
Macroeconomic Strategy and Planning Office
NESDB Economic Outlook
Nov 20, 2017 31
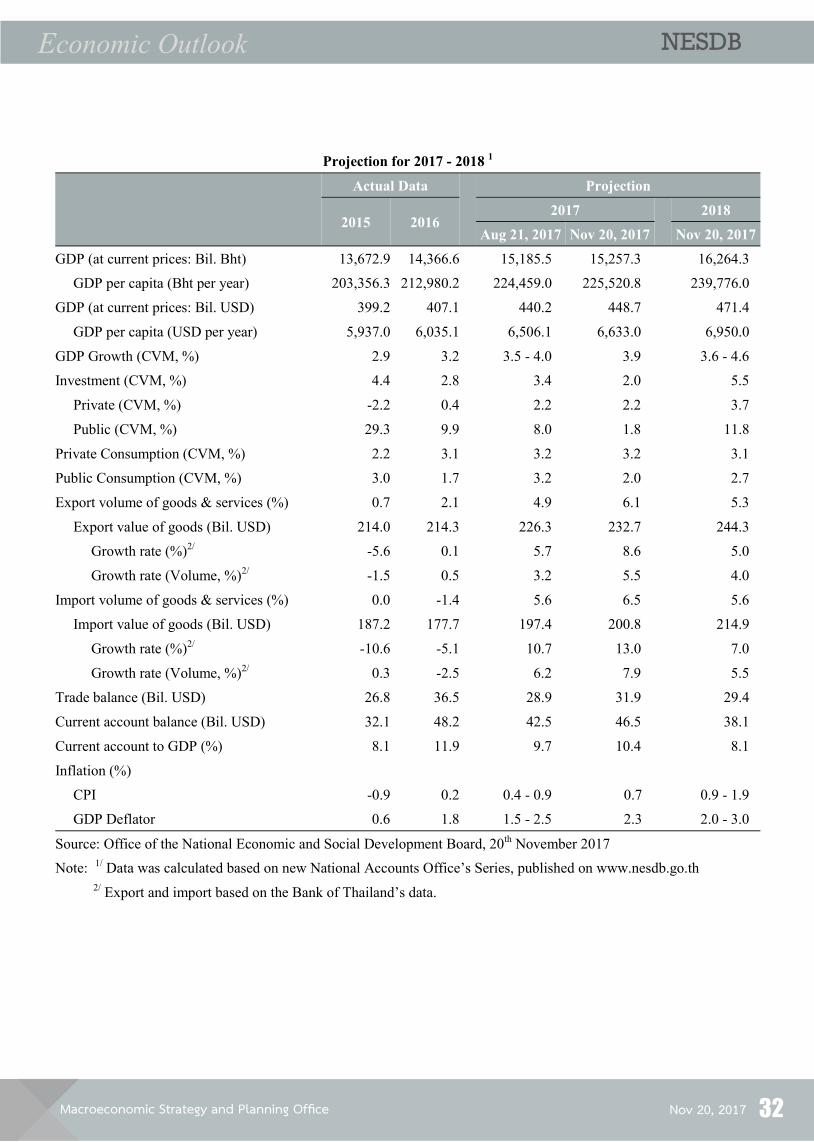
Macroeconomic Strategy and Planning Office
NESDB Economic Outlook
Nov 20, 2017 32
Projection for 2017 - 2018 1
Actual Data
Projection
2015 2016 2017 2018
Aug 21, 2017 Nov 20, 2017 Nov 20, 2017
GDP (at current prices: Bil. Bht) 13,672.9 14,366.6 15,185.5 15,257.3 16,264.3
GDP per capita (Bht per year) 203,356.3 212,980.2 224,459.0 225,520.8 239,776.0
GDP (at current prices: Bil. USD) 399.2 407.1 440.2 448.7 471.4
GDP per capita (USD per year) 5,937.0 6,035.1 6,506.1 6,633.0 6,950.0
GDP Growth (CVM, %) 2.9 3.2 3.5 - 4.0 3.9 3.6 - 4.6
Investment (CVM, %) 4.4 2.8 3.4 2.0 5.5
Private (CVM, %) -2.2 0.4 2.2 2.2 3.7
Public (CVM, %) 29.3 9.9 8.0 1.8 11.8
Private Consumption (CVM, %) 2.2 3.1 3.2 3.2 3.1
Public Consumption (CVM, %) 3.0 1.7 3.2 2.0 2.7
Export volume of goods & services (%) 0.7 2.1 4.9 6.1 5.3
Export value of goods (Bil. USD) 214.0 214.3 226.3 232.7 244.3
Growth rate (%)2/ -5.6 0.1 5.7 8.6 5.0
Growth rate (Volume, %)2/ -1.5 0.5 3.2 5.5 4.0
Import volume of goods & services (%) 0.0 -1.4 5.6 6.5 5.6
Import value of goods (Bil. USD) 187.2 177.7 197.4 200.8 214.9
Growth rate (%)2/ -10.6 -5.1 10.7 13.0 7.0
Growth rate (Volume, %)2/ 0.3 -2.5 6.2 7.9 5.5
Trade balance (Bil. USD) 26.8 36.5 28.9 31.9 29.4
Current account balance (Bil. USD) 32.1 48.2 42.5 46.5 38.1
Current account to GDP (%) 8.1 11.9 9.7 10.4 8.1
Inflation (%)
CPI -0.9 0.2 0.4 - 0.9 0.7 0.9 - 1.9
GDP Deflator 0.6 1.8 1.5 - 2.5 2.3 2.0 - 3.0
Source: Office of the National Economic and Social Development Board, 20th November 2017
Note: 1/ Data was calculated based on new National Accounts Office’s Series, published on www.nesdb.go.th
2/ Export and import based on the Bank of Thailand’s data.