Embed Size (px)
Citation preview
The Regulatory Assistance Project 50 State Street, Suite 3Montpelier, VT 05602
Phone: 802-223-8199web: www.raponline.org
NESCAUM States Training
Energy Efficiency and Air Quality
Presented by Christopher James, Ken Colburn and John Shenot
May 3, 2011

Welcome and Introductions
• Goals for today:– Training on how to include energy efficiency
(EE) in air quality plans– This is an opening conversation– Stretch and deepen your thinking– Candid dialogue– Provide input for training to be held in other
regions
2
Topic One:915-930 AM
• Characterizing Energy Efficiency and Renewable Energy
3
Energy Efficiency
• Definition• Benefits• Energy Efficiency Program Planning• Barriers
Today’s Focus is on Energy Efficiency
• Characteristics of EE:– Dispersed, decentralized installations – Benefits measured through algorithms based on
audited energy savings– Not yet tracked by RTOs in energy markets
• Characteristics of renewable energy resources:– Output measured by instrumentation– RE units above 1 MW tracked by RTO– Determining production is straightforward
5
Definition of Energy Efficiency
• Provides same or better level of service or production at lower energy consumption
• Consumption is lowered during all time periods
• N.B. “Conservation” refers to the extra steps taken to quickly reduce consumption during peak periods of electricity load.
• Applies to all fuels: electric, gas, oil (concept of fuel neutrality or fuel blind)
Energy Efficiency Benefits
• Directly and indirectly reduces customer bills• Reduces risk of fuel price volatility from fossil fuel• Improves energy security• Provides capacity to improve reliability of electricity
system• Reduces stress on transmission and distribution
system• Accumulates benefits over life of measure, project,
program and portfolio• Reduces criteria, toxic and greenhouse gas
emissions• Improves land and water quality
Energy Efficiency Planning Definitions
• Measure: a specific element (e.g. residential lighting)
• Program: a group of measures (low-income program, new commercial building program)
• Project: several measures installed concurrently at same location (e.g.. whole building concept)
• Portfolio: the entire group of measures and programs
• Goal: Maximize benefits, “touch” customer only once (if possible)

Air and Energy Nomenclature: Developing Bilingual and Multilingual Skills
• An energy efficiency program can be an air quality measure– EE programs directed, reviewed, approved by PSC. Energy offices and
3rd parties coordinate planning, implement programs
• Measure, policy, program have different meanings to energy regulators
– Need to remember to whom you are speaking, and terms of art have different meanings, even though the letters are the same
• An air quality measure can be:– Narrow (i.e. LED traffic light changeout)– Broad (i.e. a state portfolio of EE resources that cleared the New
England regional capacity market)• And, terminology can vary by region and state
9
Barriers: Why Hasn’t EE Been Included in Air Plans?
• Emissions benefits determined indirectly v. CEMS
• Tens of thousands of discrete measures v. a few dozen EGU
• Degree of benefit varies by state, region• High transaction costs, or perception thereof,
from previous EPA guidance• Tendency to focus on specific measures vs.
program or portfolio
10
Topic Two: 930-1030 AM
• How is EE treated in air quality plans?
11
Session Synopsis
• EE is “top ten” policy in state GHG plans• Defining the baseline• Growth projections• Examples of policy measures for
consideration in air quality plans
12
EE is Top Ten Policy in State GHG Plans
• Why isn’t this priority translated to air plans?• EE programs are administered by:
– Utility– Third party– Combination of the above
• Criteria pollutant benefits occur, even if they are not specifically broken out as discrete control measures
• GHG and air plans can be better synched
13
Synching GHG and Air Quality Plans
• Multi-pollutant (or climate-friendly) plans assess EE benefits across all pollutants: criteria, toxic, GHG
• Pollutant and public health benefits are a valuable attribute to EE program administrators– BENMap results: $3-4 in additional benefits per $1
investment in EE (in addition to $3-4 in energy savings per $1 investment)
• How the state air/GHG plan characterizes current EE program is critical
14
What is Characterized = What Is in the Baseline
• What’s in? What isn’t ?– Current vs. future projections
• How is it being characterized?– Are EE programs static, ramping up?
• “On the books” vs. “on the way”– Future effective dates?– Program sunsets?
15
Baseline Examples
• Federal policies: Energy Policy Act 2005, Energy Independence Act 2007, CATR I and II, DOE appliance standards
• State examples: RPS, building codes and standards, state specific appliance standards, EERS
• Municipal/county: building codes/ ordinances, EE policies
16
Baseline Year Zero (e.g. 2010)
• EIA reference for energy consumption, fuel price, construction costs, EE and RE policies. Federal agencies use EIA data to develop input assumptions for national or regional scale models. EIA data:– Captures generation behavior– Reflects impact of federal policies– Includes state policies (one year lag)
17
Baseline (Reference Year)
• Emissions inventory for stationary, area and mobile sources
• Inventory is based on factors whose precision varies– AP-42 hierarchy of A to E– Some area and mobile source emissions
determined from demographics and models (VMT estimates, vintage year and number of cars and trucks)
18
Baseline Future Projection
• Assumptions:– EIA load forecast continues to include RPS,
federal and state policies that are on the books• “On the way” policies may be partially
captured or not at all• Also need to characterize updates to state
appliance standards, new state appliance standards, revisions/updates to state/local building codes
19
Impact of On The Books Rules on Emissions Forecast
• EPA plan approval • Credits for I/M program• Future effectiveness of tailpipe and federal
appliance standards• Determine influence of programs or
measures whose effect changes over time (i.e. RPS, EERS that require increasing quantity of future resources to be procured)
20
Growth Projections of Energy Demand
• Information sources– Crosswalk with PUC and utility assumptions
(if req’d: check the IRP or other planning documents) (details covered in 215-245pm session)
– Assumptions for future EE• Data from technical/maximum potential studies• Annual program plans and evaluations• Reports to legislature
21
Considering EE Measures for State SIPs
• Ideal: A series of measures that reduce energy demand coincident with peak electricity demand periods, high pollutant concentrations, and reduce emissions of multiple pollutants (criteria, toxic, and GHGs).– Assess for SIP credit eligibility (real, surplus, permanent,
quantifiable, and enforcement)– Determine costs, effectiveness, challenges, and timing (e.g.,
when and by how much energy reductions would occur)– Determine how the system would respond (how, when, and
where emissions would be affected)– Determine reductions (compare to peak emissions, average,
regulatory limits, and/or use dispatch modeling)
22
Efficiency Measures Typically Considered
• Apply to all sectors: Residential, Commercial, and Industrial… (mobile sources & land use too)– New building design, thermal envelope and
mechanical/electrical systems– Heating and cooling equipment, distribution systems
and control systems– Industrial process equipment– Motors, compressed air systems– Lighting: daylighting, lighting design, fixtures, lamps,
ballasts, controls, street lighting
23
Examples of EE/RE Creditsin State SIPs
• Massachusetts: 5% NOx Public Benefit Set-Aside in CAIR program– EE and RE eligible; applicant proposes projects– Electricity and thermal eligible– Credit at 1.5#/MWh saved; 0.44#/MMBtu saved– Identifies ozone-season and non-ozone-season reductions– Massachusetts’ Clean Air Interstate Rule (Mass CAIR), 310 CMR 7.32
• Texas: Texas Emission Reduction Plan (TERP) – Texas Commission on Environmental Quality (TCEQ) directed to include in SIP– EE and RE included; initial focus mostly on EE– NOx reductions from 11 types of EE programs assessed (2008)– Identifies annual and ozone-season-day NOx reductions– Texas Health and Safety Code Ann. § 388.003 (e), Vernon Supp. 2002 (Senate
Bill 5, 77R as amended 78 R & 78S).
24
Examples of EE Measures in State SIPs
• New Jersey: Retires allowances from NOx budget set-aside– EE and RE included– Assumes reductions occur in-state (more conservative); applies +11% factor for
T&D losses and -15% “degradation factor” to EE, 5% “degradation factor” to RE– Uses generation-weighted average emissions, with unit-specific NOx rates or
1.5#/MWh default.– Identifies ozone-season and non-ozone-season reductions
• Maryland: Retires allowances from NOx budget set-aside– First state to include SIP credit for RE (wind) in 2004– EE included now; lighting and AC retrofits in state buildings, LED traffic lights– Assumes reductions occur in-state (more conservative); applies +11% factor for
T&D losses and -15% “degradation factor” to EE, 5% “degradation factor” to RE– Assumes reductions occur in PJM; used time-matched (hourly) generation
weighted averages of plants actually dispatched during the ozone and non-ozone seasons
25
Examples of EE Measures in State SIPs
• Connecticut: Focused on NOx budget program– EE from utility-sponsored programs: commercial/industrial lighting and air
conditioning, and residential lighting and air conditioning– Used marginal unit emissions on peak days emissions
• Illinois:– Quantifying and modeling impacts of state RPS and EEPS; comparing to “but
for” load growth– Dispatch modeling found that main impact of EE/RE in IL was reduced coal
generation in adjoining states
• California: Researching & quantifying– EE programs including: utility-sponsored programs, building codes, appliance
standards, efforts in state and federal buildings, agricultural programs, industry programs, financing programs for schools, municipalities and other public institutions and programs for water and wastewater plants.
– RE efforts include utility-owned installations, large-scale non-utility-owned installations and small-scale non-utility-owned installations.
26
Audience Participation
• Are you interested in including EE/RE benefits in your air quality plan?
• What types of EE programs could you explore including in your air quality plan?
• What would prevent you from including EE in your air quality plan?
• Describe your relationship and communications with your state energy regulators
27
EPA Comment
• .
28
Topics Three and Four 1045 AM-215 PM
• Measuring EE benefits– Energy savings– Calculating emissions benefits
• Evaluation, measurement and verification (EM&V)
29
What Does Energy Savings Mean?
Energy Savings = Baseline – Actualwhere
Actual is the amount of energy used during a given period; and,
Baseline is the amount of energy that would have been used during the same period had
the efficiency project not happened
30
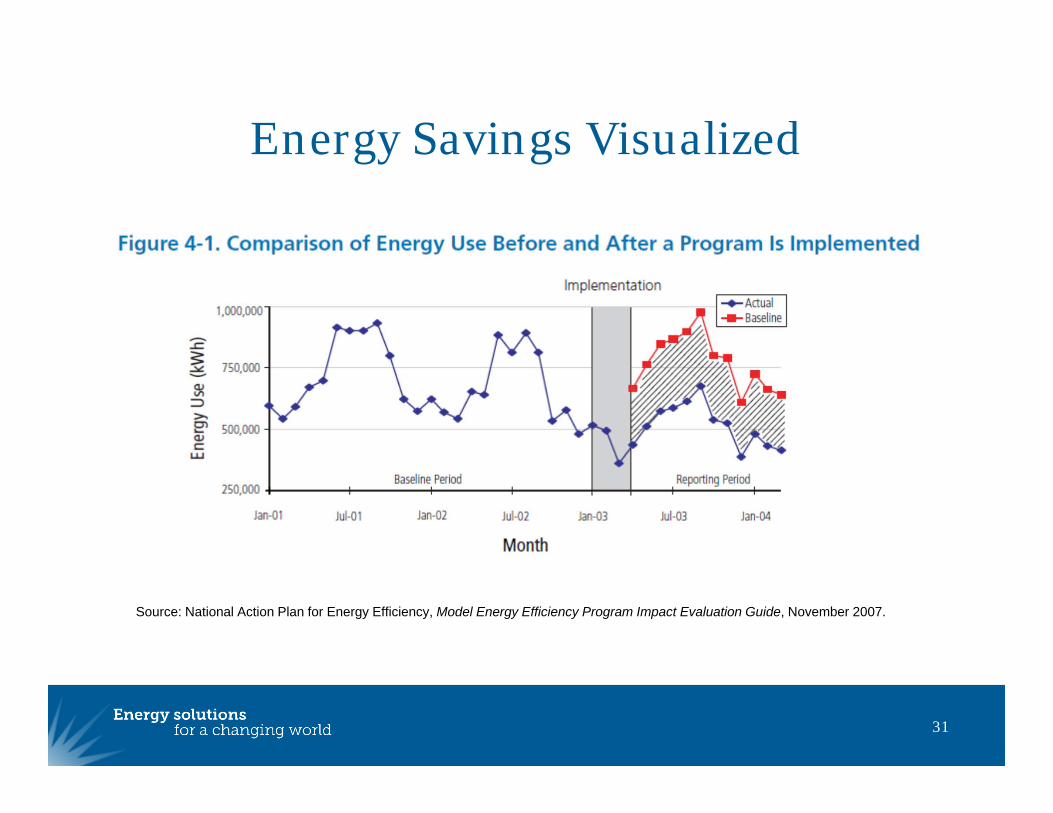
Energy Savings Visualized
31
Source: National Action Plan for Energy Efficiency, Model Energy Efficiency Program Impact Evaluation Guide, November 2007.
Energy Savings: Past vs. Future
• Evaluation Reports– Backward look at programs implemented– Estimate past and future savings due to
previously implemented program activities
• Potential Studies– Forward look at the savings that could be
achieved through future program implementation
32

Basic Process for Measuring EE Benefits
33
Step 1:Estimate gross energy savings
Step 2:Estimate net energy
savings
Step 3:Calculate avoided
emissions
Step 1: Estimate Gross Energy Savings
• Gross Savings = the amount that results directly from actions promoted by the EE program, regardless of the extent to which the program actually prompted the change
• Involves a combination of methods:– Measured and verified savings– Deemed savings
34
Measured and Verified Savings
• Used for unique projects or for programs in which a variety of factors determine savings– Project savings determined by metering,
modeling, or engineering calculations– Program savings determined by selecting a
representative sample of projects, measuring the savings from those selected projects, and extrapolating the results to the entire program
35
Deemed Savings
• Used for simple projects with well-understood savings that don’t significantly vary from project to project
• Stakeholders stipulate that they will use deemed values to estimate energy savings for each project within a program
36
Step 2: Estimate Net Energy Savings
• Net Savings = the portion of gross savings that can be attributed to the EE program, separating out other factors that influence behavior and consumption
• Why might net savings be different than gross savings?
37
Estimating Net Energy Savings: Why?
• Free riders: participants who would have acted even in the absence of the program
• Spillover: changes in energy use caused indirectly by the presence of the program
• Rebound: savings from installing an efficient device that are offset by greater use of the device
38
Estimating Net Energy Savings: How?
• Net-to-Gross Ratio (NTGR): 4 approaches1. Self-reported survey responses from
program participants2. Self-reported survey responses enhanced
with interviews or other documentation3. Statistical models that compare behavior of
program participants and non-participants4. Deemed NTGR based on past use of the
other methods
39
Temporal Aspects of Measurement
• Future net and gross savings caused by past actions can be forecasted
• Persistence is a key factor: will the efficiency of a project degrade over time?
• Need to understand if you are looking at:– First year savings– Lifetime savings– Lifecycle savings
40
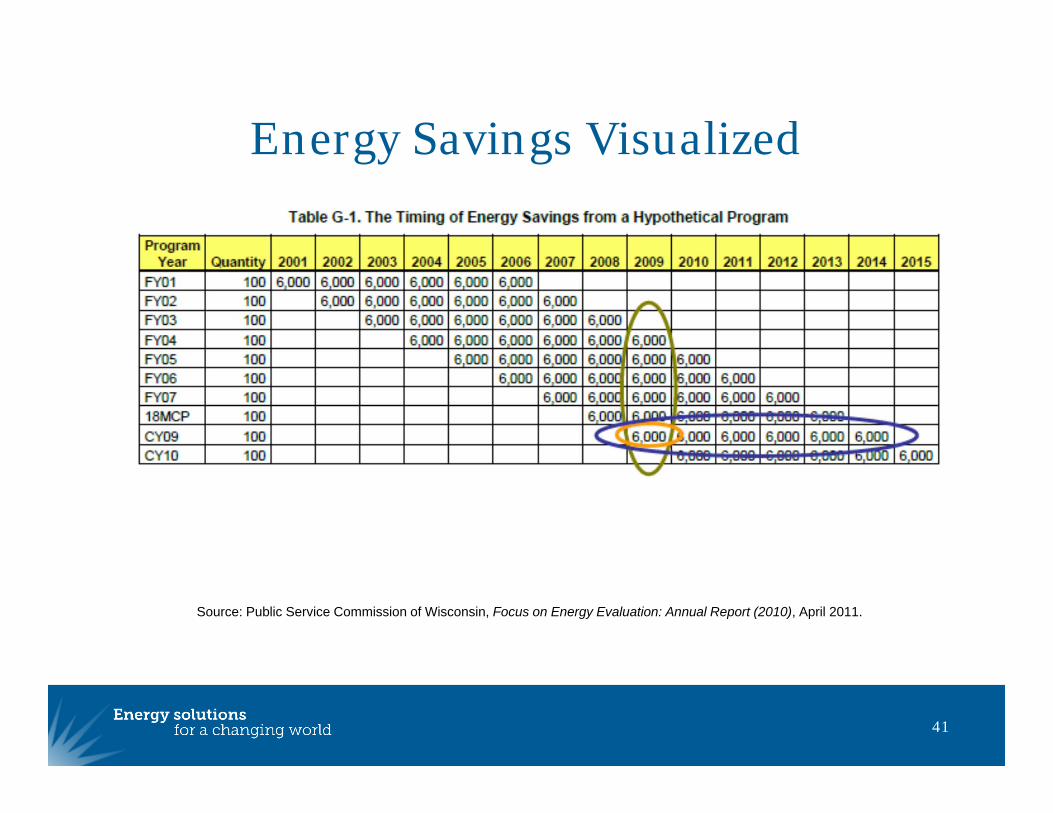
Energy Savings Visualized
41
Source: Public Service Commission of Wisconsin, Focus on Energy Evaluation: Annual Report (2010), April 2011.
Step 3: Calculate Avoided Emissions
• Key considerations:– When is energy saved in terms of time of day
and season?– For electricity savings, where will less
electricity be generated (i.e., at which EGUs)?
• We will focus today on electricity, since it is more complex than calculating avoided emissions from gas or oil use
42
Co-incidence of EE with Pollutant Concentrations
• Certain measures and projects may have energy savings whose benefits are highest during the times of day or days in a week when ozone or fine particle concentrations are also high
• For GHG benefits, duration and depth of savings are more important factors
43
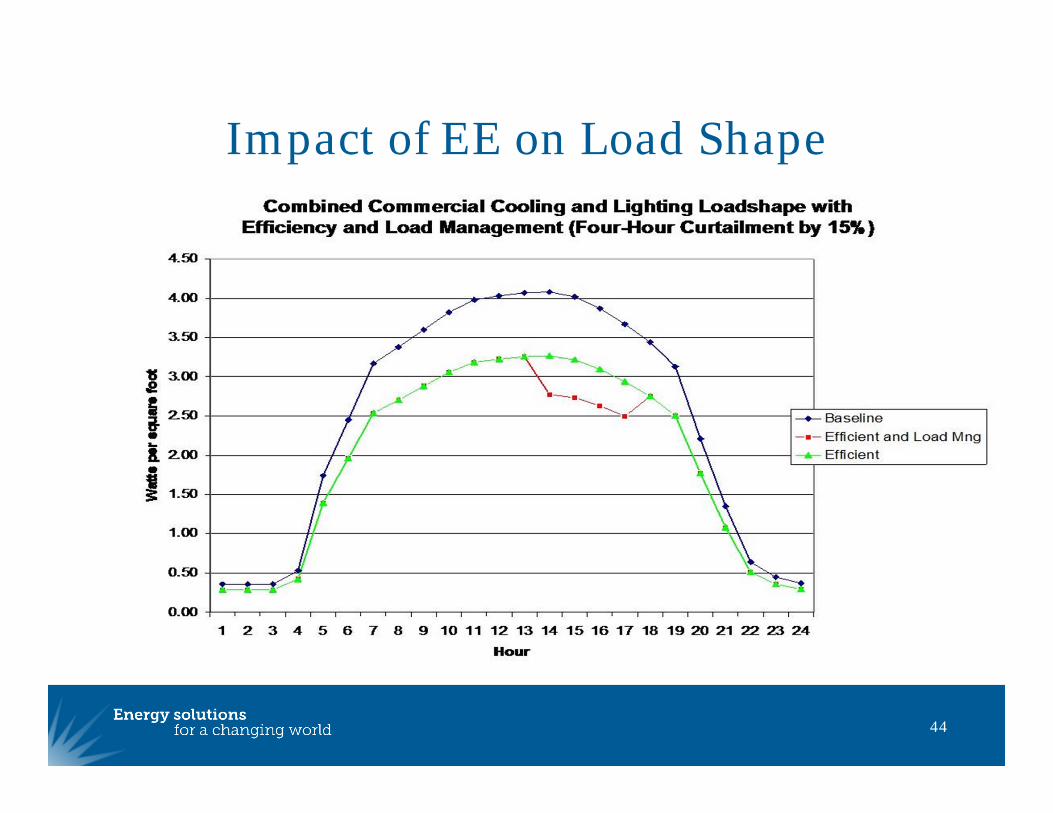
Impact of EE on Load Shape
44
Factors That Influence Emissions
• Distance between the generating resources and the loads they serve
• Existence of long-term contracts (for a specific plant, specified quantity of capacity, or both)
• Transmission constraints and load pockets• Demand response programs
What Do These Factors Mean for Future Air Quality?
• ISO or RTO plans to build or upgrade transmission for integration of wind. – In cases of higher export of wind generation,
environmental benefits may not accrue to the state where the wind is located
• Natural gas fueled plants are the marginal units about 2/3 or more of the hours in NE. In PJM, split between natural gas and coal
• New emissions reduction requirements for fossil-fuel fired power plants
• …and longer-term: if plug-in hybrid cars are popular?
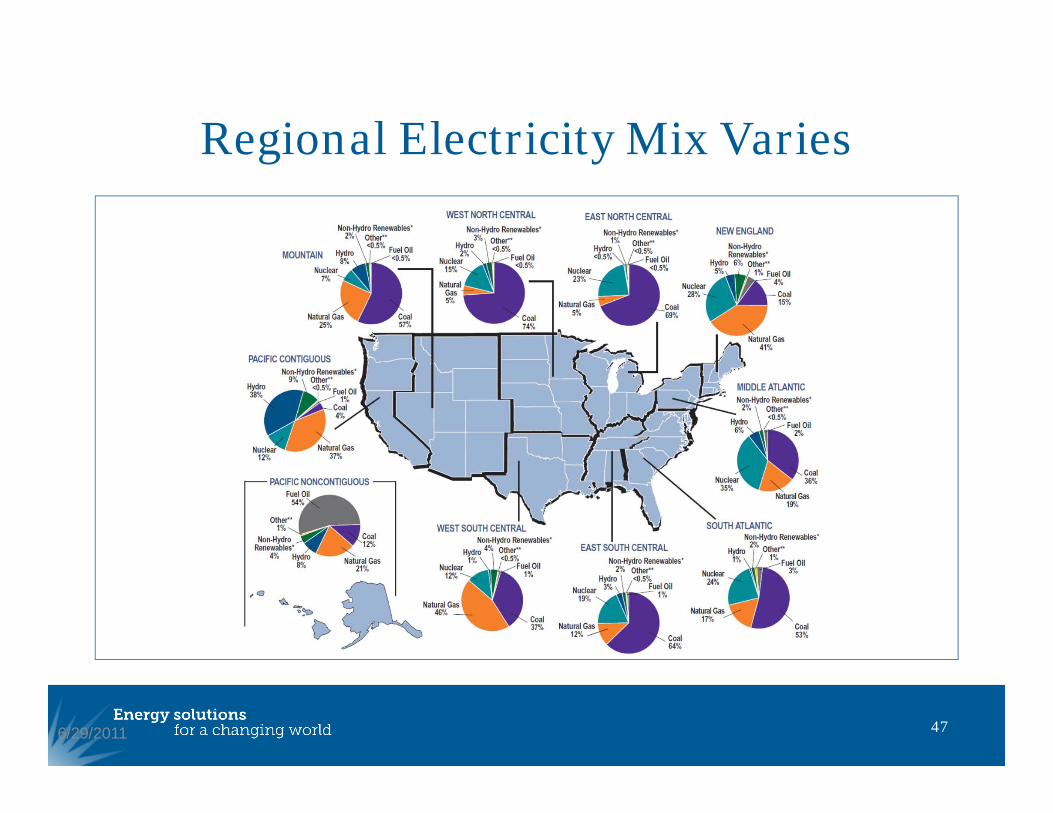
Regional Electricity Mix Varies
476/29/2011
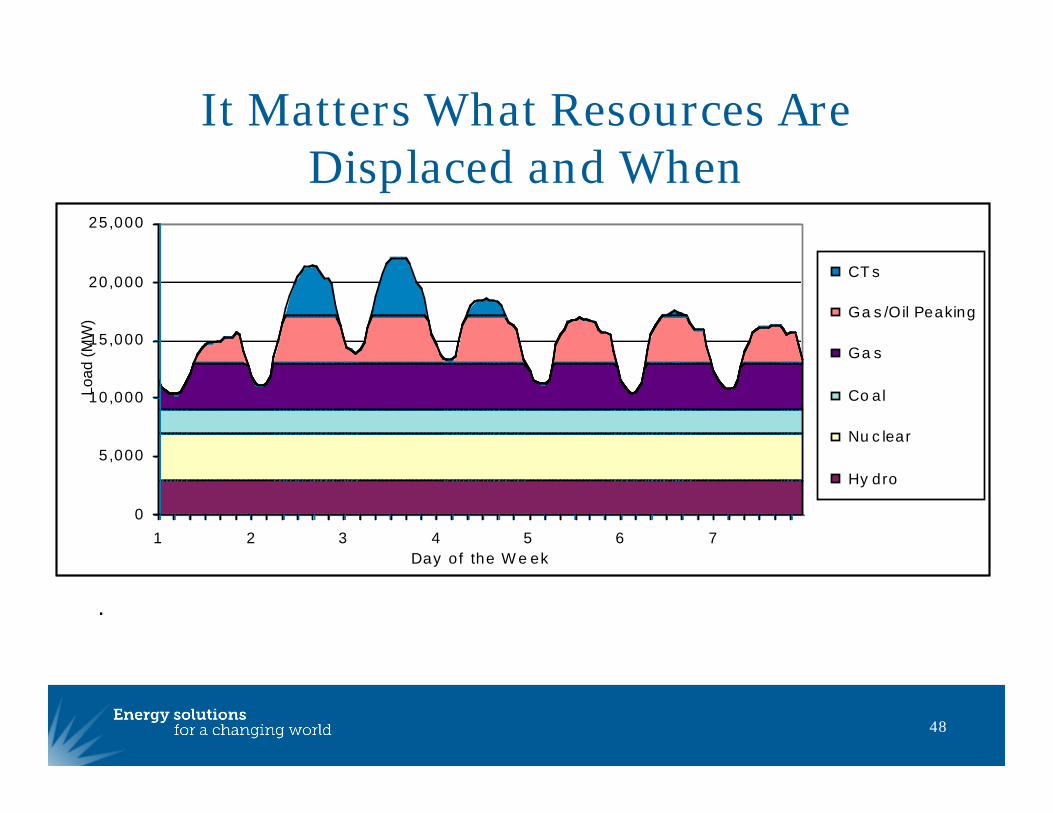
It Matters What Resources Are Displaced and When
48
0
5,000
10,000
15,000
20,000
25,000
1 2 3 4 5 6 7Day of the W e ek
Load
(MW
)
CT s
Ga s /Oil Peaking
Ga s
Co al
Nu c lear
Hy dro
.
Determining Emissions Avoided or Displaced
• Marginal emissions unit• Stochastic process (used for CT HEDD
report)• Dispatch modeling
49
Measuring Emissions Avoided or Displaced by EE
• Marginal emissions unit, and why this is appropriate
• What matters is that the methodology reflects the actual benefits, whatever unit type is displaced
• Coincidence with time of day• In restructured markets, marginal unit can
vary at each hour
50
Stochastic Approach
• Assesses impact of EE or RE on actual generation without dispatch modeling
• Uses 8760 hours from one year of generation and actual dispatch
• Assumes future dispatch will behave similarly to the year chosen
• Apply quantity of EE, RE (or new generator additions) to assess affect on generation
51
Dispatch Modeling
• Typically completed by utility (e.g. IRP), transmission planners, EPA (IPM is a dispatch model)
• Results are economically driven (least-cost resources are dispatched first)
• Uses historical dispatch to forecast future dispatch based on input reference scenario and sensitivities
• Unit by unit results
52
Dispatch Modeling Caveats
• Critical variables: load growth assumption, fuel price and forecast, construction costs
• EE is a dispersed resource with cumulative attributes. Many models require simplifying assumptions to assess affects
53

Lunch Break
54
Air Regulators in NE and Collaboration with ISO-NE
• ISO-NE work on marginal emissions unit, and benefits of energy savings
• CT example
55
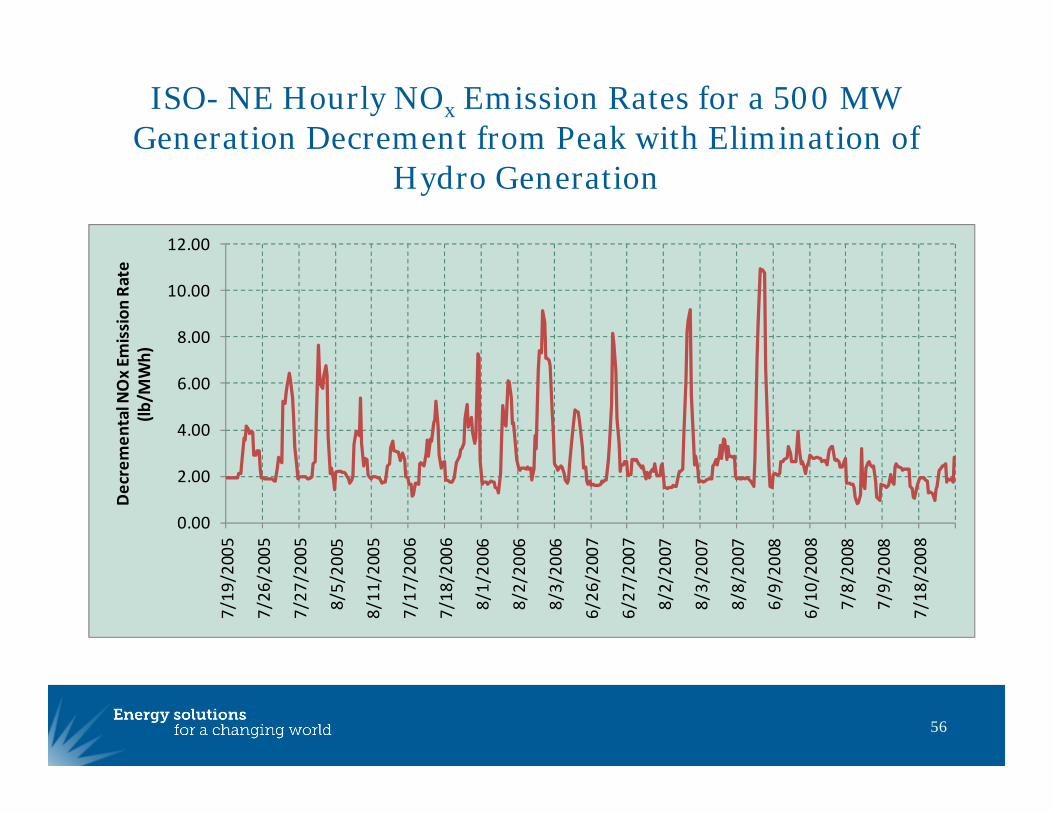
ISO- NE Hourly NOx Emission Rates for a 500 MW Generation Decrement from Peak with Elimination of
Hydro Generation
56
0.00
2.00
4.00
6.00
8.00
10.00
12.007/19
/2005
7/26
/2005
7/27
/2005
8/5/20
05
8/11
/2005
7/17
/2006
7/18
/2006
8/1/20
06
8/2/20
06
8/3/20
06
6/26
/2007
6/27
/2007
8/2/20
07
8/3/20
07
8/8/20
07
6/9/20
08
6/10
/2008
7/8/20
08
7/9/20
08
7/18
/2008
Decremen
tal N
Ox Em
ission
Rate
(lb/M
Wh)
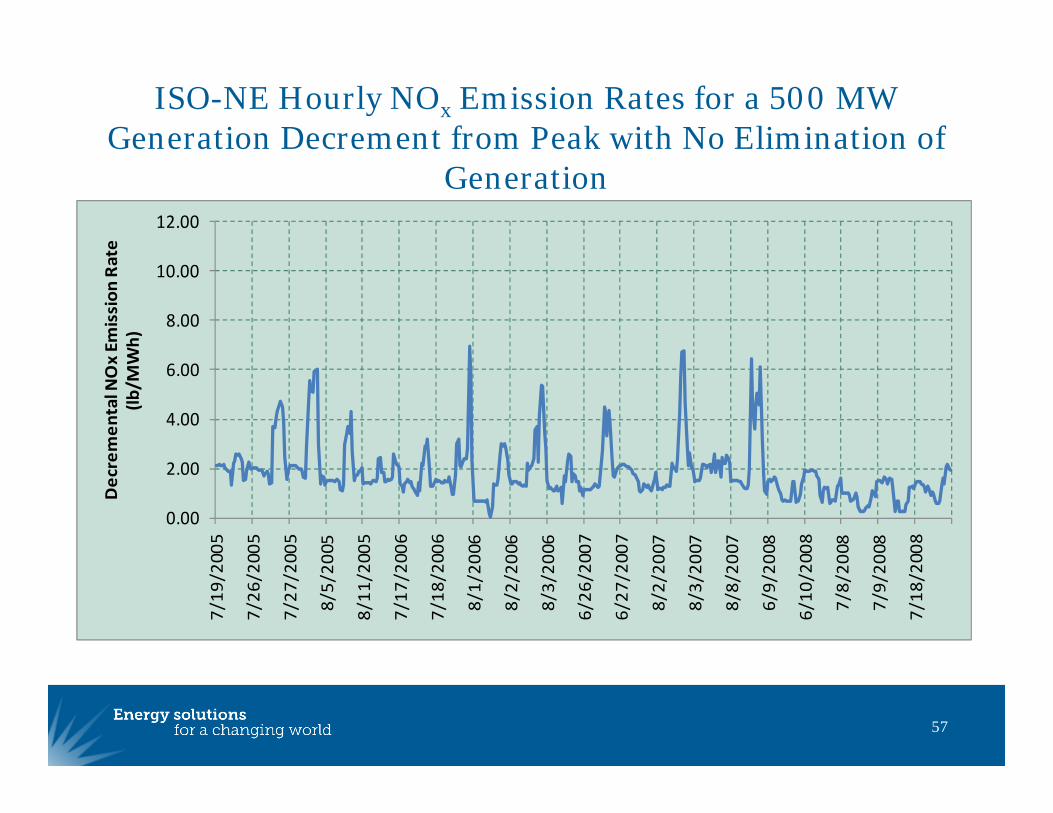
ISO-NE Hourly NOx Emission Rates for a 500 MW Generation Decrement from Peak with No Elimination of
Generation
57
0.00
2.00
4.00
6.00
8.00
10.00
12.007/19
/2005
7/26
/2005
7/27
/2005
8/5/20
05
8/11
/2005
7/17
/2006
7/18
/2006
8/1/20
06
8/2/20
06
8/3/20
06
6/26
/2007
6/27
/2007
8/2/20
07
8/3/20
07
8/8/20
07
6/9/20
08
6/10
/2008
7/8/20
08
7/9/20
08
7/18
/2008
Decremen
tal N
Ox Em
ission
Rate
(lb/M
Wh)
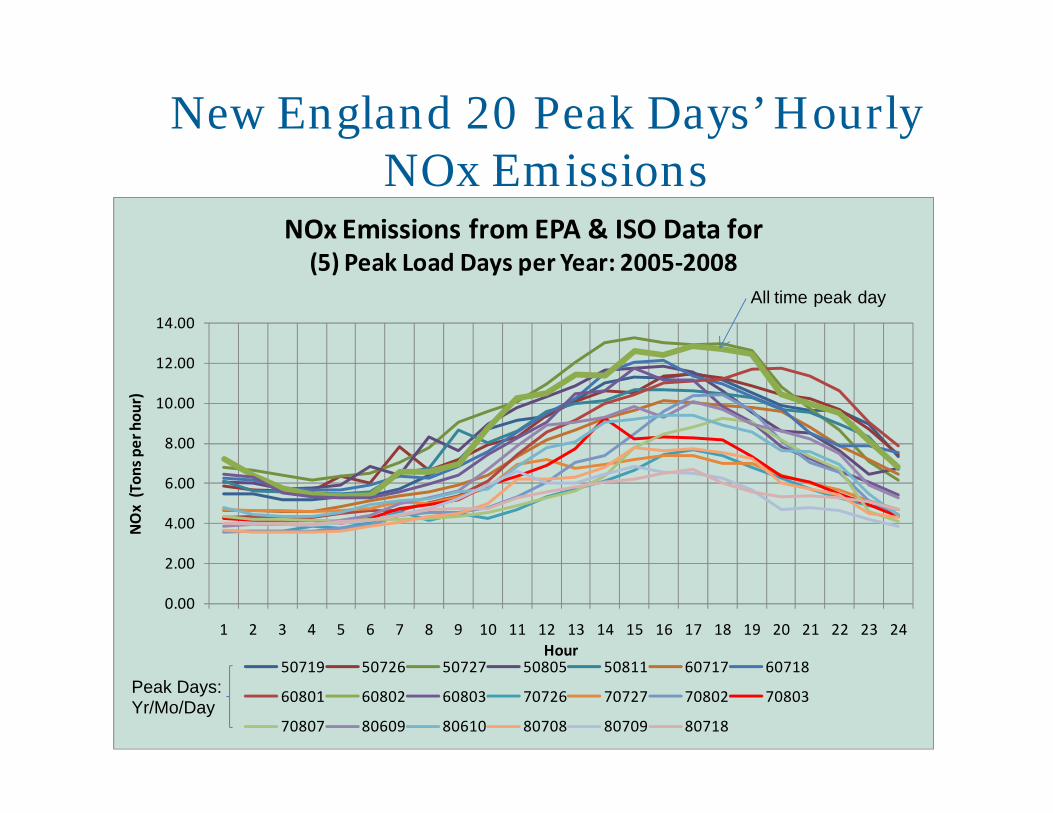
New England 20 Peak Days’ Hourly NOx Emissions
58
0.00
2.00
4.00
6.00
8.00
10.00
12.00
14.00
1 2 3 4 5 6 7 8 9 10 11 12 13 14 15 16 17 18 19 20 21 22 23 24
NOx (Ton
s per hou
r)
Hour
NOx Emissions from EPA & ISO Data for(5) Peak Load Days per Year: 2005‐2008
50719 50726 50727 50805 50811 60717 60718
60801 60802 60803 70726 70727 70802 70803
70807 80609 80610 80708 80709 80718
All time peak day
Peak Days:Yr/Mo/Day
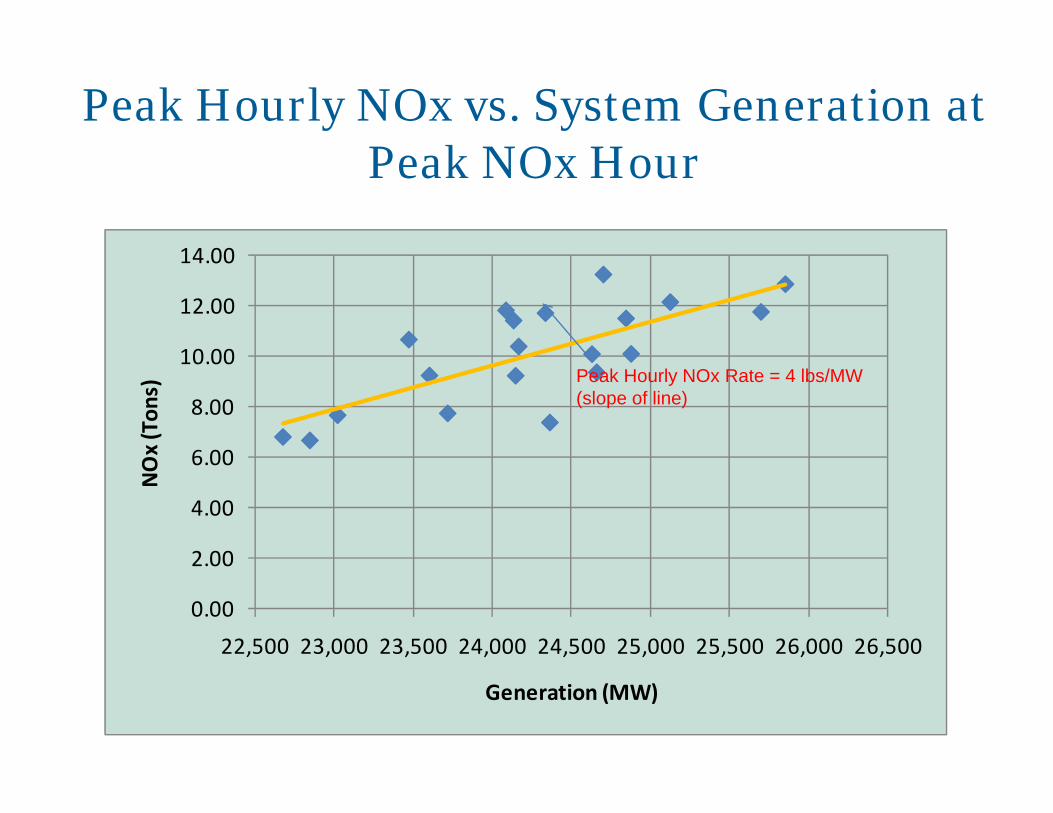
Peak Hourly NOx vs. System Generation at Peak NOx Hour
59
0.00
2.00
4.00
6.00
8.00
10.00
12.00
14.00
22,500 23,000 23,500 24,000 24,500 25,000 25,500 26,000 26,500
NOx (Ton
s)
Generation (MW)
Peak Hourly NOx Rate = 4 lbs/MW (slope of line)
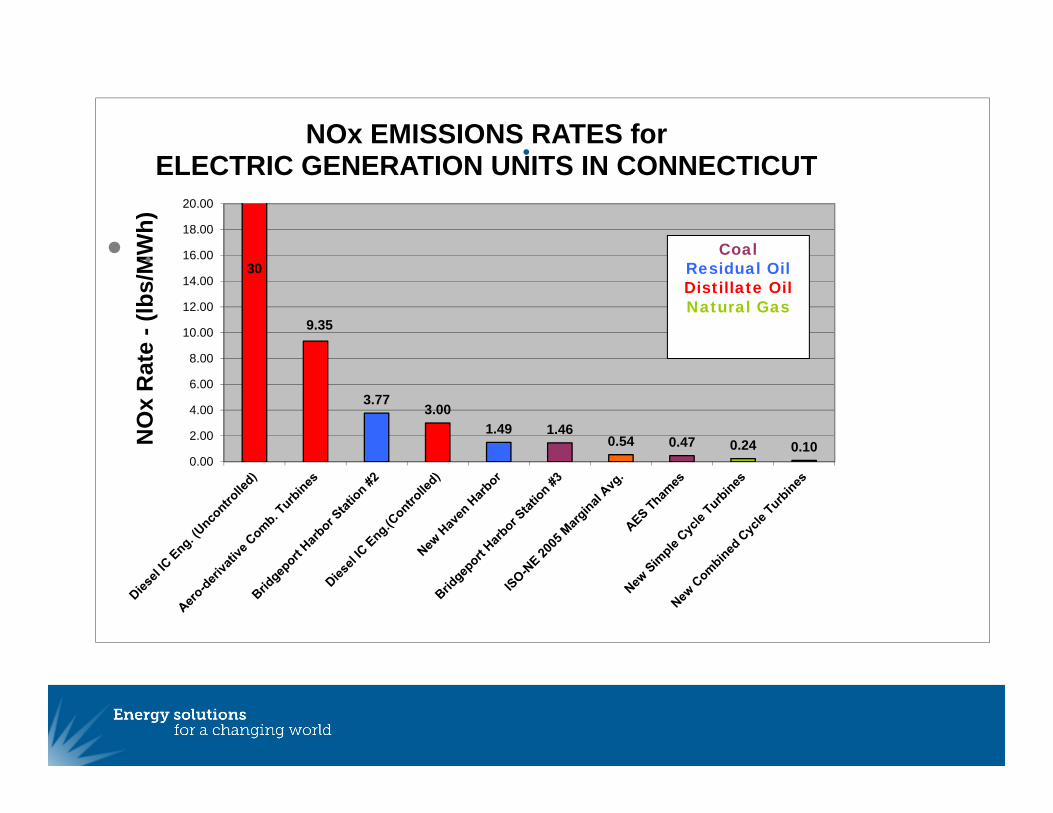
30
9.35
3.773.00
1.49 1.460.54 0.47 0.24 0.10
0.00
2.00
4.00
6.00
8.00
10.00
12.00
14.00
16.00
18.00
20.00
NO
x R
ate
-(lb
s/M
Wh)
NOx EMISSIONS RATES for ELECTRIC GENERATION UNITS IN CONNECTICUT
CoalResidual OilDistillate OilNatural Gas
.
• .
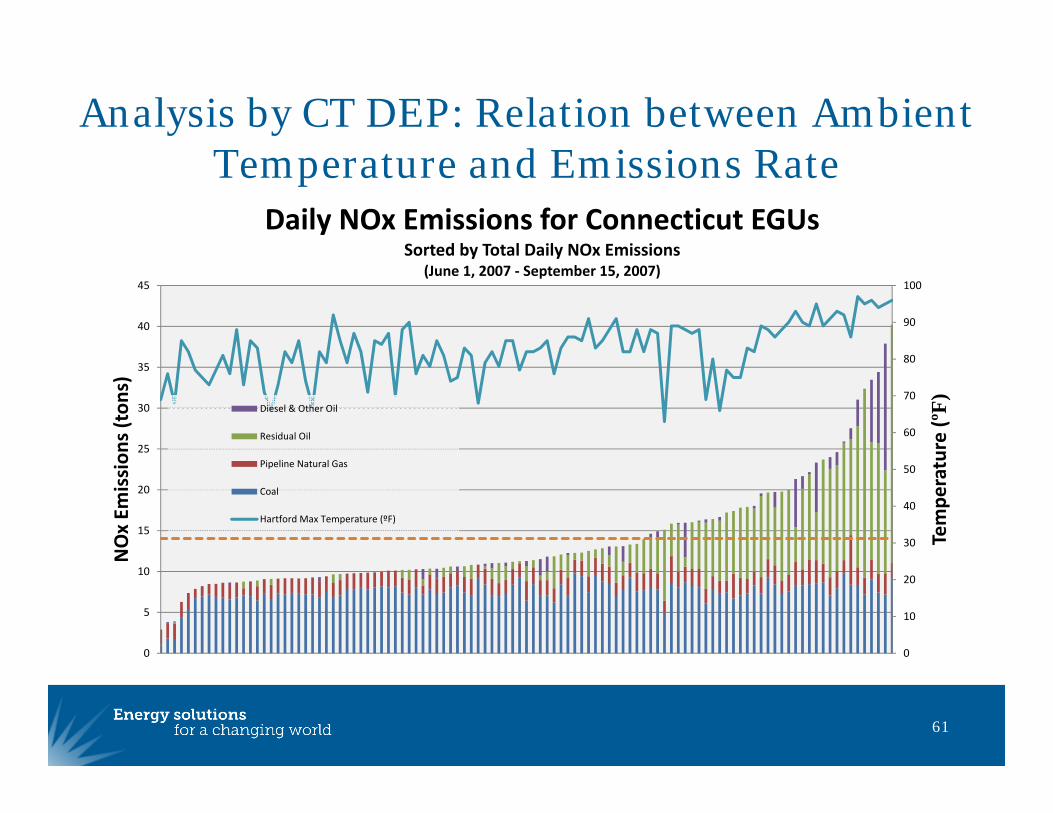
Analysis by CT DEP: Relation between Ambient Temperature and Emissions Rate
61
0
10
20
30
40
50
60
70
80
90
100
0
5
10
15
20
25
30
35
40
45
Tempe
rature (º
F)
NOx Em
ission
s (tons)
Daily NOx Emissions for Connecticut EGUsSorted by Total Daily NOx Emissions
(June 1, 2007 ‐ September 15, 2007)
Diesel & Other Oil
Residual Oil
Pipeline Natural Gas
Coal
Hartford Max Temperature (ºF)
EM&V Definition and Background
• “Evaluation, measurement, and verification” is the process of estimating energy, peak demand, and emissions impacts from energy efficiency (EE) policies, programs, or projects – EM&V for EE programs is a mature field with well-developed methods – Conducted for several decades in nearly all states/municipalities with
significant public investment in EE • With renewable energy, EM&V is used to determine emissions impacts
– RE generation is directly metered • EM&V refers to retrospective analysis
– It does not include forecasting the impacts of future policies, programs, or projects (although EM&V data are used to inform and improve forecasting)
• EM&V issues that air regulators should be aware of include: net vs. gross savings, rebound effect, persistence of savings
62
State Uses for EM&V
• States use EM&V data to help inform and address the following needs: – PUCs need retrospective, timely information to ensure
ratepayer value and cost-effectiveness – Energy system planners need to know how EE policy is likely
to affect the energy system (consistent with resource plans)– Governors need talking points on the multiple benefits
achieved with recent EE/RE investments– DEPs need to know when and where EE/RE is likely to affect air
emissions, and the magnitude of these impacts
63
Air Regulator Uses for EM&V
• Ensuring that EE is a reliable energy resource on par with generation– Criteria of interest include measurable, real, permanent
• Confirming that EE/RE policies have achieved forecasted energy and peak demand impacts
• Quantifying the magnitude of air emissions impacts from past EE/RE activities
• Determining when and where these air emissions impacts occurred, consistent with policy goals – e.g., State implementation plans (SIP), high electric
demand days (HEDD)
64
EM&V and Other Data Needs with SIPs
• Different EM&V procedures and energy/air data may be needed, depending on the pathway selected– Baseline pathway - EPA is estimating future policy impacts;
states need to document and verify the EM&V methods/assumptions to be applied and specify appropriate safeguards
– Control measure pathway - States need to estimate future program/project impacts, document the EM&V procedures to be applied, and specify appropriate safeguards
– Weight of evidence pathway - States need to document how EM&V will be applied to ensure that predicted EE/RE impacts are achieved
65
Roles with EM&V
• DEPs are not typically responsible for evaluating (or forecasting) energy or demand impacts– This is the responsibility of PUCs or other state agencies
• DEPs are responsible for identifying the needed EM&V data, documenting EM&V procedures to be applied, and quantifying the resulting air impacts
• EPA Regions determine whether the methods specified for documenting energy/emissions impacts are appropriate to the pathway selected
• ISOs, EIA, PUCs, and EPA are data sources• Non-profit partners are key to information sharing, training,
facilitation, etc
66
Going Forward
• Getting the right EM&V information requires ongoing collaboration and information sharing with the PUC, ISO, and other appropriate entities– PUC/ISO staff, EM&V experts, and web resources are available to help– Important coordination and facilitation role for non-profit partners
(e.g., NESCAUM, NEEP EM&V Forum)– Numerous case studies exist
• Many years of EE program investment and EM&V in nearly all N.E. states, many mid-Atlantic states
• Several examples of including EE/RE in past SIPS • ISO-NE Forward Capacity Market captures impacts of future EE
activity based on an agreed-upon EM&V approach• More discussion is needed between EPA HQ, EPA regions, states, and
supporting organizations to identify and resolve key EM&V issues
67
Planning, Evaluation (EM&V), and Reporting of EE in New England
• Decades of experience with planning, EM&V, reporting of EE in New England
• Systematic process, regulatory framework• State, public utility commission, utility,
and industry sharing and collaboration• Regulatory review and stakeholder review• Public EM&V and annual reports, and
published conference proceedings
68
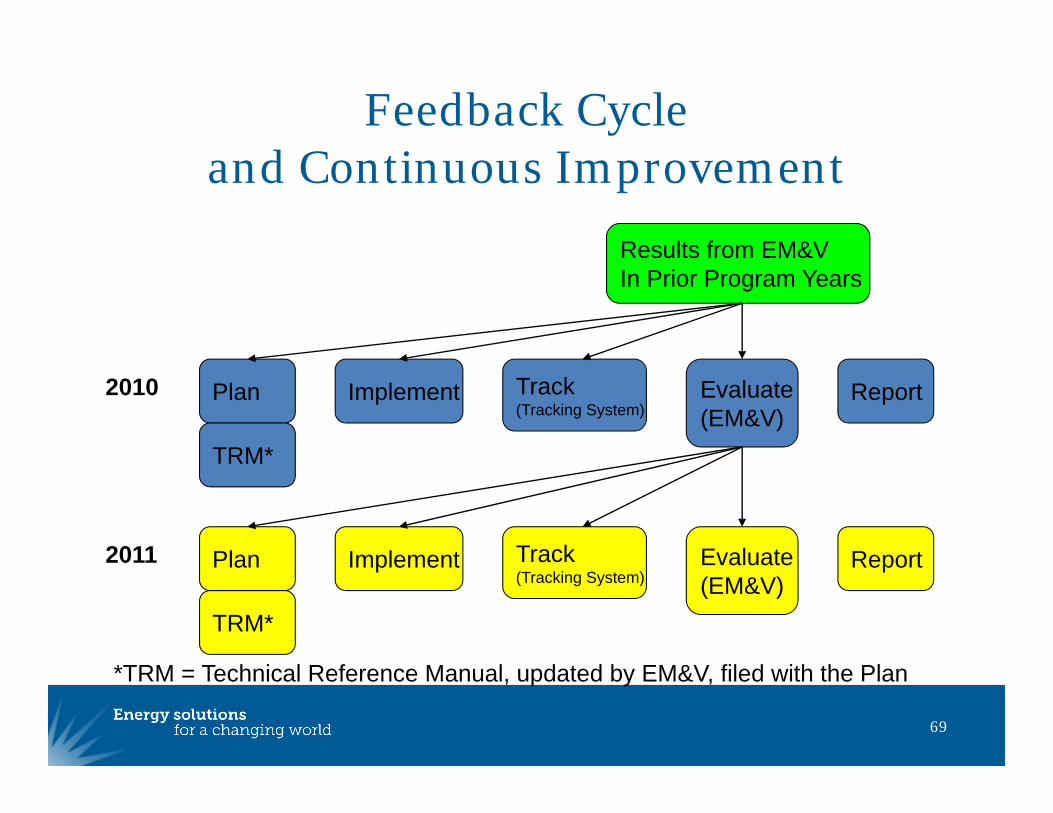
Feedback Cycle and Continuous Improvement
69
Plan Implement Track (Tracking System)
Evaluate(EM&V)
Report
Results from EM&V In Prior Program Years
Plan Implement Track (Tracking System)
Evaluate(EM&V)
Report
TRM*
TRM*
2010
2011
*TRM = Technical Reference Manual, updated by EM&V, filed with the Plan
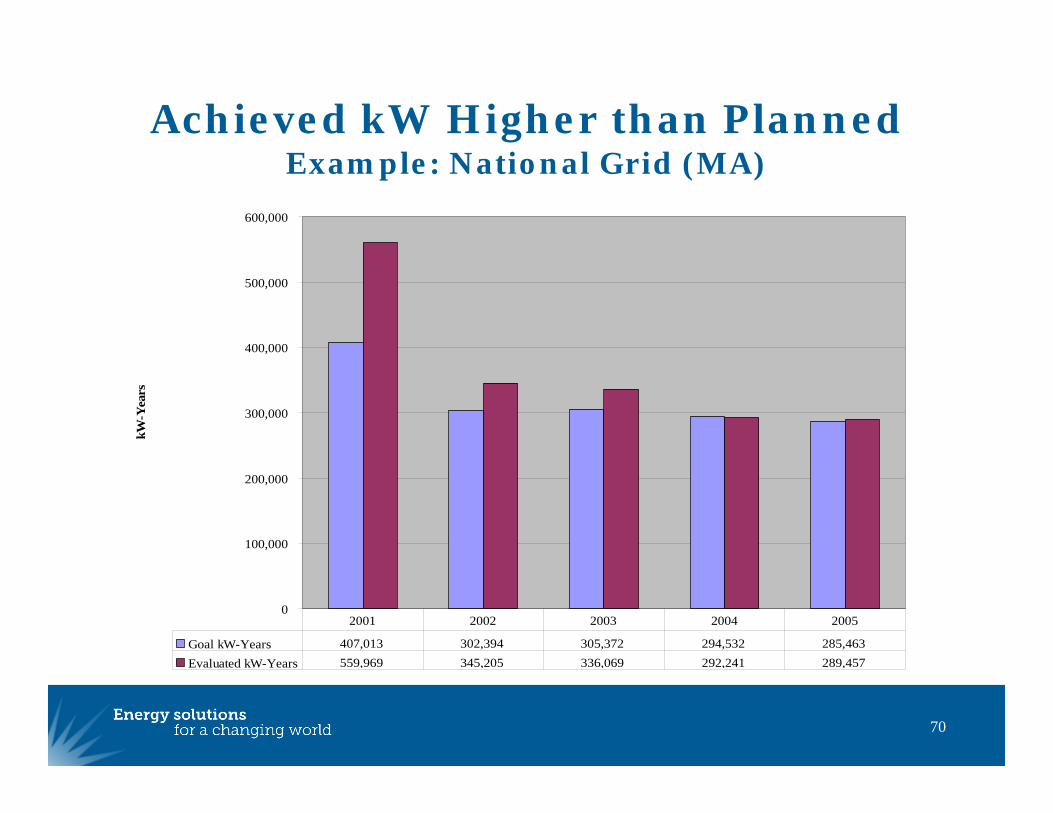
0
100,000
200,000
300,000
400,000
500,000
600,000
kW-Y
ears
Goal kW-Years 407,013 302,394 305,372 294,532 285,463 Evaluated kW-Years 559,969 345,205 336,069 292,241 289,457
2001 2002 2003 2004 2005
Achieved kW Higher than PlannedExample: National Grid (MA)
70

Topic Five: 215-245pm
• Data sources– Who has them and where to get them
71
Where Are the Data and Who Has Them?
• PSC: load forecast may be different from those used by EPA, EIA
• PSC: may require IRP or dispatch modeling– Air regulators can provide input, request
adjustments to reference/base case– Check and verify assumptions used
72
Types of Data Available
• ISO-NE “CELT Report”– “capacity, energy, loads and transmission”– 10 year forecast with planning assumptions
• PJM Market Monitoring Report– Annually, independent review by 3rd party
• Load duration curves• RTO filings to FERC
– Twice per year• IRP• Local government EE ordinances/policies
– More stringent building codes– ICLEI members with GHG goals
73
Other Data Sources
• Regional transmission organizations• State energy offices and Governor level
policy offices• How much engagement have you had with
these agencies? Or other examples?
74
Topic Six: 3-4pm
• Putting the Pieces Together: Developing control measures for SIPs and other AQ planning needs
75
Business-As-Usual Isn’t Sustainable
• More pollutants of concern, sources to regulate, standards to attain…
• Less budget, staff, institutional capacity, time…
• Increasing complexity, cumulative impacts, cost pressures, competitiveness concerns…
• To be achieved through traditional pollutant-by-pollutant approaches, by traditionally stovepipedagencies?
• Not likely; something has to “give”
Some Signs of Change are Evident
• Rare opportunity with NARUC / PUCs (2011 Winter Resolutions):– Concerned: EPA’s multiple regs “could pose significant compliance challenges”– “Get it” about multi-pollutants: “Addressing multiple regulatory requirements at
the same time may reduce costs and minimize risk”– Ready to engage: PUC-DEP cooperation “can promote the quality and
effectiveness of utility regulation”
• Precedent in the Bay Area’s 2010 Clean Air Plan:– Legal impetus: Update ozone attainment plan– But also nonattainment for PM2.5 & SIPs due by 12/2012– And fed/state obligations re toxics & GHGs, so– Adopted its first integrated & comprehensive multi-pollutant AQ plan– 55 control measures across sectors seek to maximize co-bencfits & “tackle the
root causes by pursuing greater efficiency in all sectors of our society & economy”
77
A Better Option: “Do It Once”
• Any SIP is labor-intensive, so let’s “do it once” optimally
• What benefits can EE and RE provide for:– Ozone and fine particle NAAQS– Transport Rules I and II– Industrial boiler and utility MACT– State GHG reduction goals– And non-air quality benefits: cooling water
discharge, combustion byproducts, land, etc.
78
Decisions by Air Regulators Effect the Energy Sector
• What emission reduction measures will be implemented to comply with ozone and fine particulate air quality standards?
• Market-based vs. command and control
• Where is the point of regulation?– Meaning: not only what is being regulated, but at what point in
the process are regulation applied: end-of-pipe, upstream, and
– How does the point subject to regulation influence what resources will satisfy current and future demand?
Air Pollution Control Measures Adopted Can Affect Energy Cost
• Unit level end-of-pipe: how will costs be recovered? If unit operating costs increase, how will these costs affect what units are dispatched?
• Are alternatives such as increased energy efficiency a compliance option for some units?
• How could air and energy regulators work together to implement such concepts?
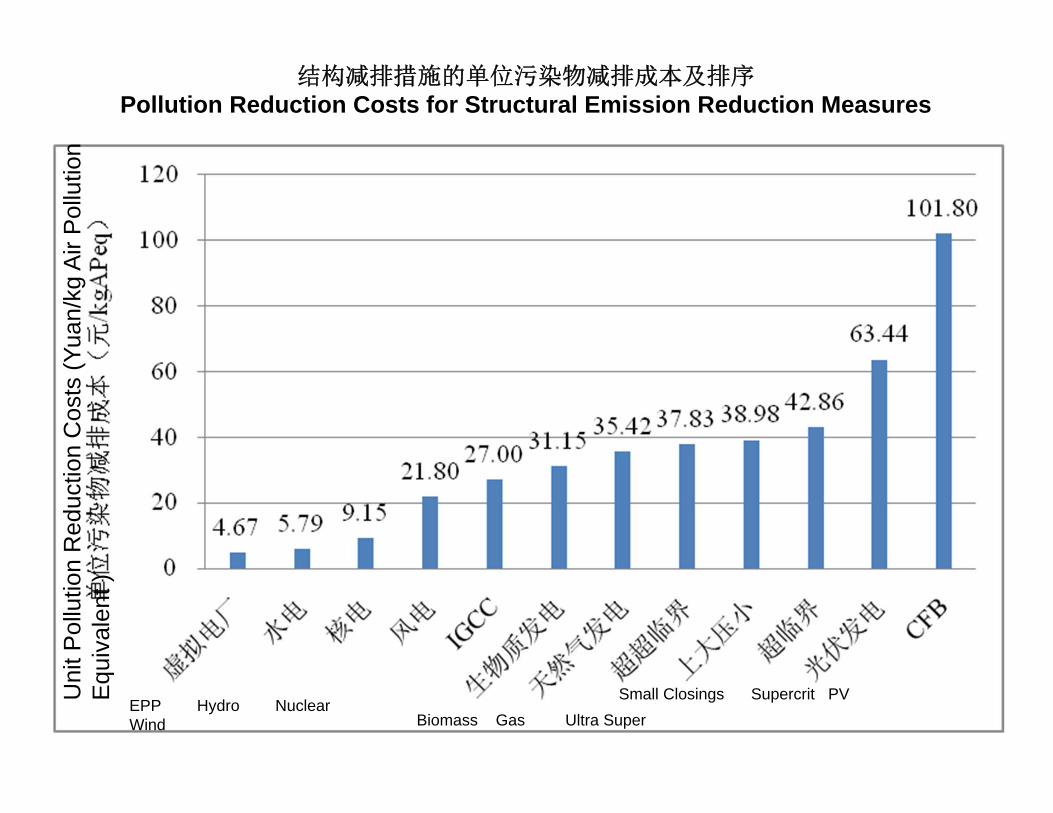
结构减排措施的单位污染物减排成本及排序Pollution Reduction Costs for Structural Emission Reduction Measures
EPP Hydro Nuclear Wind Biomass Gas Ultra Super
Small Closings Supercrit PV Uni
t Pol
lutio
n R
educ
tion
Cos
ts (Y
uan/
kg A
ir P
ollu
tion
Equ
ival
ent )
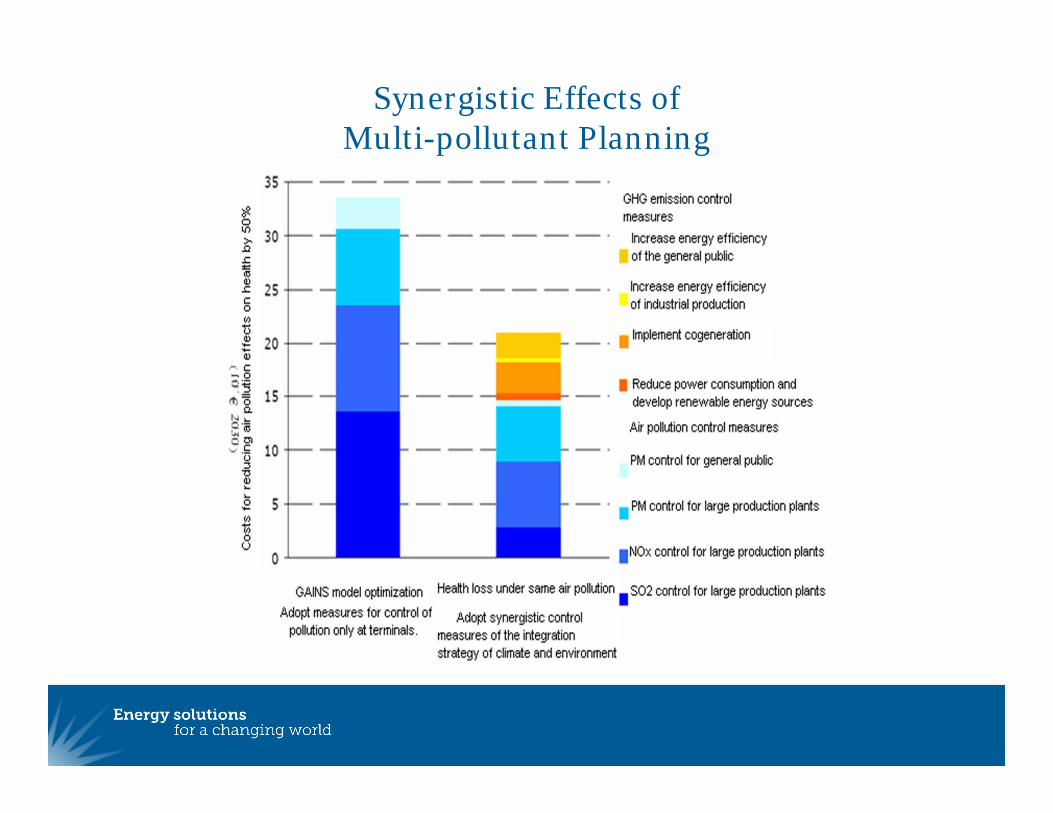
Synergistic Effects ofMulti-pollutant Planning
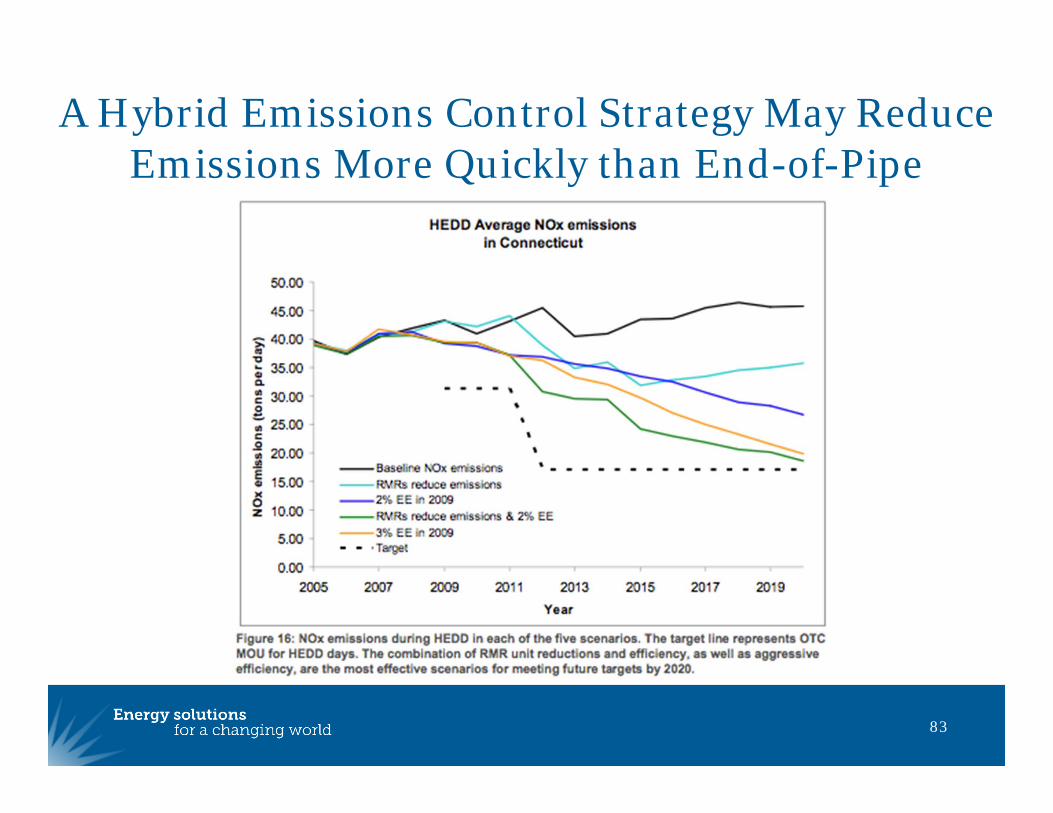
A Hybrid Emissions Control Strategy May Reduce Emissions More Quickly than End-of-Pipe
83
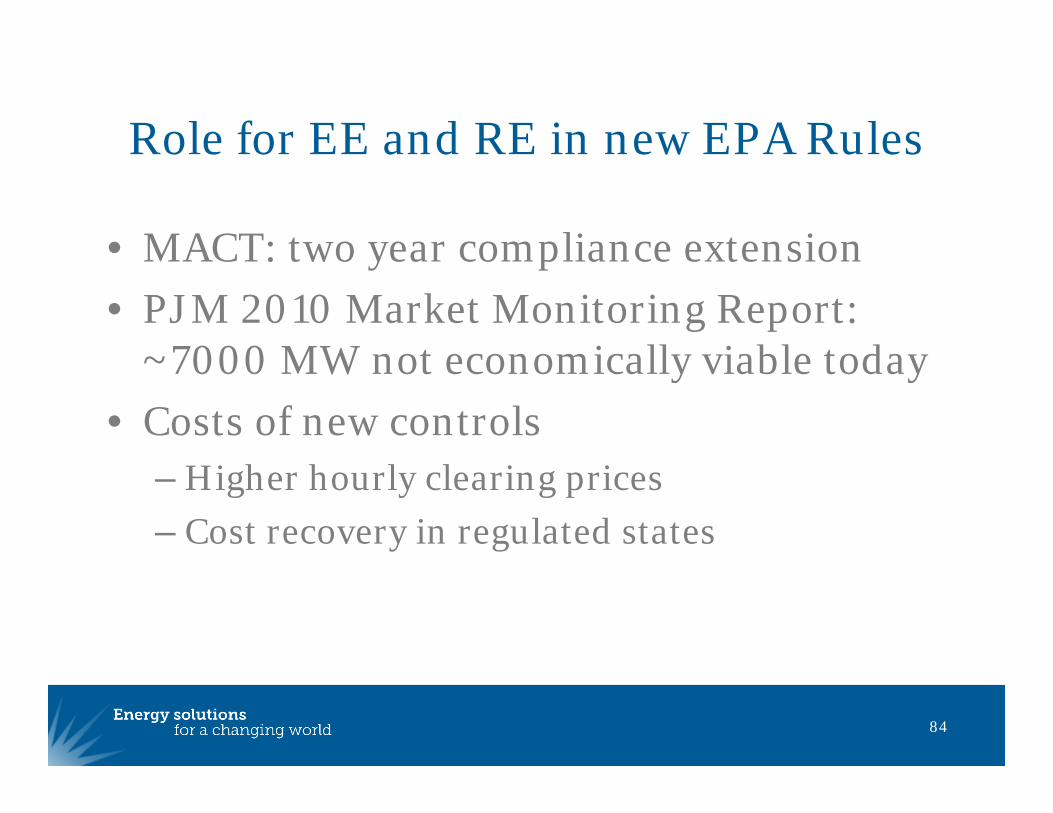
Role for EE and RE in new EPA Rules
• MACT: two year compliance extension• PJM 2010 Market Monitoring Report:
~7000 MW not economically viable today• Costs of new controls
– Higher hourly clearing prices– Cost recovery in regulated states
84
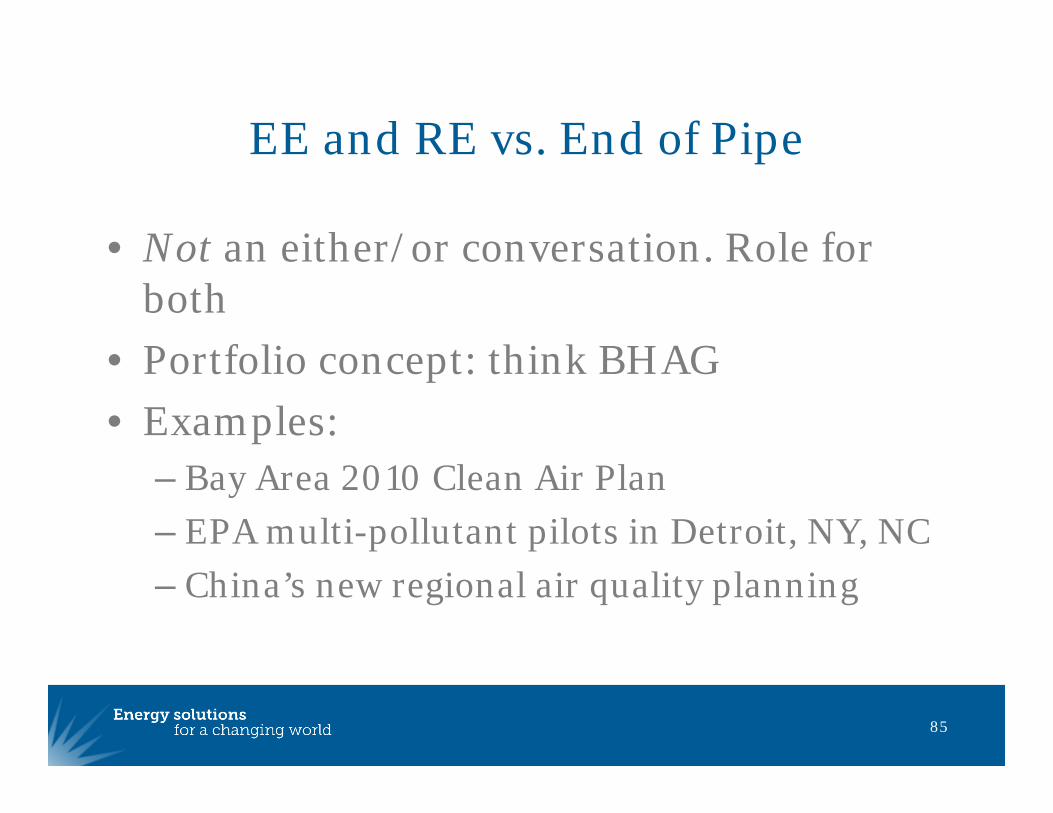
EE and RE vs. End of Pipe
• Not an either/or conversation. Role for both
• Portfolio concept: think BHAG• Examples:
– Bay Area 2010 Clean Air Plan– EPA multi-pollutant pilots in Detroit, NY, NC– China’s new regional air quality planning
85
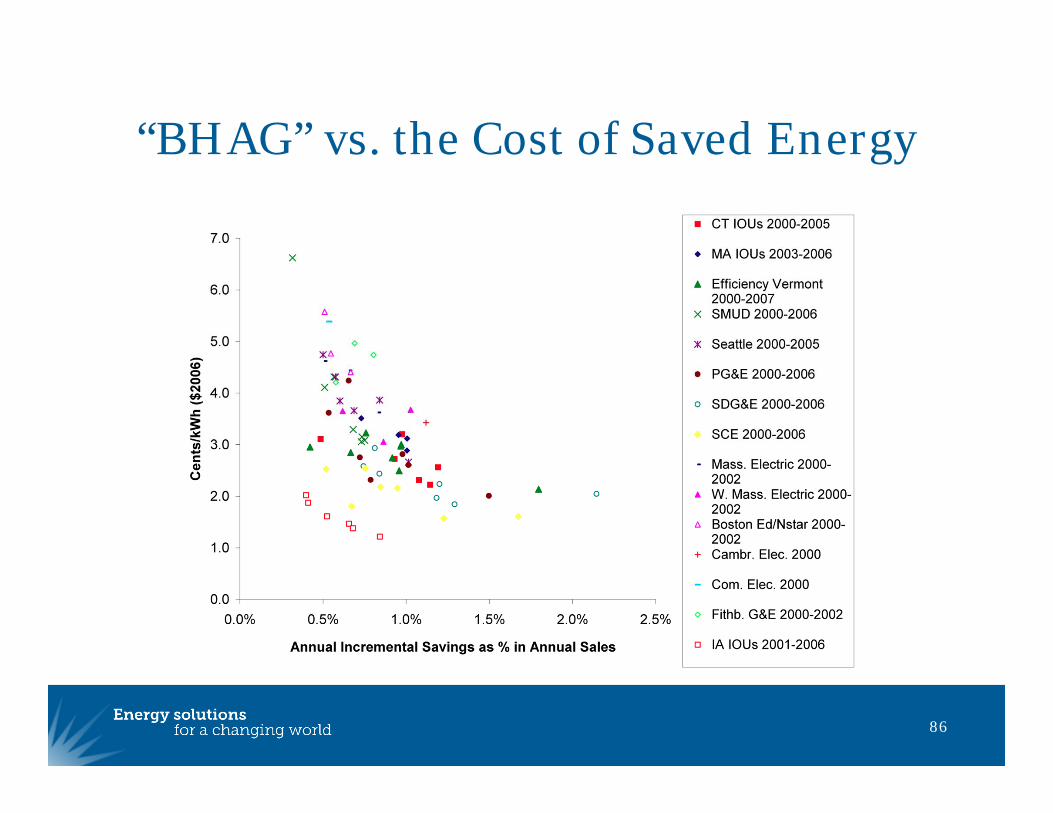
“BHAG” vs. the Cost of Saved Energy
86
Next Steps: Summing Up
• Does the state want to include EE/RE benefits in SIPs?
• What other air planning activities might incorporate EE?
• What do states need to move forward?• Which of the four EPA paths to take?
– Engage EPA regional office early and often
87
Next Steps -2
• Status of energy savings data, precision, EM&V– Will DEP rely on PSC for audit/enforcement?
• Focus on portfolio first, then subtract measures or programs whose results do not meet EPA SIP criteria
• PSC’s evaluation should be same as that required by EPA
88

Next Steps-3
• What advice, input do you have for us?– What could we improve?– What topics would you like to see covered in
more detail?– What can we do next to help you?
89
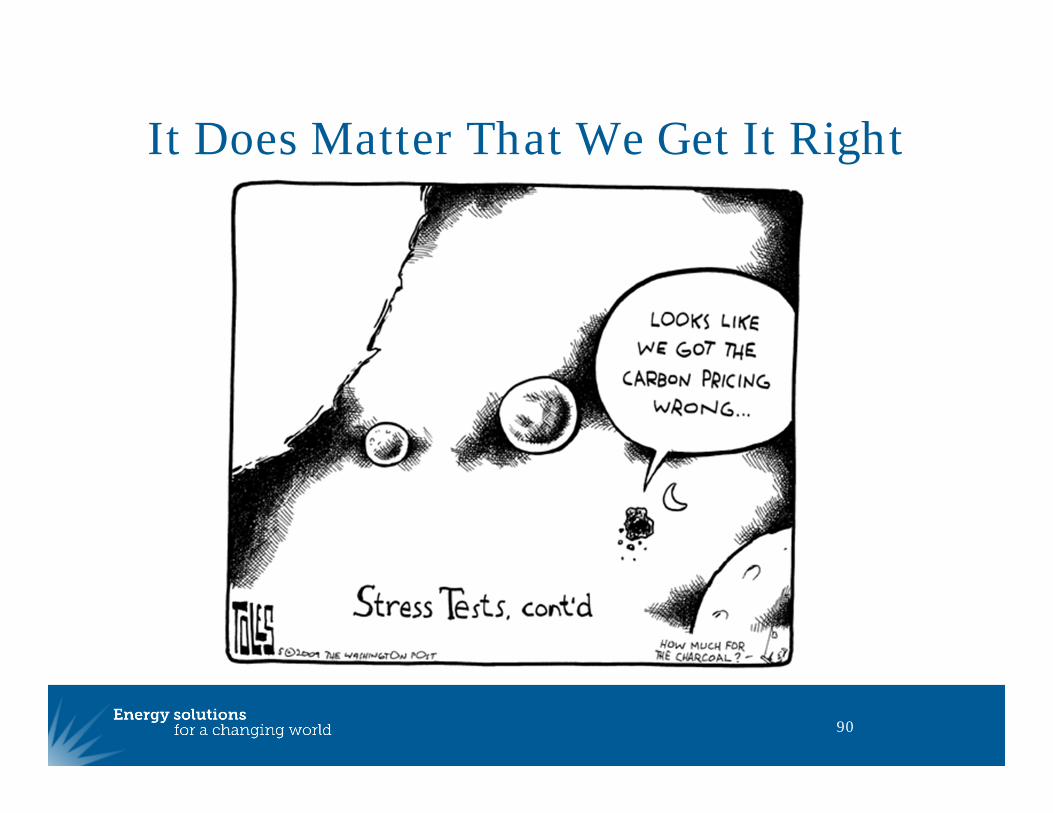
It Does Matter That We Get It Right
90
About RAP
The Regulatory Assistance Project (RAP) is a global, non-profit team of experts that focuses on the long-term economic and environmental sustainability of the power and natural gas sectors. RAP has deep expertise in regulatory and market policies that:
Promote economic efficiency Protect the environment Ensure system reliability Allocate system benefits fairly among all consumers
Learn more about RAP at www.raponline.org
Chris James, Ken Colburn, John [email protected], [email protected] , [email protected]
617-861-7684 (Pacific time), 617-784-6975 (Eastern), 802-595-1669 (Mountain)