Embed Size (px)
Citation preview
New Jersey DEPNew Jersey DEP
High Electric High Electric
Demand DaysDemand Days
&&
Air QualityAir Quality
Chris SalmiChris Salmi
New Jersey DEPNew Jersey DEP
June 6, 2006June 6, 2006
2
Three Points!Three Points!
•• EmissionsEmissions from Electricfrom Electric
Generating Units (EGUs) areGenerating Units (EGUs) are
higher on high electric demandhigher on high electric demand
daysdays
•• This results inThis results in poorer air qualitypoorer air quality
•• It will take aIt will take a variety of solutions variety of solutions toto
address this issueaddress this issue
3
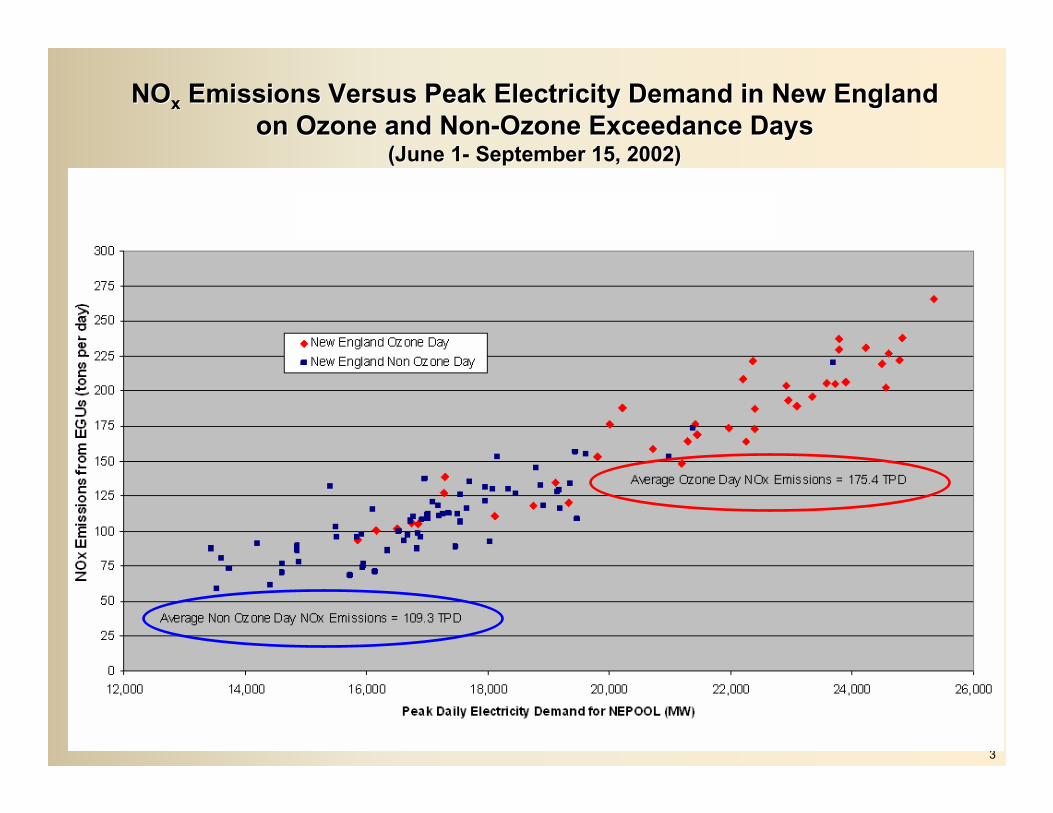
NONOxx Emissions Versus Peak Electricity Demand in New EnglandEmissions Versus Peak Electricity Demand in New England
on Ozone and Nonon Ozone and Non--OzoneOzone ExceedanceExceedance DaysDays(June 1(June 1-- September 15, 2002)September 15, 2002)
4
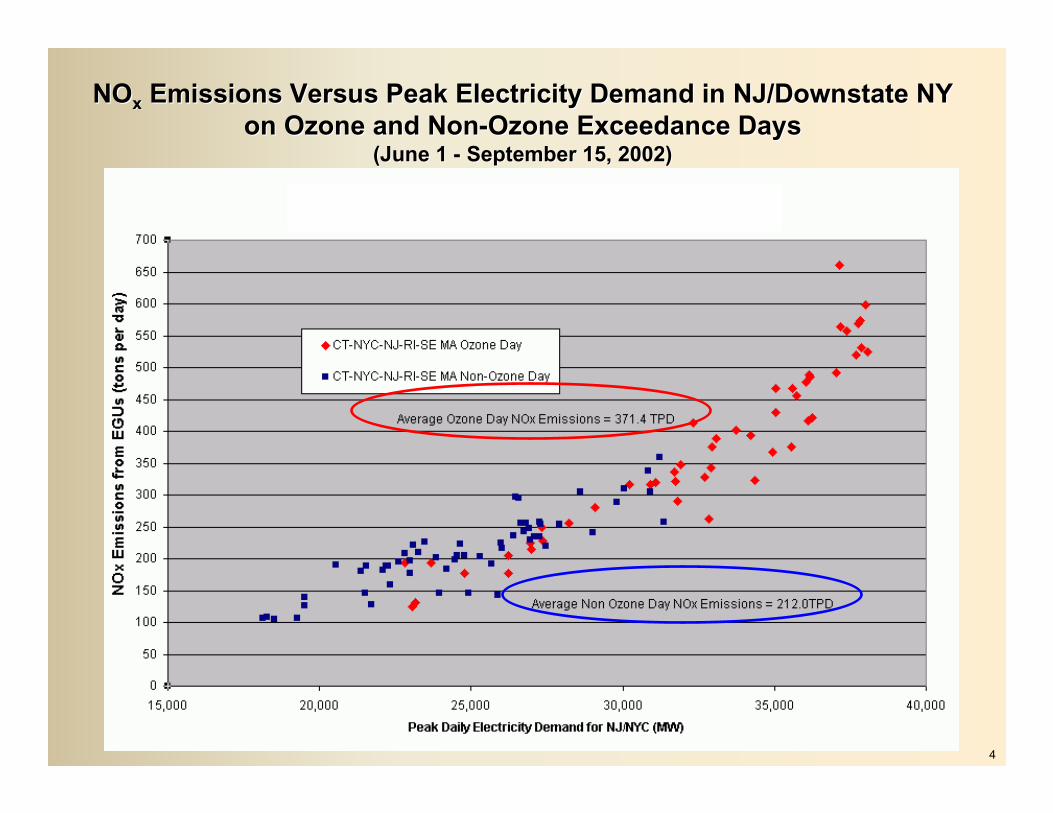
NONOxx Emissions Versus Peak Electricity Demand in NJ/Downstate NYEmissions Versus Peak Electricity Demand in NJ/Downstate NY
on Ozone and Nonon Ozone and Non--OzoneOzone ExceedanceExceedance DaysDays(June 1 (June 1 -- September 15, 2002)September 15, 2002)
5
The Mix of Generating The Mix of Generating
Units varies Units varies
by day and regionby day and region
6
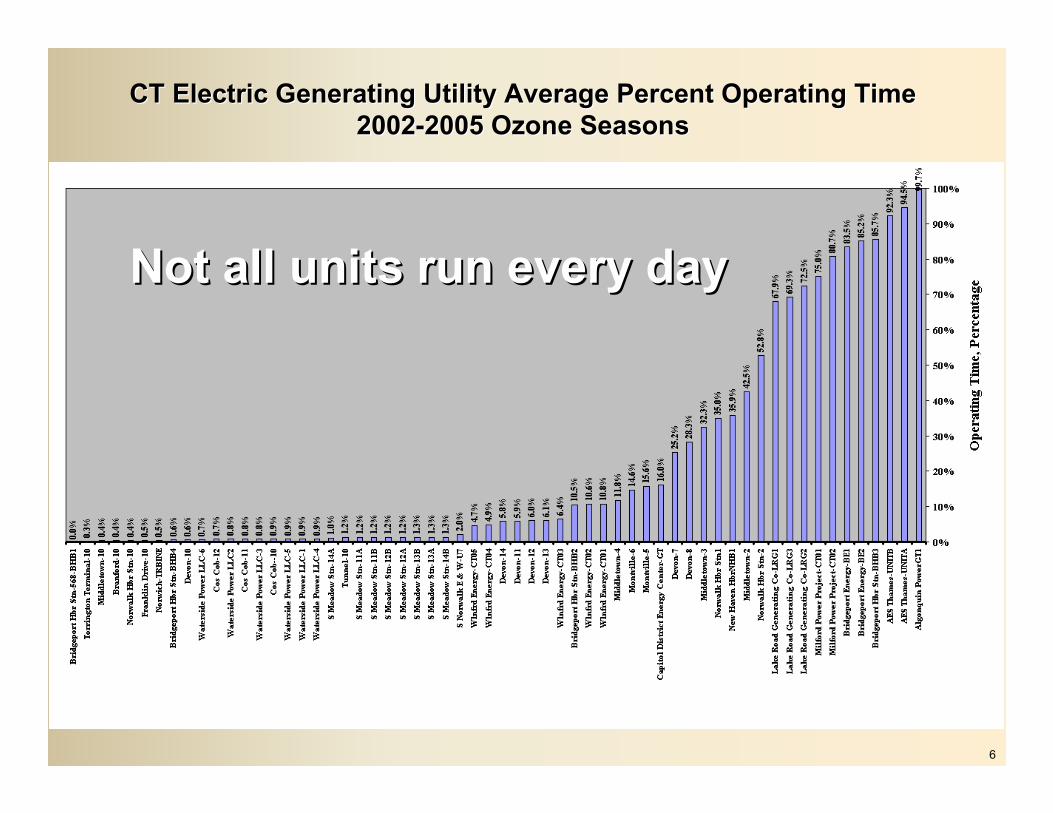
CT Electric Generating Utility Average Percent Operating TimeCT Electric Generating Utility Average Percent Operating Time
20022002--2005 Ozone Seasons2005 Ozone Seasons
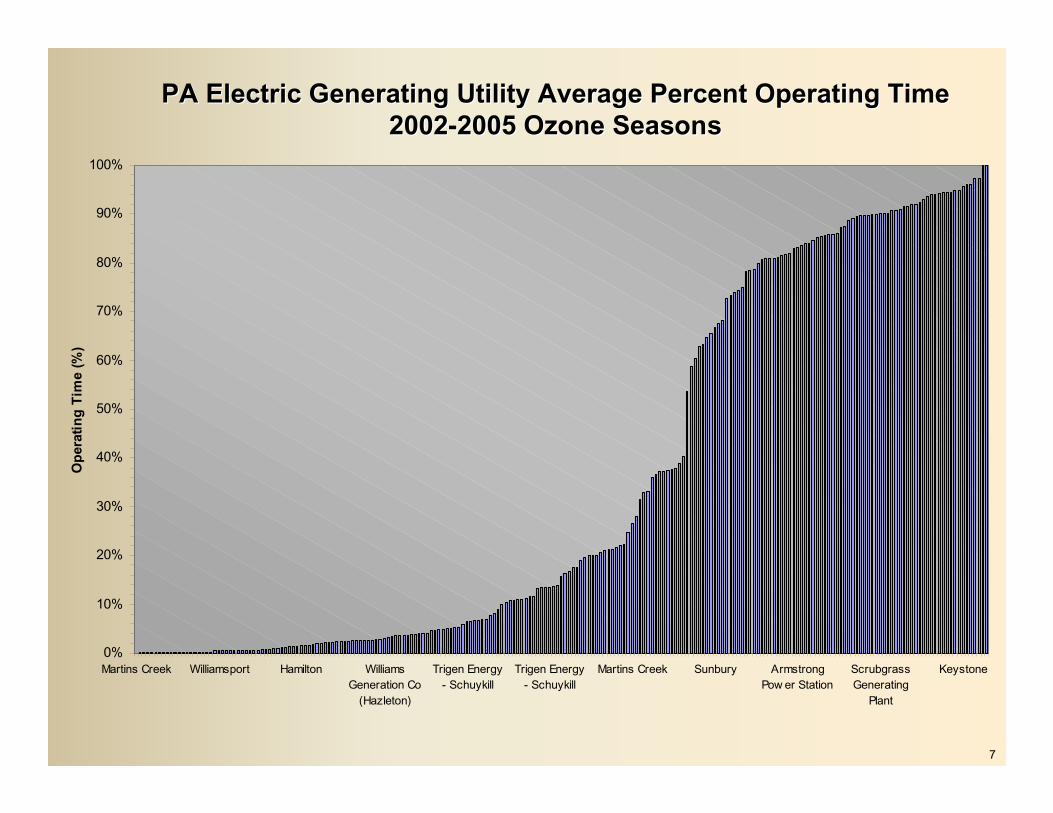
Not all units run every dayNot all units run every day
7
0%
10%
20%
30%
40%
50%
60%
70%
80%
90%
100%
Martins Creek Williamsport Hamilton Williams
Generation Co
(Hazleton)
Trigen Energy
- Schuykill
Trigen Energy
- Schuykill
Martins Creek Sunbury Armstrong
Pow er Station
Scrubgrass
Generating
Plant
Keystone
Op
era
tin
g T
ime
(%)
PA Electric Generating Utility Average Percent Operating TimePA Electric Generating Utility Average Percent Operating Time
20022002--2005 Ozone Seasons2005 Ozone Seasons
8
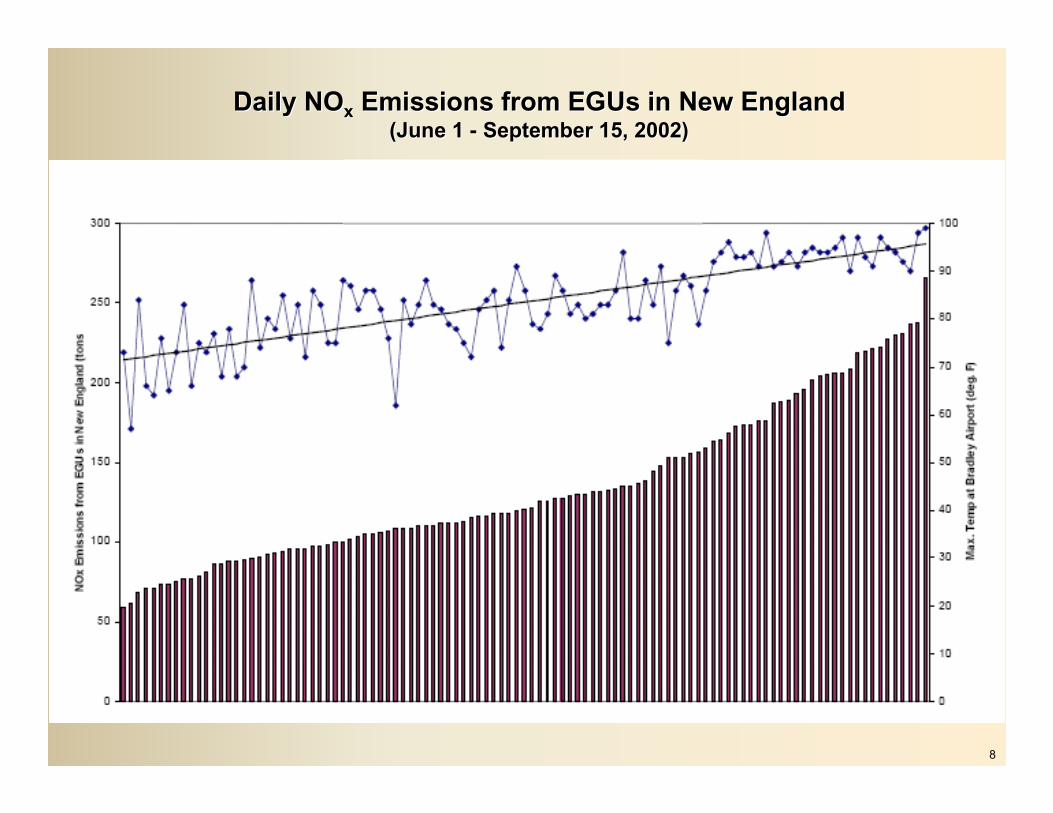
Daily NODaily NOxx Emissions from EGUs in New EnglandEmissions from EGUs in New England(June 1 (June 1 -- September 15, 2002)September 15, 2002)
Electric Generating Units Do Not
Run on All Days
9
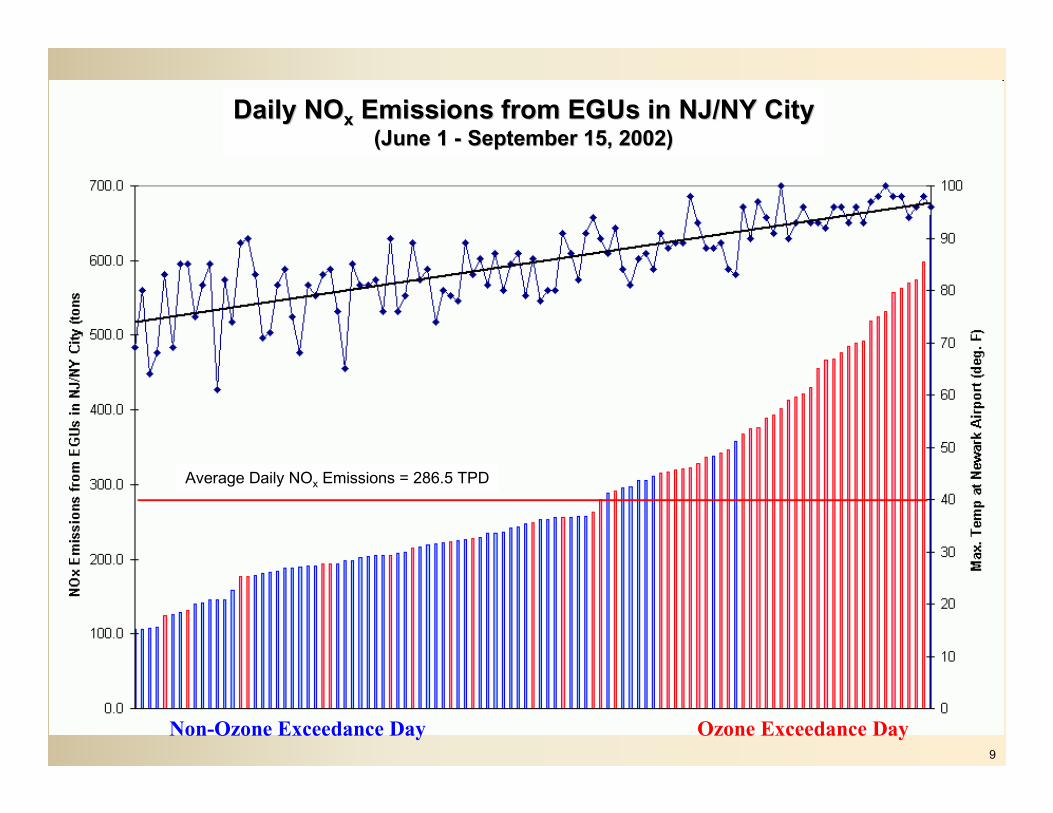
Non-Ozone Exceedance Day Ozone Exceedance Day
Daily NODaily NOxx Emissions from EGUs in NJ/NY CityEmissions from EGUs in NJ/NY City(June 1 (June 1 -- September 15, 2002)September 15, 2002)
Average Daily NOx Emissions = 286.5 TPD
10
NO
xE
mis
sio
n f
rom
New
En
gla
nd
EG
Us (
ton
s)
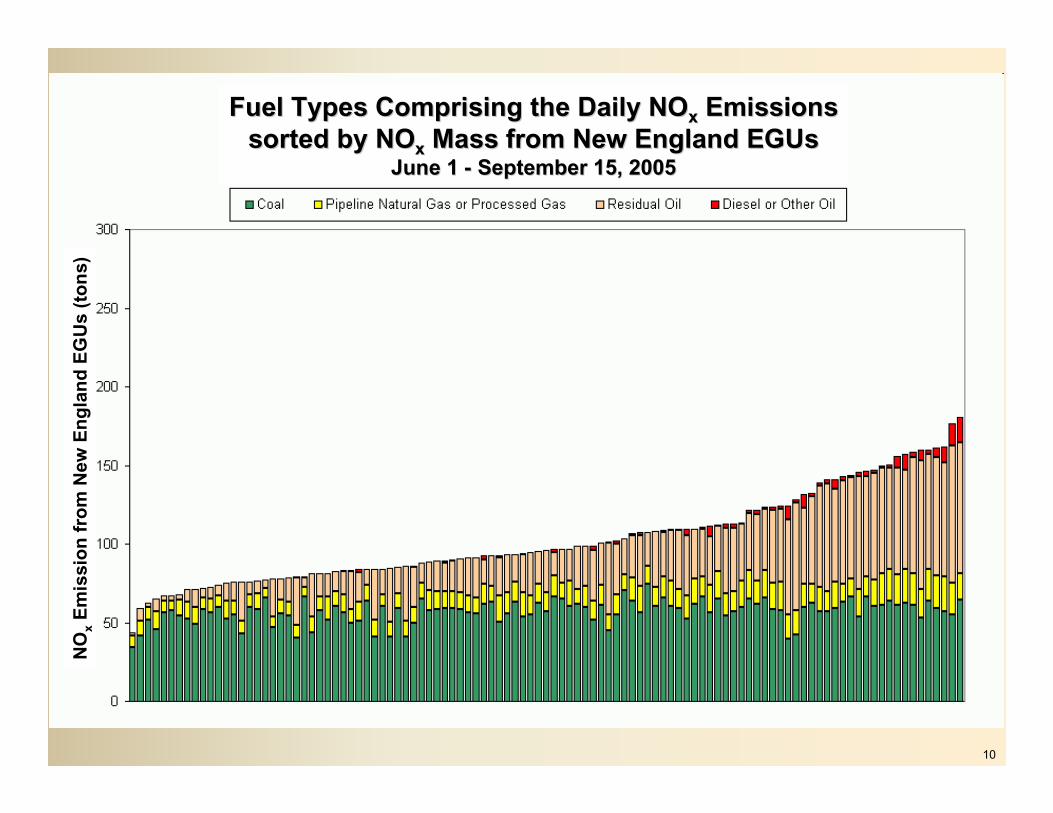
Fuel Types Comprising the Daily NOFuel Types Comprising the Daily NOxx EmissionsEmissions
sorted by NOsorted by NOxx Mass from New England EGUsMass from New England EGUsJune 1 June 1 -- September 15, 2005September 15, 2005
11
NO
xE
mis
sio
n f
rom
Nj/
NY
EG
Us
(to
ns)
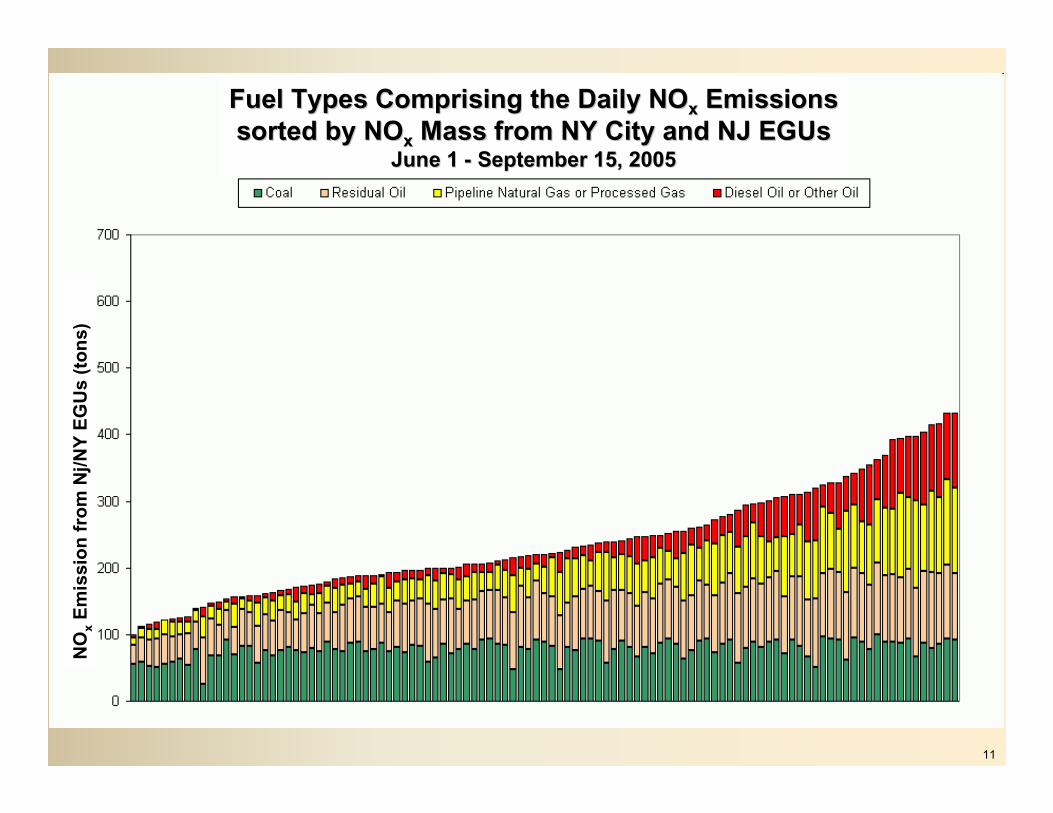
Fuel Types Comprising the Daily NOFuel Types Comprising the Daily NOxx EmissionsEmissions
sorted by NOsorted by NOxx Mass from NY City and NJ EGUsMass from NY City and NJ EGUsJune 1 June 1 -- September 15, 2005September 15, 2005
12
Understanding theUnderstanding the
Air Quality implicationsAir Quality implications
13
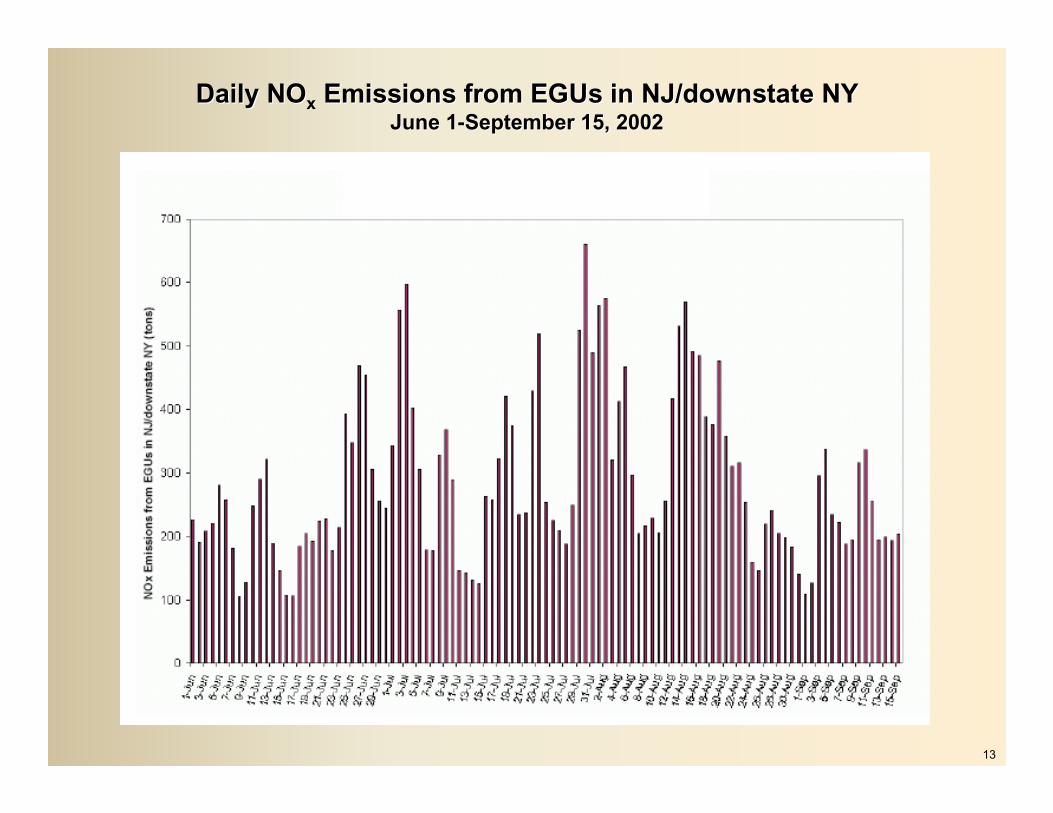
Daily NODaily NOxx Emissions from EGUs in NJ/downstate NYEmissions from EGUs in NJ/downstate NYJune 1June 1--September 15, 2002September 15, 2002
Existing Attainment Modeling
Does Not Capture the Increased
Emissions
14
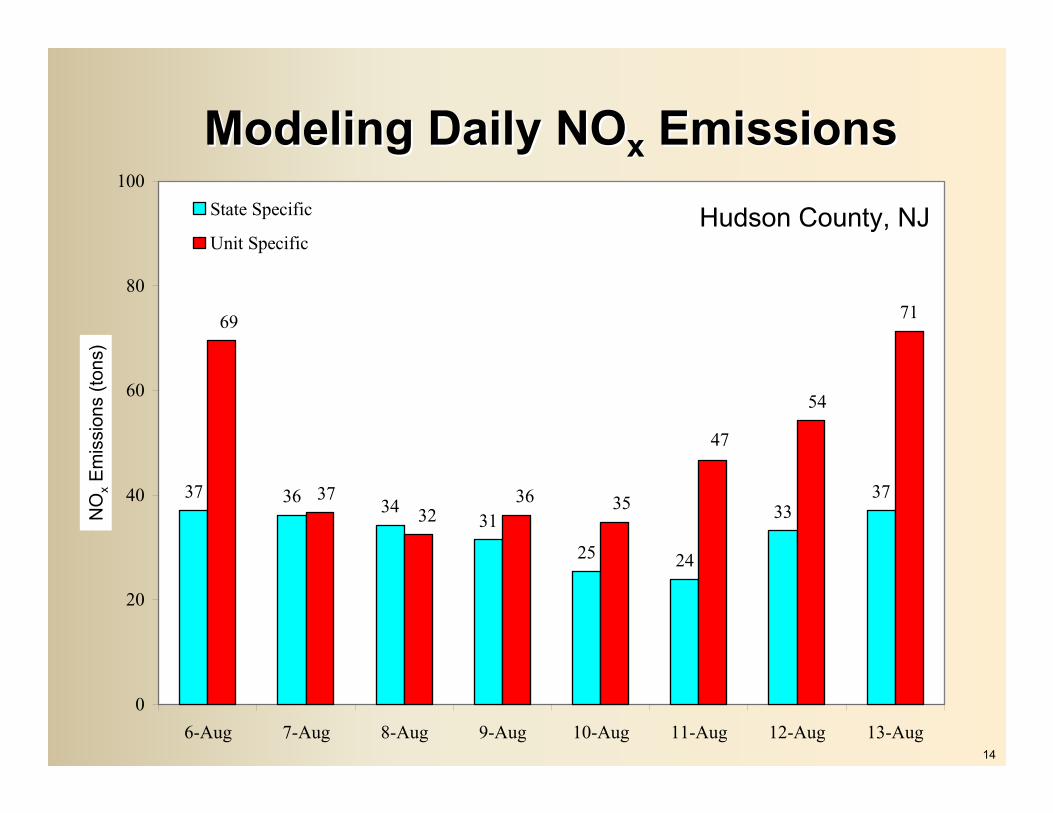
Modeling Daily NOModeling Daily NOxx EmissionsEmissions
37 3634
31
25 24
3337
71
47
54
69
373536
32
0
20
40
60
80
100
6-Aug 7-Aug 8-Aug 9-Aug 10-Aug 11-Aug 12-Aug 13-Aug
NO
X E
mis
sio
ns
(To
ns)
State Specific
Unit Specific
Hudson County, NJ
NO
xE
mis
sio
ns (
tons)
15
EGU Emission Reductions EGU Emission Reductions
on High Electric Demand on High Electric Demand
Days appears to lead to Days appears to lead to
improved air qualityimproved air quality
16
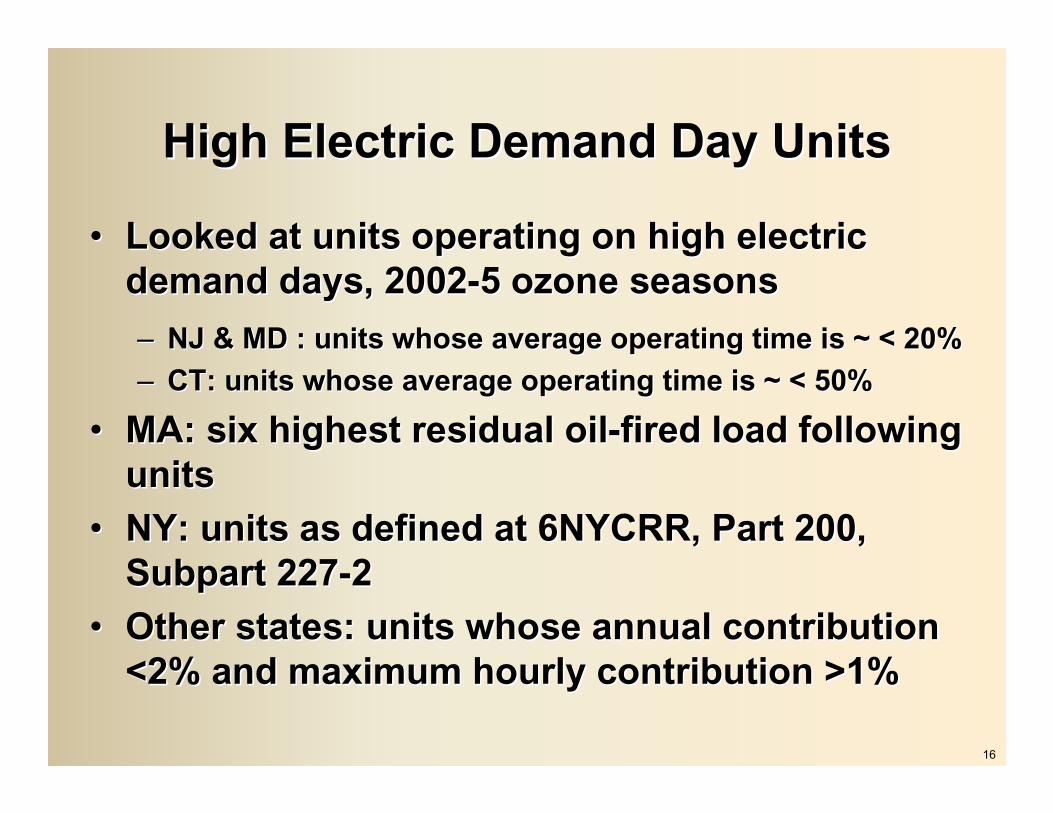
High Electric Demand Day UnitsHigh Electric Demand Day Units
•• Looked at units operating on high electric Looked at units operating on high electric
demand days, 2002demand days, 2002--5 ozone seasons5 ozone seasons
–– NJ & MD : units whose average operating time is ~ < 20%NJ & MD : units whose average operating time is ~ < 20%
–– CT: units whose average operating time is ~ < 50%CT: units whose average operating time is ~ < 50%
•• MA: six highest residual oilMA: six highest residual oil--fired load following fired load following
unitsunits
•• NY: units as defined at 6NYCRR, Part 200, NY: units as defined at 6NYCRR, Part 200,
Subpart 227Subpart 227--22
•• Other states: units whose annual contribution Other states: units whose annual contribution
<2% and maximum hourly contribution >1%<2% and maximum hourly contribution >1%
17
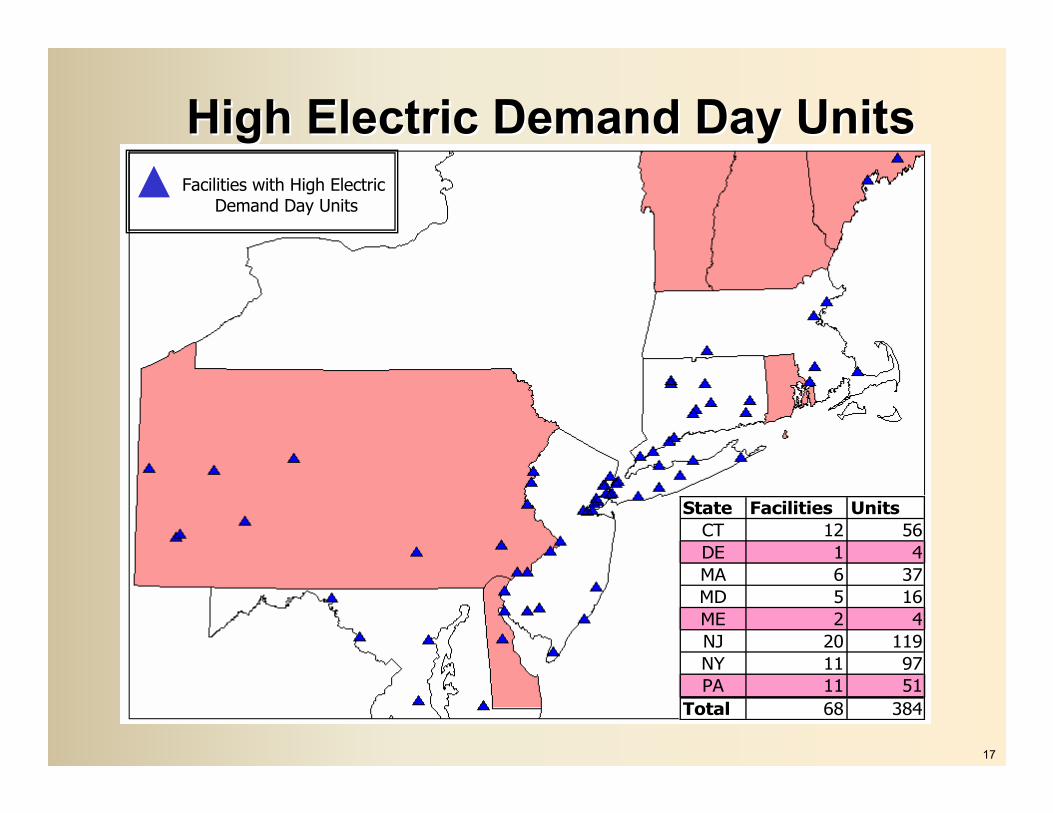
High Electric Demand Day UnitsHigh Electric Demand Day Units
State Facilities Units
CT 12 56
DE 1 4
MA 6 37
MD 5 16
ME 2 4
NJ 20 119
NY 11 97
PA 11 51
Total 68 384
Facilities with High Electric Demand Day Units
18
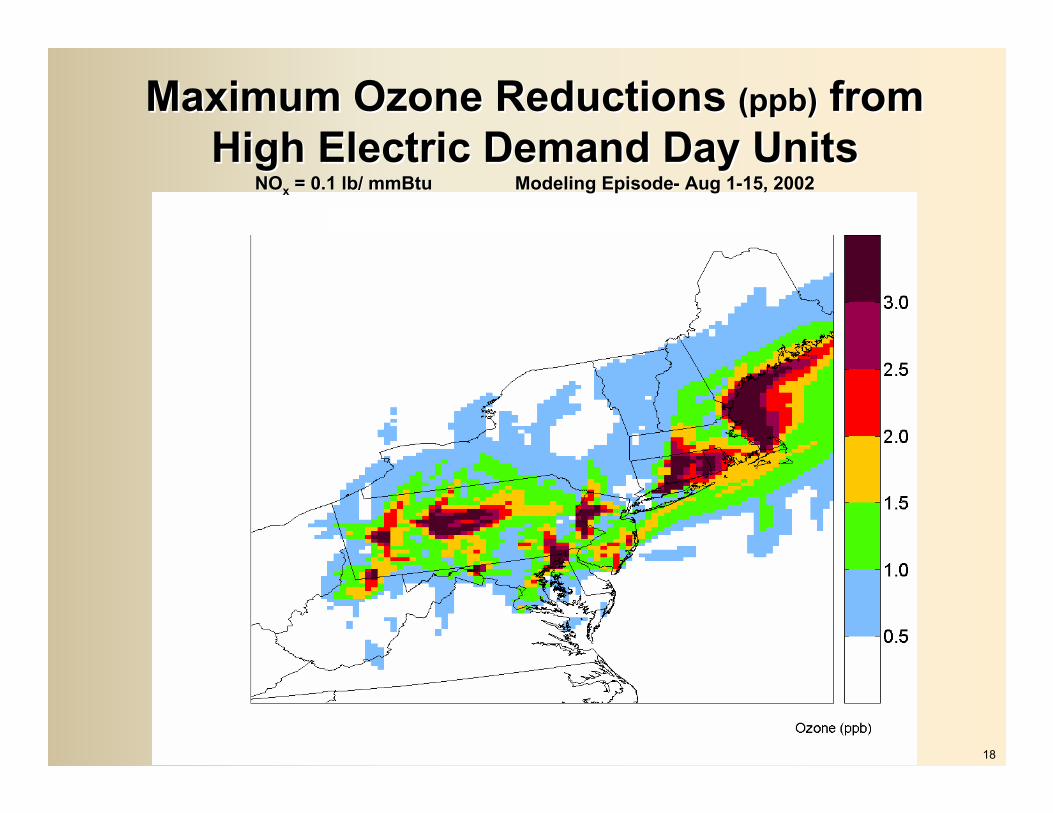
Maximum Ozone Reductions Maximum Ozone Reductions (ppb)(ppb) fromfrom
High Electric Demand Day UnitsHigh Electric Demand Day UnitsNONO
xx = 0.1 lb/ mmBtu Modeling Episode= 0.1 lb/ mmBtu Modeling Episode-- Aug 1Aug 1--15, 200215, 2002
19
Existing Cap & Trade Program Existing Cap & Trade Program
has been insufficient to has been insufficient to
address this issueaddress this issue
20
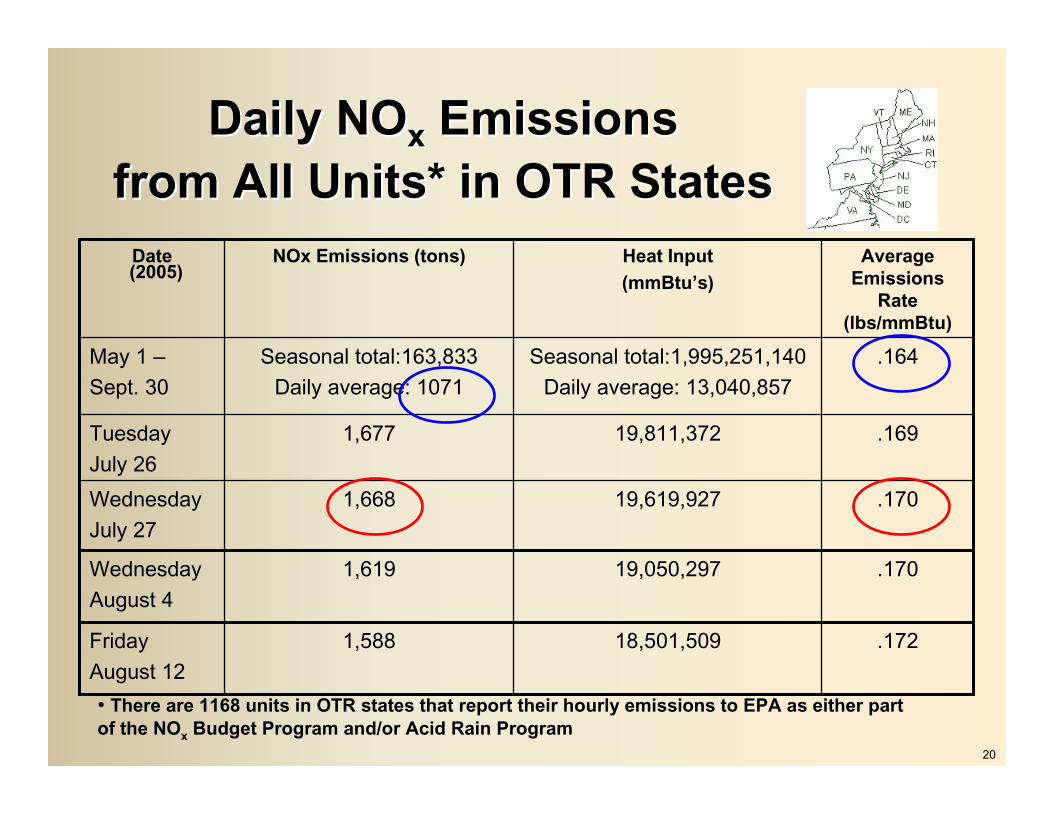
Daily NODaily NOxx EmissionsEmissions
from All Units* in OTR Statesfrom All Units* in OTR States
.17019,050,2971,619Wednesday
August 4
.164Seasonal total:1,995,251,140
Daily average: 13,040,857
Seasonal total:163,833
Daily average: 1071
May 1 –
Sept. 30
.17019,619,9271,668Wednesday
July 27
1,588
1,677
NOx Emissions (tons)
.17218,501,509Friday
August 12
.16919,811,372Tuesday
July 26
Average
Emissions
Rate
(lbs/mmBtu)
Heat Input
(mmBtu’s)
Date
• There are 1168 units in OTR states that report their hourly emissions to EPA as either part
of the NOx Budget Program and/or Acid Rain Program
(2005)
21
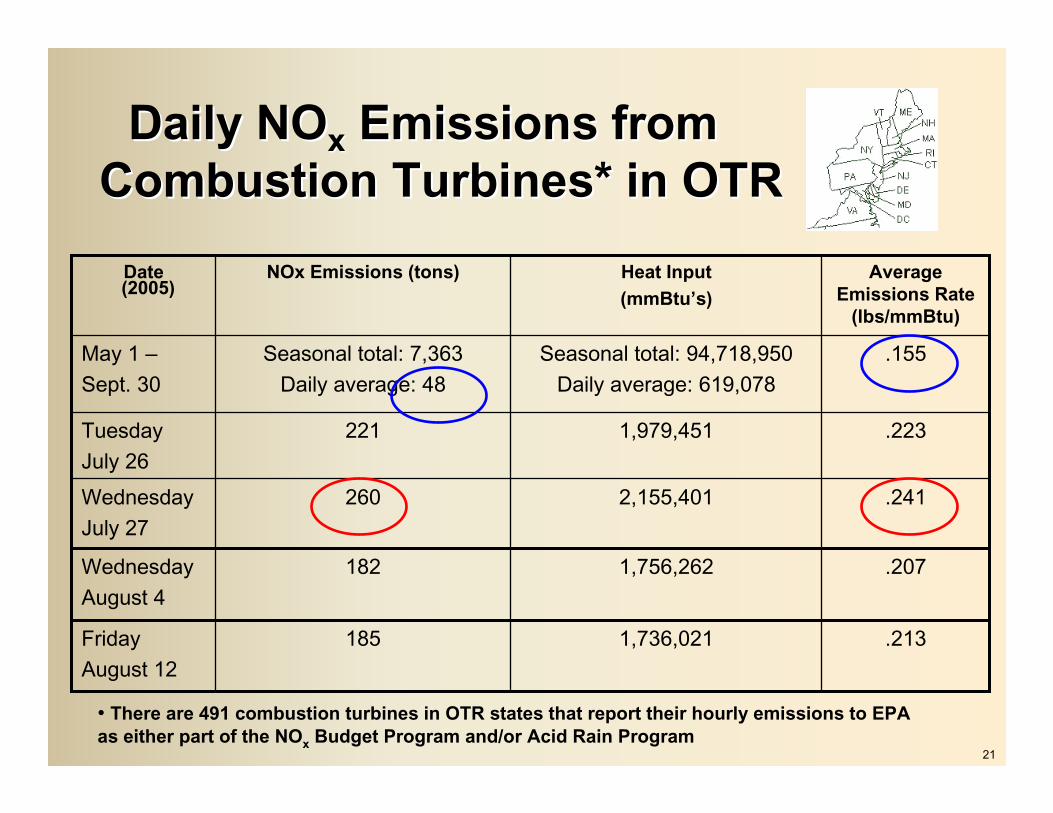
Daily NODaily NOxx Emissions from Emissions from
Combustion Turbines* in OTRCombustion Turbines* in OTR
.2071,756,262182Wednesday
August 4
.155Seasonal total: 94,718,950
Daily average: 619,078
Seasonal total: 7,363
Daily average: 48
May 1 –
Sept. 30
.2412,155,401260Wednesday
July 27
185
221
NOx Emissions (tons)
.2131,736,021Friday
August 12
.2231,979,451Tuesday
July 26
Average
Emissions Rate
(lbs/mmBtu)
Heat Input
(mmBtu’s)
Date(2005)
• There are 491 combustion turbines in OTR states that report their hourly emissions to EPA
as either part of the NOx Budget Program and/or Acid Rain Program

22
Variety of SolutionsVariety of Solutions
needed to address the issueneeded to address the issue
23
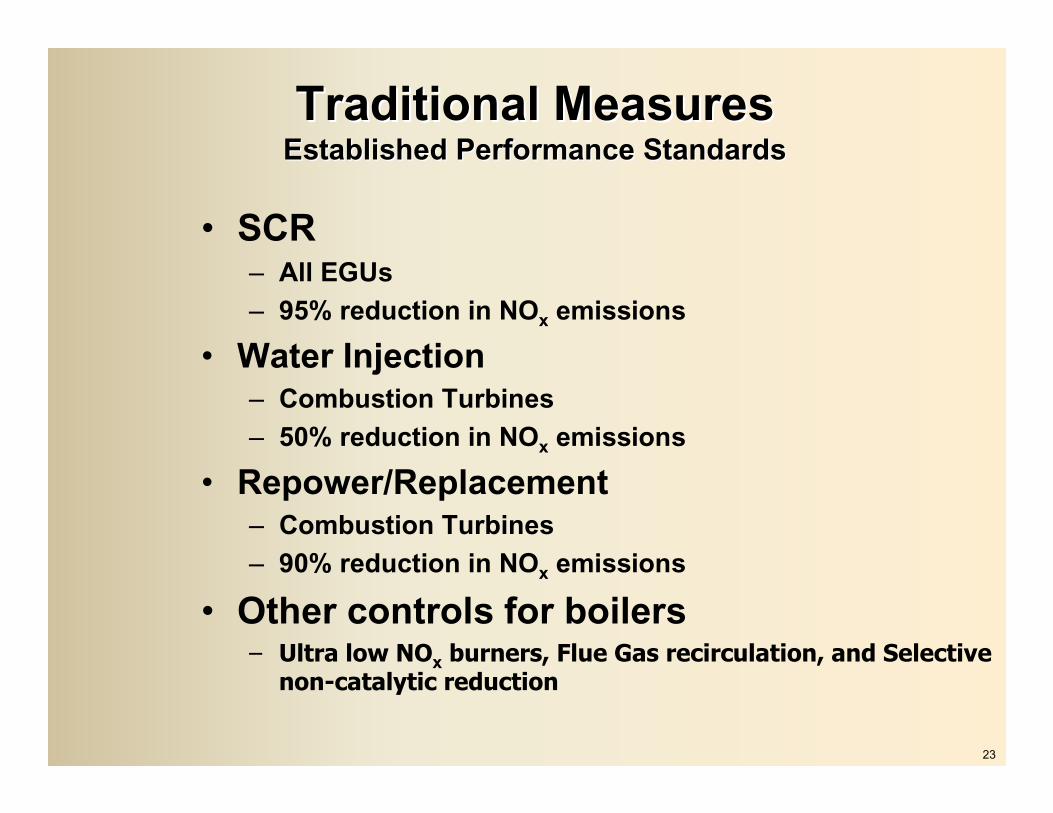
Traditional MeasuresTraditional MeasuresEstablished Performance StandardsEstablished Performance Standards
• SCR– All EGUs
– 95% reduction in NOx emissions
• Water Injection– Combustion Turbines
– 50% reduction in NOx emissions
• Repower/Replacement– Combustion Turbines
– 90% reduction in NOx emissions
• Other controls for boilers– Ultra low NOx burners, Flue Gas recirculation, and Selective
non-catalytic reduction
24
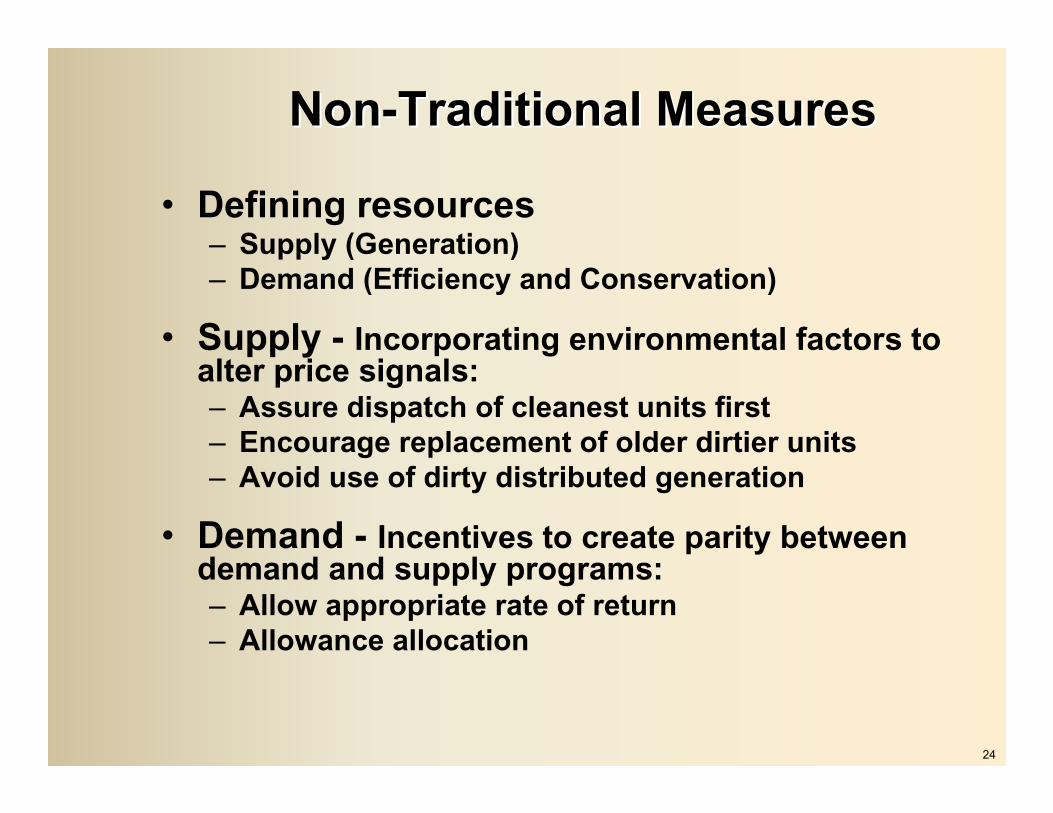
NonNon--Traditional MeasuresTraditional Measures
• Defining resources– Supply (Generation)
– Demand (Efficiency and Conservation)
• Supply - Incorporating environmental factors to alter price signals:– Assure dispatch of cleanest units first
– Encourage replacement of older dirtier units
– Avoid use of dirty distributed generation
• Demand - Incentives to create parity between demand and supply programs:– Allow appropriate rate of return
– Allowance allocation
25
Three Points!Three Points!
•• Emissions from ElectricEmissions from Electric
Generating Units are higher onGenerating Units are higher on
high electric demand dayshigh electric demand days
•• This results in poorer air qualityThis results in poorer air quality
•• It will take a variety of solutions It will take a variety of solutions
to address this issueto address this issue
26
ActionAction
• Direct OTC staff to continue to
work with PUCs, RTOs & the utility
industry to explore the high
electrical demand day issue &
solutions
• Direct OTC staff to recommend
action for the fall meeting