Embed Size (px)
Citation preview

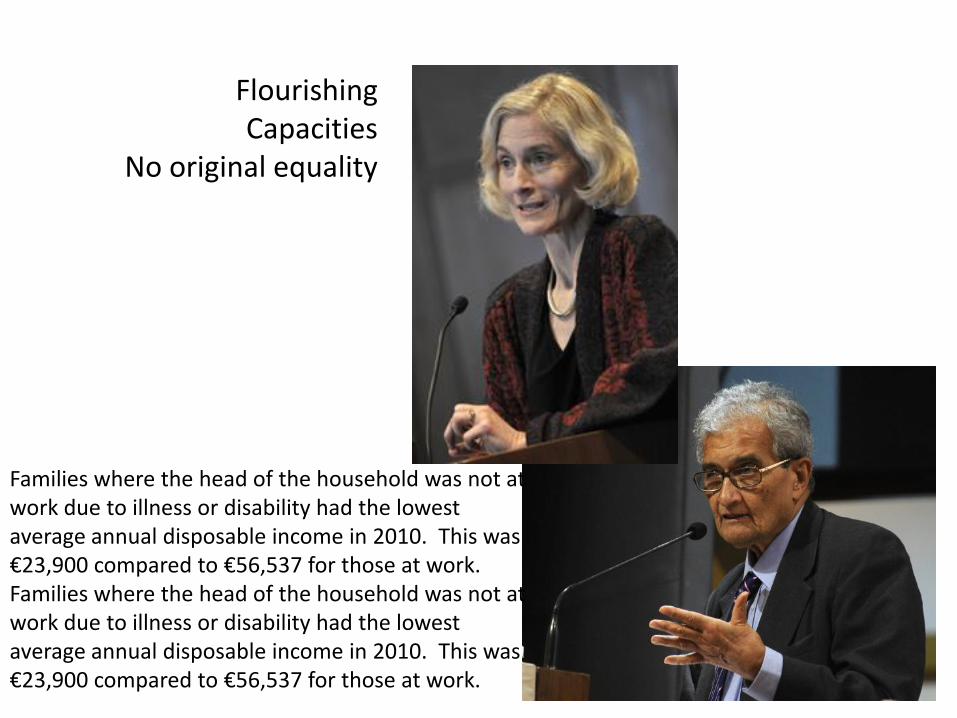
Flourishing Capacities
No original equality
Families where the head of the household was not at work due to illness or disability had the lowest average annual disposable income in 2010. This was €23,900 compared to €56,537 for those at work. Families where the head of the household was not at work due to illness or disability had the lowest average annual disposable income in 2010. This was €23,900 compared to €56,537 for those at work.

The Republic guarantees religious and civil liberty, equal rights and
equal opportunities to all its citizens, and declares its resolve
to pursue the happiness and prosperity of the whole nation
and all of its parts, cherishing all of the children of the nation equally and oblivious of the
differences carefully fostered by an alien government, which have
divided a minority from the majority in the past.
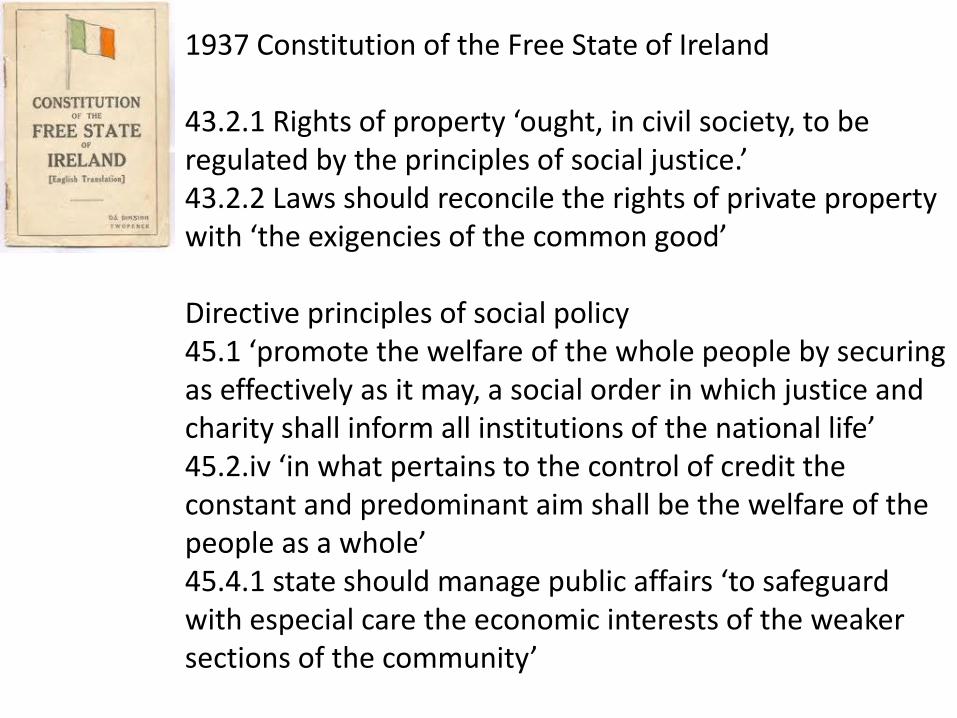
1937 Constitution of the Free State of Ireland 43.2.1 Rights of property ‘ought, in civil society, to be regulated by the principles of social justice.’ 43.2.2 Laws should reconcile the rights of private property with ‘the exigencies of the common good’ Directive principles of social policy 45.1 ‘promote the welfare of the whole people by securing as effectively as it may, a social order in which justice and charity shall inform all institutions of the national life’ 45.2.iv ‘in what pertains to the control of credit the constant and predominant aim shall be the welfare of the people as a whole’ 45.4.1 state should manage public affairs ‘to safeguard with especial care the economic interests of the weaker sections of the community’
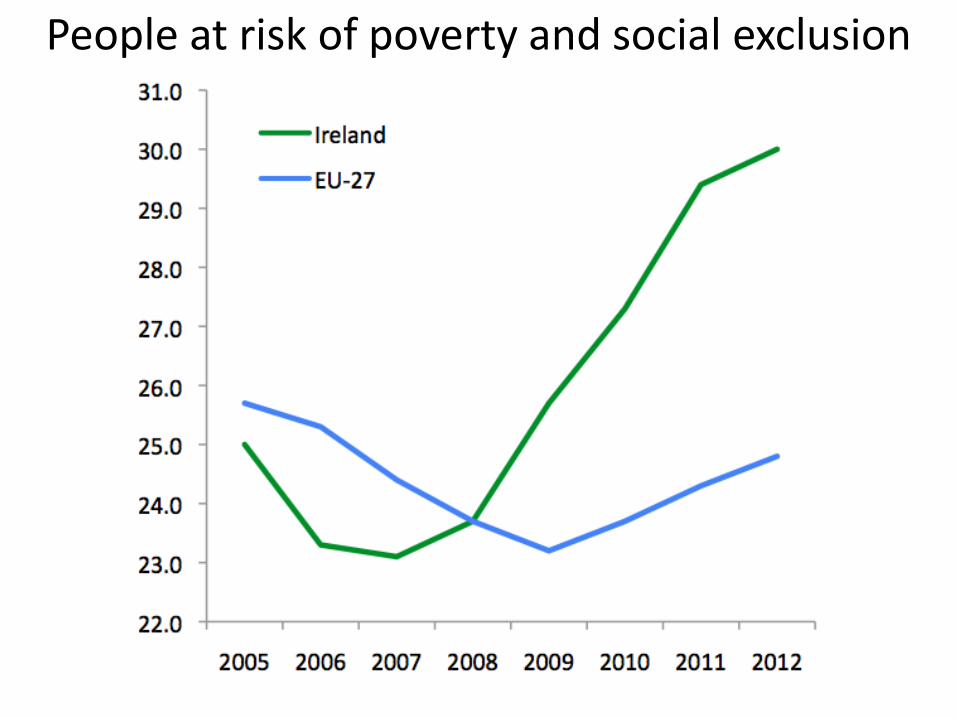
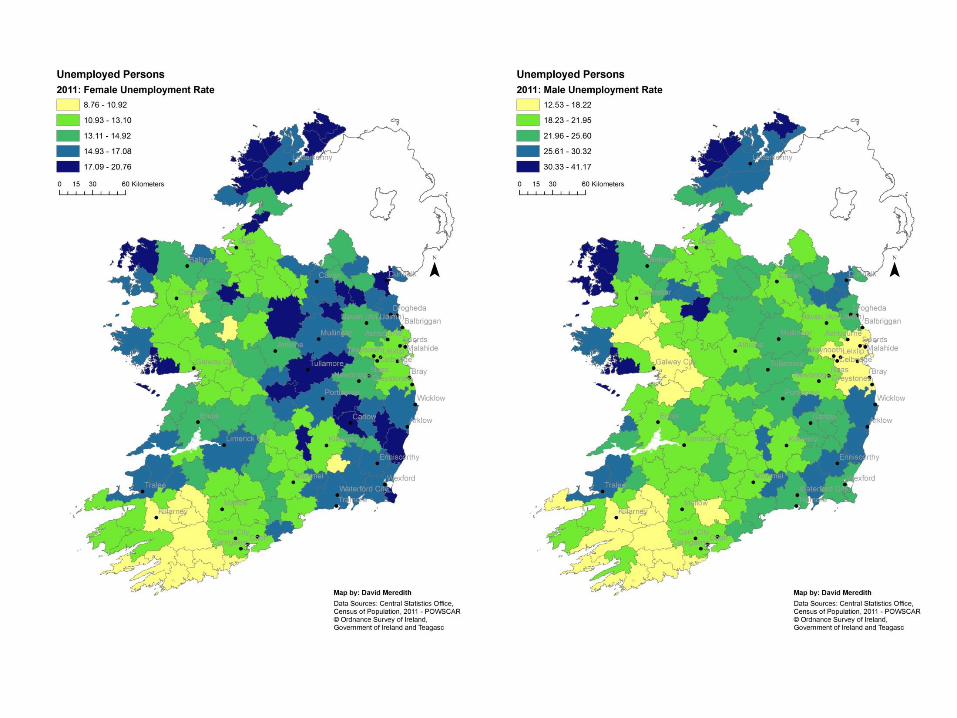
People at risk of poverty and social exclusion
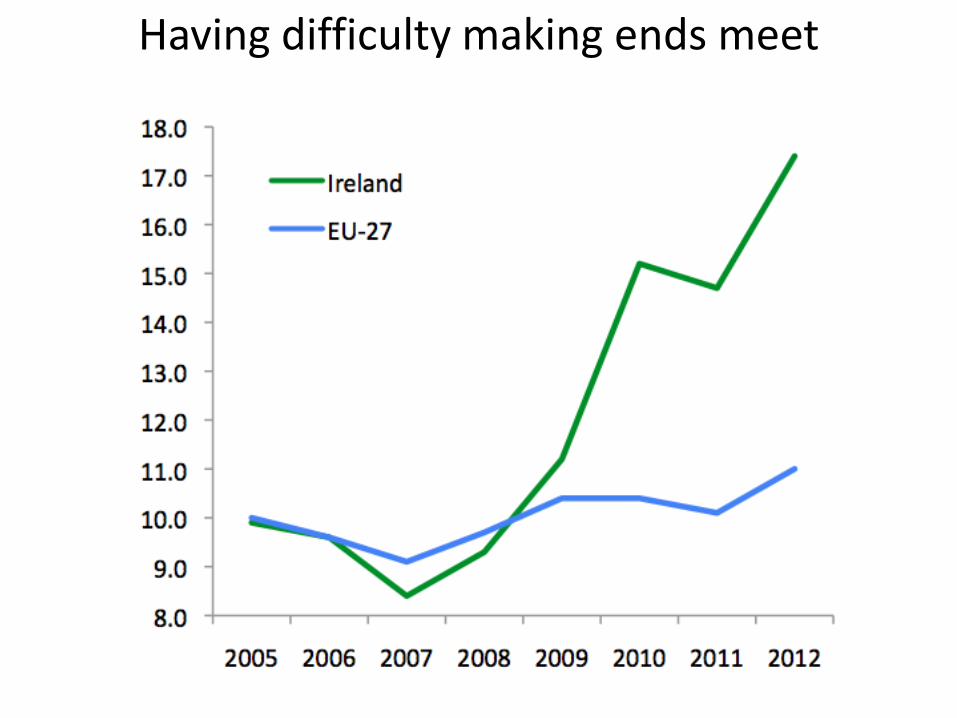
Having difficulty making ends meet
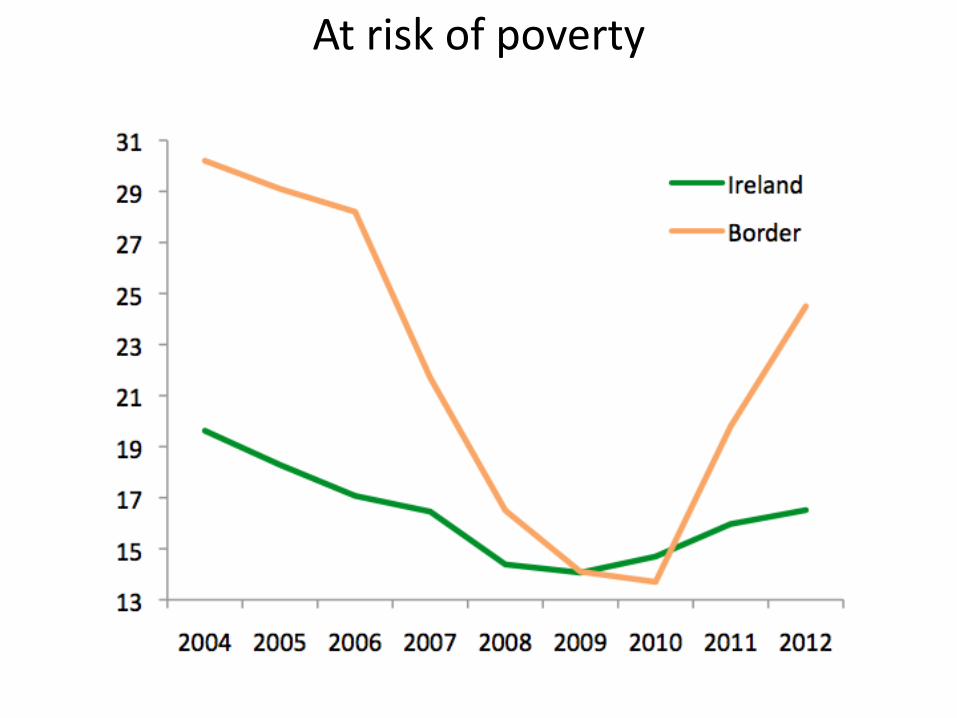
At risk of poverty
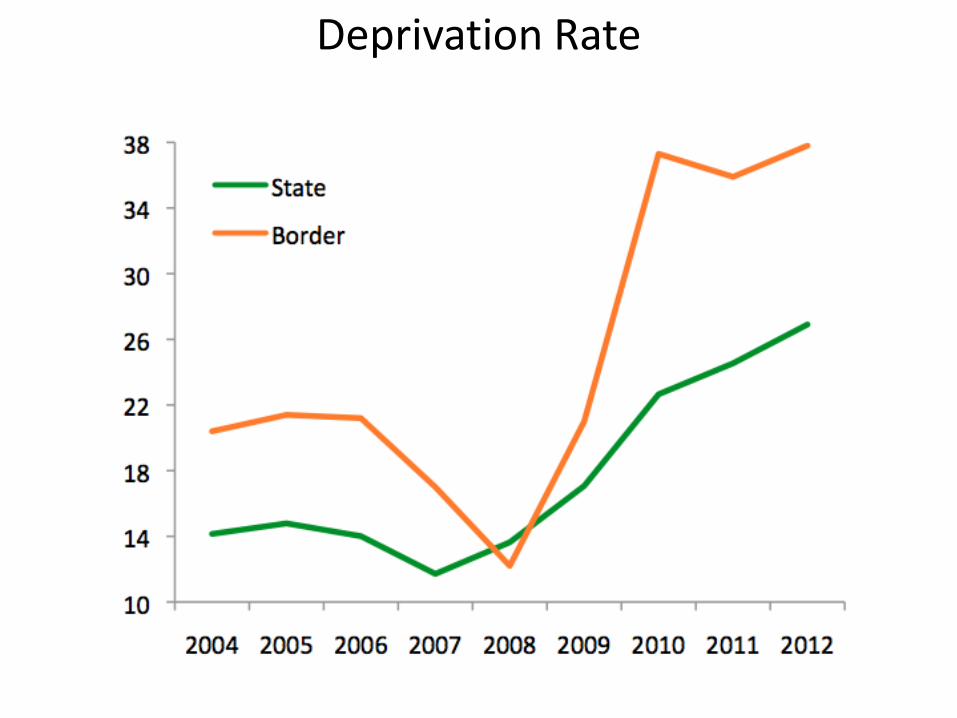
Deprivation Rate

Economies enforced upon Ireland’s poorest people
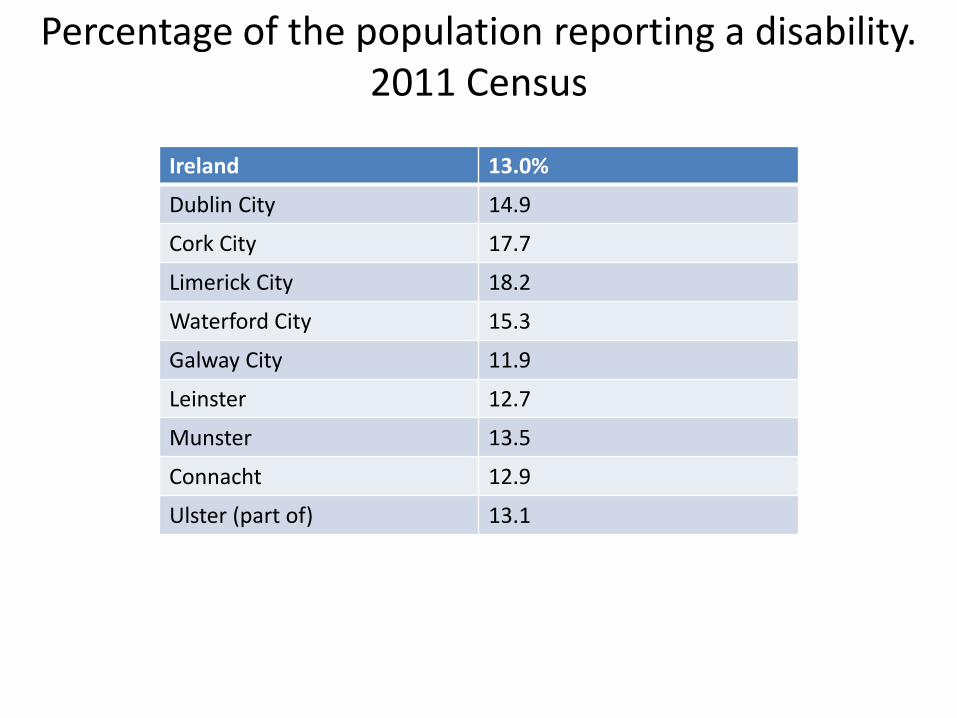
Ireland 13.0%
Dublin City 14.9
Cork City 17.7
Limerick City 18.2
Waterford City 15.3
Galway City 11.9
Leinster 12.7
Munster 13.5
Connacht 12.9
Ulster (part of) 13.1
Percentage of the population reporting a disability. 2011 Census
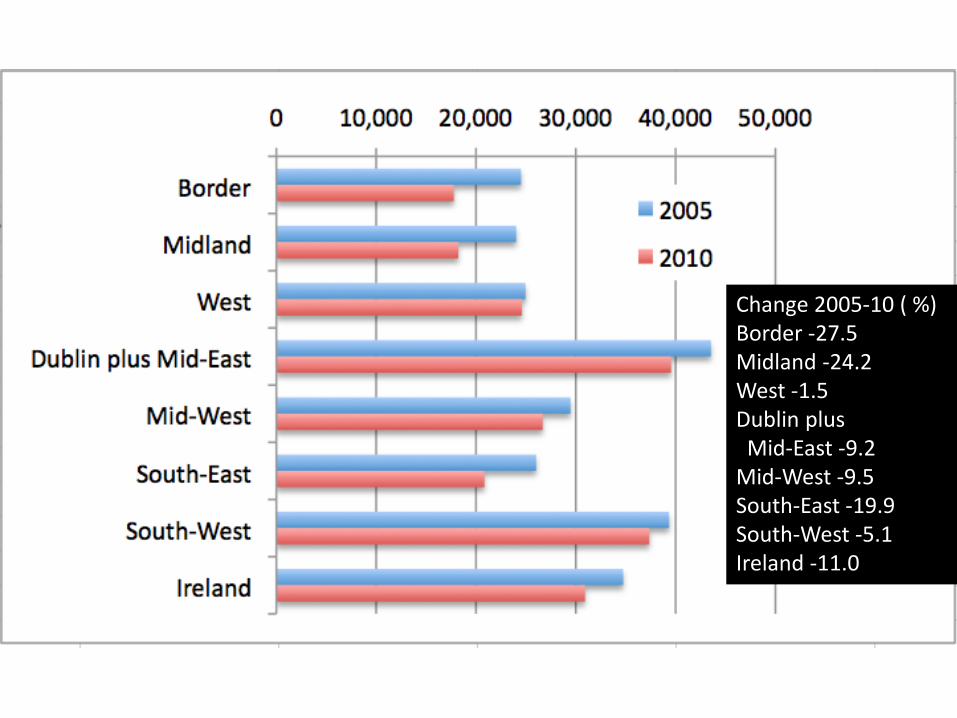
Change 2005-10 ( %) Border -27.5 Midland -24.2 West -1.5 Dublin plus Mid-East -9.2 Mid-West -9.5 South-East -19.9 South-West -5.1 Ireland -11.0
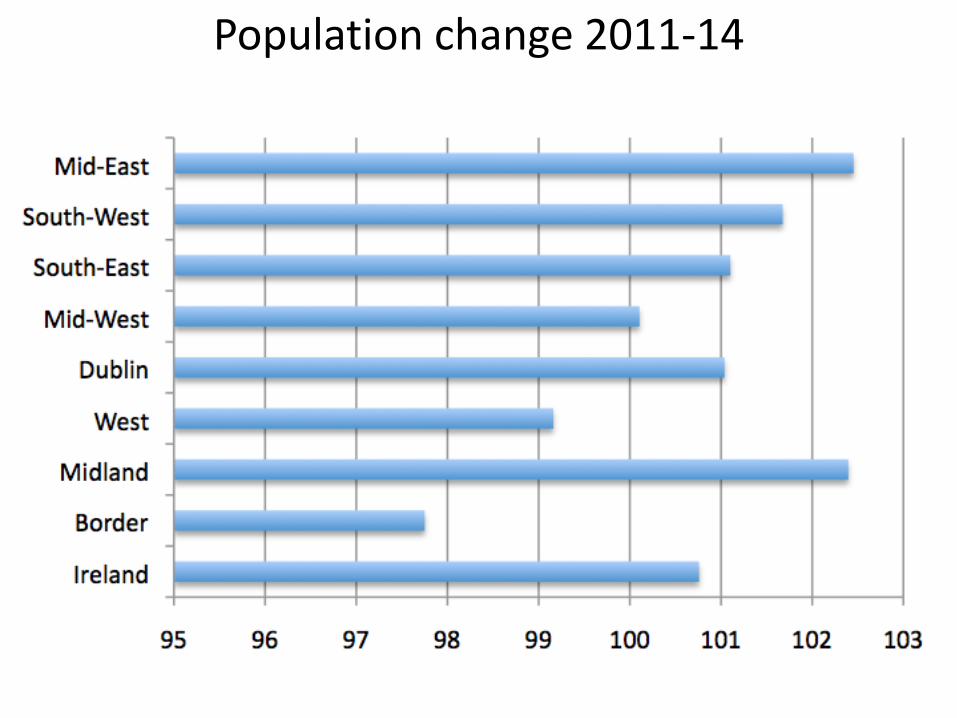
Population change 2011-14
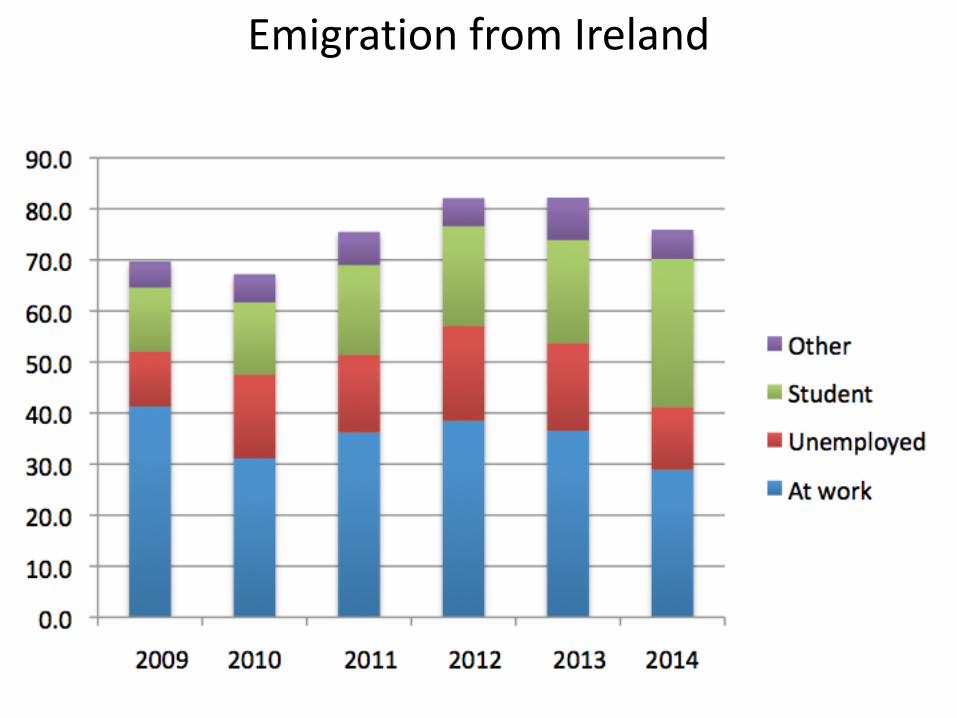
Emigration from Ireland

MIGRATION
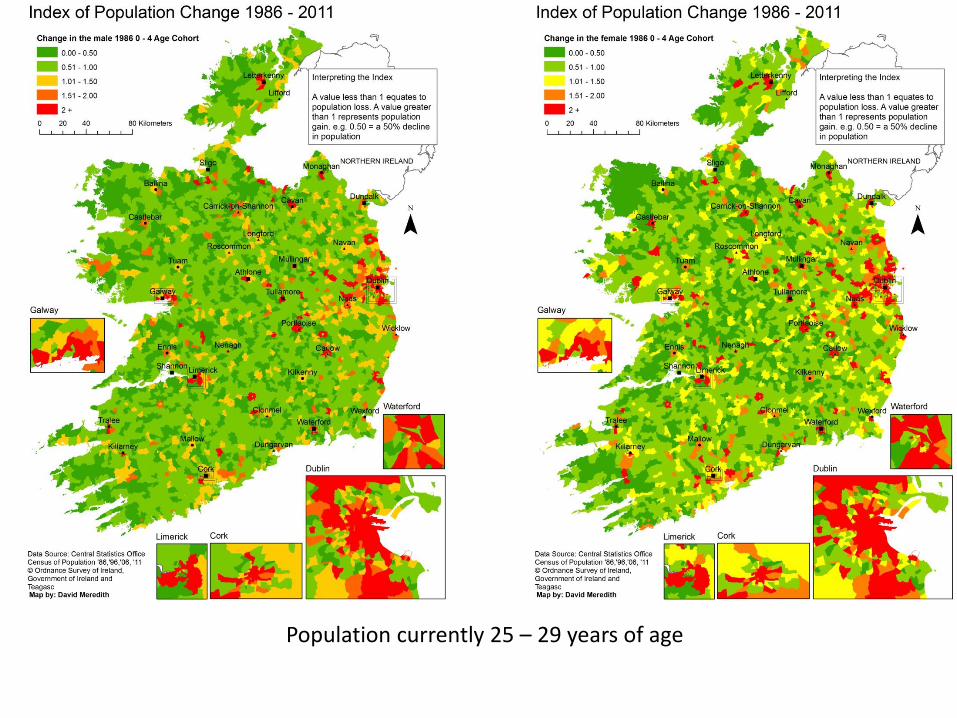
Population currently 25 – 29 years of age
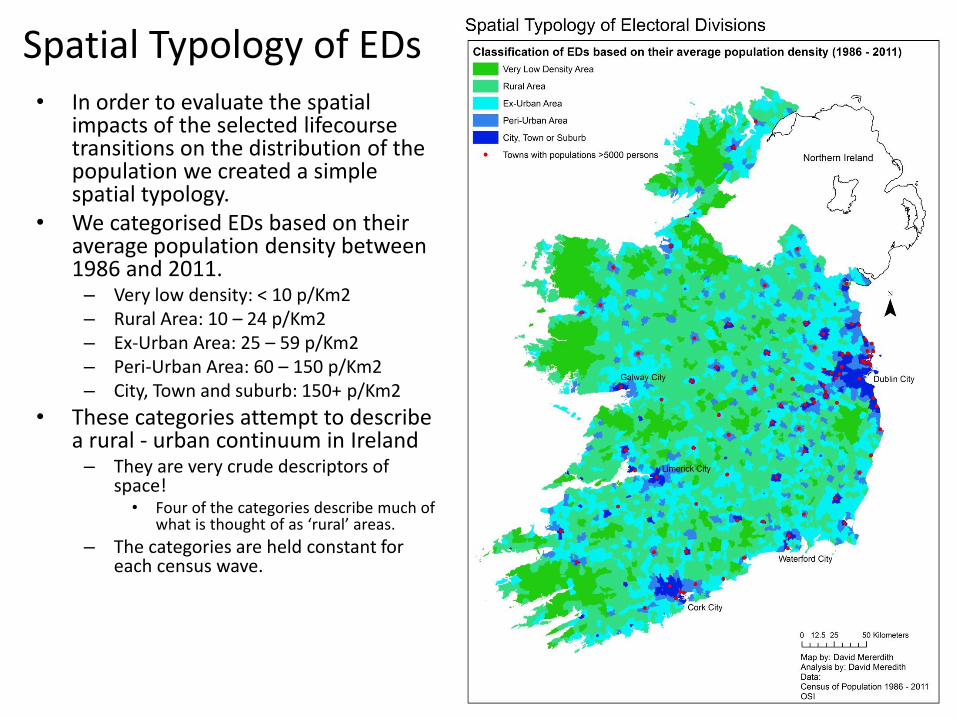
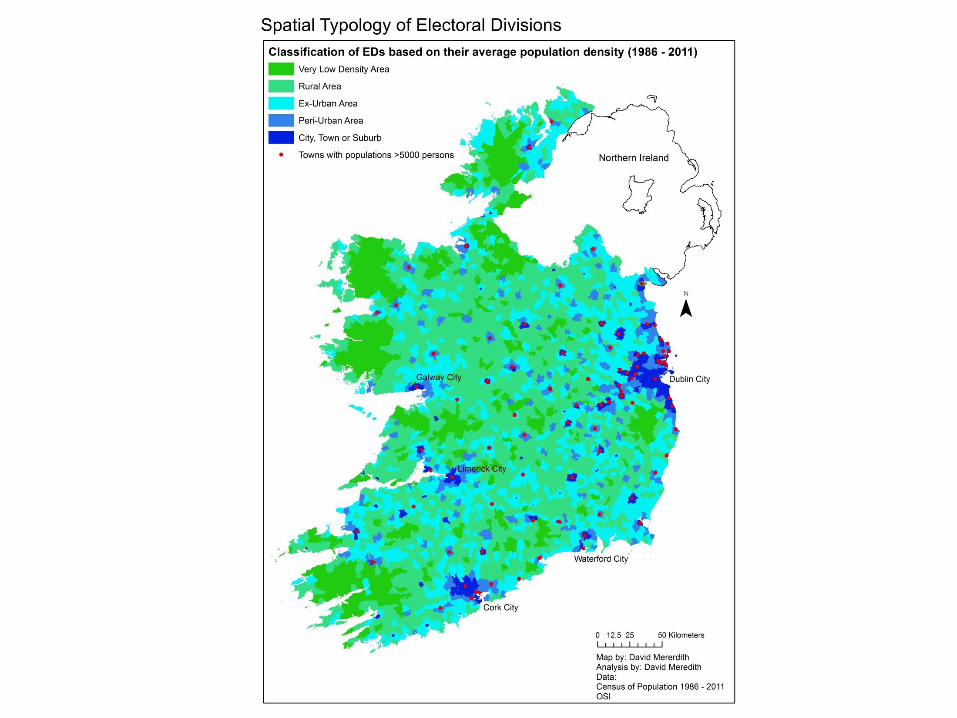
Spatial Typology of EDs • In order to evaluate the spatial
impacts of the selected lifecourse transitions on the distribution of the population we created a simple spatial typology.
• We categorised EDs based on their average population density between 1986 and 2011. – Very low density: < 10 p/Km2 – Rural Area: 10 – 24 p/Km2 – Ex-Urban Area: 25 – 59 p/Km2 – Peri-Urban Area: 60 – 150 p/Km2 – City, Town and suburb: 150+ p/Km2
• These categories attempt to describe a rural - urban continuum in Ireland – They are very crude descriptors of
space! • Four of the categories describe much of
what is thought of as ‘rural’ areas.
– The categories are held constant for each census wave.

Changing distribution of the birth cohort
Spatially Stable Rural to Urban Urban to Rural
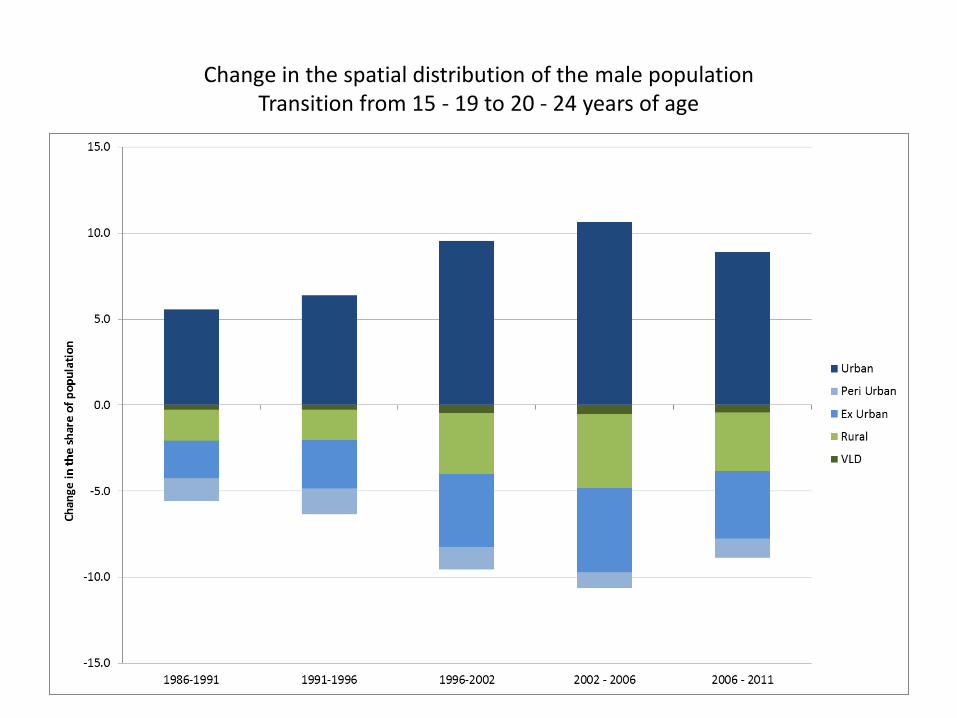
Change in the spatial distribution of the male population Transition from 15 - 19 to 20 - 24 years of age
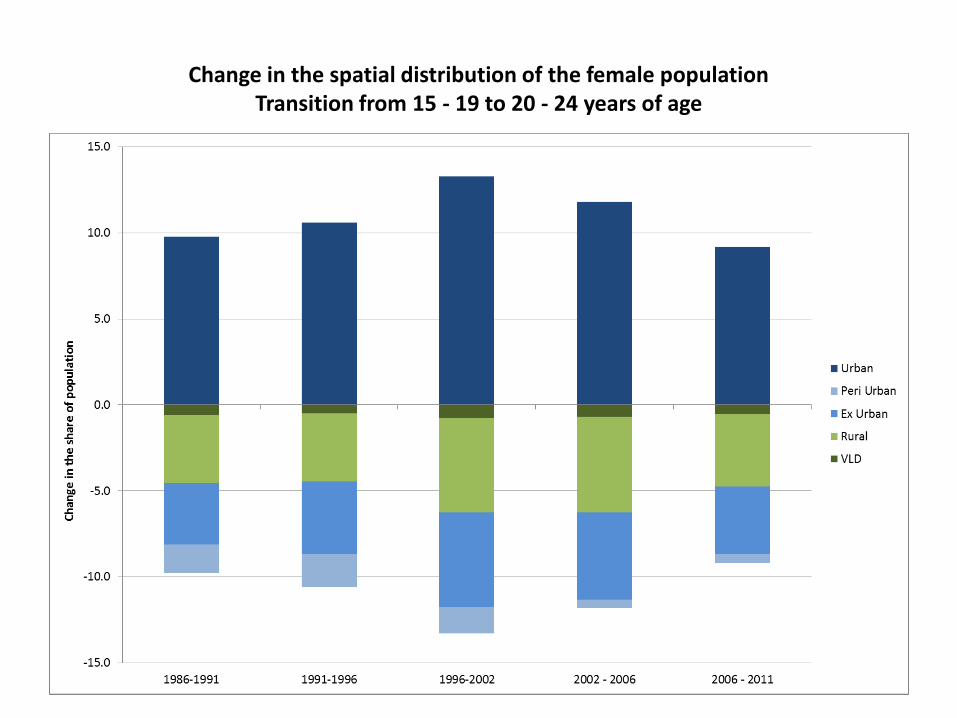
Change in the spatial distribution of the female population Transition from 15 - 19 to 20 - 24 years of age

LABOUR FORCE AND EMPLOYMENT
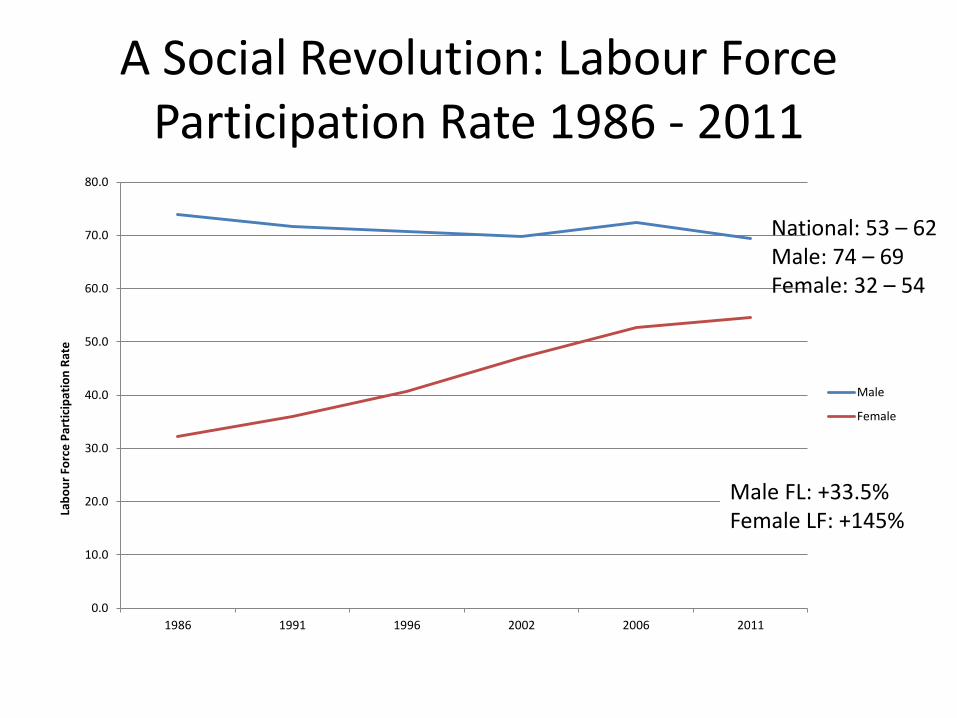
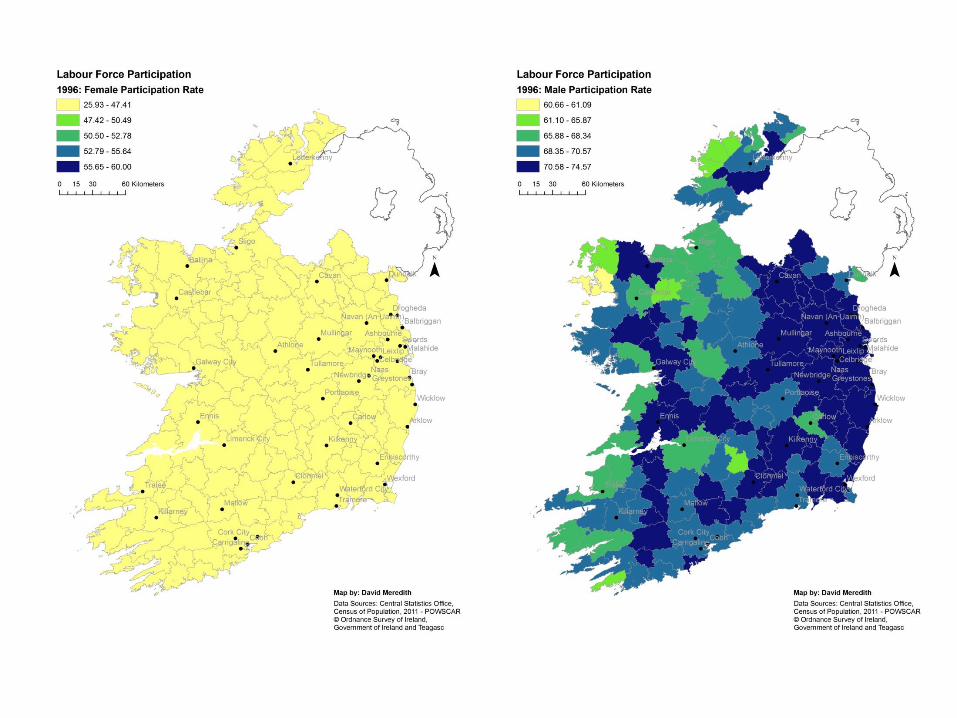
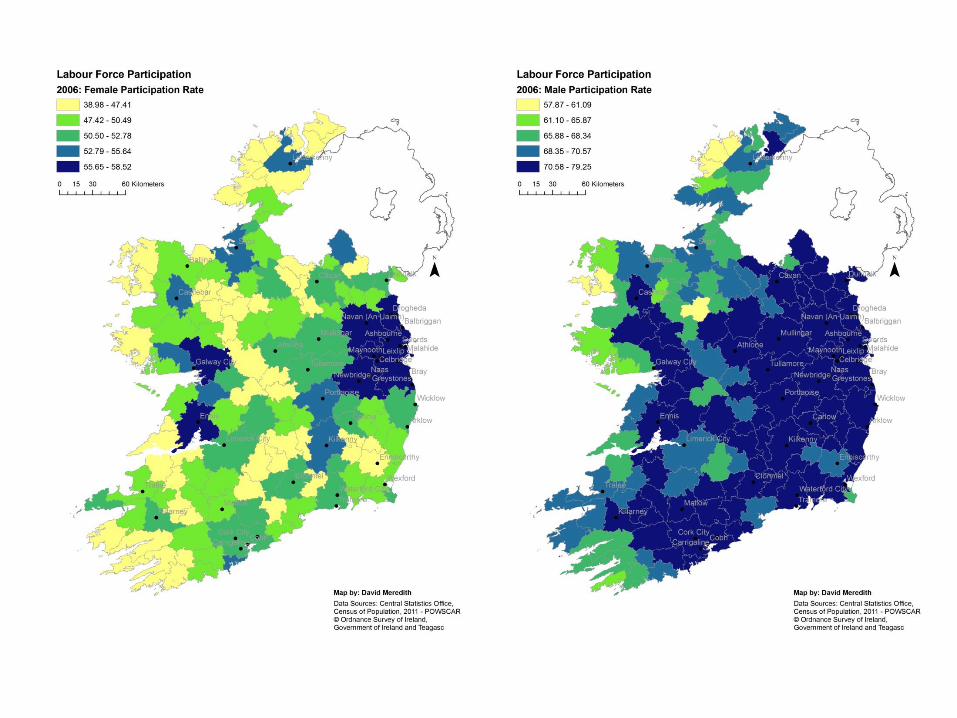
A Social Revolution: Labour Force Participation Rate 1986 - 2011
0.0
10.0
20.0
30.0
40.0
50.0
60.0
70.0
80.0
1986 1991 1996 2002 2006 2011
Lab
ou
r Fo
rce
Par
tici
pat
ion
Rat
e
Male
Female
National: 53 – 62 Male: 74 – 69 Female: 32 – 54
Male FL: +33.5% Female LF: +145%
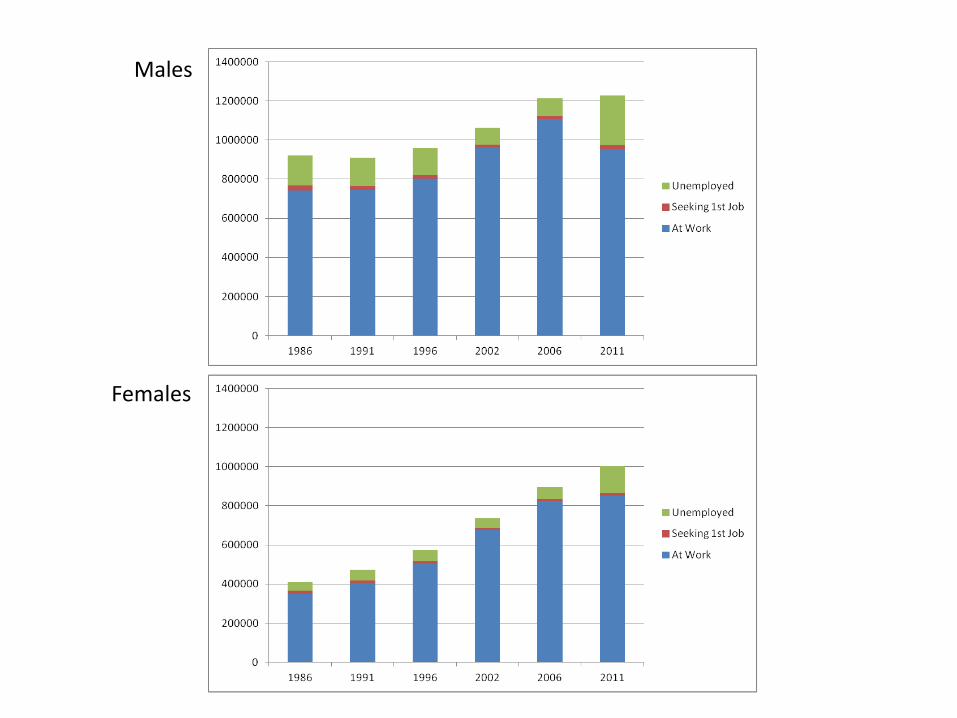
Males
Females

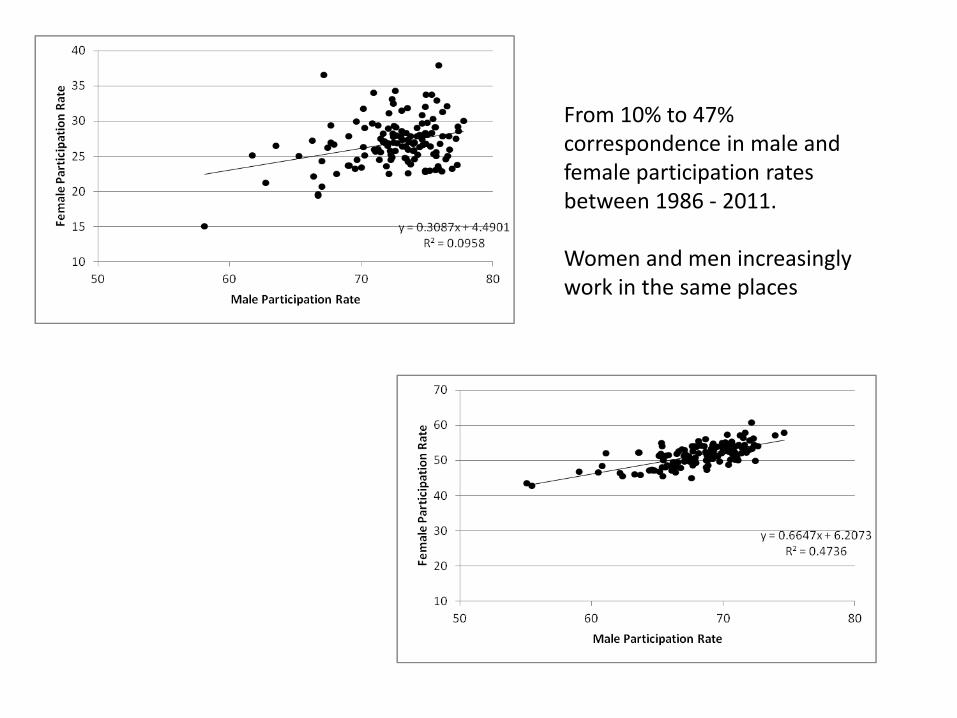
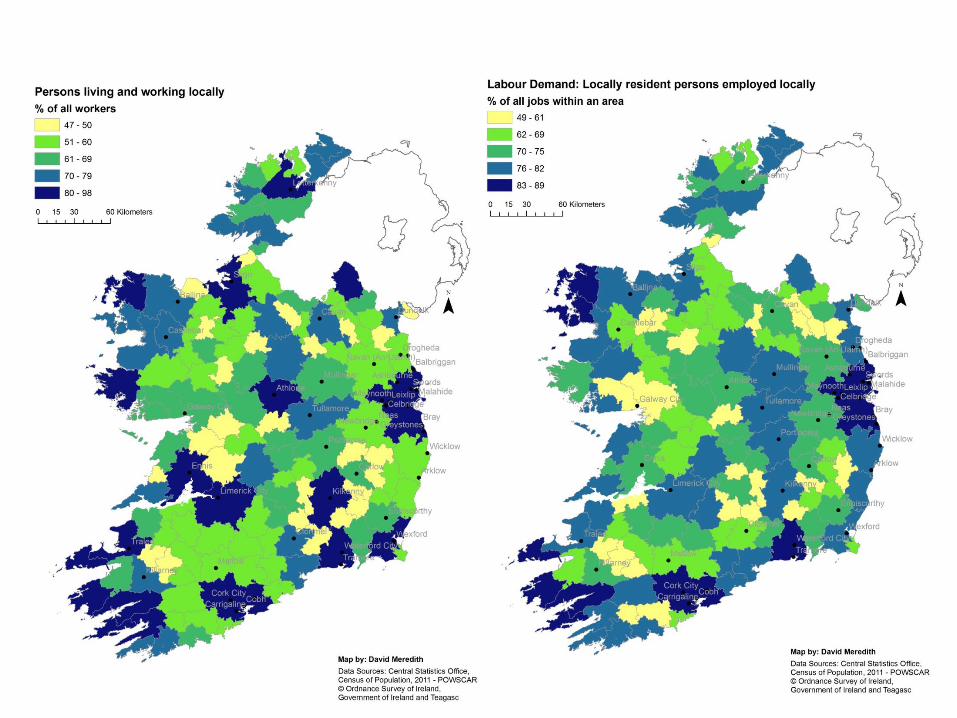
From 10% to 47% correspondence in male and female participation rates between 1986 - 2011. Women and men increasingly work in the same places
0
200,000
400,000
600,000
800,000
1,000,000
1,200,000
1986 1991 1996 2002 2006 2011
Nu
mb
er
of
Me
n E
mp
loye
d
Other
Professional Services
Public Administration and Defence
Transport and Communications
Commerce
Manufacturing and related industries
Construction
Agriculture, Forestry and Fishing
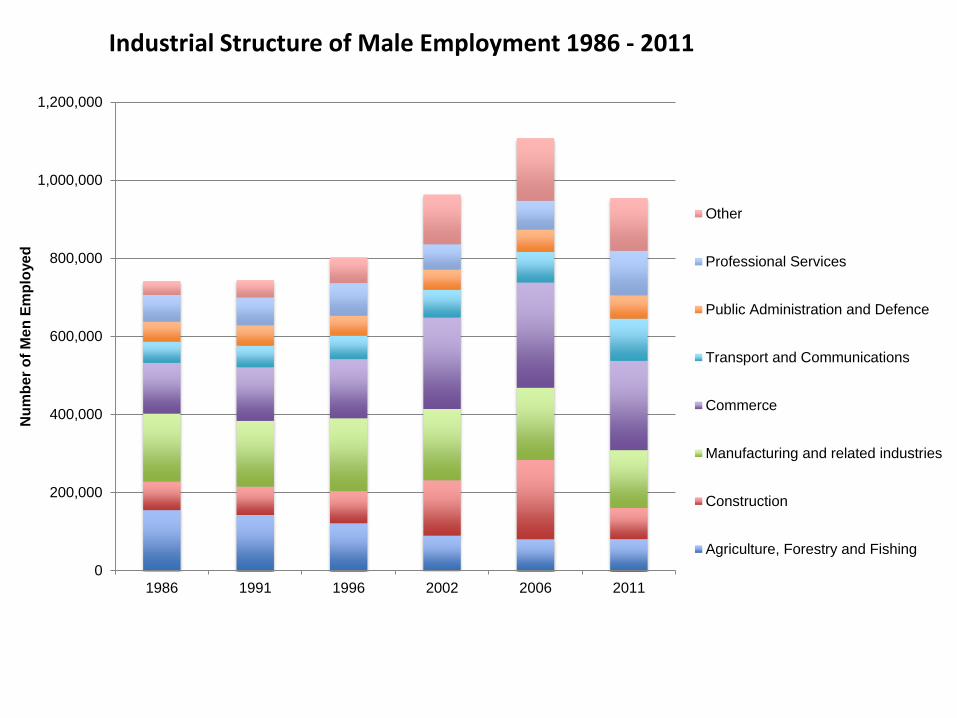
Industrial Structure of Male Employment 1986 - 2011
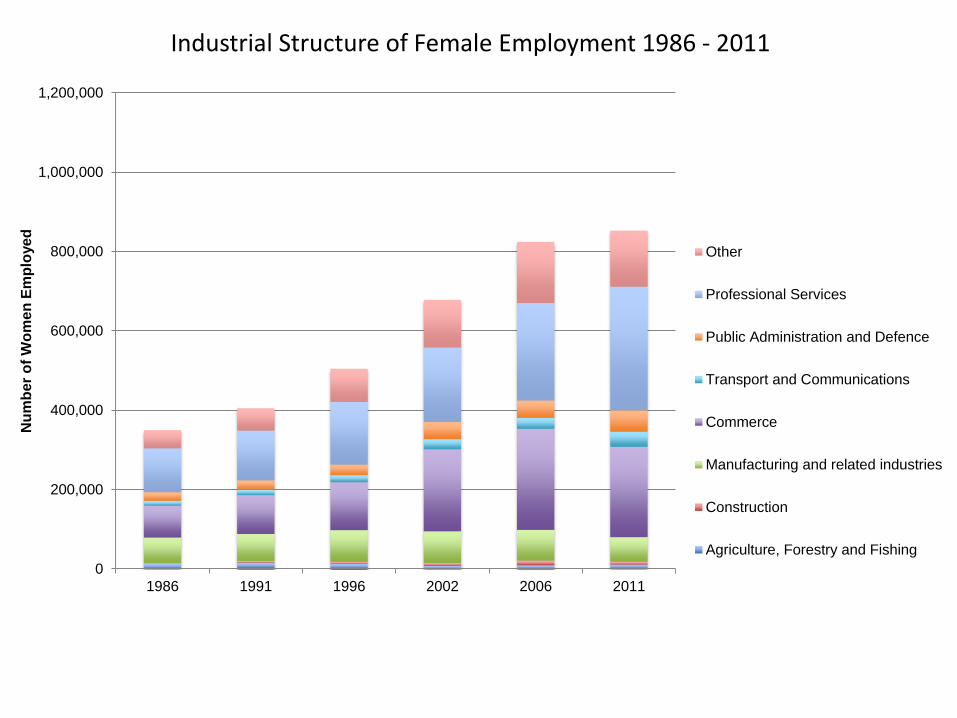
Industrial Structure of Female Employment 1986 - 2011
0
200,000
400,000
600,000
800,000
1,000,000
1,200,000
1986 1991 1996 2002 2006 2011
Nu
mb
er
of
Wo
me
n E
mp
loye
d
Other
Professional Services
Public Administration and Defence
Transport and Communications
Commerce
Manufacturing and related industries
Construction
Agriculture, Forestry and Fishing
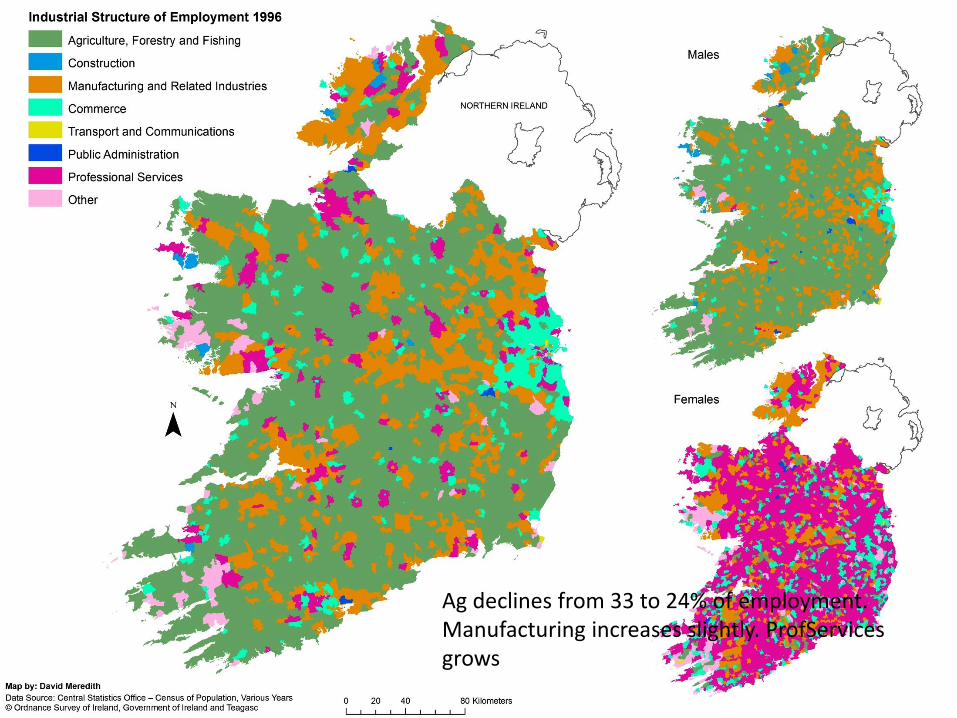
Ag declines from 33 to 24% of employment. Manufacturing increases slightly. ProfServices grows
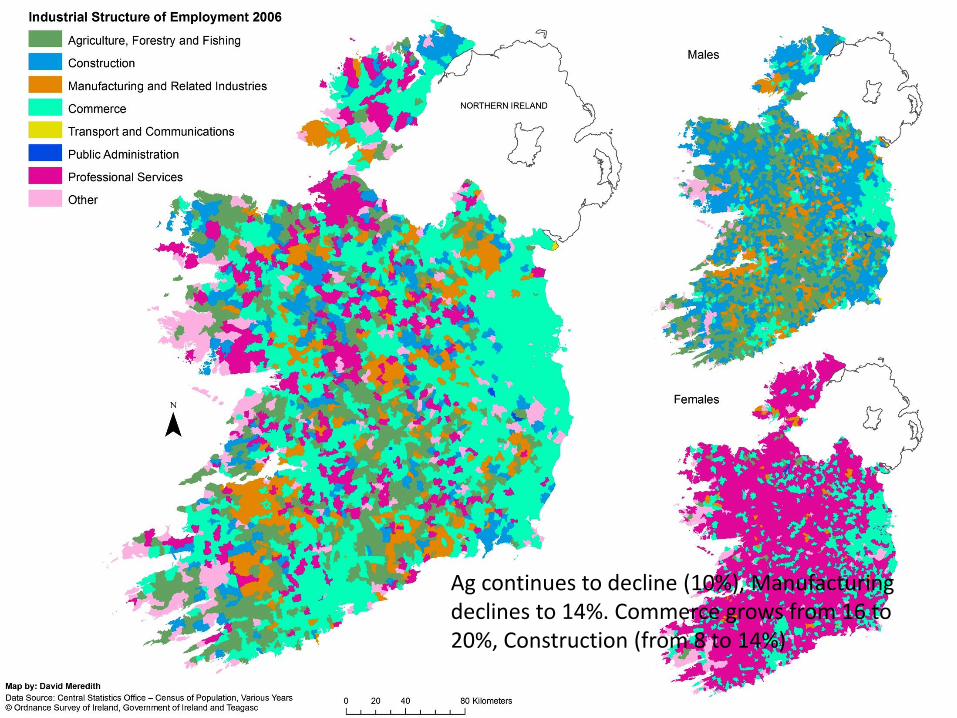
Ag continues to decline (10%), Manufacturing declines to 14%. Commerce grows from 16 to 20%, Construction (from 8 to 14%)
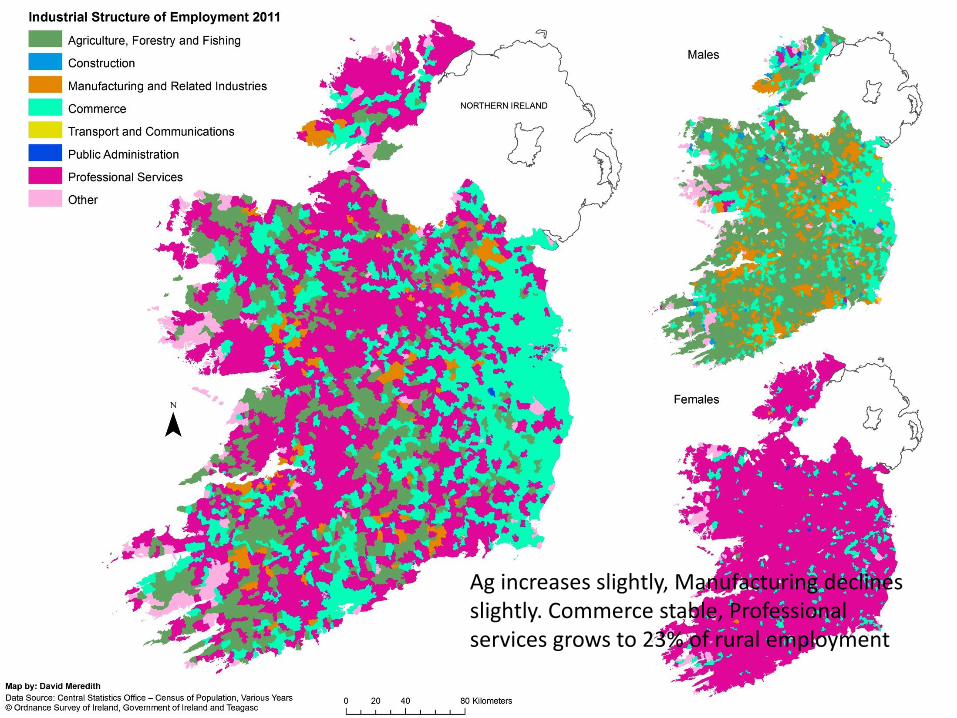
Ag increases slightly, Manufacturing declines slightly. Commerce stable, Professional services grows to 23% of rural employment
0
50000
100000
150000
200000
250000
300000
1986 1991 1996 2002 2006 2011
Male
Female
0
50000
100000
150000
200000
250000
300000
1986 1991 1996 2002 2006 2011
Male
Female
0
50000
100000
150000
200000
250000
300000
1986 1991 1996 2002 2006 2011
Male
Female
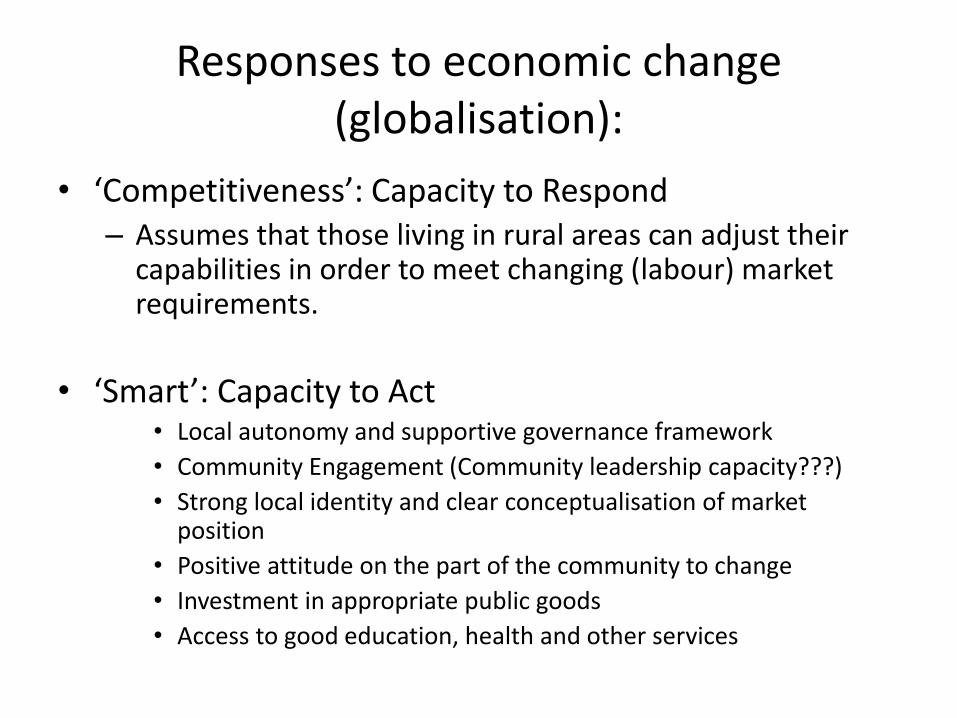
Responses to economic change (globalisation):
• ‘Competitiveness’: Capacity to Respond – Assumes that those living in rural areas can adjust their
capabilities in order to meet changing (labour) market requirements.
• ‘Smart’: Capacity to Act • Local autonomy and supportive governance framework
• Community Engagement (Community leadership capacity???)
• Strong local identity and clear conceptualisation of market position
• Positive attitude on the part of the community to change
• Investment in appropriate public goods
• Access to good education, health and other services

Economic Change
• There is no point just dealing with the results of a process that are producing uneven development. – In other words, there is no point just being reactive to change.
• Communities need the capacity to act not just react. • There is a limit to what can be achieved from the local level. • The state and sectoral institutions have a vital role to play as we move
from the local level. They have to provide comprehensive and coherent organisation that facilitates democratic decisions about the nature of development which meets the needs of people.
– Critical need for a clear vision and appropriate strategy for different types of rural area.

1976 – 1981 birth cohort
280,000
300,000
320,000
340,000
360,000
380,000
400,000
1986 1991 1996 2002 2006 2011
Size
of
bir
th c
oh
ort
(P
ers
on
s)