Embed Size (px)
Citation preview
1
Supplementary Figures
Supplementary Figure 1. Neolecta fruiting body structure. (a) N. irregularis fruiting bodies used for EM. Scale bar, 1 cm. (b) Thin section showing asci arrayed on fruiting body surface. Scale bar, 10 µm. (c) Thin section showing hyphal aggregates found in the core of the fruiting body. Scale bar, 10 µm. (d) Electron micrograph showing an octahedral crystal in the N. irregularis vacuole. Scale bar, 1 µm. The inset shows striations seen within the crystal lattice. Scale bar, 20 nm. This figure complements Fig. 1.
2
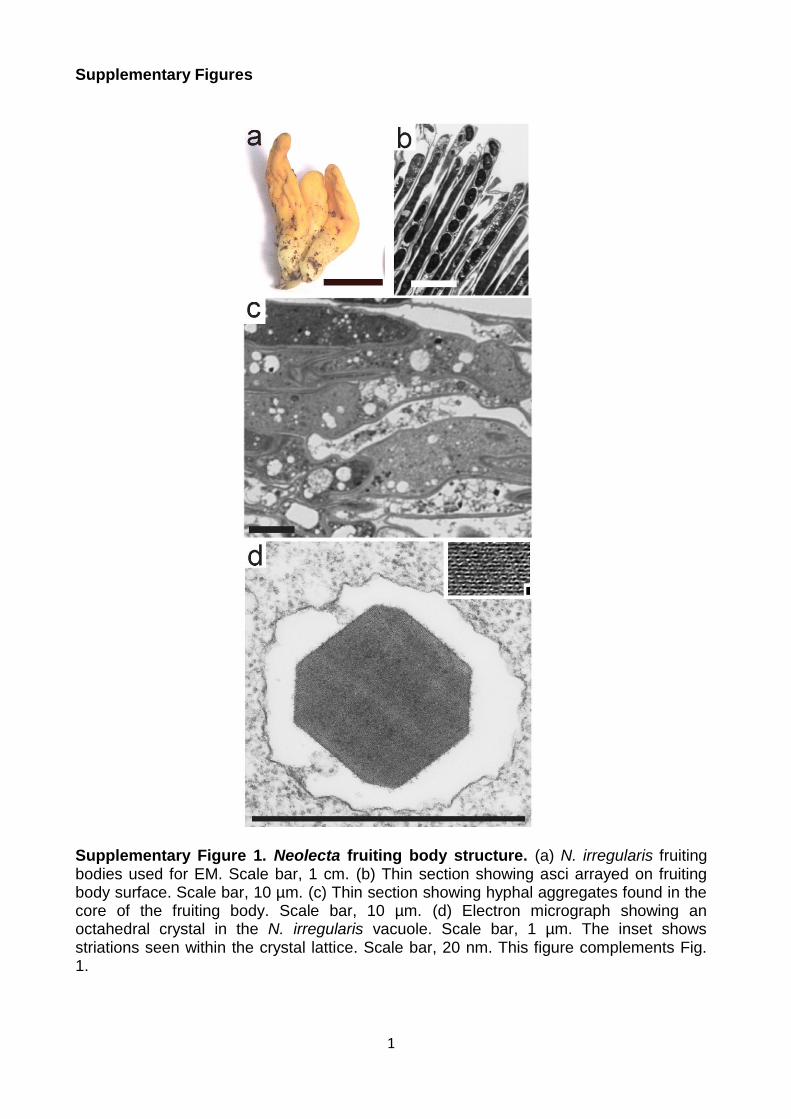
Supplementary Figure 2. Maximum likelihood phylogeny of fungi constructed using 110 single copy orthologs. Bootstrap support values are shown at the nodes. CM taxa are shown with grey background. Species coloring and abbreviations are as indicated in Fig. 1.
3
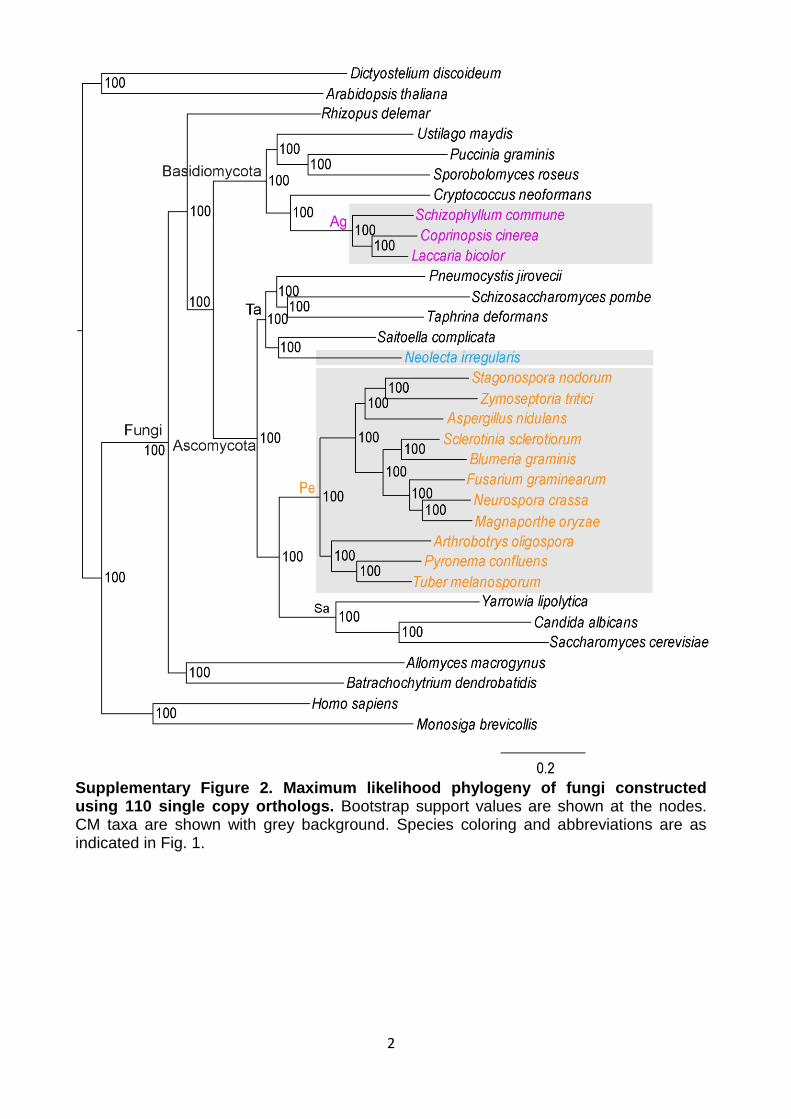
Supplementary Figure 3. Expansion of a fungal-specific transcription factor subfamily in Neolecta. Neolecta copies that appear to have undergone lineage-specific duplication are shown with grey background. The presence/absence of the two transcription factor domains: PF00172 (fungal Zn(2)-Cys(6) binuclear cluster domain) and PF04082 (fungal-specific transcription factor domain) is shown on the right. Filled squares indicate presence, empty squares indicate absence. Species coloring and abbreviations are as indicated in Fig. 1.
4
Supplementary Figure 4a
5
Supplementary Figure 4b
6
Supplementary Figure 4c
7
Supplementary Figure 4d
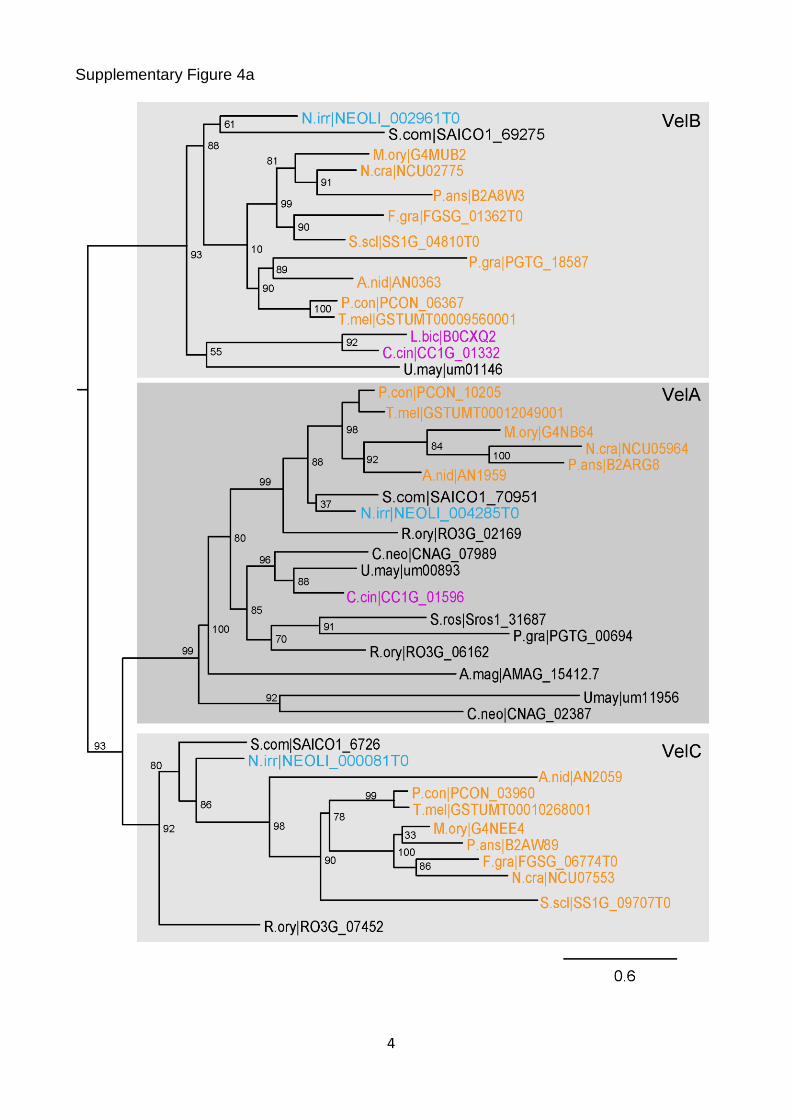
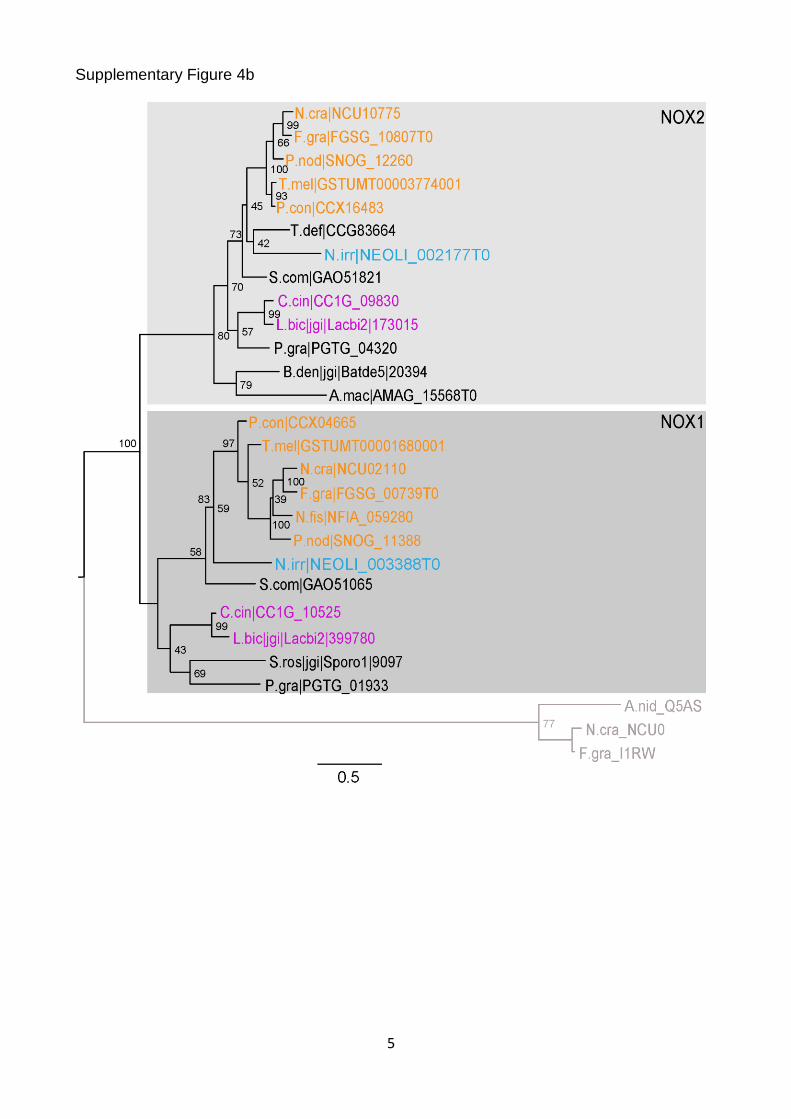
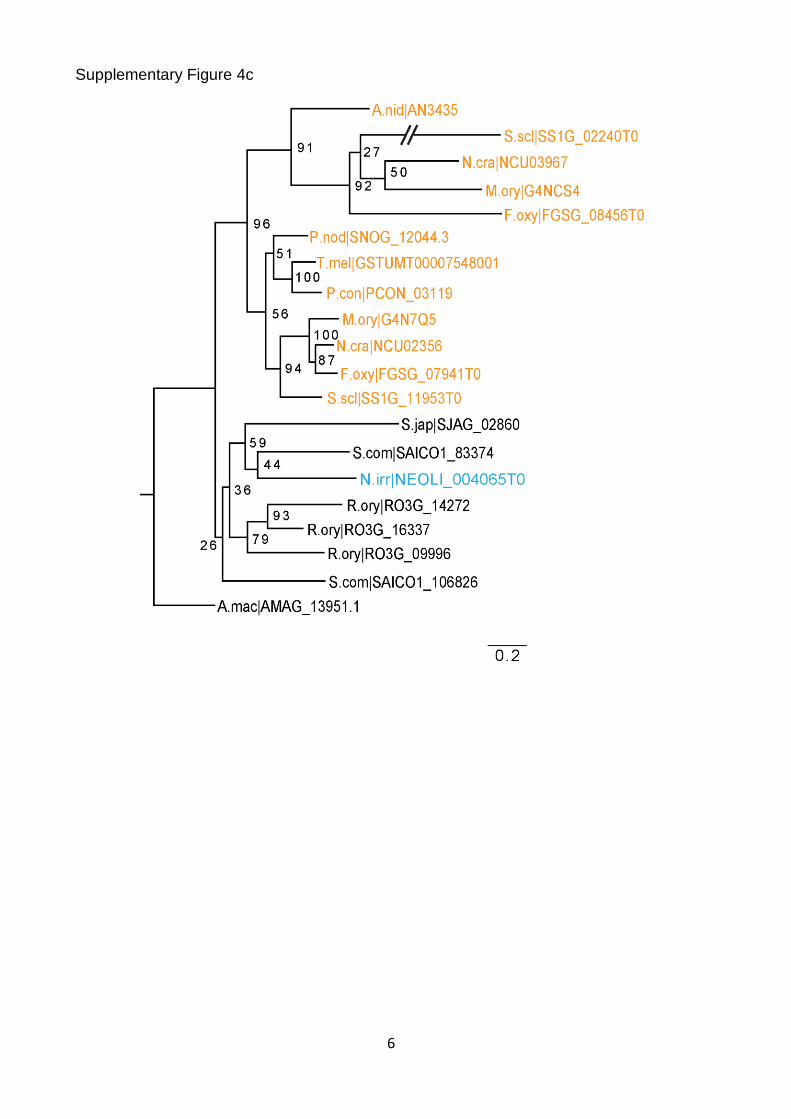
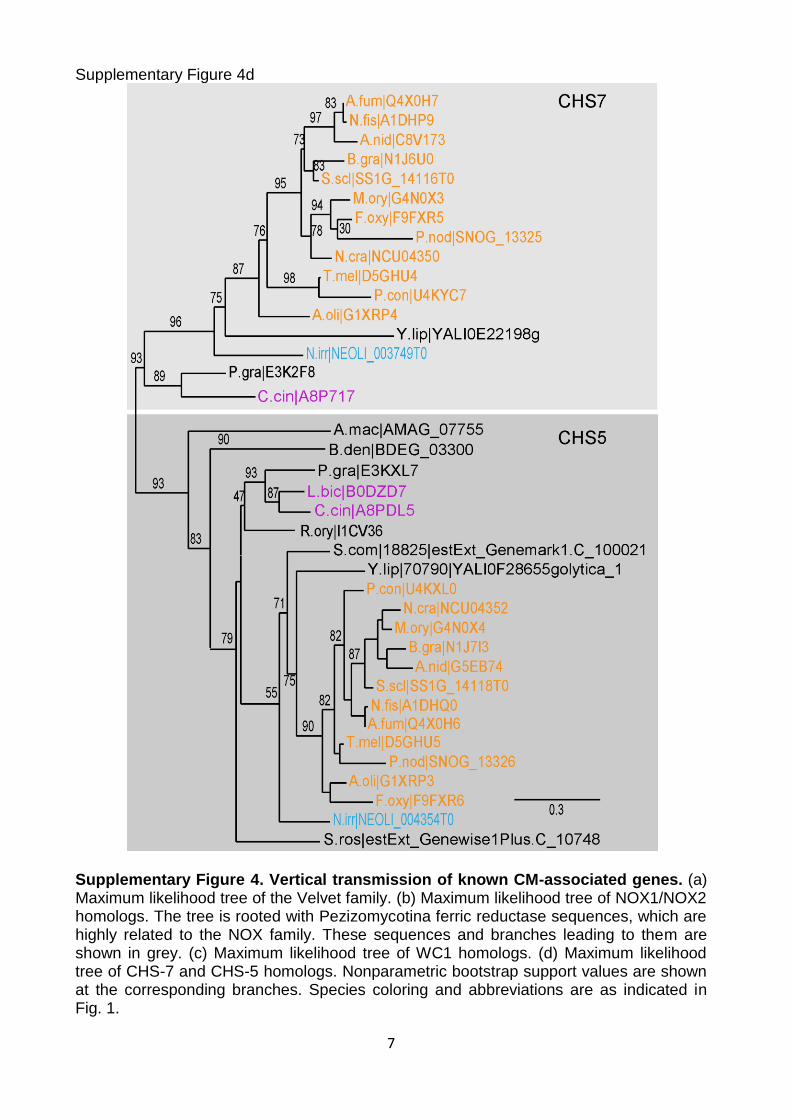
Supplementary Figure 4. Vertical transmission of known CM-associated genes. (a) Maximum likelihood tree of the Velvet family. (b) Maximum likelihood tree of NOX1/NOX2 homologs. The tree is rooted with Pezizomycotina ferric reductase sequences, which are highly related to the NOX family. These sequences and branches leading to them are shown in grey. (c) Maximum likelihood tree of WC1 homologs. (d) Maximum likelihood tree of CHS-7 and CHS-5 homologs. Nonparametric bootstrap support values are shown at the corresponding branches. Species coloring and abbreviations are as indicated in Fig. 1.
8
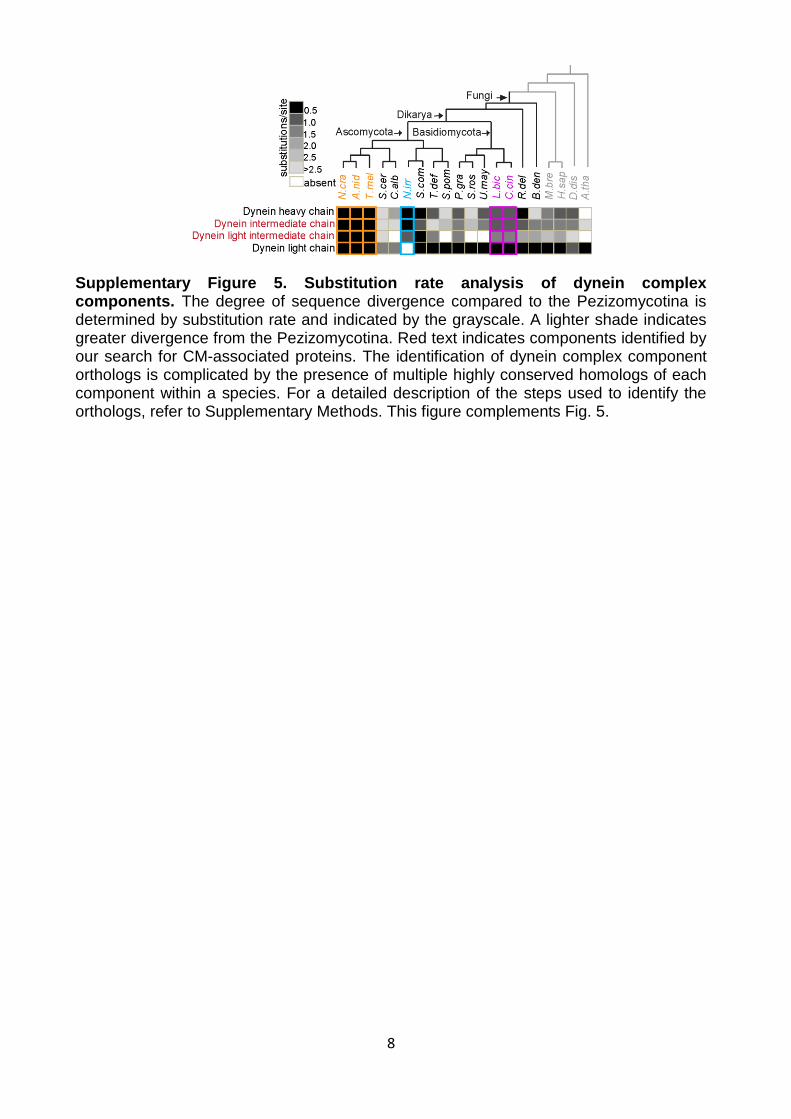
Supplementary Figure 5. Substitution rate analysis of dynein complex components. The degree of sequence divergence compared to the Pezizomycotina is determined by substitution rate and indicated by the grayscale. A lighter shade indicates greater divergence from the Pezizomycotina. Red text indicates components identified by our search for CM-associated proteins. The identification of dynein complex component orthologs is complicated by the presence of multiple highly conserved homologs of each component within a species. For a detailed description of the steps used to identify the orthologs, refer to Supplementary Methods. This figure complements Fig. 5.
9
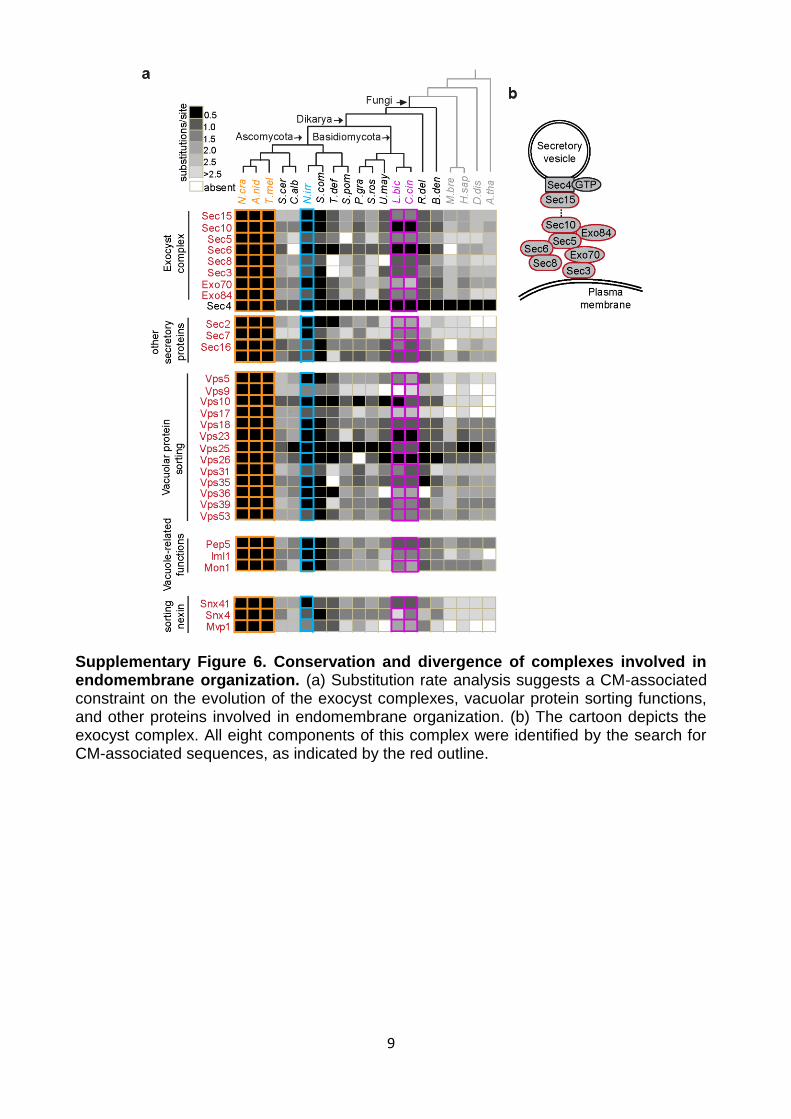
Supplementary Figure 6. Conservation and divergence of complexes involved in endomembrane organization. (a) Substitution rate analysis suggests a CM-associated constraint on the evolution of the exocyst complexes, vacuolar protein sorting functions, and other proteins involved in endomembrane organization. (b) The cartoon depicts the exocyst complex. All eight components of this complex were identified by the search for CM-associated sequences, as indicated by the red outline.
10
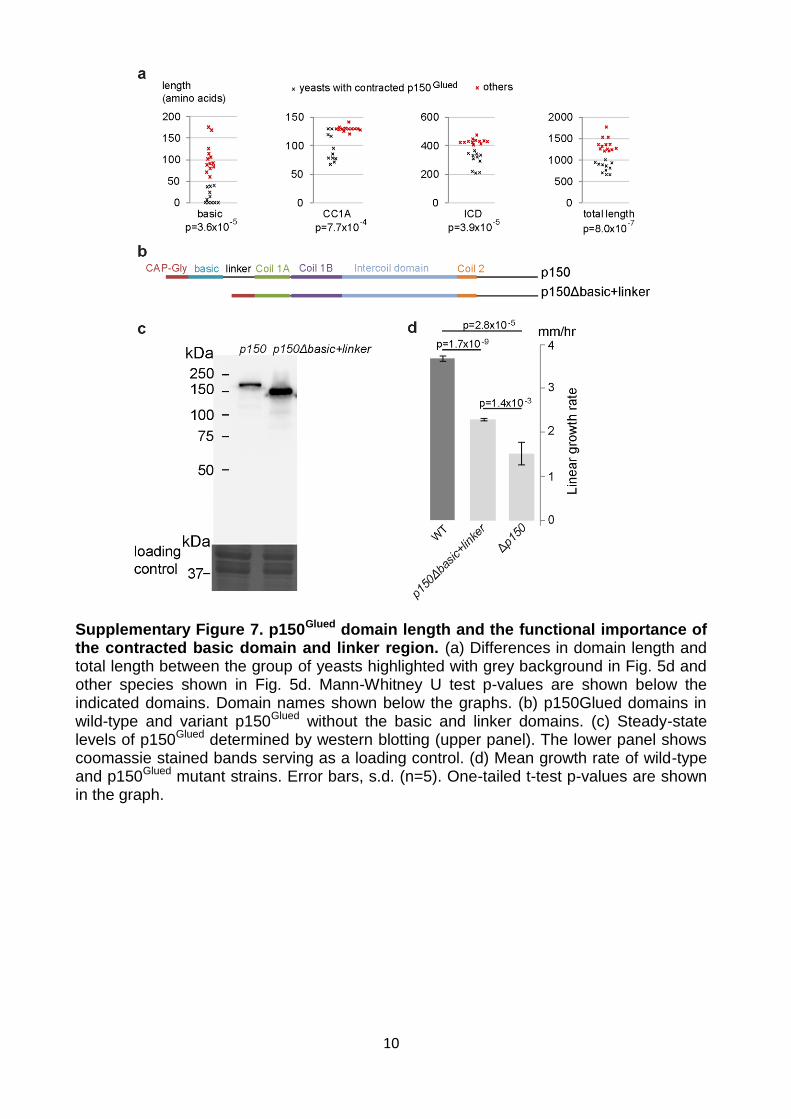
Supplementary Figure 7. p150Glued domain length and the functional importance of the contracted basic domain and linker region. (a) Differences in domain length and total length between the group of yeasts highlighted with grey background in Fig. 5d and other species shown in Fig. 5d. Mann-Whitney U test p-values are shown below the indicated domains. Domain names shown below the graphs. (b) p150Glued domains in wild-type and variant p150Glued without the basic and linker domains. (c) Steady-state levels of p150Glued determined by western blotting (upper panel). The lower panel shows coomassie stained bands serving as a loading control. (d) Mean growth rate of wild-type and p150Glued mutant strains. Error bars, s.d. (n=5). One-tailed t-test p-values are shown in the graph.
11
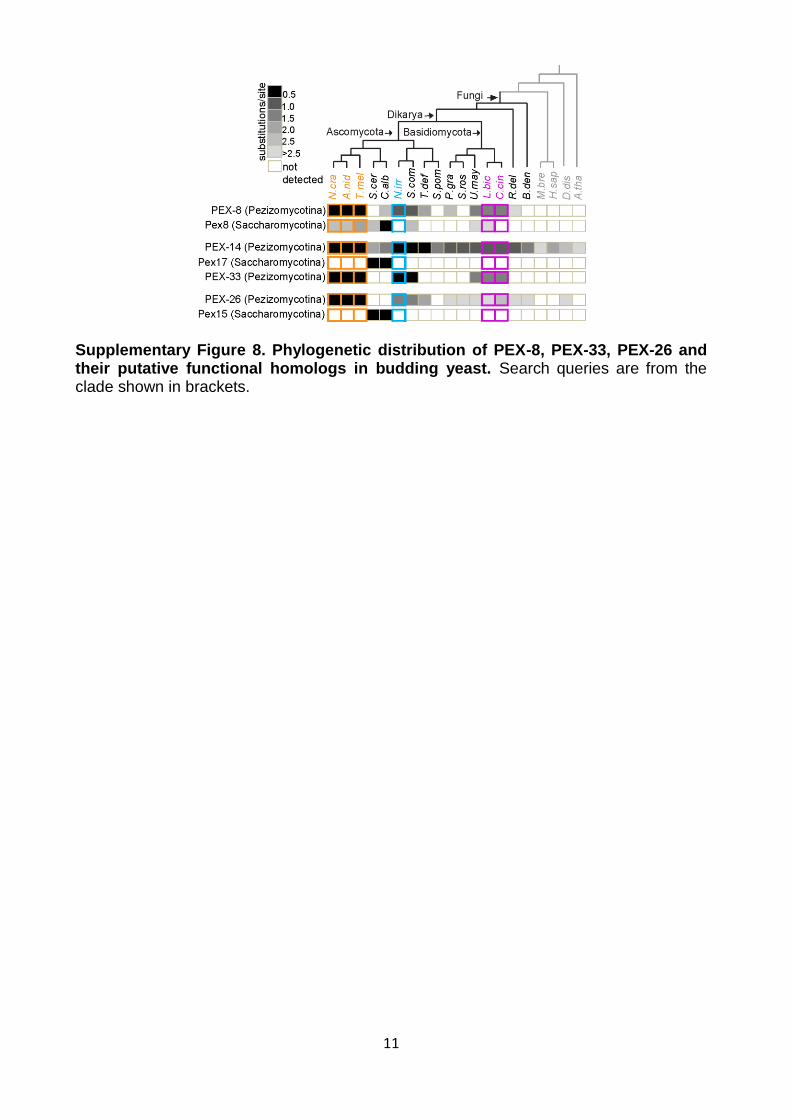
Supplementary Figure 8. Phylogenetic distribution of PEX-8, PEX-33, PEX-26 and their putative functional homologs in budding yeast. Search queries are from the clade shown in brackets.
12
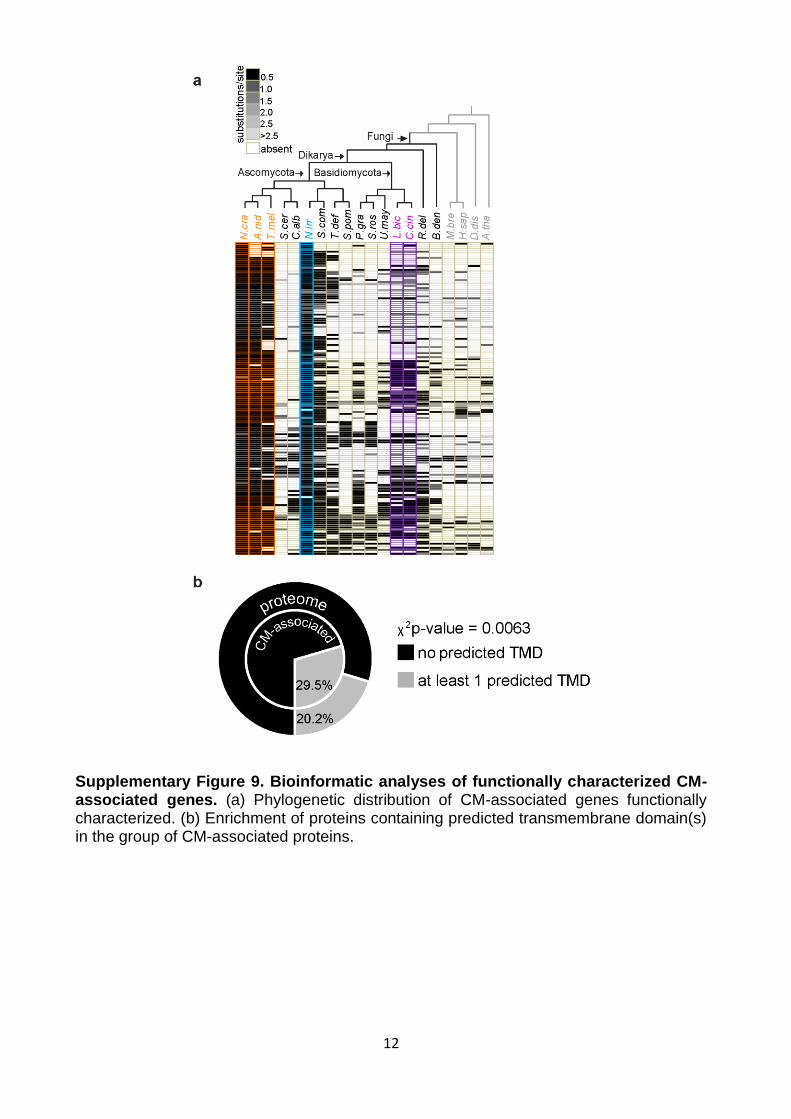
Supplementary Figure 9. Bioinformatic analyses of functionally characterized CM-associated genes. (a) Phylogenetic distribution of CM-associated genes functionally characterized. (b) Enrichment of proteins containing predicted transmembrane domain(s) in the group of CM-associated proteins.
13
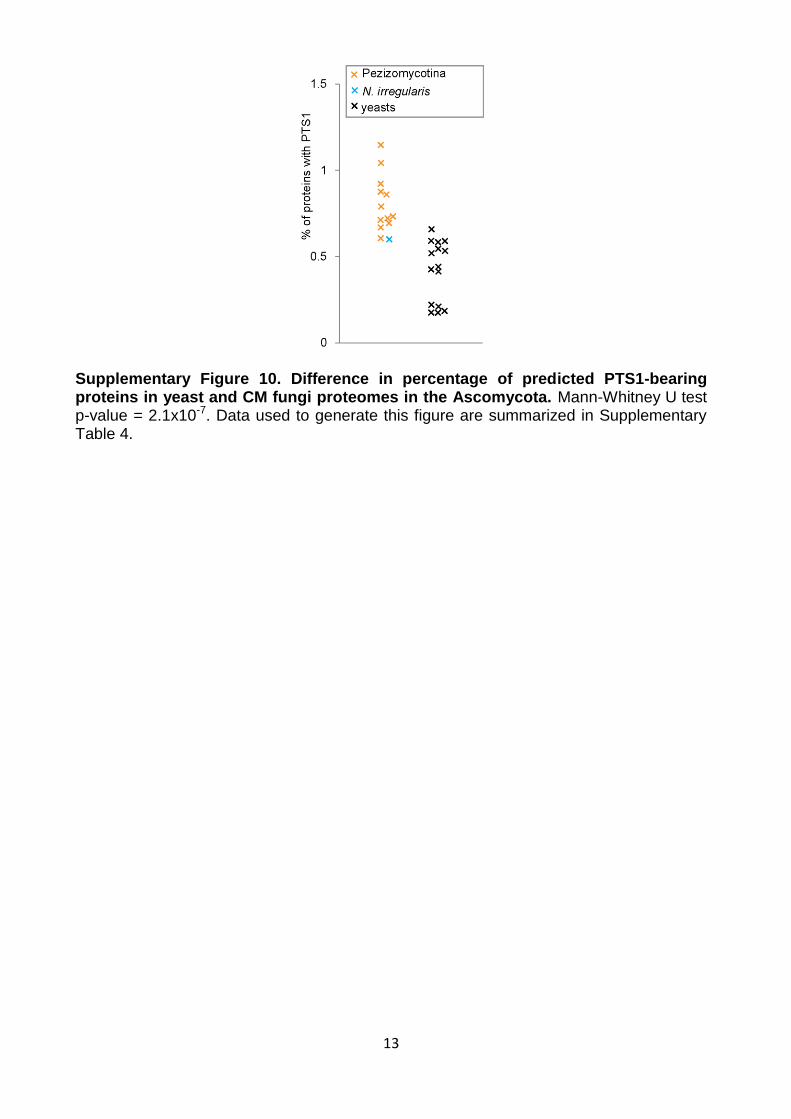
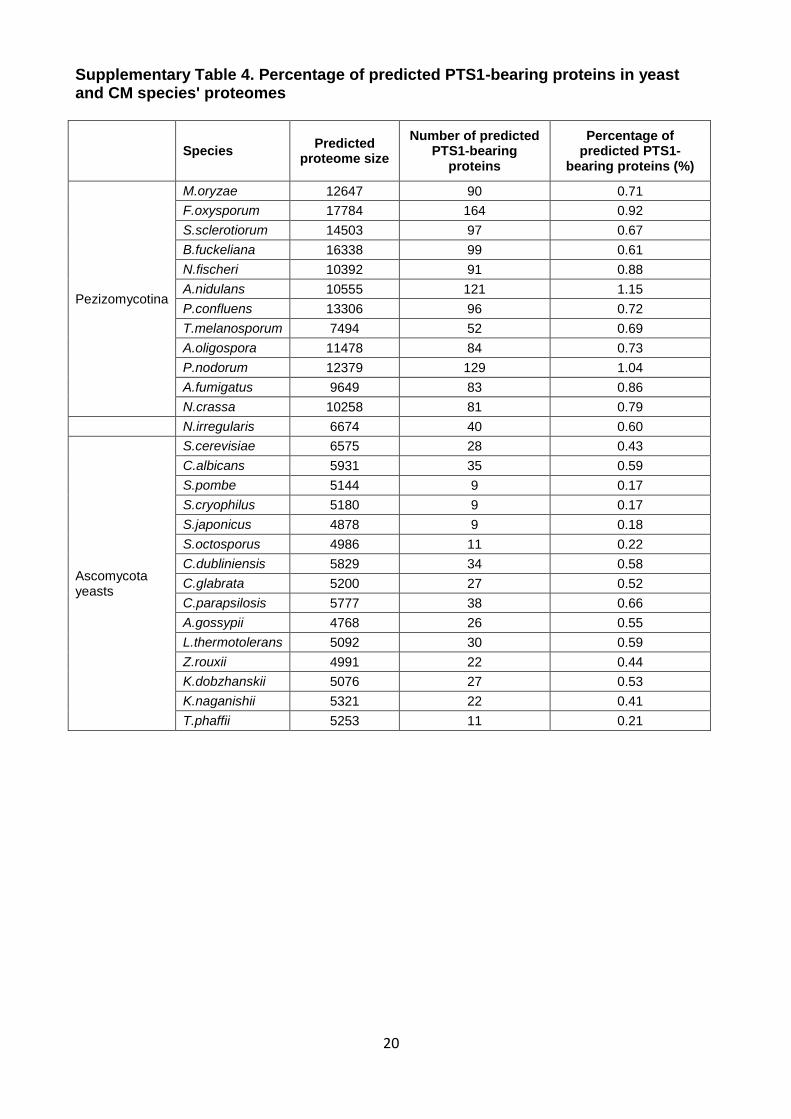
Supplementary Figure 10. Difference in percentage of predicted PTS1-bearing proteins in yeast and CM fungi proteomes in the Ascomycota. Mann-Whitney U test p-value = 2.1x10⁻⁷. Data used to generate this figure are summarized in Supplementary Table 4.
14
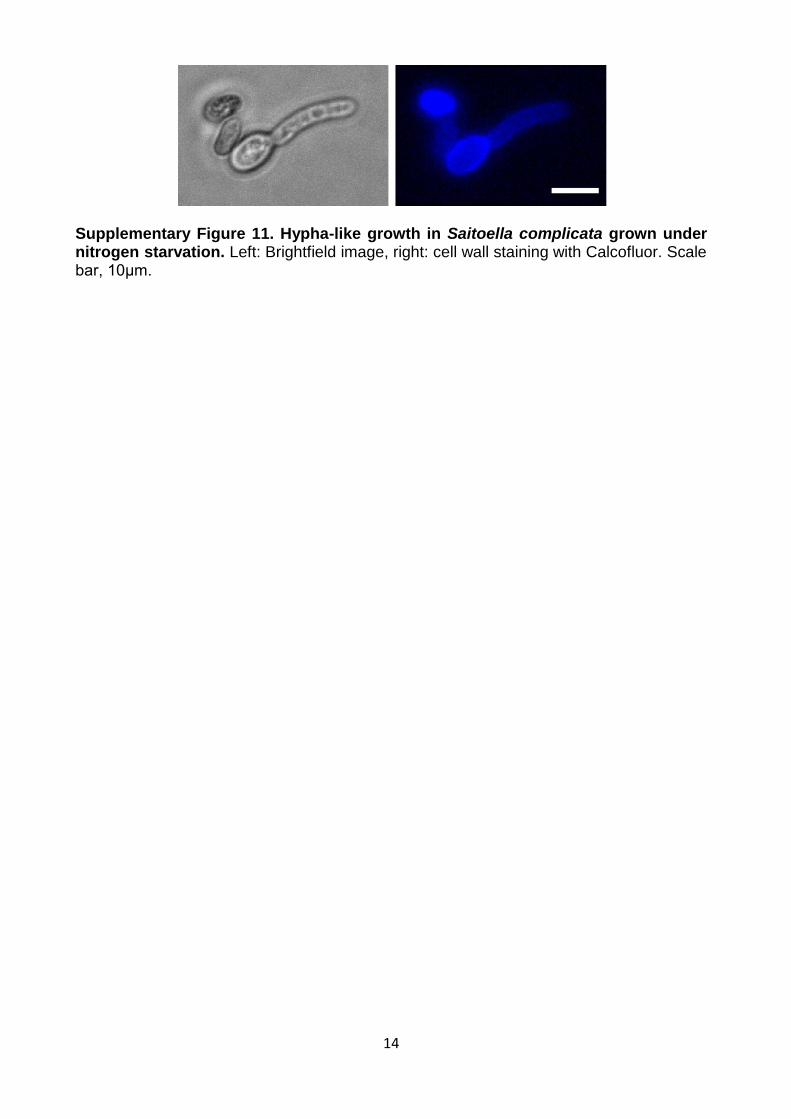
Supplementary Figure 11. Hypha-like growth in Saitoella complicata grown under nitrogen starvation. Left: Brightfield image, right: cell wall staining with Calcofluor. Scale bar, 10μm.
15
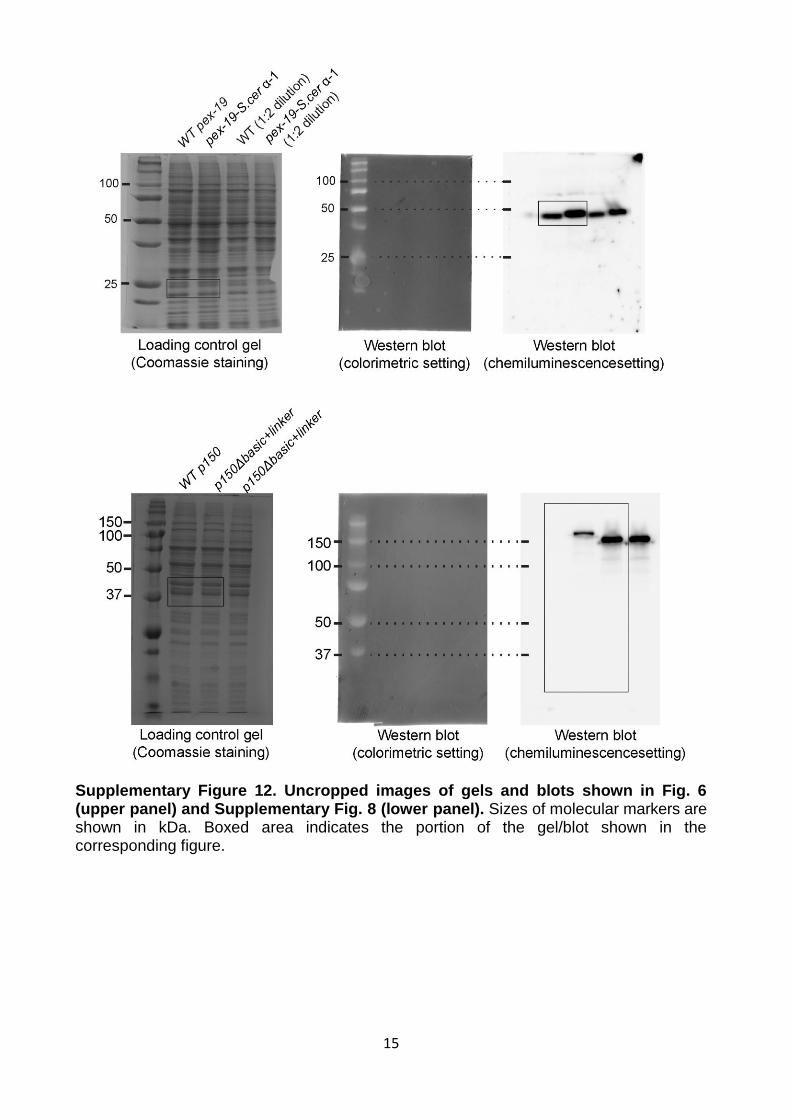
Supplementary Figure 12. Uncropped images of gels and blots shown in Fig. 6 (upper panel) and Supplementary Fig. 8 (lower panel). Sizes of molecular markers are shown in kDa. Boxed area indicates the portion of the gel/blot shown in the corresponding figure.
16
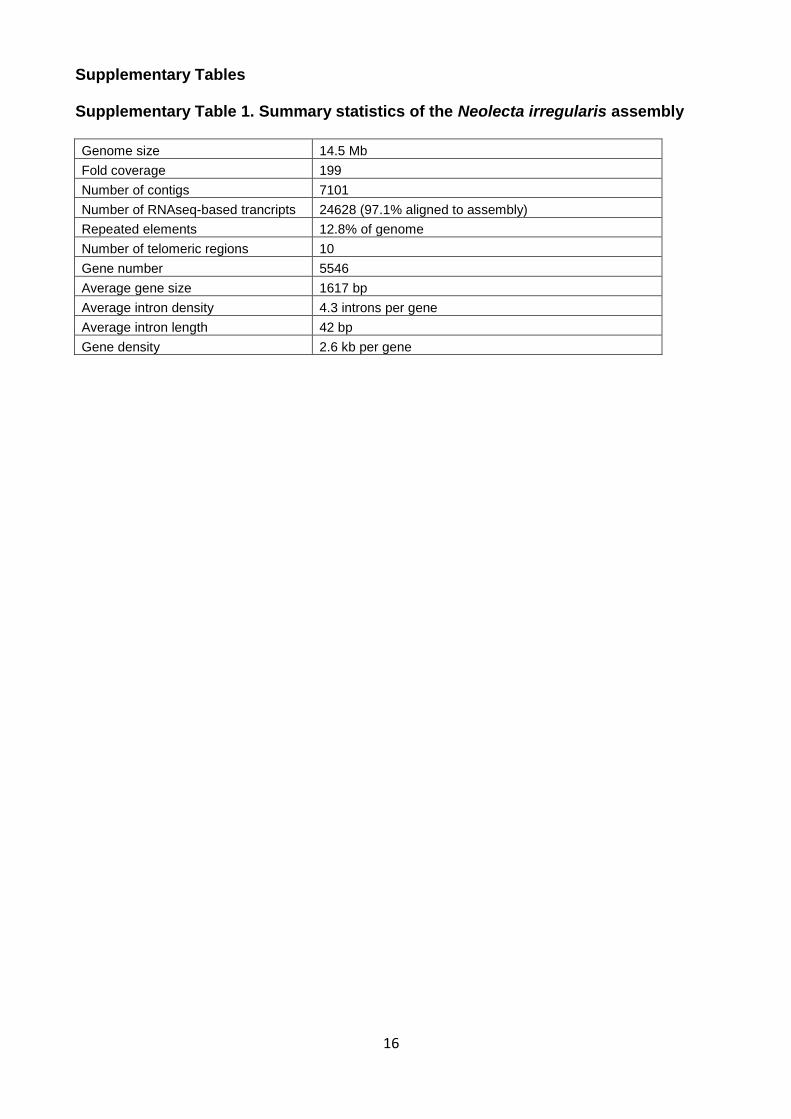
Supplementary Tables Supplementary Table 1. Summary statistics of the Neolecta irregularis assembly
Genome size 14.5 Mb
Fold coverage 199
Number of contigs 7101
Number of RNAseq-based trancripts 24628 (97.1% aligned to assembly)
Repeated elements 12.8% of genome
Number of telomeric regions 10
Gene number 5546
Average gene size 1617 bp
Average intron density 4.3 introns per gene
Average intron length 42 bp
Gene density 2.6 kb per gene
17
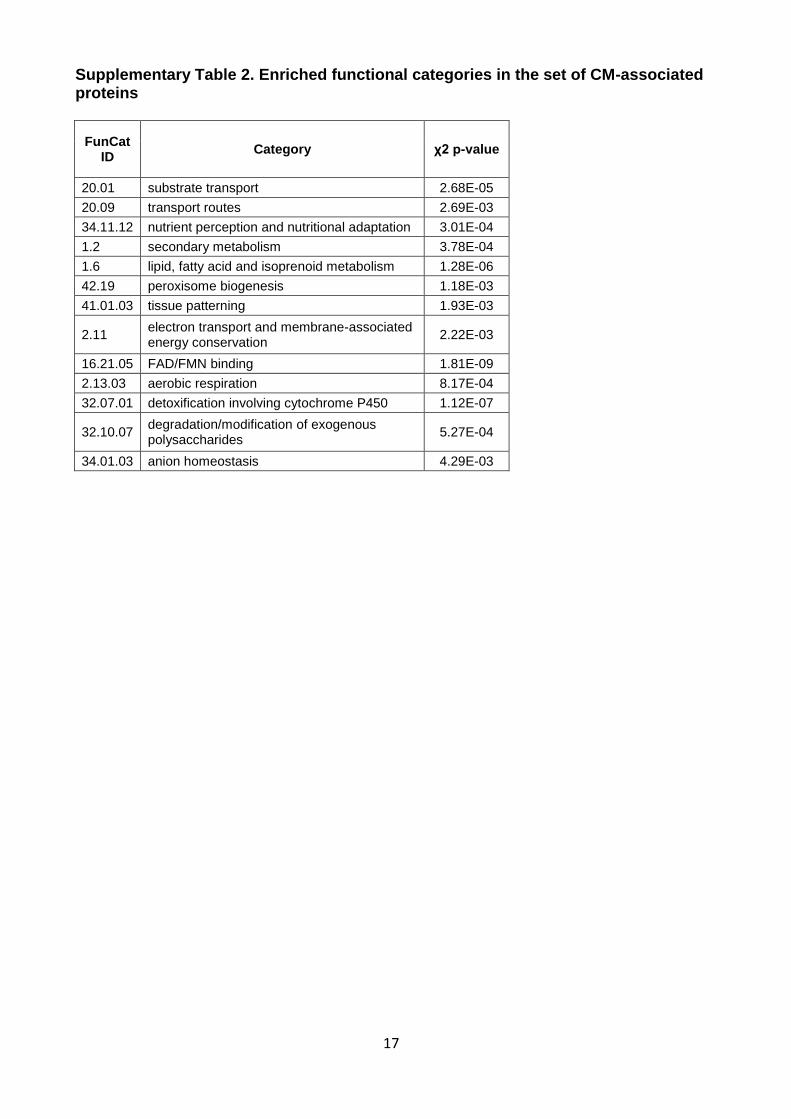
Supplementary Table 2. Enriched functional categories in the set of CM-associated proteins
FunCat ID
Category χ2 p-value
20.01 substrate transport 2.68E-05
20.09 transport routes 2.69E-03
34.11.12 nutrient perception and nutritional adaptation 3.01E-04
1.2 secondary metabolism 3.78E-04
1.6 lipid, fatty acid and isoprenoid metabolism 1.28E-06
42.19 peroxisome biogenesis 1.18E-03
41.01.03 tissue patterning 1.93E-03
2.11 electron transport and membrane-associated energy conservation
2.22E-03
16.21.05 FAD/FMN binding 1.81E-09
2.13.03 aerobic respiration 8.17E-04
32.07.01 detoxification involving cytochrome P450 1.12E-07
32.10.07 degradation/modification of exogenous polysaccharides
5.27E-04
34.01.03 anion homeostasis 4.29E-03
18
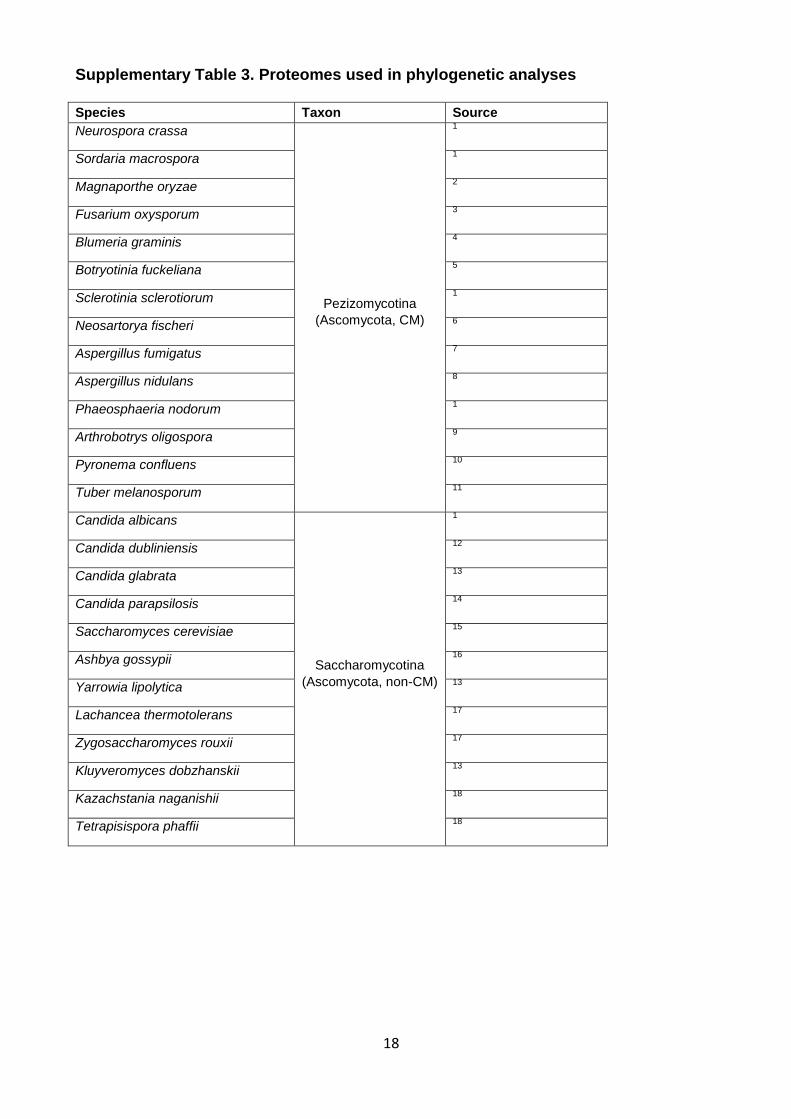
Supplementary Table 3. Proteomes used in phylogenetic analyses Species Taxon Source
Neurospora crassa
Pezizomycotina
(Ascomycota, CM)
1
Sordaria macrospora 1
Magnaporthe oryzae 2
Fusarium oxysporum 3
Blumeria graminis 4
Botryotinia fuckeliana 5
Sclerotinia sclerotiorum 1
Neosartorya fischeri 6
Aspergillus fumigatus 7
Aspergillus nidulans 8
Phaeosphaeria nodorum 1
Arthrobotrys oligospora 9
Pyronema confluens 10
Tuber melanosporum 11
Candida albicans
Saccharomycotina
(Ascomycota, non-CM)
1
Candida dubliniensis 12
Candida glabrata 13
Candida parapsilosis 14
Saccharomyces cerevisiae 15
Ashbya gossypii 16
Yarrowia lipolytica 13
Lachancea thermotolerans 17
Zygosaccharomyces rouxii 17
Kluyveromyces dobzhanskii 13
Kazachstania naganishii 18
Tetrapisispora phaffii 18
19
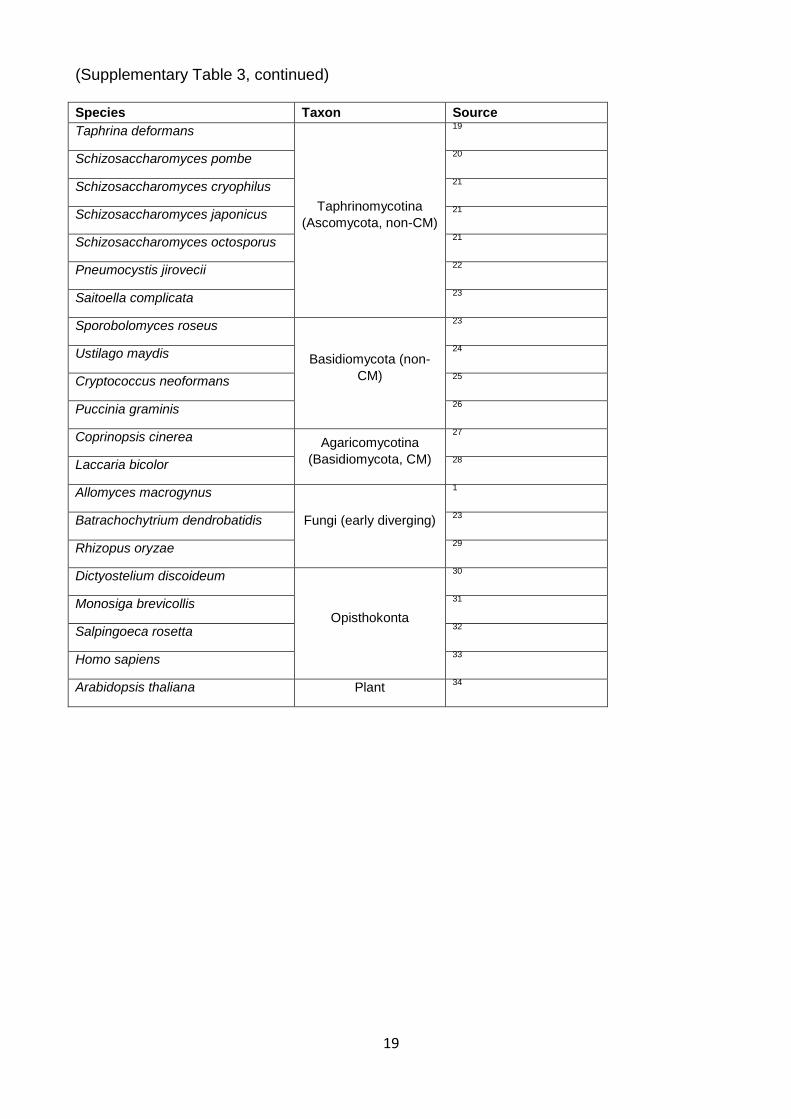
(Supplementary Table 3, continued) Species Taxon Source
Taphrina deformans
Taphrinomycotina
(Ascomycota, non-CM)
19
Schizosaccharomyces pombe 20
Schizosaccharomyces cryophilus 21
Schizosaccharomyces japonicus 21
Schizosaccharomyces octosporus 21
Pneumocystis jirovecii 22
Saitoella complicata 23
Sporobolomyces roseus
Basidiomycota (non-
CM)
23
Ustilago maydis 24
Cryptococcus neoformans 25
Puccinia graminis 26
Coprinopsis cinerea Agaricomycotina
(Basidiomycota, CM)
27
Laccaria bicolor 28
Allomyces macrogynus
Fungi (early diverging)
1
Batrachochytrium dendrobatidis 23
Rhizopus oryzae 29
Dictyostelium discoideum
Opisthokonta
30
Monosiga brevicollis 31
Salpingoeca rosetta 32
Homo sapiens 33
Arabidopsis thaliana Plant 34
20
Supplementary Table 4. Percentage of predicted PTS1-bearing proteins in yeast and CM species' proteomes
Species Predicted
proteome size
Number of predicted PTS1-bearing
proteins
Percentage of predicted PTS1-
bearing proteins (%)
Pezizomycotina
M.oryzae 12647 90 0.71
F.oxysporum 17784 164 0.92
S.sclerotiorum 14503 97 0.67
B.fuckeliana 16338 99 0.61
N.fischeri 10392 91 0.88
A.nidulans 10555 121 1.15
P.confluens 13306 96 0.72
T.melanosporum 7494 52 0.69
A.oligospora 11478 84 0.73
P.nodorum 12379 129 1.04
A.fumigatus 9649 83 0.86
N.crassa 10258 81 0.79
N.irregularis 6674 40 0.60
Ascomycota yeasts
S.cerevisiae 6575 28 0.43
C.albicans 5931 35 0.59
S.pombe 5144 9 0.17
S.cryophilus 5180 9 0.17
S.japonicus 4878 9 0.18
S.octosporus 4986 11 0.22
C.dubliniensis 5829 34 0.58
C.glabrata 5200 27 0.52
C.parapsilosis 5777 38 0.66
A.gossypii 4768 26 0.55
L.thermotolerans 5092 30 0.59
Z.rouxii 4991 22 0.44
K.dobzhanskii 5076 27 0.53
K.naganishii 5321 22 0.41
T.phaffii 5253 11 0.21
21
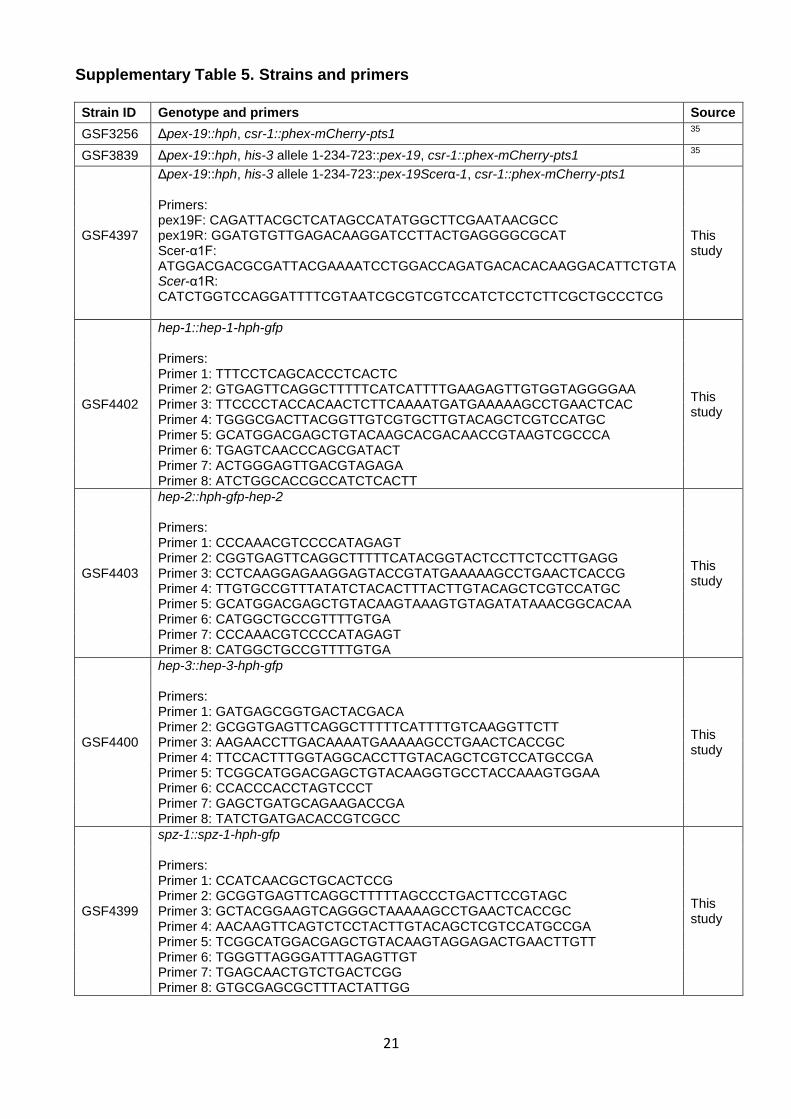
Supplementary Table 5. Strains and primers Strain ID Genotype and primers Source
GSF3256 Δpex-19::hph, csr-1::phex-mCherry-pts1 35
GSF3839 Δpex-19::hph, his-3 allele 1-234-723::pex-19, csr-1::phex-mCherry-pts1 35
GSF4397
Δpex-19::hph, his-3 allele 1-234-723::pex-19Scerα-1, csr-1::phex-mCherry-pts1 Primers: pex19F: CAGATTACGCTCATAGCCATATGGCTTCGAATAACGCC pex19R: GGATGTGTTGAGACAAGGATCCTTACTGAGGGGCGCAT Scer-α1F: ATGGACGACGCGATTACGAAAATCCTGGACCAGATGACACACAAGGACATTCTGTA Scer-α1R: CATCTGGTCCAGGATTTTCGTAATCGCGTCGTCCATCTCCTCTTCGCTGCCCTCG
This study
GSF4402
hep-1::hep-1-hph-gfp Primers: Primer 1: TTTCCTCAGCACCCTCACTC Primer 2: GTGAGTTCAGGCTTTTTCATCATTTTGAAGAGTTGTGGTAGGGGAA Primer 3: TTCCCCTACCACAACTCTTCAAAATGATGAAAAAGCCTGAACTCAC Primer 4: TGGGCGACTTACGGTTGTCGTGCTTGTACAGCTCGTCCATGC Primer 5: GCATGGACGAGCTGTACAAGCACGACAACCGTAAGTCGCCCA Primer 6: TGAGTCAACCCAGCGATACT Primer 7: ACTGGGAGTTGACGTAGAGA Primer 8: ATCTGGCACCGCCATCTCACTT
This study
GSF4403
hep-2::hph-gfp-hep-2 Primers: Primer 1: CCCAAACGTCCCCATAGAGT Primer 2: CGGTGAGTTCAGGCTTTTTCATACGGTACTCCTTCTCCTTGAGG Primer 3: CCTCAAGGAGAAGGAGTACCGTATGAAAAAGCCTGAACTCACCG Primer 4: TTGTGCCGTTTATATCTACACTTTACTTGTACAGCTCGTCCATGC Primer 5: GCATGGACGAGCTGTACAAGTAAAGTGTAGATATAAACGGCACAA Primer 6: CATGGCTGCCGTTTTGTGA Primer 7: CCCAAACGTCCCCATAGAGT Primer 8: CATGGCTGCCGTTTTGTGA
This study
GSF4400
hep-3::hep-3-hph-gfp Primers: Primer 1: GATGAGCGGTGACTACGACA Primer 2: GCGGTGAGTTCAGGCTTTTTCATTTTGTCAAGGTTCTT Primer 3: AAGAACCTTGACAAAATGAAAAAGCCTGAACTCACCGC Primer 4: TTCCACTTTGGTAGGCACCTTGTACAGCTCGTCCATGCCGA Primer 5: TCGGCATGGACGAGCTGTACAAGGTGCCTACCAAAGTGGAA Primer 6: CCACCCACCTAGTCCCT Primer 7: GAGCTGATGCAGAAGACCGA Primer 8: TATCTGATGACACCGTCGCC
This study
GSF4399
spz-1::spz-1-hph-gfp Primers: Primer 1: CCATCAACGCTGCACTCCG Primer 2: GCGGTGAGTTCAGGCTTTTTAGCCCTGACTTCCGTAGC Primer 3: GCTACGGAAGTCAGGGCTAAAAAGCCTGAACTCACCGC Primer 4: AACAAGTTCAGTCTCCTACTTGTACAGCTCGTCCATGCCGA Primer 5: TCGGCATGGACGAGCTGTACAAGTAGGAGACTGAACTTGTT Primer 6: TGGGTTAGGGATTTAGAGTTGT Primer 7: TGAGCAACTGTCTGACTCGG Primer 8: GTGCGAGCGCTTTACTATTGG
This study
22
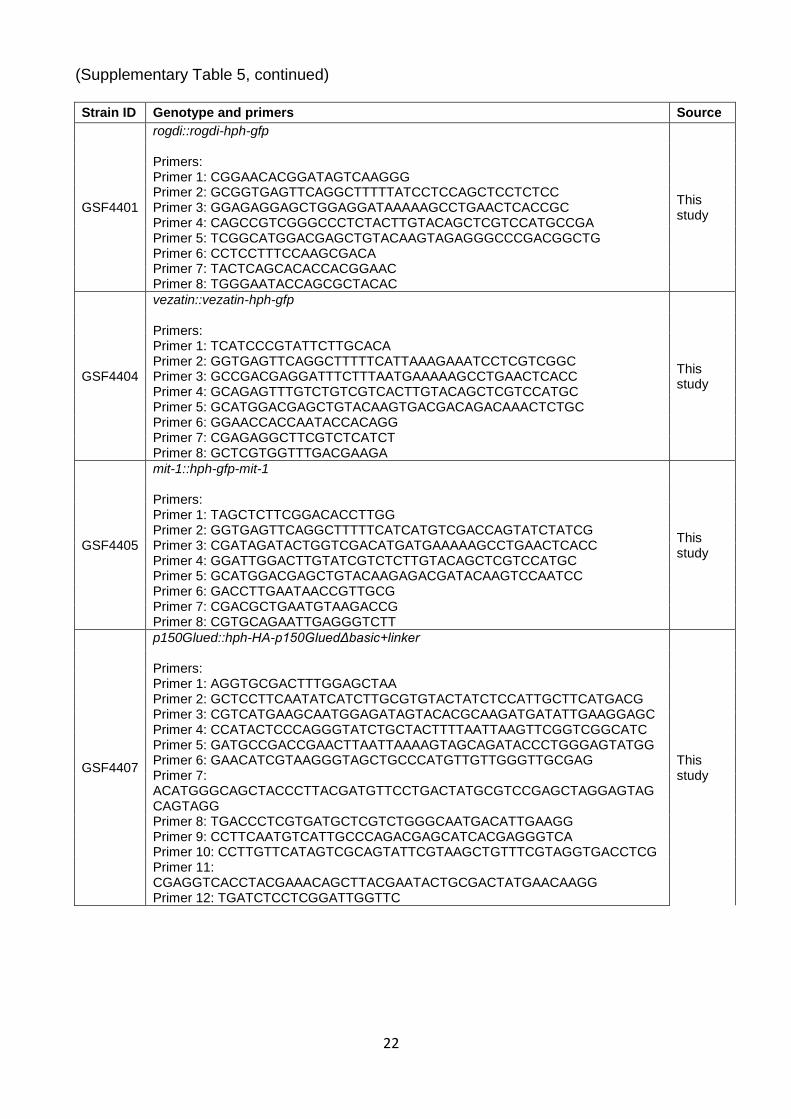
(Supplementary Table 5, continued) Strain ID Genotype and primers Source
GSF4401
rogdi::rogdi-hph-gfp Primers: Primer 1: CGGAACACGGATAGTCAAGGG Primer 2: GCGGTGAGTTCAGGCTTTTTATCCTCCAGCTCCTCTCC Primer 3: GGAGAGGAGCTGGAGGATAAAAAGCCTGAACTCACCGC Primer 4: CAGCCGTCGGGCCCTCTACTTGTACAGCTCGTCCATGCCGA Primer 5: TCGGCATGGACGAGCTGTACAAGTAGAGGGCCCGACGGCTG Primer 6: CCTCCTTTCCAAGCGACA Primer 7: TACTCAGCACACCACGGAAC Primer 8: TGGGAATACCAGCGCTACAC
This study
GSF4404
vezatin::vezatin-hph-gfp
Primers: Primer 1: TCATCCCGTATTCTTGCACA Primer 2: GGTGAGTTCAGGCTTTTTCATTAAAGAAATCCTCGTCGGC Primer 3: GCCGACGAGGATTTCTTTAATGAAAAAGCCTGAACTCACC Primer 4: GCAGAGTTTGTCTGTCGTCACTTGTACAGCTCGTCCATGC Primer 5: GCATGGACGAGCTGTACAAGTGACGACAGACAAACTCTGC Primer 6: GGAACCACCAATACCACAGG Primer 7: CGAGAGGCTTCGTCTCATCT Primer 8: GCTCGTGGTTTGACGAAGA
This study
GSF4405
mit-1::hph-gfp-mit-1 Primers: Primer 1: TAGCTCTTCGGACACCTTGG Primer 2: GGTGAGTTCAGGCTTTTTCATCATGTCGACCAGTATCTATCG Primer 3: CGATAGATACTGGTCGACATGATGAAAAAGCCTGAACTCACC Primer 4: GGATTGGACTTGTATCGTCTCTTGTACAGCTCGTCCATGC Primer 5: GCATGGACGAGCTGTACAAGAGACGATACAAGTCCAATCC Primer 6: GACCTTGAATAACCGTTGCG Primer 7: CGACGCTGAATGTAAGACCG Primer 8: CGTGCAGAATTGAGGGTCTT
This study
GSF4407
p150Glued::hph-HA-p150GluedΔbasic+linker Primers: Primer 1: AGGTGCGACTTTGGAGCTAA Primer 2: GCTCCTTCAATATCATCTTGCGTGTACTATCTCCATTGCTTCATGACG Primer 3: CGTCATGAAGCAATGGAGATAGTACACGCAAGATGATATTGAAGGAGC Primer 4: CCATACTCCCAGGGTATCTGCTACTTTTAATTAAGTTCGGTCGGCATC Primer 5: GATGCCGACCGAACTTAATTAAAAGTAGCAGATACCCTGGGAGTATGG Primer 6: GAACATCGTAAGGGTAGCTGCCCATGTTGTTGGGTTGCGAG Primer 7: ACATGGGCAGCTACCCTTACGATGTTCCTGACTATGCGTCCGAGCTAGGAGTAG CAGTAGG Primer 8: TGACCCTCGTGATGCTCGTCTGGGCAATGACATTGAAGG Primer 9: CCTTCAATGTCATTGCCCAGACGAGCATCACGAGGGTCA Primer 10: CCTTGTTCATAGTCGCAGTATTCGTAAGCTGTTTCGTAGGTGACCTCG Primer 11: CGAGGTCACCTACGAAACAGCTTACGAATACTGCGACTATGAACAAGG Primer 12: TGATCTCCTCGGATTGGTTC
This study
23
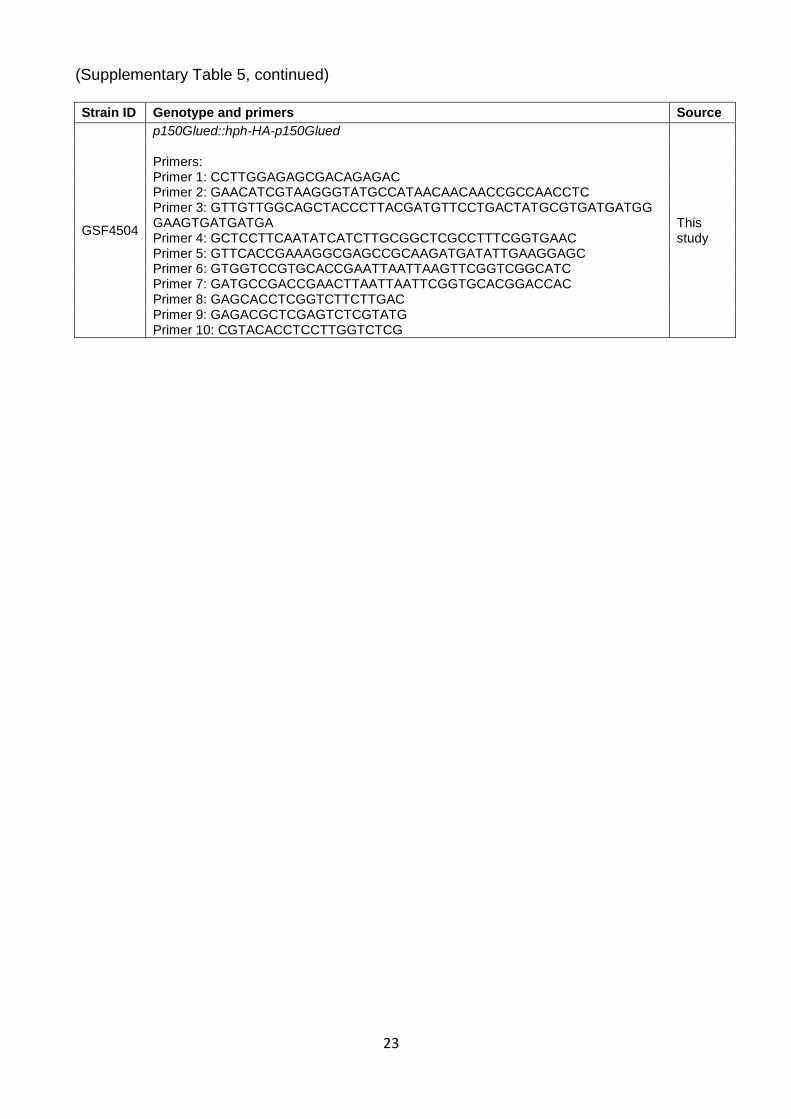
(Supplementary Table 5, continued) Strain ID Genotype and primers Source
GSF4504
p150Glued::hph-HA-p150Glued Primers: Primer 1: CCTTGGAGAGCGACAGAGAC Primer 2: GAACATCGTAAGGGTATGCCATAACAACAACCGCCAACCTC Primer 3: GTTGTTGGCAGCTACCCTTACGATGTTCCTGACTATGCGTGATGATGG GAAGTGATGATGA Primer 4: GCTCCTTCAATATCATCTTGCGGCTCGCCTTTCGGTGAAC Primer 5: GTTCACCGAAAGGCGAGCCGCAAGATGATATTGAAGGAGC Primer 6: GTGGTCCGTGCACCGAATTAATTAAGTTCGGTCGGCATC Primer 7: GATGCCGACCGAACTTAATTAATTCGGTGCACGGACCAC Primer 8: GAGCACCTCGGTCTTCTTGAC Primer 9: GAGACGCTCGAGTCTCGTATG Primer 10: CGTACACCTCCTTGGTCTCG
This study
24
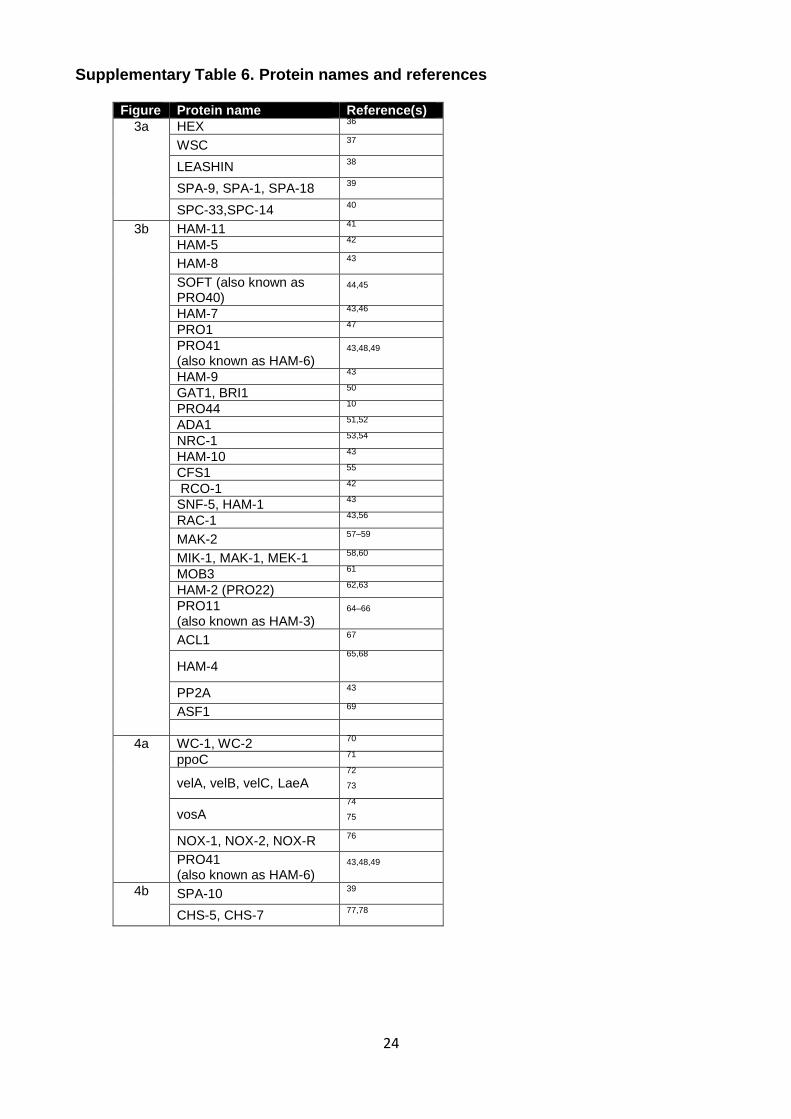
Supplementary Table 6. Protein names and references
Figure Protein name Reference(s)
3a HEX 36
WSC 37
LEASHIN 38
SPA-9, SPA-1, SPA-18 39
SPC-33,SPC-14 40
3b HAM-11 41
HAM-5 42
HAM-8 43
SOFT (also known as PRO40)
44,45
HAM-7 43,46
PRO1 47
PRO41 (also known as HAM-6)
43,48,49
HAM-9 43
GAT1, BRI1 50
PRO44 10
ADA1 51,52
NRC-1 53,54
HAM-10 43
CFS1 55
RCO-1 42
SNF-5, HAM-1 43
RAC-1 43,56
MAK-2 57–59
MIK-1, MAK-1, MEK-1 58,60
MOB3 61
HAM-2 (PRO22) 62,63
PRO11 (also known as HAM-3)
64–66
ACL1 67
HAM-4 65,68
PP2A 43
ASF1 69
4a WC-1, WC-2 70
ppoC 71
velA, velB, velC, LaeA 72
73
vosA 74
75
NOX-1, NOX-2, NOX-R 76
PRO41 (also known as HAM-6)
43,48,49
4b SPA-10 39
CHS-5, CHS-7 77,78
25
Supplementary Methods
Genome and transcriptome sequencing and assembly
Neolecta irregularis fruiting bodies were collected on Black Mountain, New
Hampshire and stored at -80oC. Paired-end genomic DNA was sequenced using the
TruSeq Illumina protocol (33.8 Gb of data, insert size = 300 bp). Reads were assembled
using Velvet79. Total RNA was sequenced using Illumina paired-end technology (6.6 Gb
of data). Transcriptome alignment and gene expression assessment were performed
using Tophat80 and Cufflinks81. de novo assembly was performed with Trinity82.
Transcripts were aligned to the genome assembly using PASA83.
Annotation and phylogeny
Full-length transcripts were selected from PASA output and used to train
AUGUSTUS84 and SNAP85. GenMark-ES was self-trained on genome sequence86. Ab
initio predictions, homology and transcriptome based evidences were merged into gene
models using MAKER87.
To build the species tree, we extracted 110 single copy orthologs from OrthoMCL
clustering. Each cluster was aligned independently using T-Coffee88 and merged.
Ambiguous regions were removed using Trimal89 with automated option. The final matrix
contains 33,355 sites and 2.18% of proportions of gaps and undetermined characters.
The best-fit model was determined using RAxML90 with ProteinModelSelection function.
The maximum likelihood phylogeny was inferred using RAxML with the LG model91 and
100 bootstrap replicates.
Gene family gain-loss and expansion analyses
Proteome clustering of 20 species (Supplementary Table 3) was performed with
OrthoMCL v292 using 2.0 inflation parameter and ssearch3693 (e-value = 1e-4). Gene
family gains and losses were projected onto species phylogeny using Dollo parsimony
with Count94. As an unavoidable consequence of a limited number of species, proteins
26
with restricted taxonomic distribution which do not have detectable homologs in any other
species included are not assigned to any families by OrthoMCL. These were mapped to
the nodes where they are likely to have originated using their blast output against the nr
database (BLASTP, e-value = 1e-15).
Gene family size variation was computed using CAFE395 (p-value = 0.05) to
search for expanded gene families in Neolecta. Duplications of the fungus-specific
transcription factor subfamily were analyzed by examining homologous sequences
retrieved using phmmer (e-value = 1e-5) with NEOLI_001080T0 as query. Sequences
were aligned with MCoffee88. The resulting alignment was trimmed using trimAl89 with -
automated1 option. The phylogenetic tree was generated using RAxML90 v.8.1.20 with
100 bootstraps. The final alignment contains 242 alignment characters and 7.73% of
proportions of gaps and undetermined characters. The tree was visualized using FigTree
(http://tree.bio.ed.ac.uk/software/Figtree/).
Identification of dynein complex component orthologs
Components of the dynein complex are present in different copy numbers in
different species, which makes it insufficient to identify orthologs by searching for
reciprocal best BLAST hits. Because of the difficulties in identifying true orthologs caused
by a high level of conservation among all copies of the same gene, we limited our
analysis to the four main components of the dynein complex: heavy chain 1 (DYNC1H1,
Q14204), intermediate chain 1 (DYNC1I1, O14576), light intermediate chain 1
(DYNC1LI1, Q9Y6G9), and light chain 1 (DYNLL1, P63167). Homo sapiens sequences
were first queried against target proteomes using BLASTp. The top 4 hits from each
target proteomes were extracted. These hits were used to build a multiple sequence
alignment using MUSCLE96, which was then trimmed using trimAl89 (gap cutoff 0.8 and
conservation cutoff 0.5) and used to construct a maximum likelihood tree using PhyML97.
The hit from each target species that is most closely clustered with the initial H. sapiens
27
query sequence in the resulting tree was considered an ortholog of the query sequence,
and included in our analysis shown in Supplementary Fig. 5.
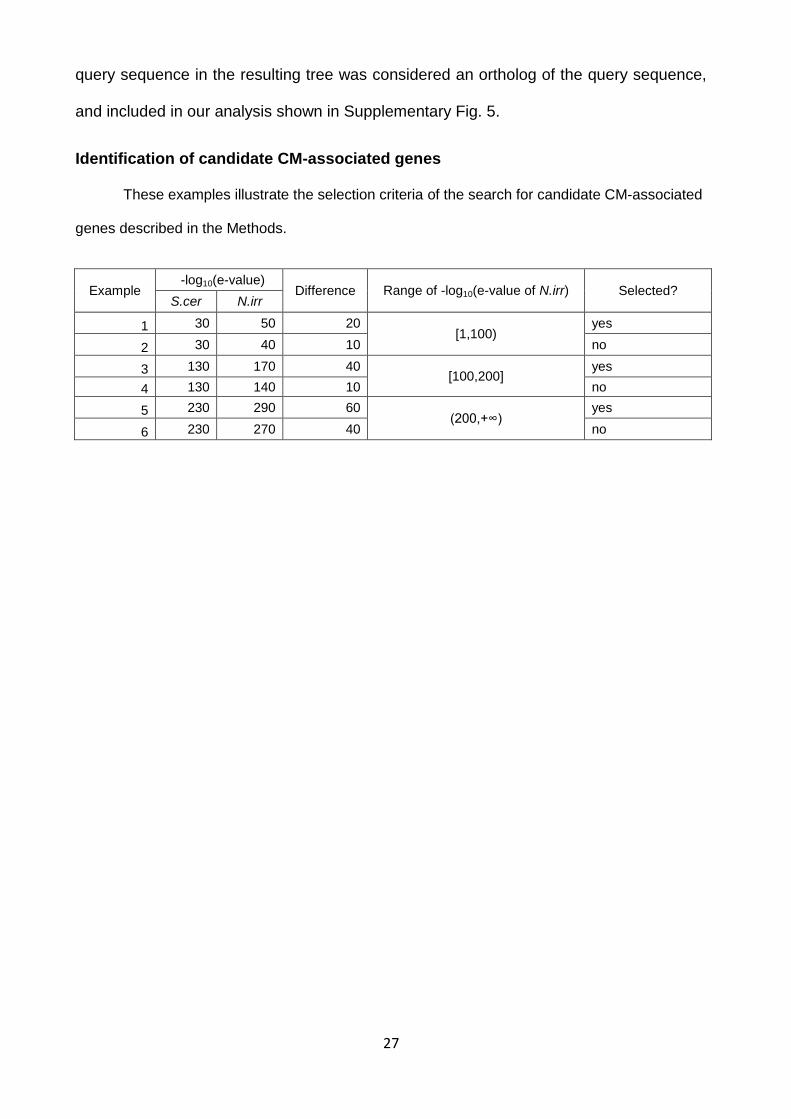
Identification of candidate CM-associated genes These examples illustrate the selection criteria of the search for candidate CM-associated
genes described in the Methods.
Example -log10(e-value)
Difference Range of -log10(e-value of N.irr) Selected? S.cer N.irr
1 30 50 20 [1,100)
yes
2 30 40 10 no
3 130 170 40 [100,200]
yes
4 130 140 10 no
5 230 290 60 (200,+∞)
yes
6 230 270 40 no
28
Supplementary References 1. Broad Institute. at <https://www.broadinstitute.org/> 2. Dean, R. A. et al. The genome sequence of the rice blast fungus Magnaporthe
grisea. 434, (2005). 3. Ma, L. J., van der Does, H. C., Borkovich, K. a & Al, E. Comparative analysis
reveals mobile pathogenicity chromosomes in Fusarium. Nature 464, 367–373 (2010).
4. Spanu, P. D. et al. Genome expansion and gene loss in powdery mildew fungi reveal tradeoffs in extreme parasitism. Science. 330, 1543–1546 (2010).
5. Amselem, J. et al. Genomic analysis of the necrotrophic fungal pathogens Sclerotinia sclerotiorum and Botrytis cinerea. PLoS Genet. 7, (2011).
6. Fedorova, N. D. et al. Genomic islands in the pathogenic filamentous fungus Aspergillus fumigatus. PLoS Genet. 4, (2008).
7. Nierman, W. et al. Genomic sequence of the pathogenic and allergenic filamentous fungus Aspergillus fumigatus. Nature 438, 1151–6 (2005).
8. Galagan, J. E. et al. Sequencing of Aspergillus nidulans and comparative analysis with A. fumigatus and A. oryzae. Nature 438, 1105–1115 (2005).
9. Yang, J. et al. Genomic and proteomic analyses of the fungus Arthrobotrys oligospora provide insights into nematode-trap formation. PLoS Pathog. 7, (2011).
10. Traeger, S. et al. The Genome and Development-Dependent Transcriptomes of Pyronema confluens: A Window into Fungal Evolution. PLoS Genet. 9, e1003820 (2013).
11. Martin, F. et al. Périgord black truffle genome uncovers evolutionary origins and mechanisms of symbiosis. Nature 464, 1033–8 (2010).
12. Jackson, A. P. et al. Comparative genomics of the fungal pathogens Candida dubliniensis and Candida albicans. Genome Res. 19, 2231–2244 (2009).
13. Dujon, B. et al. Genome evolution in yeasts. Nature 430, 35–44 (2004). 14. Butler, G. et al. Evolution of pathogenicity and sexual reproduction in eight Candida
genomes. Nature 459, 657–662 (2009). 15. Goffeau, A. et al. Life with 6000 Genes. Science. 274, 546–567 (1996). 16. Dietrich, F. S. et al. The Ashbya gossypii genome as a tool for mapping the ancient
Saccharomyces cerevisiae genome. Science 304, 304–7 (2004). 17. Souciet, J.-L. et al. Comparative genomics of protoploid Saccharomycetaceae.
Genome Res. 19, 1696–1709 (2009). 18. Gordon, J. L. et al. Evolutionary erosion of yeast sex chromosomes by mating-type
switching accidents. Proc. Natl. Acad. Sci. U. S. A. 108, 20024–9 (2011). 19. Ciss, O. H. et al. Genome Sequencing of the Plant Pathogen. 4, 1–8 (2013). 20. Wood, V. et al. PomBase: A comprehensive online resource for fission yeast.
Nucleic Acids Res. 40, 695–699 (2012). 21. Rhind, N. et al. Comparative functional genomics of the fission yeasts. Science.
332, 930–6 (2011). 22. Cissé, O. H., Pagni, M. & Hauser, P. M. De novo assembly of the Pneumocystis
jirovecii genome from a single bronchoalveolar lavage fluid specimen from a patient. MBio 4, 1–4 (2012).
23. Joint Genome Institute. at <http://http//genome.jgi.doe.gov/> 24. Kämper, J. et al. Insights from the genome of the biotrophic fungal plant pathogen
Ustilago maydis. Nature 444, 97–101 (2006). 25. Loftus, B. J. et al. The Genome of the Basidiomycetous Yeast and Human
Pathogen Cryptococcus neoformans. Science. 307, 1321–1324 (2005). 26. Duplessisa, S. et al. Obligate biotrophy features unraveled by the genomic analysis
of rust fungi. Proc. Natl. Acad. Sci. U. S. A. 1–23 (2011). 27. Stajich, J. E. et al. Insights into evolution of multicellular fungi from the assembled
29
chromosomes of the mushroom Coprinopsis cinerea (Coprinus cinereus). Pnas 107, 11889–11894 (2010).
28. Martin, F. et al. The genome of Laccaria bicolor provides insights into mycorrhizal symbiosis. Nature 452, 88–92 (2008).
29. Ma, L. J. et al. Genomic analysis of the basal lineage fungus Rhizopus oryzae reveals a whole-genome duplication. PLoS Genet. 5, (2009).
30. Eichinger, L. et al. The genome of the social amoeba Dictyostelium discoideum. Nature 435, 43–57 (2005).
31. King, N. et al. The genome of the choanoflagellate Monosiga brevicollis and the origin of metazoans. Nature 451, 783–8 (2008).
32. Fairclough, S. R. et al. Premetazoan genome evolution and the regulation of cell differentiation in the choanoflagellate Salpingoeca rosetta. Genome Biol. 14, R15 (2013).
33. Lander, E. S. et al. Initial sequencing and analysis of the human genome. Nature 409, 860–921 (2001).
34. The Arabidopsis Genome Initiative. Analysis of the genome sequence of the flowering plant Arabidopsis thaliana. Nature 408, 796–815 (2000).
35. Chen, Y. et al. Hydrophobic handoff for direct delivery of peroxisome tail-anchored proteins. Nat. Commun. 5, 5790 (2014).
36. Yuan, P. et al. A HEX-1 crystal lattice required for Woronin body function in Neurospora crassa. Nat. Struct. Biol. 10, 264–70 (2003).
37. Liu, F. et al. Making two organelles from one: Woronin body biogenesis by peroxisomal protein sorting. J. Cell Biol. 180, 325–339 (2008).
38. Ng, S. K., Liu, F., Lai, J., Low, W. & Jedd, G. A tether for Woronin body inheritance is associated with evolutionary variation in organelle positioning. PLoS Genet. 5, e1000521 (2009).
39. Lai, J. et al. Intrinsically disordered proteins aggregate at fungal cell-to-cell channels and regulate intercellular connectivity. Proc. Natl. Acad. Sci. 109, 15781–15786 (2012).
40. van Peer, A. F. et al. The septal pore cap is an organelle that functions in vegetative growth and mushroom formation of the wood-rot fungus Schizophyllum commune. Environ. Microbiol. 12, 833–44 (2010).
41. Leeder, A. C., Jonkers, W., Li, J. & Louise Glass, N. Early colony establishment in Neurospora crassa requires a MAP kinase regulatory network. Genetics 195, 883–898 (2013).
42. Aldabbous, M. S. et al. The ham-5, rcm-1 and rco-1 genes regulate hyphal fusion in Neurospora crassa. Microbiology 156, 2621–2629 (2010).
43. Fu, C. et al. Identification and characterization of genes required for cell-to-cell fusion in Neurospora crassa. Eukaryot. Cell 10, 1100–9 (2011).
44. Fleißner, A. et al. The so locus is required for vegetative cell fusion and postfertilization events in Neurospora crassa. Eukaryot. Cell 4, 920–930 (2005).
45. Engh, I. et al. The WW domain protein PRO40 is required for fungal fertility and associates with Woronin bodies. Eukaryot. Cell 6, 831–43 (2007).
46. Maddi, A., Dettman, A., Fu, C., Seiler, S. & Free, S. J. WSC-1 and HAM-7 are MAK-1 MAP kinase pathway sensors required for cell wall integrity and hyphal fusion in Neurospora crassa. PLoS One 7, e42374 (2012).
47. Masloff, S., Pöggeler, S. & Kück, U. The pro1(+) gene from Sordaria macrospora encodes a C6 zinc finger transcription factor required for fruiting body development. Genetics 152, 191–9 (1999).
48. Nowrousian, M. et al. The novel ER membrane protein PRO41 is essential for sexual development in the filamentous fungus Sordaria macrospora. Mol. Microbiol. 64, 923–937 (2007).
30
49. Lacaze, I., Lalucque, H., Siegmund, U., Silar, P. & Brun, S. Identification of NoxD/Pro41 as the homologue of the p22phox NADPH oxidase subunit in fungi. Mol. Microbiol. 95, 1006–1024 (2015).
50. Ohm, R. a., de Jong, J. F., de Bekker, C., Wösten, H. a B. & Lugones, L. G. Transcription factor genes of Schizophyllum commune involved in regulation of mushroom formation. Mol. Microbiol. 81, 1433–1445 (2011).
51. Horiuchi, J., Silverman, N., Piña, B., Marcus, G. a & Guarente, L. ADA1, a novel component of the ADA/GCN5 complex, has broader effects than GCN5, ADA2, or ADA3. Mol. Cell. Biol. 17, 3220–8 (1997).
52. Malapi-Wight, M., Kim, J. E. & Shim, W. B. The N-terminus region of the putative C2H2 transcription factor Ada1 harbors a species-specific activation motif that regulates asexual reproduction in Fusarium verticillioides. Fungal Genet. Biol. 62, 25–33 (2014).
53. Kothe, G. O. & Free, S. J. The isolation and characterization of nrc-1 and nrc-2, two genes encoding protein kinases that control growth and development in Neurospora crassa. Genetics 149, 117–130 (1998).
54. Dettmann, A., Heilig, Y., Valerius, O., Ludwig, S. & Seiler, S. Fungal communication requires the MAK-2 pathway elements STE-20 and RAS-2, the NRC-1 adapter STE-50 and the MAP kinase scaffold HAM-5. PLoS Genet. 10, e1004762 (2014).
55. Liu, Y. An Essential Gene for Fruiting Body Initiation in the Basidiomycete Coprinopsis cinerea Is Homologous to Bacterial Cyclopropane Fatty Acid Synthase Genes. Genetics 172, 873–884 (2005).
56. Araujo-Palomares, C. L., Richthammer, C., Seiler, S. & Castro-Longoria, E. Functional characterization and cellular dynamics of the CDC-42 - RAC - CDC-24 module in Neurospora crassa. PLoS One 6, e27148 (2011).
57. Li, D. A Mitogen-Activated Protein Kinase Pathway Essential for Mating and Contributing to Vegetative Growth in Neurospora crassa. Genetics 170, 1091–1104 (2005).
58. Maerz, S. et al. The nuclear Dbf2-related kinase COT1 and the mitogen-activated protein kinases MAK1 and MAK2 genetically interact to regulate filamentous growth, hyphal fusion and sexual development in Neurospora crassa. Genetics 179, 1313–1325 (2008).
59. Pandey, A., Roca, M. G., Read, N. D. & Glass, N. L. Role of a mitogen-activated protein kinase pathway during conidial germination and hyphal fusion in Neurospora crassa. Eukaryot. Cell 3, 348–58 (2004).
60. Park, G., Pan, S. & Borkovich, K. A. Mitogen-activated protein kinase cascade required for regulation of development and secondary metabolism in Neurospora crassa. Eukaryot. Cell 7, 2113–2122 (2008).
61. Angelica, M. D. & Fong, Y. NIH Public Access. October 141, 520–529 (2008). 62. Xiang, Q., Rasmussen, C. & Glass, N. L. The ham-2 locus, encoding a putative
transmembrane protein, is required for hyphal fusion in Neurospora crassa. Genetics 160, 169–80 (2002).
63. Bloemendal, S. et al. A Mutant Defective in Sexual Development Produces Aseptate Ascogonia. Eukaryot. Cell 9, 1856–1866 (2010).
64. Dettmann, A. et al. HAM-2 and HAM-3 are central for the assembly of the Neurospora STRIPAK complex at the nuclear envelope and regulate nuclear accumulation of the MAP kinase MAK-1 in a MAK-2-dependent manner. Mol. Microbiol. 90, 796–812 (2013).
65. Simonin, A. R., Rasmussen, C. G., Yang, M. & Glass, N. L. Genes encoding a striatin-like protein (ham-3) and a forkhead associated protein (ham-4) are required for hyphal fusion in Neurospora crassa. Fungal Genet. Biol. 47, 855–68 (2010).
31
66. Bloemendal, S. et al. A homologue of the human STRIPAK complex controls sexual development in fungi. Mol. Microbiol. 84, 310–23 (2012).
67. Nowrousian, M., Masloff, S., Pöggeler, S. & Kück, U. Cell differentiation during sexual development of the fungus Sordaria macrospora requires ATP citrate lyase activity. Mol. Cell. Biol. 19, 450–60 (1999).
68. Dettmann, A. et al. HAM-2 and HAM-3 are central for the assembly of the Neurospora STRIPAK complex at the nuclear envelope and regulate nuclear accumulation of the MAP kinase MAK-1 in a MAK-2-dependent manner. Mol. Microbiol. 90, 796–812 (2013).
69. Gesing, S., Schindler, D., Fränzel, B., Wolters, D. & Nowrousian, M. The histone chaperone ASF1 is essential for sexual development in the filamentous fungus Sordaria macrospora. Mol. Microbiol. 84, 748–765 (2012).
70. Degli-Innocenti, F. & Russo, V. E. Isolation of new white collar mutants of Neurospora crassa and studies on their behavior in the blue light-induced formation of protoperithecia. J. Bacteriol. 159, 757–761 (1984).
71. Tsitsigiannis, D. I., Kowieski, T. M., Zarnowski, R. & Keller, N. P. Endogenous lipogenic regulators of spore balance in Aspergillus nidulans. Eukaryot. Cell 3, 1398–1411 (2004).
72. López-Berges, M. S. et al. The velvet complex governs mycotoxin production and virulence of Fusarium oxysporum on plant and mammalian hosts. Mol. Microbiol. 87, 49–65 (2013).
73. Bayram, Ö. S. et al. Laea control of velvet family regulatory proteins for light-dependent development and fungal cell-type specificity. PLoS Genet. 6, 1–17 (2010).
74. Ni, M. & Yu, J. H. A novel regulator couples sporogenesis and trehalose biogenesis in Aspergillus nidulans. PLoS One 2, e970 (2007).
75. Ahmed, Y. L. et al. The Velvet Family of Fungal Regulators Contains a DNA-Binding Domain Structurally Similar to NF-κB. PLoS Biol. 11, e1001750 (2013).
76. Cano-Domínguez, N., Alvarez-Delfín, K., Hansberg, W. & Aguirre, J. NADPH oxidases NOX-1 and NOX-2 require the regulatory subunit NOR-1 to control cell differentiation and growth in Neurospora crassa. Eukaryot. Cell 7, 1352–61 (2008).
77. Jiménez-Ortigosa, C. et al. Chitin synthases with a myosin motor-like domain control the resistance of Aspergillus fumigatus to echinocandins. Antimicrob. Agents Chemother. 56, 6121–6131 (2012).
78. Fajardo-Somera, R. a et al. Dissecting the function of the different chitin synthases in vegetative growth and sexual development in Neurospora crassa. Fungal Genet. Biol. 75, 30–45 (2015).
79. Zerbino, D. R. & Birney, E. Velvet: Algorithms for de novo short read assembly using de Bruijn graphs. Genome Res. 18, 821–829 (2008).
80. Trapnell, C., Pachter, L. & Salzberg, S. L. TopHat: Discovering splice junctions with RNA-Seq. Bioinformatics 25, 1105–1111 (2009).
81. Trapnell, C. et al. Transcript assembly and abundance estimation from RNA-Seq reveals thousands of new transcripts and switching among isoforms. Nat. Biotechnol. 28, 511–515 (2011).
82. Grabherr, M. G. et al. Full-length transcriptome assembly from RNA-Seq data without a reference genome. Nat. Biotechnol. 29, 644–52 (2011).
83. Haas, B. J. et al. Improving the Arabidopsis genome annotation using maximal transcript alignment assemblies. Nucleic Acids Res. 31, 5654–5666 (2003).
84. Stanke, M. et al. AUGUSTUS: Ab initio prediction of alternative transcripts. Nucleic Acids Res. 34, 435–439 (2006).
85. Korf, I. Gene finding in novel genomes. BMC Bioinformatics 5, 59 (2004). 86. Ter-Hovhannisyan, V., Lomsadze, A., Chernoff, Y. O. & Borodovsky, M. Gene
32
prediction in novel fungal genomes using an ab initio algorithm with unsupervised training. Genome Res. 18, 1979–90 (2008).
87. Cantarel, B. L. et al. MAKER: An easy-to-use annotation pipeline designed for emerging model organism genomes. Genome Res. 18, 188–196 (2008).
88. Wallace, I. M., O’Sullivan, O., Higgins, D. G. & Notredame, C. M-Coffee: Combining multiple sequence alignment methods with T-Coffee. Nucleic Acids Res. 34, 1692–1699 (2006).
89. Capella-Gutiérrez, S., Silla-Martínez, J. M. & Gabaldón, T. trimAl: A tool for automated alignment trimming in large-scale phylogenetic analyses. Bioinformatics 25, 1972–1973 (2009).
90. Rokas, A. Phylogenetic analysis of protein sequence data using the Randomized Axelerated Maximum Likelihood (RAXML) Program. Curr. Protoc. Mol. Biol. Chapter 19, Unit19.11 (2011).
91. Le, S. Q. & Gascuel, O. An improved general amino acid replacement matrix. Mol. Biol. Evol. 25, 1307–1320 (2008).
92. Li, L., Stoeckert, C. J. J. & Roos, D. S. OrthoMCL: Identification of Ortholog Groups for Eukaryotic Genomes. Genome Res. 13, 2178–2189 (2003).
93. Pearson, W. R. Finding protein and nucleotide similarities with FASTA. Curr. Protoc. Bioinforma. Chapter 3, Unit3.9 (2016).
94. Csurös, M. Count: Evolutionary analysis of phylogenetic profiles with parsimony and likelihood. Bioinformatics 26, 1910–1912 (2010).
95. Han, M. V., Thomas, G. W. C., Lugo-Martinez, J. & Hahn, M. W. Estimating gene gain and loss rates in the presence of error in genome assembly and annotation using CAFE 3. Mol. Biol. Evol. 30, 1987–1997 (2013).
96. Edgar, R. C. MUSCLE: Multiple sequence alignment with high accuracy and high throughput. Nucleic Acids Res. 32, 1792–1797 (2004).
97. Guindon, S. et al. New algorithms and methods to estimate maximum-likelihood phylogenies: Assessing the performance of PhyML 3.0. Syst. Biol. 59, 307–321 (2010).


![Quartz Crystal Microbalance Electronic Interfacing Systems ...temperatures [53,54]. For instance, the Y-11.1 cut gallium orthophosphate (GaPO4) based crystals are able to maintain](https://img.pdfslide.us/doc/110x75/5e237424c97233391e0d911c/quartz-crystal-microbalance-electronic-interfacing-systems-temperatures-5354.jpg)
![Designing Dendrimer and Miktoarm Polymer Based Multi ...€¦ · and carbon nanotubes [51,52], and among inorganics are quantum dots [53,54], silica [55,56] and gold nanoparticles](https://img.pdfslide.us/doc/110x75/5fa0499807b6d03896211fef/designing-dendrimer-and-miktoarm-polymer-based-multi-and-carbon-nanotubes-5152.jpg)