Embed Size (px)
Citation preview
arX
iv:a
stro
-ph/
0511
125
v1
4 N
ov 2
005
Astronomy & Astrophysicsmanuscript no. jfremaux˙aaformat c© ESO 200612th October 2006
Prospects for population synthesis in the H band:NeMo grids of stellar atmospheres compared to observations
J. Fremaux1, F. Kupka2, C. Boisson1, M. Joly1, and V. Tsymbal3,4
1 LUTH, UMR 8102 du CNRS, associe a l’Universite Denis Diderot, Observatoire de Paris, Section de Meudon, 92195 MeudonCedex, France2 Max-Planck-Institute for Astrophysics, Karl-Schwarzschild Str. 1, 85741 Garching, Germany3 Tavrian National University, Yaltinskaya 4, 330000 Simferopol, Crimea, Ukraine4 Institute for Astronomy, University of Vienna, Turkenschanzstraße 17, A-1180 Vienna, Austria
Received 27 June 2005/ Accepted 22 October 2005
Abstract
Context. For applications in population synthesis, libraries of theoretical stellar spectra are often considered an alternative to template librariesof observed spectra, because they allow a complete samplingof stellar parameters. Most attention in published theoretical spectral libraries hasbeen devoted to the visual wavelength range.Aims. We present a detailed comparison of theoretical spectra in the range 1.57-1.67µm, for spectral types from A to early M and for giantsand dwarf stars, with observed stellar spectra at resolutions around 3000, which would be sufficient to disentangle the different groups of latetype stars.Methods. We have selected the NeMo grids of stellar atmospheres to perform such a comparison.Results. We first demonstrate that after combining atomic and molecular line lists, it is possible to match observed spectral flux distributionswith theoretical ones very well for almost the entire parameter range covered by the NeMo grids at moderate resolution inthe visual range. Inthe infrared range, although the overall shape of the observed flux distributions is still matched reasonably well, the individual spectral featuresare reproduced by the theoretical spectra only for stars earlier than mid F type. For later spectral types the differences increase and theoreticalspectra of K type stars have systematically weaker line features than those found in observations. These discrepanciesare traced back to stemprimarily from incomplete data on neutral atomic lines, although some of them are also related to molecules.Conclusions. Libraries of theoretical spectra for A to early M type stars can be successfully used in the visual regions for populationsynthesisbut their application in the infrared is restricted to earlyand intermediate type stars. Improving atomic data in the near infrared is a key elementin making the construction of reliable libraries of stellarspectra in the infrared feasible.
Key words. stars: atmospheres - infrared: stars
1. Introduction
Due to the rapidly increasing spectral resolution of galaxysur-veys (e.g. Sloan Digital Sky Survey), modelling any galaxywith spectral synthesis technique requires a high spectralreso-lution stellar library.
Over the last years much progress has been made in syn-thesis models (e.g. Pelat 1997; Leitherer et al. 1999; Moultaka& Pelat 2000; Bruzual & Charlot 2003; Le Borgne et al. 2004;Cid Fernandes et al. 2005). Moderate to high spectral resolu-tion observations of stars in order to construct reliable tem-plate libraries have also been performed in the visible domain(e.g. STELIB of Le Borgne et al. 2003; UVES of Bagnulo etal. 2003; CoudeFed of Valdes et al. 2004) and in the IR (e.g.Dallier et al. 1996; Meyer et al. 1998; Ivanov et al. 2004).
Send offprint requests to: J. Fremaux, e-mail:[email protected]
However, the major limitation of all these libraries is the sam-pling of stellar parameters such as metallicity.
One way to avoid such a difficulty is to build libraries oftheoretical stellar spectra in order to choose the desired phys-ical parameters. In this sense, some extensive libraries ofsyn-thetic spectra have appeared recently for the visible range.
Murphy & Meiksin (2004), based on Kurucz’s ATLAS9model atmospheres (Kurucz 1993a), have built a high resolu-tion (λ/∆λ = 250000) stellar library over an extended visiblerange (3000 to 10000 Å). The convection zone is treated us-ing the Mixing Length Theory (MLT) with the overshootingtreatment of Kurucz (cf. Castelli et al. 1997). This librarypro-vides spectra for 54 values of effective temperature from 5250to 50000 K, 11 values of log surface gravity from 0.0 to 5.0 and19 metallicities from -5.0 to 1.0. They compared their syntheticlibrary with observed spectra (STELIB library of Le Borgne etal. 2003) for the colours and the Lick indices and found in gen-eral a good agreement.

2 J. Fremaux et al.: Prospects for population synthesis in the H band
Still based on Kurucz’s models, but with enhanced molec-ular line lists and the overshooting option switched off, Munariet al. (2005) also present a library of synthetic spectra, for asimilar wavelength range (2500 to 10500 Å). They use a newgrid of ATLAS9 model atmospheres (Castelli & Kurucz 2003).The effective temperature of these spectra is contained between3500 and 47500 K, the log surface gravity between 0.0 and5.0 and the metallicity between -2.5 and 0.5. These spectra arecomputed at a resolving power ofλ/∆λ = 500000 and thenGaussian convolved to lower resolution (≤ 20 000). In con-trast with Murphy & Meiksin (2004), the predicted energy levellines are not included into the line lists used to build this library,as Munari et al. (2005) favour the spectroscopic use rather thanthe photometric use of the synthetic spectra. The addition ofthese “predicted lines” permits to have a better statistical fluxdistribution, but individual wavelengths can be wrong by upto5%.
We would like to point out here that usually only the lowerlying energy levels of atoms have been determined in the labo-ratory, particularly for complex spectra such as those fromneu-tral or singly ionized iron. If only those transitions were takeninto account, the atmospheric line blanketing computed fromsuch data would be severly incomplete. A lot of weak lines,possibly unidentified even in the solar spectrum but neverthe-less present, would be missed. This would lead to an overes-timation of the ultraviolet flux which in turn would be “com-pensated” by a lack of flux in the visual (Kurucz 1992). Toavoid this deficiency and to improve the temperature structureof the model atmospheres, the spectrophotometric flux distri-bution, and the photometric colors requires to account for linesfor which one or both energy levels have to be predicted fromquantum mechanical calculations. This has been one of themain goals of the ATLAS9 models of Kurucz (1992, 1993a).As the theoretical predictions are accurate to only a few per-cent, individual wavelengths can be wrong by up to a few 100 Åin the visual. Also the line oscillator strengths are sufficientlyaccurate merely in a statistical sense. This still permits to im-prove the total flux within a wavelength band of a few dozen Åin the visual, but individual features do appear in the wrongpartof the spectrum. For spectroscopy at higher resolutions, partic-ularly if the spectrum is rectified or when working within smallwavelength bands, adding the predicted energy level lines “pol-lutes” the theoretical spectrum with extra “noise”. This has tobe avoided in libraries devoted to automatic fitting proceduresor if particular line features are essential to identify a certainspectral type (lines predicted for the wrong wavelength willmake this more difficult). Hence, with present atomic data, ei-ther choice is only a compromise solution.
By combining three different model atmospheres, the high-resolution stellar library of Martins et al. (2005) provides thelargest coverage in effective temperature (from 3000 to 50000K) and log surface gravity (from -0.5 to 5.5). This library, stillin the visible wavelength range (3000 to 7000 Å), uses thenon-LTE model atmosphere TLUSTY (Hubeny 1988, Hubeny& Lanz 1995, Lanz & Hubeny 2003) forTeff ≥ 27500K,the Kurucz’s ATLAS9 model for 4750≤ Teff ≤ 27000Kand Phoenix/NextGen models (Allard & Hauschildt 1995,Hauschildt et al. 1999) which use spherical symmetry for
cooler stars with low surface gravity. A comparison with ob-served spectra (from the STELIB library of Le Borgne et al.2003 and the Indo-US library of Valdes et al. 2004) shows thegood agreement of this theoretical library with observations.
Thus, the visible range is now quite well covered by the-oretical libraries, for photometric use as well as spectroscopicuse and for a wide range of physical parameters. All the com-parisons with observations show that these theoretical spectracan reasonably well mimic real stars, at least at the spectralresolution where the comparisons were made.
The goal of the present work is to go one step further, ex-ploring the near-infrared range where few observed fully cali-brated and no theoretical libraries are available. This researchtakes place in a more general framework which consists in thesynthesis of the stellar population of galaxies hosting activegalactic nuclei by an inverse method, described in Pelat (1997)and Moultaka & Pelat (2000). The H-band provides very goodluminosity discriminators for stars later than K0 (cf Dallieret al. 1996) and the particular region 1.57-1.64µm of the H-band is clear of strong emission lines (except Brackett lines).It allows to sample the stellar content of the very nucleus ofSeyfert 1 galaxies, at the contrary of the visible range wherethe strong broad emission lines of the active nucleus contami-nate so much the spectra of the galactic inner part that therearetoo few absorption lines from the stellar component to synthe-size this region.
The lack of stellar observations at medium resolution forthe near-infrared range, especially for super-metallic stars,drove us to work with theoretical spectra. But the behavior ofmodel atmospheres and fluxes is not very well known in theinfrared.
Decin et al. (2003) have compared several observed starswith theoretical spectra computed with the MARCS models(Gustafsson et al. 1975, Plez et al. 1992) in the range 2.38to 12 µm for the ISO-SWS calibration, at a resolving powerR ≃ 1000. This study points out the difficulties of modelisa-tion due to strong molecular opacities and the bad accuracy andcompleteness of the atomic data in these wavelength ranges.
In this paper, we compute theoretical spectra using theNeMo (Vienna New Model) grid of atmospheres (Heiter etal. 2002, Nendwich et al. 2004) based on the model atmo-sphere code ATLAS9 by Kurucz (1993a, 1998) and Castelli etal. (1997), combined with the list of absorption lines VALD(Vienna Atomic Line Database, Kupka et al. 1999), eventu-ally completed by molecular data collected by one of us (VT).These models are described in Sect. 2. Synthetic stellar spectraare computed with the code SynthV (built by VT), as shownin Sect. 3, using the model atmospheres described in Sect. 2 asinput. Several tests on the input parameters of the spectra aredone in Sect. 4.
In a first step of applying our synthesis calculations(Sect. 5), we compare a set of observed stellar spectra with theircorresponding models in the visible wavelength range (5000to9000 Å) to check the range of validity of the NeMo grid, ex-ploring the whole range of physical parameters (effective tem-perature, surface gravity and metallicity). In a second step, wegenerate synthetic spectra in the near-infrared range and com-pare them with observed ones. The results of this comparison
J. Fremaux et al.: Prospects for population synthesis in the H band 3
are described in Sect. 6, as are tests which demonstrate thattheparticular choice of model atmospheres can be expected to beless important than the set of line lists used for the computationof spectra. Our conclusions are summarized in Sect. 7.
2. Description of the model atmospheres
NeMo differs from the original grids of model atmospheresbased on ATLAS9 in the treatment of the convective energytransport. It provides also a higher vertical resolution ofthe at-mospheres and a finer grid in effective temperature and surfacegravity.
This model grid of stellar atmosphere uses convection treat-ment without overshooting. The overshooting prescriptionhasbeen introduced by Kurucz (1993a, 1998) and modified byCastelli et al. (1997). It was supposed to take into account thechange in the temperature gradient of the stable atmospherelayers near a convective zone due to the overshooting of gasfrom that zone into the stellar atmosphere. But this prescrip-tion is left aside in the present work, because, even if the prop-erties of various numerical simulations are well describedandin good agreement when compared to observations of the Sun,models with overshooting are worse than models without forother stellar types (see Heiter et al. 2002 for a detailed discus-sion).
The NeMo grids offer a choice among different convectionmodels. One of them is the mixing length theory (MLT), withα = 0.5. The parameterα represents the ratio between thecharacteristic length (distance traveled by an element of fluidbefore its dissolution) and the scale height of the local pressure.This parameter is subject to discussion: according to compar-isons between observed and computed energy distributions forthe Sun done by Castelli et al. (1997),α should be set at least to1.25, but Van’t Veer & Megessier (1996), using the same codesand input data as Castelli et al. (1997), but different observa-tions for the Sun, found thatα = 0.5 is required to fit both Hαand Hβ profiles. Fuhrmann et al. (1993) were the first to noticethat a value of 0.5 for the parameterα is needed to reproducethe Balmer line profiles of cool dwarf stars. In addition, this pa-rameter has to span a large domain (from 1 to 3) to reproducethe red giants (Stothers & Chin 1997). The alternative convec-tive models available in the NeMo grids are of ”Full SpectrumTurbulence” (FST) type. Introduced by Canuto & Mazzitelli(1991, 1992; thereafter CM model) and Canuto, Goldman &Mazzitelli (1996; thereafter CGM model), these models avoidthe one-eddy approximation of MLT. In addition, both modelswere suggested to be used with a scale length different from theusual multipleα of the local pressure scale height (see Heiteret al. 2002 for further details).
The latter models were introduced in NeMo to allow achoice among different treatments of the internal structure ofthe stars, depending on the aim of the model computation andits underlying assumption of how to describe the convectiveenergy transport within the limitations of a simple convectionmodel (using only algebraic rather than differential equations).
Two levels of vertical resolution are also offered and hencewe can either work with 72 or 288 layers. The MLT models are
computed with 72 layers, CM models with 288 and CGM onesare computed for both values.
The metallicity of the model atmopheres covers a largerange between -2.0 and+1.0 dex and have 13 different values.This range of metallicity is enough for our purpose. The supermetal rich stars, in particular, are represented with five differ-ent levels of metallicity (+0.1,+0.2,+0.3,+0.5 and+1.0 dex)reaching the highest possible value for a real star.
NeMo provides model atmospheres for effective temper-atures between 4000K and 10000K, by successive steps of200K; for lowest temperatures, the model atmospheres com-puted with ATLAS9 become inadequate, mainly because ofthe molecular opacities which become very important for coolstars. The MARCS6 models (Gustafsson et al. 1975, Plez et al.1992), more dedicated to the cool stars, handle this problemwith a more complete treatment of molecular opacity.
The available values for the surface gravity (log g) of thestellar atmospheres in the NeMo grid span a range from 2.0 to5.0 with steps of 0.2. It is bounded at 2.0 owing to the plane-parallel approximation used in ATLAS9; for lower values oflog g, spherically symmetric geometry should be used instead(cf. Hauschildt et al. 1999 and Baraffe et al. 2002).
Other models, working with the appropriate geometry likeMARCS6 or Phoenix/NextGen (Allard & Hauschildt 1995,Hauschildt et al. 1999) are necessary for these small values.Indeed, MARCS6, whose main purpose is to model cool stars,uses also the approximation of spherically symmetric geometryto reproduce supergiants and the cool giants stars, which havea low surface gravity (Plez et al. 1992). NextGen models, likeATLAS9, assume LTE and plane-parallel geometry for dwarfstars, but a spherical symmetry is used for low-gravity giantand pre-main sequence stars (log g< 3.5, see Hauschildt et al.1999).
Contrary to NeMo and MARCS6, NextGen can use a non-LTE model for high temperature stars. But using NLTE doesnot improve significantly the modelisation of our observedstars, as NLTE effects begin to occur only from 7000 K tohigher effective temperature (Hauschildt et al. 1999), but arestill small to at least 10000 K. Moreover, NextGen does notreproduce well enough the individual lines owing to the treat-ment of atomic and molecular lines with a direct opacity sam-pling method. Indeed, working with opacity distribution func-tions, like in ATLAS9, would ask too much computer resourceswhen using NLTE calculations (Hauschildt et al. 1999). In ad-dition to that, too few layers are used in the published modelsto describe the bottom part of the photosphere.
However, NextGen could be an alternative to ATLAS9 typemodel atmospheres in a next step of our project, for generatingspectra of stars with a log g below 2.0 (for which spherical sym-metry is needed) and/or an effective temperature above 10000K.
Bertone et al. (2004) have compared both ATLAS9 andNextGen models to observations in the visible range along thewhole spectral-type sequence. The conclusions of this workarethat both models reproduce very well the spectral energy dis-tribution of F type stars and earlier but this good agreementdecreases at lower temperature, especially for K stars, owingto the lack of molecular treatment in those models. ATLAS9

4 J. Fremaux et al.: Prospects for population synthesis in the H band
provides a better fit, in general, from B to K type stars but assaid previously NextGen is more suitable for M stars, due to theuse of spherical geommetry for the giants and a more completemolecular line opacity. However, Martins et al. (2005) notethatthis comparison is made with a previous generation of NextGenmodels, using for example a mixing length parameter of 1 in-stead of 2, preferred by hydrodynamic models. This is also truefor the ATLAS9 models, as Bertone et al. (2004) did not usethe latest versions of ATLAS9, including new opacity distribu-tion functions (Castelli & Kurucz 2003), computed with moreup-to-date solar abundances and molecular contributions thanthe previous one.
Thus, a new comparison with observations in the visiblerange is not unnecessary. Moreover, an extensive comparisonof spectra based on the NeMo grid of model atmospheres forthe entire range of A to early M stars including both dwarfs andgiants has not been done before. We hence begin our compar-ison with observations in the visual before proceeding to theinfrared. The implications of changing abundances or the de-scription of convection at spectral resolutions relevant for stud-ies of galaxies are included as part of the discussion of ourcomparisons.
3. Obtaining a theoretical spectrum
First of all, we downloaded the model atmospheres corre-sponding to the stellar types wanted from the NeMo website(http://ams.astro.univie.ac.at/nemo/). The models are classifiedaccording to the convection model (CM, CGM or MLT) and tothe number of layers representing the atmosphere. The modelCGM with 72 layers is detailed enough for our purpose. Modelswith 288 layers are used only for specific applications likethe calculation of the convective scale length in stellar interiormodels (Heiter et al. 2002). Reduced to the medium resolutionof our observations, both computations of a model with 72 and288 layers respectively give similar spectra.
The next parameter to determine is the microturbulence ve-locity. For cool dwarf stars, this velocity is low: about 0–1km/s,but the value is increasing towards higher luminosities, reach-ing values as high as 5 km/s (Gray 1992). A few stars do notfollow this rule: hot stars, like B and O type, have a negligiblemicroturbulence velocity and some specific types of A stars caneither have a null velocity (Ap type stars, for them magneticfield effects are important instead) or a velocity of 4 km/s (Amtype stars). As the microturbulence velocity has only a smallinfluence on the overall shape of the spectra and on the lineprofiles at our spectral resolution, we can use a common valueof 2 km/s for comparison with all our stellar spectra, composedby A to early-M type dwarf and F to K type giant stars, as2 km/s is a good compromise for these stars (Gray 1992).
Then, the three main physical parameters of the star haveto be chosen. The metallicity, the effective temperature and thesurface gravity of the theoretical stellar spectrum shouldcorre-spond as good as possible to the observed star to be compared.Therefore, once the stellar characteristics are determined, thenearest set of parameters (T, log g, Z) in the NeMo grid is taken.
The metallicity is taken from Nordstroem et al. (2004),Cayrel de Strobel et al. (2001) and Barbuy & Grenon (1990)
when available for individual stars of the sample, otherwise as-sumed to be solar.
Nordstroem et al. (2004) have determined the effective tem-perature of most of the dwarf stars in our sample, for otherstars the effective temperature is assumed, as well as the surfacegravity, according to their spectral type from the correspondingvalues of temperature and gravity as given in Schmidt-Kaler(1982) and Gray (1992).
Once the most suitable model atmosphere is determined,we can generate a theoretical flux calibrated spectrum with thecode SynthV (by VT). This code requires several input param-eters such as the wavelength range for which the spectrum willbe computed, as well as the wavelength step. This step hasto be small enough compared to 2.5 Å as the desired opacityin each wavelength point includes absorption from all nearestlines within 2.5 Å, so large wavelength steps would give wrongresults. We take 0.1 Å in the visible and in the infrared range.Then, we can enter a rotation profile for the star, if needed, andindicate a list of absorption lines to be used. For our work, wetake the Vienna Atomic Linelist Database (VALD), completedby several molecular line lists (C2, CN, CO, H2, CH, NH, OH,MgH, SiH, SiO, TiO, H2O 1). The line profiles are approxi-mated by a Voigt function. SynthV also provides the possibilityto change individual abundances.
The final theoretical spectrum has to be reduced to the sameresolution and the same sampling as the observed spectrum forfurther comparisons. So, the calculated spectrum is Gaussiansmoothed and resampled by Fourier interpolation to the samestep as the observed spectrum.
4. Testing parameters
The determination of the physical parameters of the observedstars is not as acurate as we would like. So it is necessary toinvestigate the nearest values of Teff / log g / Z of the grid. Thechemical abundances can also be changed; as these abundancesare not very well determined, it is crucial to notice how a vari-ation of the abundance of one element modifies the spectrum.
The most important change is caused by the temperature.Indeed, the step of 200 K as was chosen for the grid computa-tion is still quite large for our purpose and a deviation of thisrange can be dramatic for the slope of the spectrum. The cold-est stars (M, K and even G type) are the ones most affected bya change of 200 K.
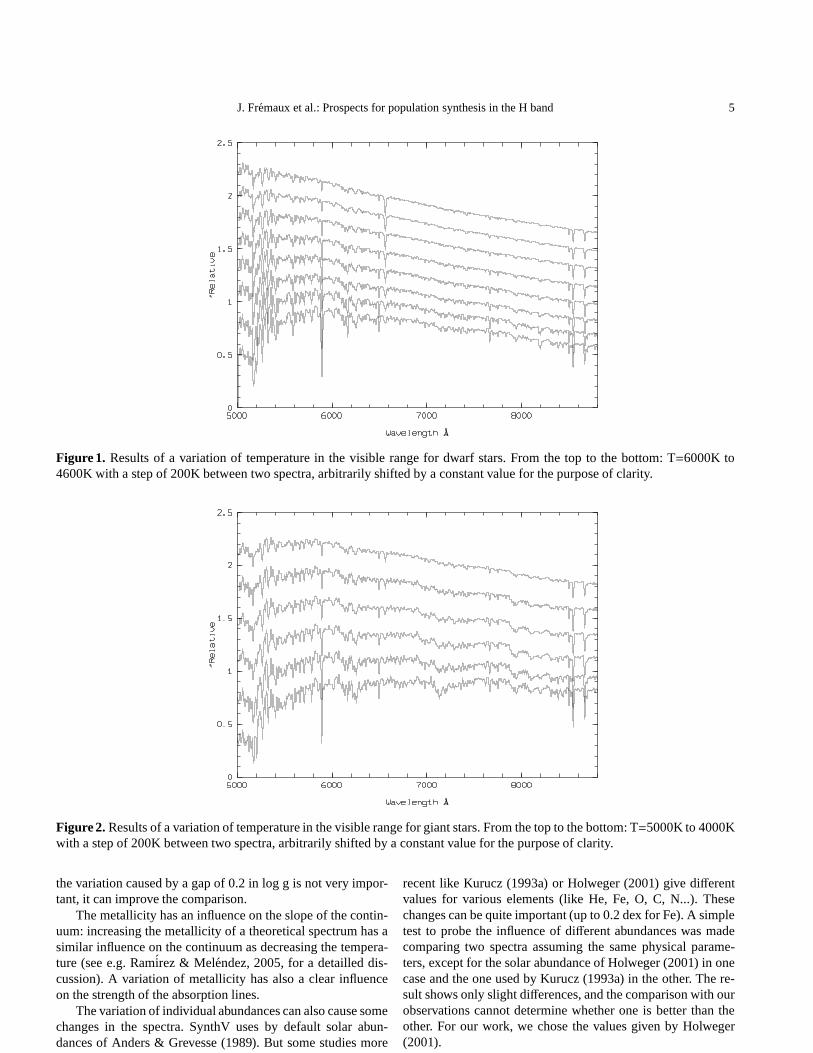
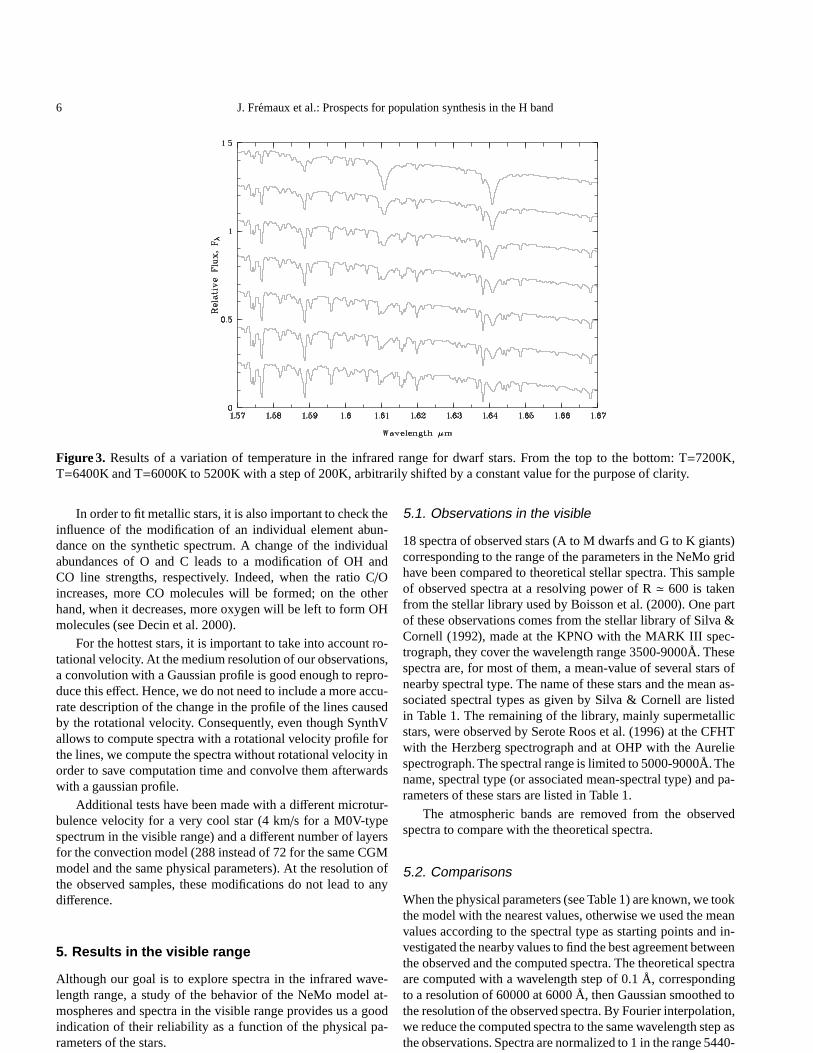
Fig. 1 and 2 show the evolution of the spectra with temper-ature in the visible range for the dwarfs and the giants, respec-tively, and Fig. 3 shows this evolution for dwarf stars in theinfrared range. We can see that for intermediate temperature,there is mainly a difference in continuum. But for the extremevalues, the modification of the spectrum is more dramatic, asitaffects also the absorption line features.
A change in log g causes a variation of the line profiles.This parameter is not very well known for observed stars. So itis important to test different values around a first guess. Even if
1 file VColl molec.lns built by VT from Kurucz’ CDROMs 15, 24,25, and 26, see Kurucz 1993b and 1999; the file is available from V.Tsymbal upon request
J. Fremaux et al.: Prospects for population synthesis in the H band 5
Figure 1. Results of a variation of temperature in the visible range for dwarf stars. From the top to the bottom: T=6000K to4600K with a step of 200K between two spectra, arbitrarily shifted by a constant value for the purpose of clarity.
Figure 2. Results of a variation of temperature in the visible range for giant stars. From the top to the bottom: T=5000K to 4000Kwith a step of 200K between two spectra, arbitrarily shiftedby a constant value for the purpose of clarity.
the variation caused by a gap of 0.2 in log g is not very impor-tant, it can improve the comparison.
The metallicity has an influence on the slope of the contin-uum: increasing the metallicity of a theoretical spectrum has asimilar influence on the continuum as decreasing the tempera-ture (see e.g. Ramirez & Melendez, 2005, for a detailled dis-cussion). A variation of metallicity has also a clear influenceon the strength of the absorption lines.
The variation of individual abundances can also cause somechanges in the spectra. SynthV uses by default solar abun-dances of Anders & Grevesse (1989). But some studies more
recent like Kurucz (1993a) or Holweger (2001) give differentvalues for various elements (like He, Fe, O, C, N...). Thesechanges can be quite important (up to 0.2 dex for Fe). A simpletest to probe the influence of different abundances was madecomparing two spectra assuming the same physical parame-ters, except for the solar abundance of Holweger (2001) in onecase and the one used by Kurucz (1993a) in the other. The re-sult shows only slight differences, and the comparison with ourobservations cannot determine whether one is better than theother. For our work, we chose the values given by Holweger(2001).
6 J. Fremaux et al.: Prospects for population synthesis in the H band
Figure 3. Results of a variation of temperature in the infrared range for dwarf stars. From the top to the bottom: T=7200K,T=6400K and T=6000K to 5200K with a step of 200K, arbitrarily shifted by a constant value for the purpose of clarity.
In order to fit metallic stars, it is also important to check theinfluence of the modification of an individual element abun-dance on the synthetic spectrum. A change of the individualabundances of O and C leads to a modification of OH andCO line strengths, respectively. Indeed, when the ratio C/Oincreases, more CO molecules will be formed; on the otherhand, when it decreases, more oxygen will be left to form OHmolecules (see Decin et al. 2000).
For the hottest stars, it is important to take into account ro-tational velocity. At the medium resolution of our observations,a convolution with a Gaussian profile is good enough to repro-duce this effect. Hence, we do not need to include a more accu-rate description of the change in the profile of the lines causedby the rotational velocity. Consequently, even though SynthVallows to compute spectra with a rotational velocity profileforthe lines, we compute the spectra without rotational velocity inorder to save computation time and convolve them afterwardswith a gaussian profile.
Additional tests have been made with a different microtur-bulence velocity for a very cool star (4 km/s for a M0V-typespectrum in the visible range) and a different number of layersfor the convection model (288 instead of 72 for the same CGMmodel and the same physical parameters). At the resolution ofthe observed samples, these modifications do not lead to anydifference.
5. Results in the visible range
Although our goal is to explore spectra in the infrared wave-length range, a study of the behavior of the NeMo model at-mospheres and spectra in the visible range provides us a goodindication of their reliability as a function of the physical pa-rameters of the stars.
5.1. Observations in the visible
18 spectra of observed stars (A to M dwarfs and G to K giants)corresponding to the range of the parameters in the NeMo gridhave been compared to theoretical stellar spectra. This sampleof observed spectra at a resolving power of R≃ 600 is takenfrom the stellar library used by Boisson et al. (2000). One partof these observations comes from the stellar library of Silva &Cornell (1992), made at the KPNO with the MARK III spec-trograph, they cover the wavelength range 3500-9000Å. Thesespectra are, for most of them, a mean-value of several stars ofnearby spectral type. The name of these stars and the mean as-sociated spectral types as given by Silva & Cornell are listedin Table 1. The remaining of the library, mainly supermetallicstars, were observed by Serote Roos et al. (1996) at the CFHTwith the Herzberg spectrograph and at OHP with the Aureliespectrograph. The spectral range is limited to 5000-9000Å.Thename, spectral type (or associated mean-spectral type) andpa-rameters of these stars are listed in Table 1.
The atmospheric bands are removed from the observedspectra to compare with the theoretical spectra.
5.2. Comparisons
When the physical parameters (see Table 1) are known, we tookthe model with the nearest values, otherwise we used the meanvalues according to the spectral type as starting points andin-vestigated the nearby values to find the best agreement betweenthe observed and the computed spectra. The theoretical spectraare computed with a wavelength step of 0.1 Å, correspondingto a resolution of 60000 at 6000 Å, then Gaussian smoothed tothe resolution of the observed spectra. By Fourier interpolation,we reduce the computed spectra to the same wavelength step asthe observations. Spectra are normalized to 1 in the range 5440-

J. Fremaux et al.: Prospects for population synthesis in the H band 7
Table 1. List of observed stars in the visible, with the values of the parameters taken from the mean-values listed by Gray (1992)and Schmidt-Kaler (1982) or from (1) Nordstroem et al. (2004), (2) Cayrel de Strobel et al. (2001) and (3) Barbuy & Grenon(1990). In the last column, when no information on metallicity is available, a tick mark replaces it. The quantity< v sini > isgiven in km/s.
Name Spectral Type < v sini > Teff(K) log g [Fe/H]HD116608,HD190785,HD124320 A1-3 V 145 8900 4.2 -& HD221741HD88815 F2 V 90 72441 4.3 −0.131
HD187691, HD149890 F8-9 V 7 60261, 59021 4.4 0.072, −0.441
HD121370 rG0 IV 5 59571 4.4 +0.272
HD38858 G4 V 3 56361 4.5 −0.261
HD161797 rG5 IV 3 5700 4.5 +0.232
HD149661,HD151541,HD33278, G9K0 V 2 51761, 52361, 5300, 4.5 0.011, −0.361, -HD23524,SAO66004,SAO84725 52001, 5300, 5300 −0.491, -, -HD93800 rK0 V 2 5250 4.5 +0.433
HD39715 rK3 V 1 4850 4.6 +0.333
HD36395 rM1 V 1 3850 4.6 +0.62
HD15866, HD25894, HD2506 G0-4 III 10 5500 3.0 -HD163993 wG8 III 3 4950 2.7 −0.12
HD72324 G9 III 3 4900 2.7 -HD33506, HD112989 rG9K2 III 2 4700 2.6 +0.142
SAO76803 K2 III 2 4500 2.5 -HD181984 rK2 III 2 4500 2.5 +0.12
HD176670 rK3 III 1 4300 2.2 −0.032
HD154733, HD21110 K4 III 1 4000 2.0 −0.142,-
Figure 4. The observed spectrum (in black) is from a F2V type star (HD 88815), the theoretical one (in grey) is computed withthe following parameters: T=7200K, log g=4.0, [M/H]=-0.1. Atmospheric bands are removed from the observed spectrum. Theresidual between the two spectra is (theoretical flux - observed flux)/theoretical flux.
5460Å. When the star has a rotational velocity, we convolve thecorresponding computed spectrum with a Gaussian of the samevelocity.
The agreement between the observed and computed spec-tra is satisfactory for effective temperatures ranging 4600 to9000 K, 9000 K corresponding to the highest temperature forthe stars composing our sample. For these spectra, the main
discrepancies, which consist in differences in the slope of theblue extremity of the continuum, can be explained by the dif-ficulty to have a good flux calibration at the wavelength endsof the observational data (in particular at 5000Å where strongMgI, MgH and FeI absorptions are present). Various examplesof comparisons for these stars are shown in Fig. 4-7. The spec-
8 J. Fremaux et al.: Prospects for population synthesis in the H band
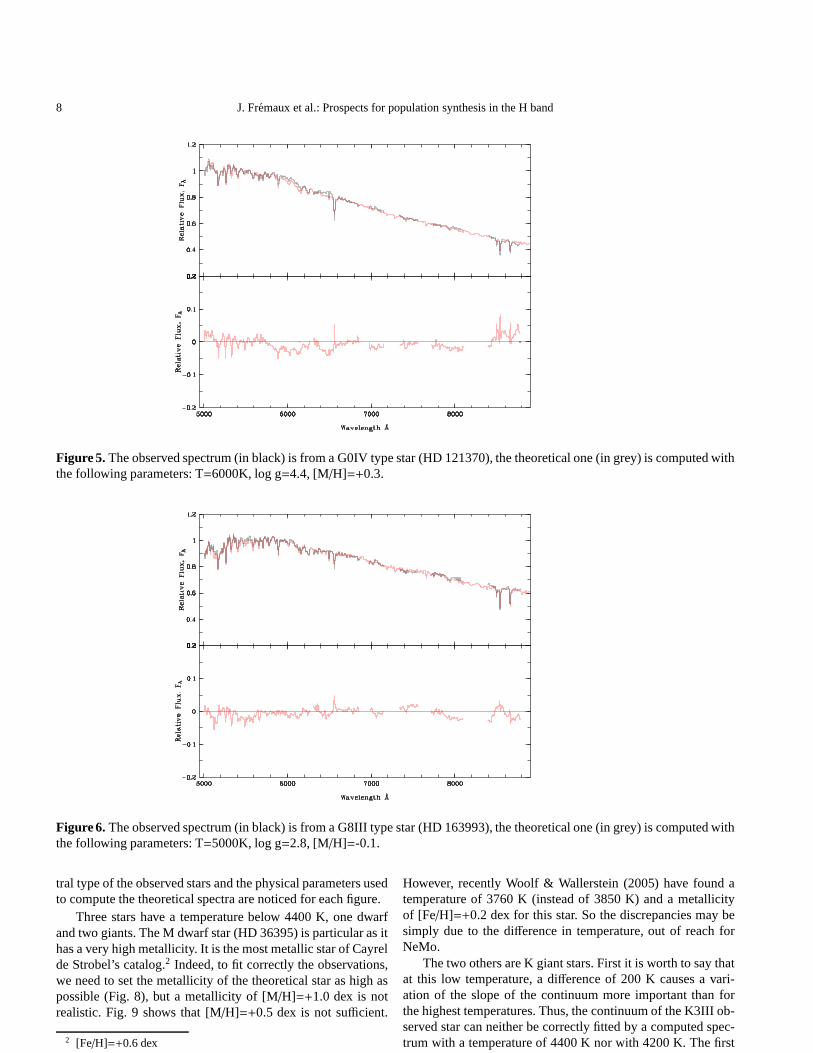
Figure 5. The observed spectrum (in black) is from a G0IV type star (HD 121370), the theoretical one (in grey) is computed withthe following parameters: T=6000K, log g=4.4, [M/H]=+0.3.
Figure 6. The observed spectrum (in black) is from a G8III type star (HD163993), the theoretical one (in grey) is computed withthe following parameters: T=5000K, log g=2.8, [M/H]=-0.1.
tral type of the observed stars and the physical parameters usedto compute the theoretical spectra are noticed for each figure.
Three stars have a temperature below 4400 K, one dwarfand two giants. The M dwarf star (HD 36395) is particular as ithas a very high metallicity. It is the most metallic star of Cayrelde Strobel’s catalog.2 Indeed, to fit correctly the observations,we need to set the metallicity of the theoretical star as highaspossible (Fig. 8), but a metallicity of [M/H]=+1.0 dex is notrealistic. Fig. 9 shows that [M/H]=+0.5 dex is not sufficient.
2 [Fe/H]=+0.6 dex
However, recently Woolf & Wallerstein (2005) have found atemperature of 3760 K (instead of 3850 K) and a metallicityof [Fe/H]=+0.2 dex for this star. So the discrepancies may besimply due to the difference in temperature, out of reach forNeMo.
The two others are K giant stars. First it is worth to say thatat this low temperature, a difference of 200 K causes a vari-ation of the slope of the continuum more important than forthe highest temperatures. Thus, the continuum of the K3III ob-served star can neither be correctly fitted by a computed spec-trum with a temperature of 4400 K nor with 4200 K. The first
J. Fremaux et al.: Prospects for population synthesis in the H band 9
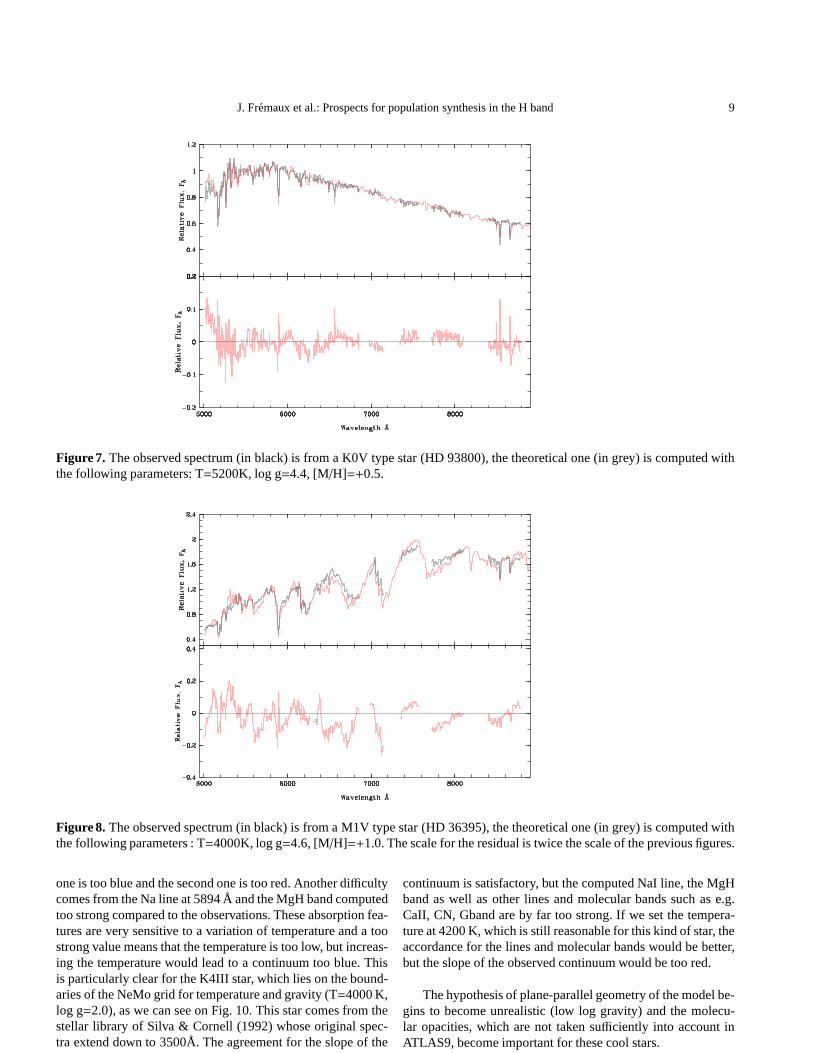
Figure 7. The observed spectrum (in black) is from a K0V type star (HD 93800), the theoretical one (in grey) is computed withthe following parameters: T=5200K, log g=4.4, [M/H]=+0.5.
Figure 8. The observed spectrum (in black) is from a M1V type star (HD 36395), the theoretical one (in grey) is computed withthe following parameters : T=4000K, log g=4.6, [M/H]=+1.0. The scale for the residual is twice the scale of the previous figures.
one is too blue and the second one is too red. Another difficultycomes from the Na line at 5894 Å and the MgH band computedtoo strong compared to the observations. These absorption fea-tures are very sensitive to a variation of temperature and a toostrong value means that the temperature is too low, but increas-ing the temperature would lead to a continuum too blue. Thisis particularly clear for the K4III star, which lies on the bound-aries of the NeMo grid for temperature and gravity (T=4000 K,log g=2.0), as we can see on Fig. 10. This star comes from thestellar library of Silva & Cornell (1992) whose original spec-tra extend down to 3500Å. The agreement for the slope of the
continuum is satisfactory, but the computed NaI line, the MgHband as well as other lines and molecular bands such as e.g.CaII, CN, Gband are by far too strong. If we set the tempera-ture at 4200 K, which is still reasonable for this kind of star, theaccordance for the lines and molecular bands would be better,but the slope of the observed continuum would be too red.
The hypothesis of plane-parallel geometry of the model be-gins to become unrealistic (low log gravity) and the molecu-lar opacities, which are not taken sufficiently into account inATLAS9, become important for these cool stars.

10 J. Fremaux et al.: Prospects for population synthesis inthe H band
Figure 9. Same as Fig. 8, with [M/H]=+0.5 for the theoretical spectrum.
Figure 10. The observed spectrum (in black) is the mean-value of two K4III type stars (HD 154733 and HD 21110), the theoret-ical one (in grey) is computed with the following parameters: T=4000K, log g=2.0, solar metallicity. The scale of this plot is notthe same as for the previous figures.
6. Results in the infrared range
We can immediatly say that there are, by far, more discrepan-cies between the computed and the observed spectra in the in-frared than in the visible range, even at the medium resolutionwe have.
6.1. Observations in the infrared
The observed spectra for this wavelength range come fromMeyer et al. (1998) and Boisson et al. (2002). The Meyer’s ones
are observations at a resolving power of R≃ 3000 at 1.6µmwith the KPNO Mayall 4 m Fourier Transform Spectrometer;these spectra have to be calibrated in flux. The stars fromBoisson et al. (2002) come from the ISAAC spectrograph,mounted on the VLT telescope, at a resolving power of R≃3300 at 1.6µm. From these samples, we selected 23 starsmatching the available parameters of NeMo (A to M dwarfsand F to K giants), listed in Table 2.

J. Fremaux et al.: Prospects for population synthesis in the H band 11
Table 2. List of observed stars in the infrared, with the values of theparameters taken from the mean-values listed by Gray (1992)and Schmidt-Kaler (1982) or from (1) Nordstroem et al. (2004), (2) Cayrel de Strobel et al. (2001) and (3) Barbuy & Grenon(1990). In the last column, when no information on metallicity is available, a tick mark replaces it.
Name Spectral Type < v sini >(km/s) Teff(K) log g [Fe/H]HD159217 A0 V 150 9700 4.3 −
HD27397 F0 IV 120 7100 4.3 −
HD48501 F2 V 90 6850 4.3 +0.01HD26015 F3 V 65 67761 4.3 +0.111
HD30606 F6 V 10 61521 4.4 −0.012
HD98231 F8.5 V 7 57941 4.4 −0.352
HD112164 rG1 V 5 57681 4.4 +0.242
HD10307 G1.5 V 4 57811 4.4 −0.042
HD98230 G2 V 4 57941 4.5 −0.342
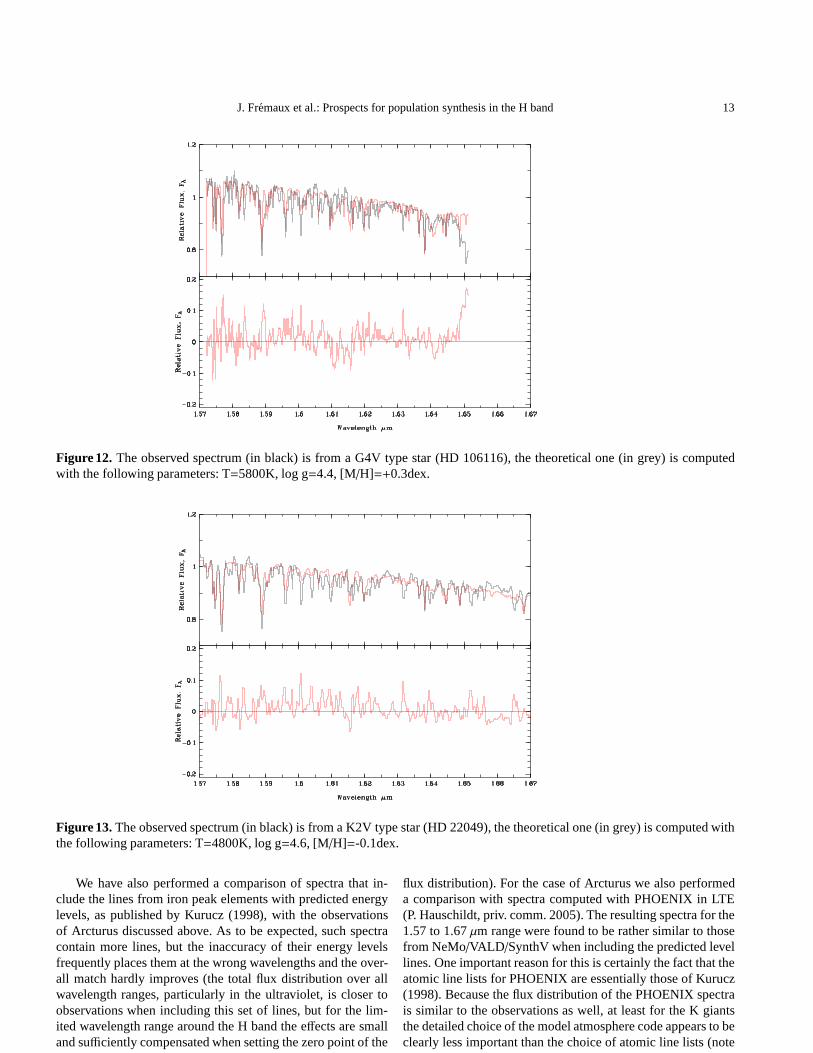
HD106116 rG4 V 3 55721 4.5 +0.152
HD20618 G6 IV 2 5600 4.5 −
HD101501 G8 V 2 54081 4.5 +0.032
HD185144 K0 V 2 52121 4.5 −0.291
HD22049 K2 V 2 51171 4.6 −0.142
HD39715 rK3 V 1 4850 4.6 +0.333
HD131977 K4 V 1 4700 4.6 +0.032
HD201902 K7 V 1 4100 4.6 −0.632
GL338 M0 V 1 3900 4.6 −
HD89025 F0 III 80 7100 3.4 −
HD432 F2 III 75 72781 3.2 +0.181
HD107950 G6 III 4 5050 2.8 −0.162
HD197989 K0 III 2 4800 2.7 −0.182
HD3627 K3 III 2 4300 2.0 +0.042
Figure 11. The observed spectrum (in black) is from a F8.5V type star (HD98231), the theoretical one (in grey) is computedwith the following parameters: T=5800K, log g=4.6, [M/H]=-0.3dex.
6.2. Comparisons
Around 1.6µm hot stars are dominated by the Brackett lines,and a good determination of the rotational velocity of thesestars, which broadens the lines, is very important to have thebest possible match between the computation and the observa-tion. In our wavelength range, the Brackett lines at 1.588, 1.611
and 1.641µm are nearly the only features of the observed spec-tra. They are well fitted by the theoretical spectra.
When the temperature decreases, some atomic features ap-pear and the comparison between observed and computed spec-tra deteriorates. Indeed, for the F6V, a quite large amount ofmetallic lines, visible in the observed spectra, are not present ortoo weak in the computed spectra and this trend continues with

12 J. Fremaux et al.: Prospects for population synthesis inthe H band
the F8.5V (Fig. 11). The continuum of these observed spectrais very well reproduced, but this is not the case for the lines:most of the metallic lines are computed too weak.
In addition, for the F8.5V star, the Brackett lines at 1.611and 1.641µm, are computed too strong. Indeed, the Brackettlines have almost disappeared in the observed spectrum but arestill strong in the computation.
These Brackett lines are also present in all the theoreticalGstars, which is not always the case for observed stars, as seen inFig. 12. The behaviour of the computed Brackett lines towardsthe temperature is shown on Fig. 3; the Brackett lines are stillpresent in theoretical spectra for temperatures as low as 5200K.
Then, when the temperature decreases, as expected, theBrackett lines are fainter and atomic lines (FeI, SiI, MgI andCaI) become stronger and stronger for the observed spectra,aswell as the theoretical spectra. But the agreement between thecomputed and the observed stars becomes worse. From Fig. 12to 15, the residuals between observed and theoretical spectrashow that several absorption lines are missing in the theoreti-cal stars, iron lines for the most part. The model atmosphereisnot the reason because the continuum shape is very good andseveral lines match perfectly, but the line list needs to be im-proved.
In the infrared range, the lack of several metallic andmolecular lines causes the discrepancies, with enhanced dif-ferences at low temperature due to the greatest strength of thelines for the coolest star (Fig. 15). Fig. 13 and 14 present twosimilar stars (K2V and K4V, respectively), the first one is fromMeyer and the second one is a VLT observation at higher res-olution. Both comparisons show this lack of absorption lines,with more details visible for Fig. 14.
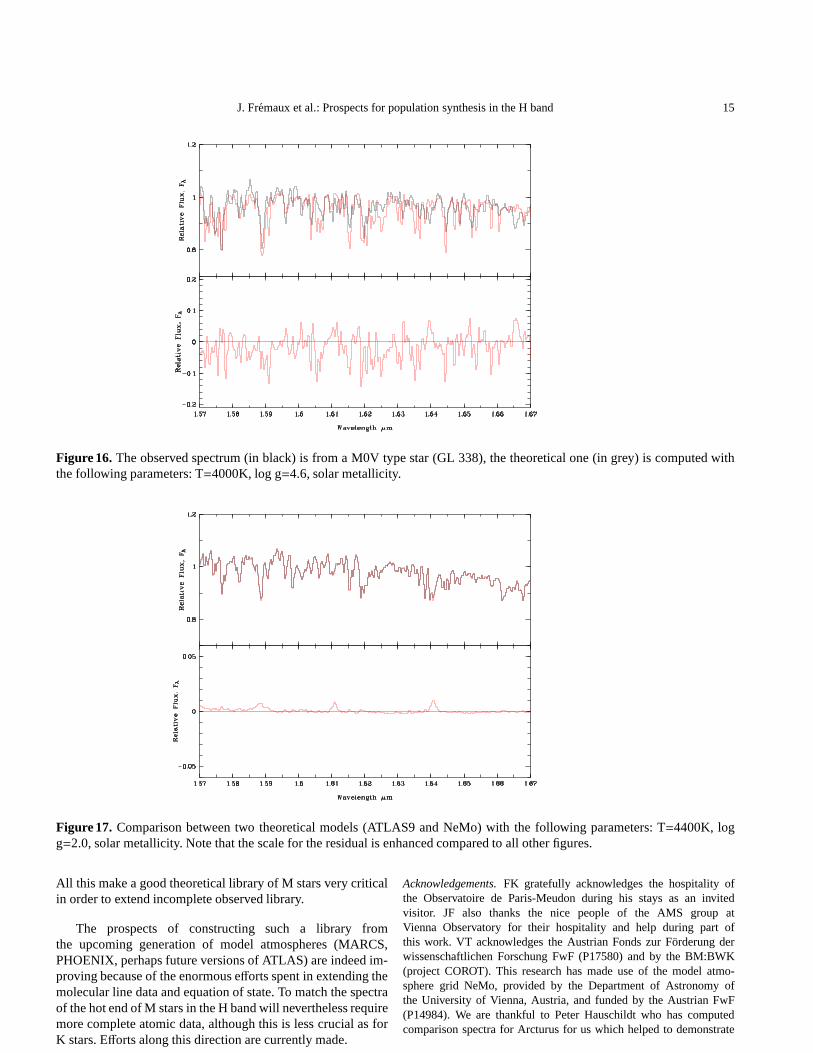
The comparison for the coolest dwarf star of this sample, aM0V, is not so bad for such a low temperature. The continuumis good in spite of the limitations of the model (Fig. 16). Wenotice, however, that at the contrary of the previous spectra,the absorption lines are computed too strong for the theoreticalspectrum, as seen thanks to the residual. This is probably due tothe limit of validity of the model atmospheres, as already seenin the visible range.
In order to investigate further which lines are missing in thecomputations, we have compared the high-resolution spectrumof the well-known K1III star Arcturus (Hinkle et al. 1995) toatheoretical spectrum computed with the parameters of this star(Teff = 4400 K, log g= 2.0, [M/H]=-0.2,v sini = 3.5 km/s) andpoint out the discrepancies: Fig. 19 shows a detail of this com-parison, and Table 3 lists the missing lines in the whole range.In addition to the lines quoted in Table 3, several other featuresare computed too weak, in particular OH and CO molecularbands, certainly due to an inaccurate determination of the os-cillator strengths, as discussed in Lyubchik et al. (2004).
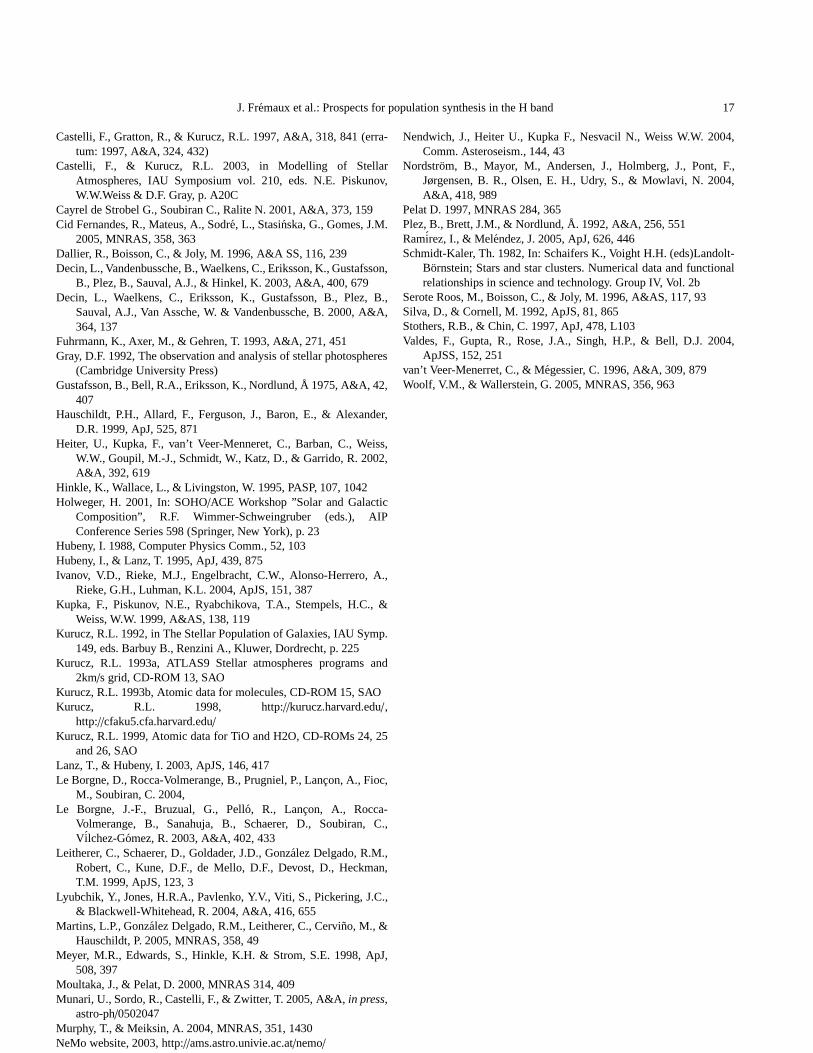
This study, based on the NeMo grids of atmospheres, re-mains valid for the entire familly of the ATLAS models.Indeed, as shown in Fig. 17, two theoretical spectra computedfor the same physical parameters, with the NeMo grid and theATLAS9 models with the overshooting prescription (Kurucz1993a, 1998; Castelli et al. 1997, respectively), are very sim-ilar at our spectral resolution. The discrepancies betweenthe
Table 3. List of the missing lines, according to the comparisonbetween Arcturus and a computed spectrum. The Ni line is notmissing as such but shifted by 2 Å in the atomic database.
wavelength (µm) element wavelength (µm) element1.5764 Fe 1.6208 Fe1.5893 Fe 1.6214 Fe1.5895 Fe 1.6231 Fe1.5913 Fe 1.6285 Fe1.5939 Fe 1.6316 Fe1.5954 Fe 1.6319 Fe1.5968 Fe 1.6362 Ni1.6007 Fe 1.6394 Fe1.6008 Fe 1.6440 Fe1.6041 Fe 1.6450 OH1.6071 Fe 1.6517 Fe1.6076 Fe 1.6524 Fe1.6088 Fe 1.6532 Fe1.6116 Fe 1.6569 Fe1.6126 Fe1.6175 Fe1.6195 Fe
two different theoretical spectra are very faint compared to thediscrepancies between the models and the observed spectra.
The same ATLAS9 models, but without overshooting(NOVER models, Castelli et al. 1997), present even less dif-ferences with the NeMo spectra, in particular the slight dis-crepancy found for the Brackett lines disappear. They are moresensitive than other lines to the fact that the Kurucz overshoot-ing prescription changes the temperatures at Rosseland opticaldepths of 0.1 to 0.5.
7. Conclusions
In spite of some discrepancies, the comparisons between ob-served and theoretical spectra in the visible range suggests areasonable agreement, even at the limits of the parameter rangeof NeMo. However, we have to be careful when we compute amodel near the lower limit in temperature.
The spectra modelized with NeMo can be used to build atheoretical spectral library for A to K dwarf and giant starsinthe visible range, but this is not the case for the near-infraredrange.
Indeed, in the range 1.57 to 1.67µm, the spectra com-puted do not reproduce very well the observations. Albeit thegood agreement for the overall flux distribution shape, wecan see that there are many differences for the line featureswhen focusing on details of the spectra. The strength of theinfrared absorption lines is usually underestimated in calcula-tions, and some lines are simply missing (Fe, OH and CO linesare the most problematic ones). As pointed out by Decin et al.(2003) for the MARCS6 models and Lyubchik et al. (2004)for NextGen models of ultracool dwarfs and a Kurucz modelfor Arcturus, it was not possible to generate synthetic spectrawhich can reproduce observed spectra in the infrared with theline lists that have been used in constructing the model atmo-spheres, even at a medium resolution. In particular, the oscilla-tor strengths are still not known sufficiently well.
J. Fremaux et al.: Prospects for population synthesis in the H band 13
Figure 12. The observed spectrum (in black) is from a G4V type star (HD 106116), the theoretical one (in grey) is computedwith the following parameters: T=5800K, log g=4.4, [M/H]=+0.3dex.
Figure 13. The observed spectrum (in black) is from a K2V type star (HD 22049), the theoretical one (in grey) is computed withthe following parameters: T=4800K, log g=4.6, [M/H]=-0.1dex.
We have also performed a comparison of spectra that in-clude the lines from iron peak elements with predicted energylevels, as published by Kurucz (1998), with the observationsof Arcturus discussed above. As to be expected, such spectracontain more lines, but the inaccuracy of their energy levelsfrequently places them at the wrong wavelengths and the over-all match hardly improves (the total flux distribution over allwavelength ranges, particularly in the ultraviolet, is closer toobservations when including this set of lines, but for the lim-ited wavelength range around the H band the effects are smalland sufficiently compensated when setting the zero point of the
flux distribution). For the case of Arcturus we also performeda comparison with spectra computed with PHOENIX in LTE(P. Hauschildt, priv. comm. 2005). The resulting spectra for the1.57 to 1.67µm range were found to be rather similar to thosefrom NeMo/VALD /SynthV when including the predicted levellines. One important reason for this is certainly the fact that theatomic line lists for PHOENIX are essentially those of Kurucz(1998). Because the flux distribution of the PHOENIX spectrais similar to the observations as well, at least for the K giantsthe detailed choice of the model atmosphere code appears to beclearly less important than the choice of atomic line lists (note

14 J. Fremaux et al.: Prospects for population synthesis inthe H band
Figure 14. The observed spectrum (in black) is from a K4V type star (HD 131977), the theoretical one (in grey) is computedwith the following parameters: T=4800K, log g=4.6, solar metallicity.
Figure 15. The observed spectrum (in black) is from a K3III type star (HD3627), the theoretical one (in grey) is computed withthe following parameters: T=4400K, log g=2.0, solar metallicity.
that PHOENIX uses its own collection of molecular line lists,different from the one we have used here). Considering the uni-formity of the deterioration of the match of spectra in the 1.57to 1.67µm range when looking at the sequence from F to Kstars we conclude that the insufficient line lists, and in particu-lar lists of atomic lines, are the main obstacle for a more satis-factory match of observed spectra of these groups of stars. Themodelizing in the infrared range needs some further improve-ments, in particular for the absorption lines database, before tobuild a theoretical spectral library which can be used with highbenefit instead of an observed star library.
The lack of M stars in spectral library would be very muchprejudicial to the study of stellar populations as the variationsof their strong atomic lines and molecular bands along theirevolution from dwarf to supergiant to giant provides very goodage discriminators (from 106 to 1010yrs). M stars peak in awavelength range which is not much absorbed even in heavilyreddened region, as young stellar clusters, making them easilydetectable. Moreover they are known to be very important con-tributors to the stellar populations of galaxies as well forthemass as for the luminosity following the age of the population.
J. Fremaux et al.: Prospects for population synthesis in the H band 15
Figure 16. The observed spectrum (in black) is from a M0V type star (GL 338), the theoretical one (in grey) is computed withthe following parameters: T=4000K, log g=4.6, solar metallicity.
Figure 17. Comparison between two theoretical models (ATLAS9 and NeMo) with the following parameters: T=4400K, logg=2.0, solar metallicity. Note that the scale for the residualis enhanced compared to all other figures.
All this make a good theoretical library of M stars very criticalin order to extend incomplete observed library.
The prospects of constructing such a library fromthe upcoming generation of model atmospheres (MARCS,PHOENIX, perhaps future versions of ATLAS) are indeed im-proving because of the enormous efforts spent in extending themolecular line data and equation of state. To match the spectraof the hot end of M stars in the H band will nevertheless requiremore complete atomic data, although this is less crucial as forK stars. Efforts along this direction are currently made.
Acknowledgements. FK gratefully acknowledges the hospitality ofthe Observatoire de Paris-Meudon during his stays as an invitedvisitor. JF also thanks the nice people of the AMS group atVienna Observatory for their hospitality and help during part ofthis work. VT acknowledges the Austrian Fonds zur Forderung derwissenschaftlichen Forschung FwF (P17580) and by the BM:BWK(project COROT). This research has made use of the model atmo-sphere grid NeMo, provided by the Department of Astronomy ofthe University of Vienna, Austria, and funded by the Austrian FwF(P14984). We are thankful to Peter Hauschildt who has computedcomparison spectra for Arcturus for us which helped to demonstrate

16 J. Fremaux et al.: Prospects for population synthesis inthe H band
Figure 18. Comparison between a high resolution observation (λ∆λ≃ 100000) of Arcturus (in black) and the corresponding
theoretical star (in grey). The flux is given with continuum normalized to 1 in order to better show the missing lines.
Figure 19. The same as Fig. 18 but zoomed in into a limited wavelength range.
the importance of the line lists used relative to the particular choice ofmodel atmosphere codes.
References
Allard, F., & Hauschildt, P.H. 1995, ApJ, 445, 433Anders, E., & Grevesse, N. 1989, Geochim. Cosmochim. Acta, 53,
197Bagnulo, S., Jehin, E., Ledoux, C., Cabanac, R., Melo, C., Gilmozzi,
R., The ESO Paranal Science Operations Team 2003, TheMessenger, 114, 10
Baraffe, I., Chabrier, G., Allard, F., & Hauschildt, P.H. 2002, A&A,382, 563
Barbuy, B., & Grenon, M. 1990, In: ESO/CTIO Workshop on Bulgesof Galaxies. (A92-18101 05-90),p.83
Bertone, E., Buzzoni, A., Chavez, M., Rodriguez-Merino, L.H. 2004,AJ, 128, 829
Boisson, C., Joly, M., Moultaka, J., Pelat, D., & Serote Roos, M. 2000,A&A 357, 850
Boisson, C., Coupe, S., Cuby, J. G., Joly, M., Ward, M. J. 2002, A&A,396, 489
Bruzual, G., & Charlot, S. 2003, MNRAS, 344, 1000Canuto, V.M., Goldman, I., & Mazzitelli, I. 1996, ApJ, 473, 550Canuto, V.M., & Mazzitelli, I. 1991, ApJ, 370, 295Canuto, V.M., & Mazzitelli, I. 1992, ApJ, 389, 724
J. Fremaux et al.: Prospects for population synthesis in the H band 17
Castelli, F., Gratton, R., & Kurucz, R.L. 1997, A&A, 318, 841(erra-tum: 1997, A&A, 324, 432)
Castelli, F., & Kurucz, R.L. 2003, in Modelling of StellarAtmospheres, IAU Symposium vol. 210, eds. N.E. Piskunov,W.W.Weiss & D.F. Gray, p. A20C
Cayrel de Strobel G., Soubiran C., Ralite N. 2001, A&A, 373, 159Cid Fernandes, R., Mateus, A., Sodre, L., Stasinska, G., Gomes, J.M.
2005, MNRAS, 358, 363Dallier, R., Boisson, C., & Joly, M. 1996, A&A SS, 116, 239Decin, L., Vandenbussche, B., Waelkens, C., Eriksson, K., Gustafsson,
B., Plez, B., Sauval, A.J., & Hinkel, K. 2003, A&A, 400, 679Decin, L., Waelkens, C., Eriksson, K., Gustafsson, B., Plez, B.,
Sauval, A.J., Van Assche, W. & Vandenbussche, B. 2000, A&A,364, 137
Fuhrmann, K., Axer, M., & Gehren, T. 1993, A&A, 271, 451Gray, D.F. 1992, The observation and analysis of stellar photospheres
(Cambridge University Press)Gustafsson, B., Bell, R.A., Eriksson, K., Nordlund, Å 1975,A&A, 42,
407Hauschildt, P.H., Allard, F., Ferguson, J., Baron, E., & Alexander,
D.R. 1999, ApJ, 525, 871Heiter, U., Kupka, F., van’t Veer-Menneret, C., Barban, C.,Weiss,
W.W., Goupil, M.-J., Schmidt, W., Katz, D., & Garrido, R. 2002,A&A, 392, 619
Hinkle, K., Wallace, L., & Livingston, W. 1995, PASP, 107, 1042Holweger, H. 2001, In: SOHO/ACE Workshop ”Solar and Galactic
Composition”, R.F. Wimmer-Schweingruber (eds.), AIPConference Series 598 (Springer, New York), p. 23
Hubeny, I. 1988, Computer Physics Comm., 52, 103Hubeny, I., & Lanz, T. 1995, ApJ, 439, 875Ivanov, V.D., Rieke, M.J., Engelbracht, C.W., Alonso-Herrero, A.,
Rieke, G.H., Luhman, K.L. 2004, ApJS, 151, 387Kupka, F., Piskunov, N.E., Ryabchikova, T.A., Stempels, H.C., &
Weiss, W.W. 1999, A&AS, 138, 119Kurucz, R.L. 1992, in The Stellar Population of Galaxies, IAU Symp.
149, eds. Barbuy B., Renzini A., Kluwer, Dordrecht, p. 225Kurucz, R.L. 1993a, ATLAS9 Stellar atmospheres programs and
2km/s grid, CD-ROM 13, SAOKurucz, R.L. 1993b, Atomic data for molecules, CD-ROM 15, SAOKurucz, R.L. 1998, http://kurucz.harvard.edu/,
http://cfaku5.cfa.harvard.edu/Kurucz, R.L. 1999, Atomic data for TiO and H2O, CD-ROMs 24, 25
and 26, SAOLanz, T., & Hubeny, I. 2003, ApJS, 146, 417Le Borgne, D., Rocca-Volmerange, B., Prugniel, P., Lancon, A., Fioc,
M., Soubiran, C. 2004,Le Borgne, J.-F., Bruzual, G., Pello, R., Lancon, A., Rocca-
Volmerange, B., Sanahuja, B., Schaerer, D., Soubiran, C.,Vilchez-Gomez, R. 2003, A&A, 402, 433
Leitherer, C., Schaerer, D., Goldader, J.D., Gonzalez Delgado, R.M.,Robert, C., Kune, D.F., de Mello, D.F., Devost, D., Heckman,T.M. 1999, ApJS, 123, 3
Lyubchik, Y., Jones, H.R.A., Pavlenko, Y.V., Viti, S., Pickering, J.C.,& Blackwell-Whitehead, R. 2004, A&A, 416, 655
Martins, L.P., Gonzalez Delgado, R.M., Leitherer, C., Cervino, M., &Hauschildt, P. 2005, MNRAS, 358, 49
Meyer, M.R., Edwards, S., Hinkle, K.H. & Strom, S.E. 1998, ApJ,508, 397
Moultaka, J., & Pelat, D. 2000, MNRAS 314, 409Munari, U., Sordo, R., Castelli, F., & Zwitter, T. 2005, A&A,in press,
astro-ph/0502047Murphy, T., & Meiksin, A. 2004, MNRAS, 351, 1430NeMo website, 2003, http://ams.astro.univie.ac.at/nemo/
Nendwich, J., Heiter U., Kupka F., Nesvacil N., Weiss W.W. 2004,Comm. Asteroseism., 144, 43
Nordstrom, B., Mayor, M., Andersen, J., Holmberg, J., Pont, F.,Jørgensen, B. R., Olsen, E. H., Udry, S., & Mowlavi, N. 2004,A&A, 418, 989
Pelat D. 1997, MNRAS 284, 365Plez, B., Brett, J.M., & Nordlund, Å. 1992, A&A, 256, 551Ramirez, I., & Melendez, J. 2005, ApJ, 626, 446Schmidt-Kaler, Th. 1982, In: Schaifers K., Voight H.H. (eds)Landolt-
Bornstein; Stars and star clusters. Numerical data and functionalrelationships in science and technology. Group IV, Vol. 2b
Serote Roos, M., Boisson, C., & Joly, M. 1996, A&AS, 117, 93Silva, D., & Cornell, M. 1992, ApJS, 81, 865Stothers, R.B., & Chin, C. 1997, ApJ, 478, L103Valdes, F., Gupta, R., Rose, J.A., Singh, H.P., & Bell, D.J. 2004,
ApJSS, 152, 251van’t Veer-Menerret, C., & Megessier, C. 1996, A&A, 309, 879Woolf, V.M., & Wallerstein, G. 2005, MNRAS, 356, 963