Embed Size (px)
Citation preview
Nelson Management Limited
Environmental Monitoring Report 2013
Table of Contents
1. Monitoring Strategy 3
2. Biological Diversity 5 3. Productive Capacity of forests 7 4. Forest Ecosystem Health 12 5. Soil and Water 15 6. Carbon 23 7. Socio-economic Benefits 24 8. Legal, Institutional and economic framework 27
1. Monitoring Strategy The Nelson Forests monitoring strategy is aligned with the Montreal Process and covers the criteria and indicators for the conservation and sustainable management of temperate and boreal forests identified in the third edition of the Montreal Process December 2007. Some indicators are commercially sensitive and are not reported in this document these are noted in the text. Background to the Montreal Process and in particular the criterion and indicators is contained in the linked document>
Overview of Montreal
Process
Method and type of information collected for each criterion Objective Reporting frequency Review
Criterion 1 Biological diversity
GIS data coverage, stand records, cadastral datasets, rare threatened and
endangered species sightings, non plantation vegetation/habitat surveys and
classifications SHMAK testing results.
Reports able to be generated
Extent of area by forest/species/age class (including clear cuts)
Extent of non plantation area by protection status
Rare threatened and endangered species sightings
SHMAK test species.
Seedlot diversity
Enable reports to be generated on
biological , species and genetic diversity
Annual report to EIC As requested by
stakeholders
Criterion 2 Productive capacity of forests
GIS, Forest Management Information system, Stand records, Silviculture QC,
PSP, Trial and Inventory data, harvest plans, log sales, grazing licenses, access
permit database
Reports able to be generated
Timber production by species, total volume/hectare, stocking /hectare,
age, regime type, log grade, harvesting method, total recovered volume
against predicted volume by grade by forest by crew, grazing leases and forest
permits issued by type.
To measure the maintenance of productive
capacity of forest ecosystems
Timber volume forecasts over
60, 10, 3, and 1 year time horizon
and
Timber production over 24,12,3 &1
month horizon as required with
annual and quarterly updates.
Access permits as required
Data is gathered
continuously and
periodic reviews
occur quarterly for
timber production
Criterion 3 Forest Ecosystem health
NZ FOA Forest Health surveys and company dothi surveys
Pest notification by territorial authority and staff observations
Weeds by company staff observations
Fire weather status and fire events by Rural Fire Authorities and company staff
Reports able to be generated:
Forest health incursions and observations
Area treated for Dothistroma pini
Area treated with 1080
Herbicides used by type and rate
Weeds controlled by type and forest location
Fire weather status and fire events/incidents
To measure and maintain forest ecosystem
health and vitality
Annual report to EIC includes
Chemical use Other reports as
requested to support operations
within Nelson Forests Limited
reports available to Stakeholders
except where considered
commercially sensitive
Reviews
undertaken in
response to
national initiatives
and company
improvement
initiatives
Criterion 4 Soil and Water
Earthworks plans and engineering design in harvest plans, Staff diaries and
Roadline / operations meetings minutes, Operations completions inspections,
environmental incident reports including major storm events, EIC operations
audits, SHMAK tests, Local authority State of the Environment reports, and stand
records recording of tree growth over multiple rotations and fertiliser use records.
Reports able to be generated:
Stream health
Environmental incidents
Forest growth maintenance and enhancement, fertiliser use
To measure and maintain soil and water
resources
Incidents and stream health, SOE
reports made to EIC as they arise.
Forest productivity reported with
silvi QC
Reviews
undertaken as part
of the EIC process.
Nelson Forests Limited - Monitoring Plan
Criterion 5: Carbon
Total forest carbon and operations energy use to establish a total forest
operations carbon footprint.
Reports able to be generated:
Annual carbon footprint
To measure and maintain forests contribution to
global carbon cycles
Annual As required
Criterion 6: Socio-economic benefits
Economic: Production and sale of timber resources, operations planned and
undertaken R & D and capital investments, Regional economic development
surveys and reports, HR records of employment and wages. Forest valuation
Social: Safety and wellness programmes operating across employees and
contractors, Sponsorship committee, Scholarships offered to University,
Access and use of the forest including grazing, recreation and major sport
events and records of historic and cultural sites
Reports able to be generated:
Business financial reports,
R&D and sponsorship support,
Employee and contractor safety and wellness reports
Forest, cultural and historic sites and ecological attributes and use
To measure and maintain or enhance long term
multiple socio-economic benefits to meet needs
of societies.
Financial and safety is reported
monthly remainder as required
As required
Criterion 7: Legal, Institutional and economic frameworks
Legal: Property title and rates/lease, taxation documents, Business Support
function supporting resource consent and regulatory compliance, public access,
security, education, scholarship programmes and compliments/complaints and
disputes, EIC function to engage public representation in policy development,
EMS reviews and audits to encourage continuous improvement in best practice,
Coronation Forest participation, Resources Forester and Estate Forester
supporting forest measurement, inventory management and Business
Development Analyst integrating new technology
Reports able to be generated:
Legal area, Forestry rights, License conditions, Access agreements
Compliance with Government and local authority taxes
Resource consent number, EMS completions, environmental incidents,
Access and Security events
Forest productivity, growth, and condition
Legal, institutional and policy framework for
forest conservation and sustainable
management
As required As required
NOTE: The monitoring plan is extensive. Financial reports are not publicised. Personal details in any reports are not publicised.
The EIC will be consulted on the format and content of annual monitoring reports from time to time.
2. Biological Diversity Under this criterion the following indicators are reported:
• Land and Forest area
• Area change report for 2013 for P radiata and Douglas-fir. (Forest area by species/age class are commercially sensitive)
• Extent of non plantation area by protection status
• Rare Threatened and Endangered species reported sightings within the FMU
• SHMAK test species diversity is not specifically reported but is available on request. SHMAK test results are reported under Criterion 4 Soil and Water.
• Seedlot diversity is available on request
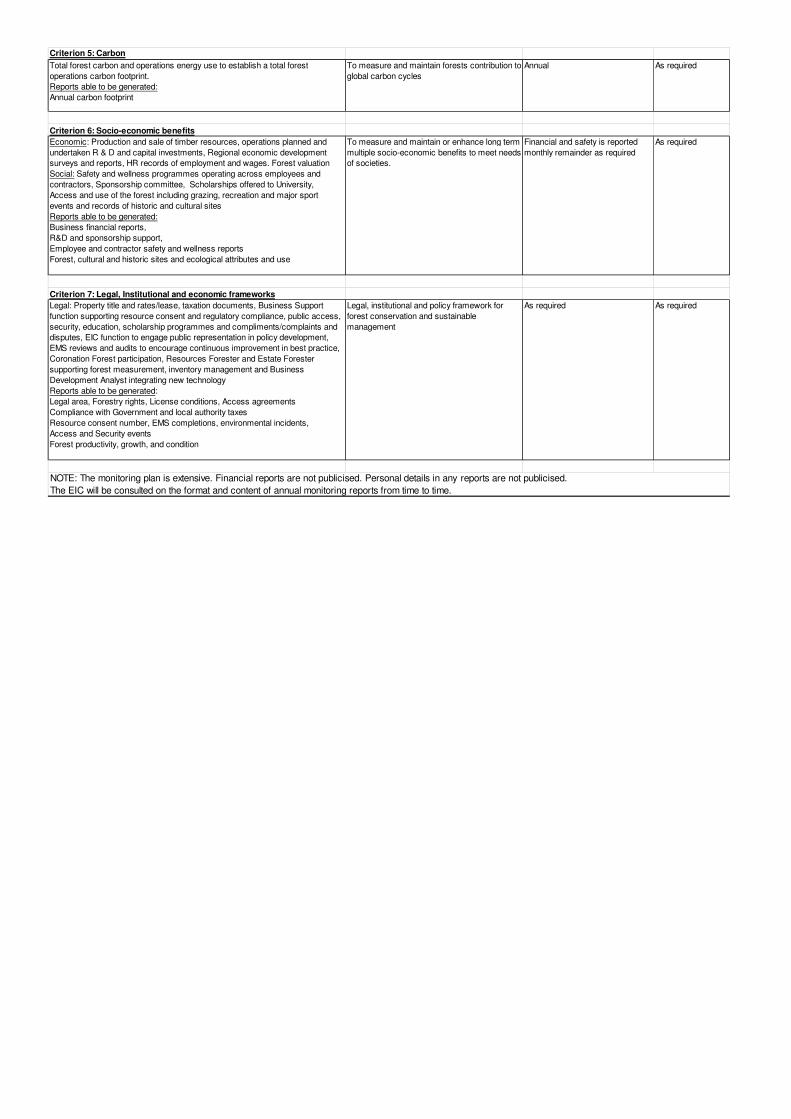
Land and Forest area Table 1 below shows the land and forest area description as at end August 2012. These metrics are updated and reported monthly and change in line with harvesting and replanting activity.
Current
Planted Area
1 Radiata pine 53,329
2 Douglas fir 6,081
3 Muricata pine 410
4 Minor species (various species) 955
Total Planted Area 60,775
Available For Planting 1,630
Potentially plantable (Unstocked gaps/windthrow) 3,197
Total Productive Land 65,602
Non Productive Land
Covenants/significant areas 2,187
Bush/indigenous forests/swamps 5,801
Unplanted Riparian’s/transmission lines/fire breaks 1,051
CFL – unusable (low productive capacity) 1,493
Roads/skids 1,156
Unplanted Other (Steep, Quarry, historic and hydrology) 405
Total Non-Productive Land 12,093
Total Land 77,695
Table 1: Land and Forest area description as at end August 2013
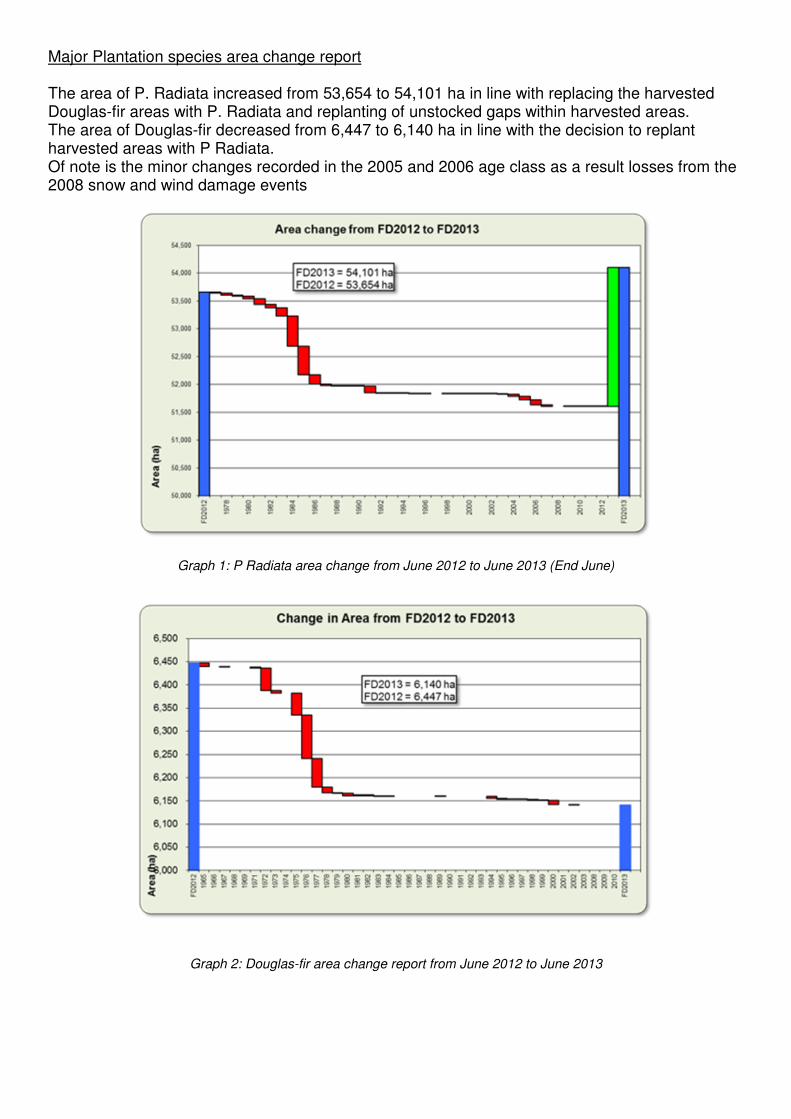
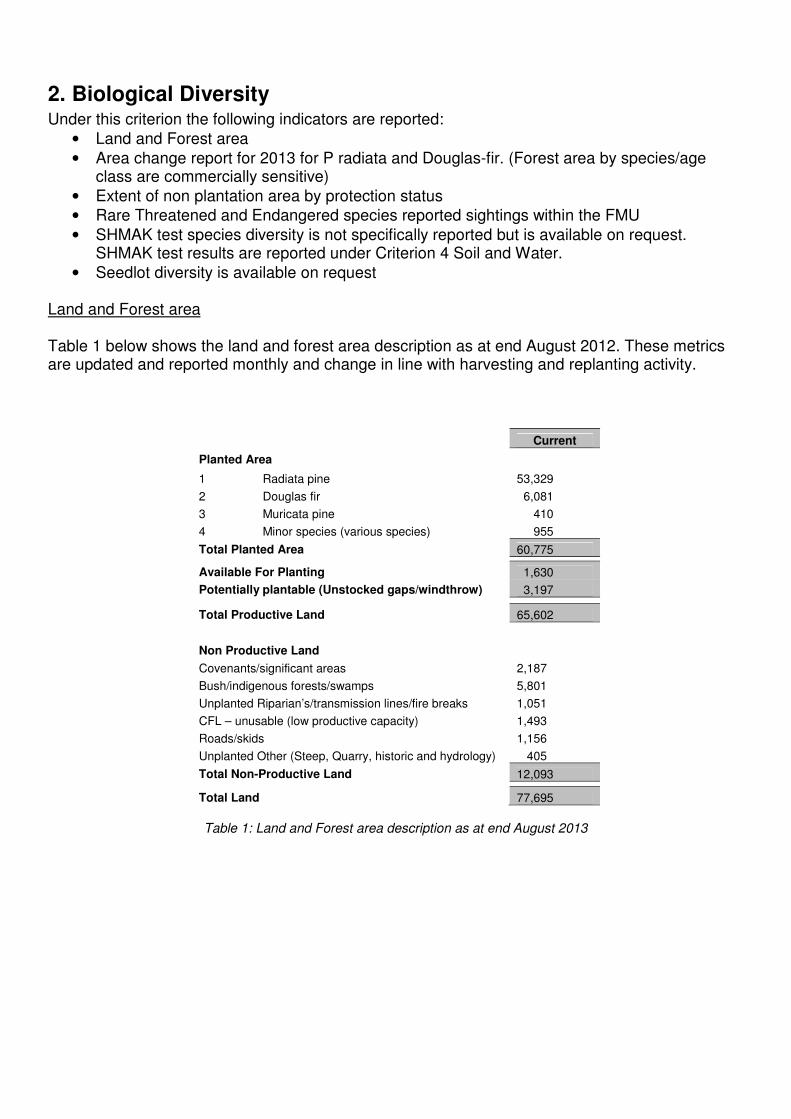
Major Plantation species area change report The area of P. Radiata increased from 53,654 to 54,101 ha in line with replacing the harvested Douglas-fir areas with P. Radiata and replanting of unstocked gaps within harvested areas. The area of Douglas-fir decreased from 6,447 to 6,140 ha in line with the decision to replant harvested areas with P Radiata. Of note is the minor changes recorded in the 2005 and 2006 age class as a result losses from the 2008 snow and wind damage events
Graph 1: P Radiata area change from June 2012 to June 2013 (End June)
Graph 2: Douglas-fir area change report from June 2012 to June 2013
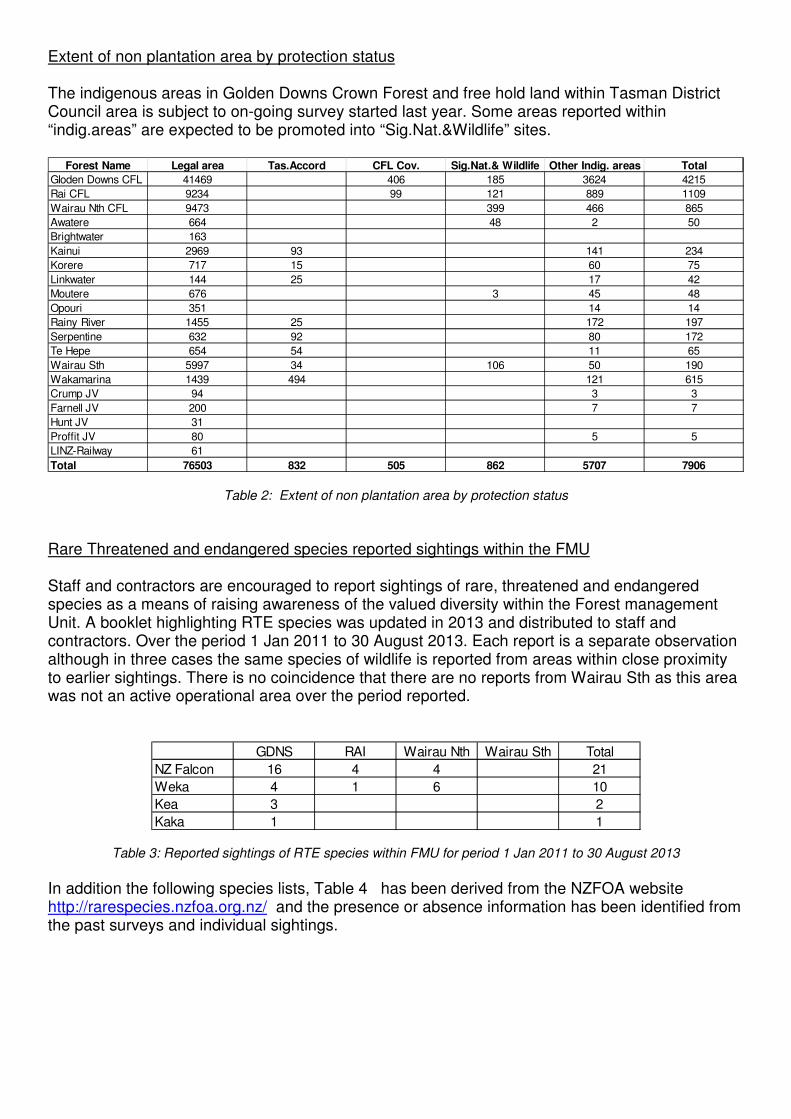
Extent of non plantation area by protection status The indigenous areas in Golden Downs Crown Forest and free hold land within Tasman District Council area is subject to on-going survey started last year. Some areas reported within “indig.areas” are expected to be promoted into “Sig.Nat.&Wildlife” sites.
Table 2: Extent of non plantation area by protection status Rare Threatened and endangered species reported sightings within the FMU Staff and contractors are encouraged to report sightings of rare, threatened and endangered species as a means of raising awareness of the valued diversity within the Forest management Unit. A booklet highlighting RTE species was updated in 2013 and distributed to staff and contractors. Over the period 1 Jan 2011 to 30 August 2013. Each report is a separate observation although in three cases the same species of wildlife is reported from areas within close proximity to earlier sightings. There is no coincidence that there are no reports from Wairau Sth as this area was not an active operational area over the period reported.
Table 3: Reported sightings of RTE species within FMU for period 1 Jan 2011 to 30 August 2013
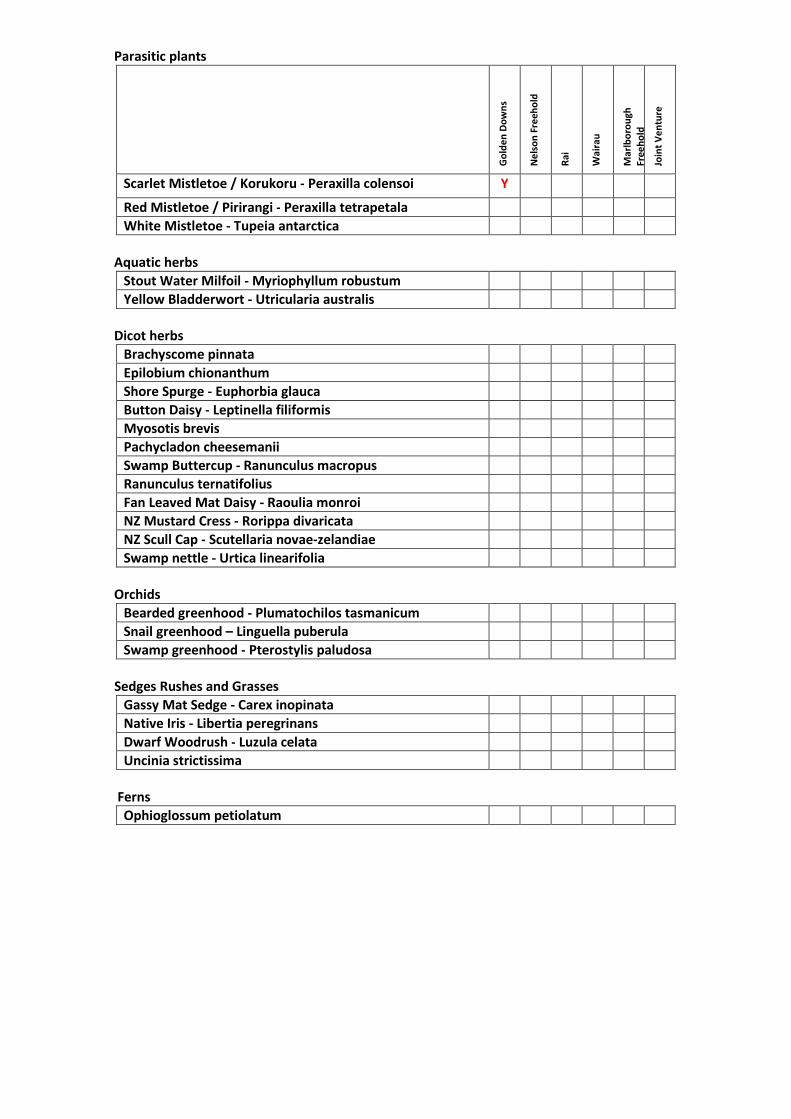
In addition the following species lists, Table 4 has been derived from the NZFOA website http://rarespecies.nzfoa.org.nz/ and the presence or absence information has been identified from the past surveys and individual sightings.
Forest Name Legal area Tas.Accord CFL Cov. Sig.Nat.& Wildlife Other Indig. areas Total
Gloden Downs CFL 41469 406 185 3624 4215
Rai CFL 9234 99 121 889 1109
Wairau Nth CFL 9473 399 466 865
Awatere 664 48 2 50
Brightwater 163
Kainui 2969 93 141 234
Korere 717 15 60 75
Linkwater 144 25 17 42
Moutere 676 3 45 48
Opouri 351 14 14
Rainy River 1455 25 172 197
Serpentine 632 92 80 172
Te Hepe 654 54 11 65
Wairau Sth 5997 34 106 50 190
Wakamarina 1439 494 121 615
Crump JV 94 3 3
Farnell JV 200 7 7
Hunt JV 31
Proffit JV 80 5 5
LINZ-Railway 61
Total 76503 832 505 862 5707 7906
GDNS RAI Wairau Nth Wairau Sth Total
NZ Falcon 16 4 4 21
Weka 4 1 6 10
Kea 3 2
Kaka 1 1
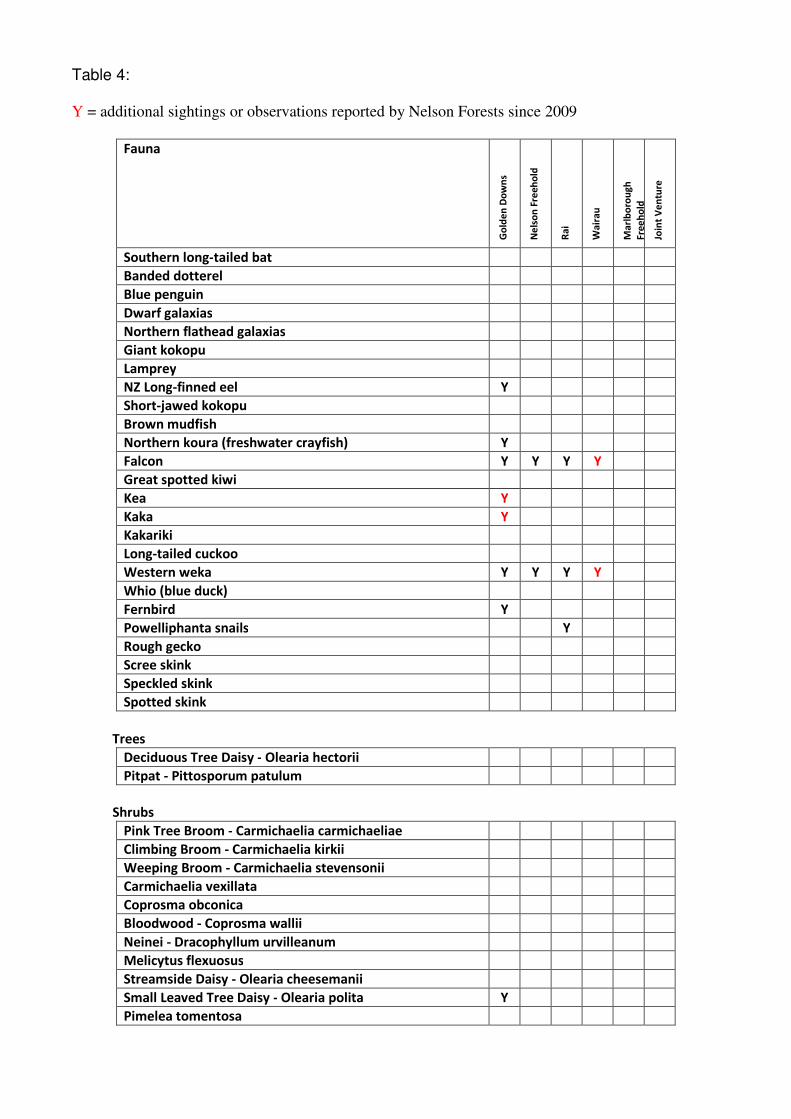
Table 4: Y = additional sightings or observations reported by Nelson Forests since 2009
Fauna
Go
lde
n D
ow
ns
Ne
lso
n F
ree
ho
ld
Ra
i
Wa
ira
u
Ma
rlb
oro
ug
h
Fre
eh
old
Join
t V
en
ture
Southern long-tailed bat
Banded dotterel
Blue penguin
Dwarf galaxias
Northern flathead galaxias
Giant kokopu
Lamprey
NZ Long-finned eel Y
Short-jawed kokopu
Brown mudfish
Northern koura (freshwater crayfish) Y
Falcon Y Y Y Y
Great spotted kiwi
Kea Y
Kaka Y
Kakariki
Long-tailed cuckoo
Western weka Y Y Y Y
Whio (blue duck)
Fernbird Y
Powelliphanta snails Y
Rough gecko
Scree skink
Speckled skink
Spotted skink
Trees
Deciduous Tree Daisy - Olearia hectorii
Pitpat - Pittosporum patulum
Shrubs
Pink Tree Broom - Carmichaelia carmichaeliae
Climbing Broom - Carmichaelia kirkii
Weeping Broom - Carmichaelia stevensonii
Carmichaelia vexillata
Coprosma obconica
Bloodwood - Coprosma wallii
Neinei - Dracophyllum urvilleanum
Melicytus flexuosus
Streamside Daisy - Olearia cheesemanii
Small Leaved Tree Daisy - Olearia polita Y
Pimelea tomentosa
Parasitic plants
Go
lde
n D
ow
ns
Ne
lso
n F
ree
ho
ld
Ra
i
Wa
ira
u
Ma
rlb
oro
ug
h
Fre
eh
old
Join
t V
en
ture
Scarlet Mistletoe / Korukoru - Peraxilla colensoi Y
Red Mistletoe / Pirirangi - Peraxilla tetrapetala
White Mistletoe - Tupeia antarctica
Aquatic herbs
Stout Water Milfoil - Myriophyllum robustum
Yellow Bladderwort - Utricularia australis
Dicot herbs
Brachyscome pinnata
Epilobium chionanthum
Shore Spurge - Euphorbia glauca
Button Daisy - Leptinella filiformis
Myosotis brevis
Pachycladon cheesemanii
Swamp Buttercup - Ranunculus macropus
Ranunculus ternatifolius
Fan Leaved Mat Daisy - Raoulia monroi
NZ Mustard Cress - Rorippa divaricata
NZ Scull Cap - Scutellaria novae-zelandiae
Swamp nettle - Urtica linearifolia
Orchids
Bearded greenhood - Plumatochilos tasmanicum
Snail greenhood – Linguella puberula
Swamp greenhood - Pterostylis paludosa
Sedges Rushes and Grasses
Gassy Mat Sedge - Carex inopinata
Native Iris - Libertia peregrinans
Dwarf Woodrush - Luzula celata
Uncinia strictissima
Ferns
Ophioglossum petiolatum
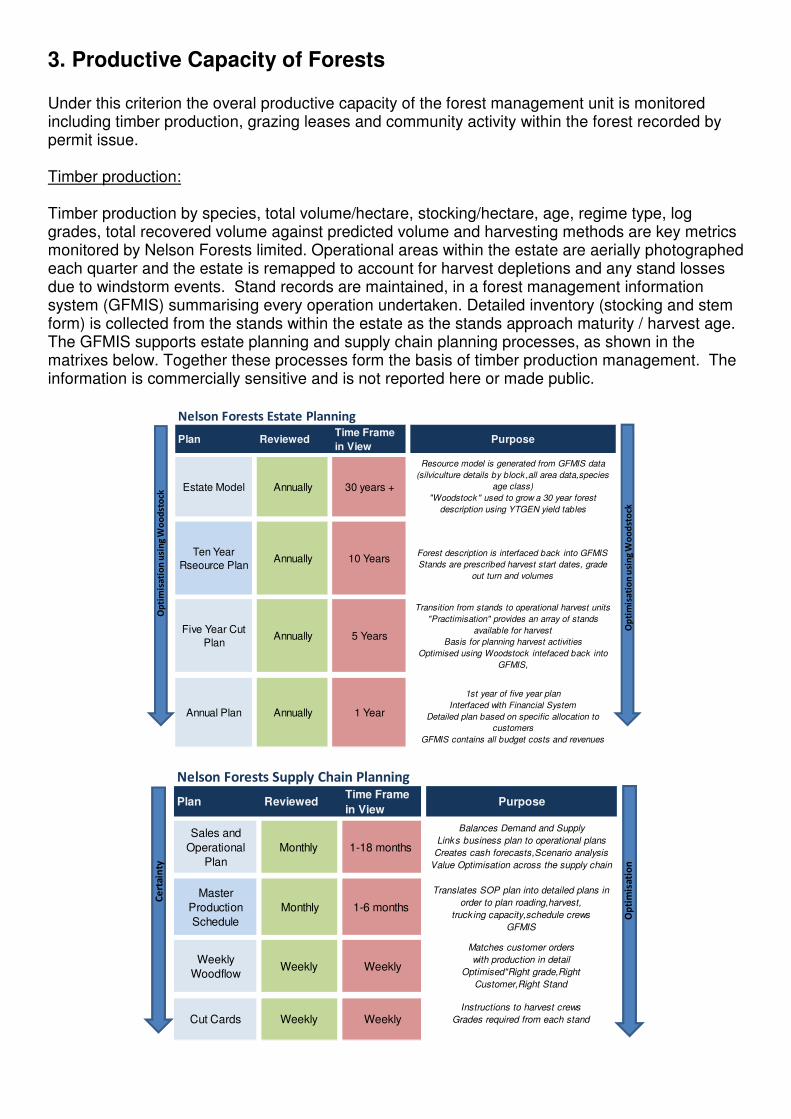
3. Productive Capacity of Forests Under this criterion the overal productive capacity of the forest management unit is monitored including timber production, grazing leases and community activity within the forest recorded by permit issue. Timber production: Timber production by species, total volume/hectare, stocking/hectare, age, regime type, log grades, total recovered volume against predicted volume and harvesting methods are key metrics monitored by Nelson Forests limited. Operational areas within the estate are aerially photographed each quarter and the estate is remapped to account for harvest depletions and any stand losses due to windstorm events. Stand records are maintained, in a forest management information system (GFMIS) summarising every operation undertaken. Detailed inventory (stocking and stem form) is collected from the stands within the estate as the stands approach maturity / harvest age. The GFMIS supports estate planning and supply chain planning processes, as shown in the matrixes below. Together these processes form the basis of timber production management. The information is commercially sensitive and is not reported here or made public.
Nelson Forests Estate Planning
Plan Reviewed Time Frame
in ViewPurpose
Estate Model Annually 30 years +
Resource model is generated from GFMIS data
(silviculture details by block ,all area data,species
age class)
"Woodstock" used to grow a 30 year forest
description using YTGEN yield tables
Ten Year
Rseource PlanAnnually 10 Years
Forest description is interfaced back into GFMIS
Stands are prescribed harvest start dates, grade
out turn and volumes
Five Year Cut
PlanAnnually 5 Years
Transition from stands to operational harvest units
"Practimisation" provides an array of stands
available for harvest
Basis for planning harvest activities
Optimised using Woodstock intefaced back into
GFMIS,
Annual Plan Annually 1 Year
1st year of five year plan
Interfaced with Financial System
Detailed plan based on specific allocation to
customers
GFMIS contains all budget costs and revenues
Op
tim
isa
tio
n u
sin
g W
oo
dst
ock
Op
tim
isa
tio
n u
sin
g W
oo
dst
ock
Nelson Forests Supply Chain Planning
Plan Reviewed Time Frame
in ViewPurpose
Sales and
Operational
Plan
Monthly 1-18 months
Balances Demand and Supply
Links business plan to operational plans
Creates cash forecasts,Scenario analysis
Value Optimisation across the supply chain
Master
Production
Schedule
Monthly 1-6 months
Translates SOP plan into detailed plans in
order to plan roading,harvest,
truck ing capacity,schedule crews
GFMIS
Weekly
WoodflowWeekly Weekly
Matches customer orders
with production in detail
Optimised"Right grade,Right
Customer,Right Stand
Cut Cards Weekly WeeklyInstructions to harvest crews
Grades required from each stand
Ce
rta
inty
Op
tim
isa
tio
n
4. Forest Ecosystem Health
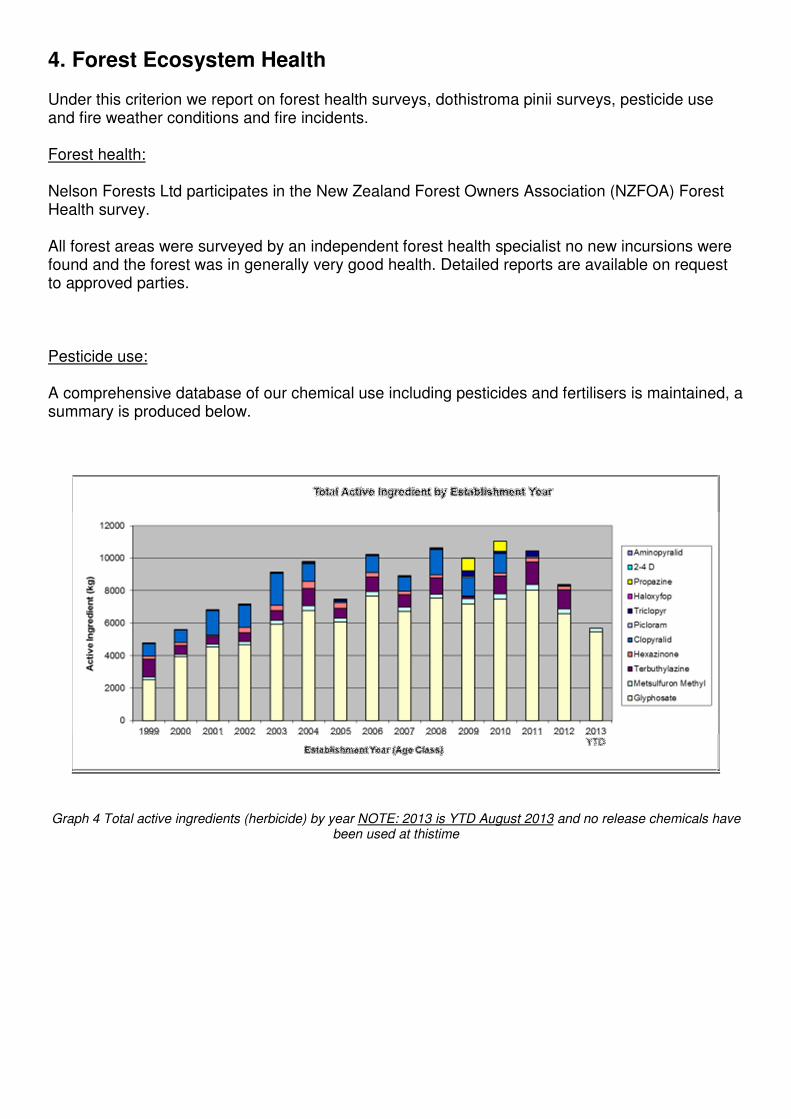
Under this criterion we report on forest health surveys, dothistroma pinii surveys, pesticide use and fire weather conditions and fire incidents. Forest health: Nelson Forests Ltd participates in the New Zealand Forest Owners Association (NZFOA) Forest Health survey. All forest areas were surveyed by an independent forest health specialist no new incursions were found and the forest was in generally very good health. Detailed reports are available on request to approved parties. Pesticide use: A comprehensive database of our chemical use including pesticides and fertilisers is maintained, a summary is produced below.
Graph 4 Total active ingredients (herbicide) by year NOTE: 2013 is YTD August 2013 and no release chemicals have
been used at thistime
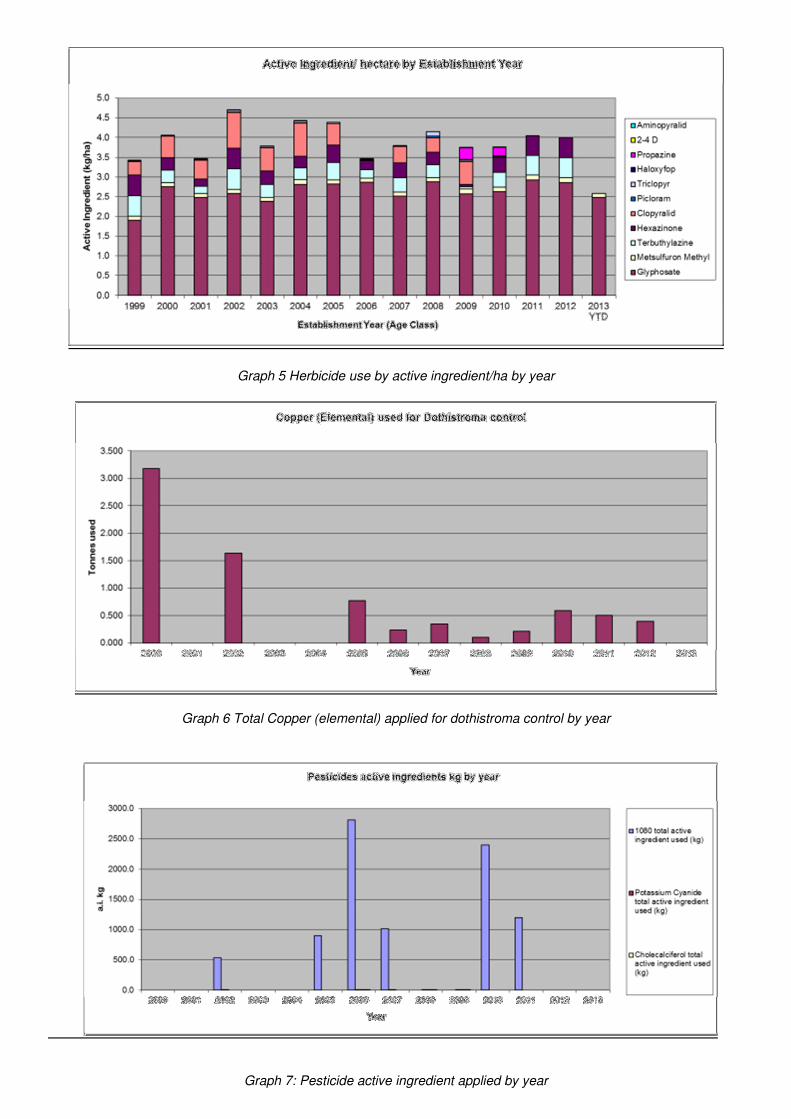
Graph 5 Herbicide use by active ingredient/ha by year
Graph 6 Total Copper (elemental) applied for dothistroma control by year
Graph 7: Pesticide active ingredient applied by year
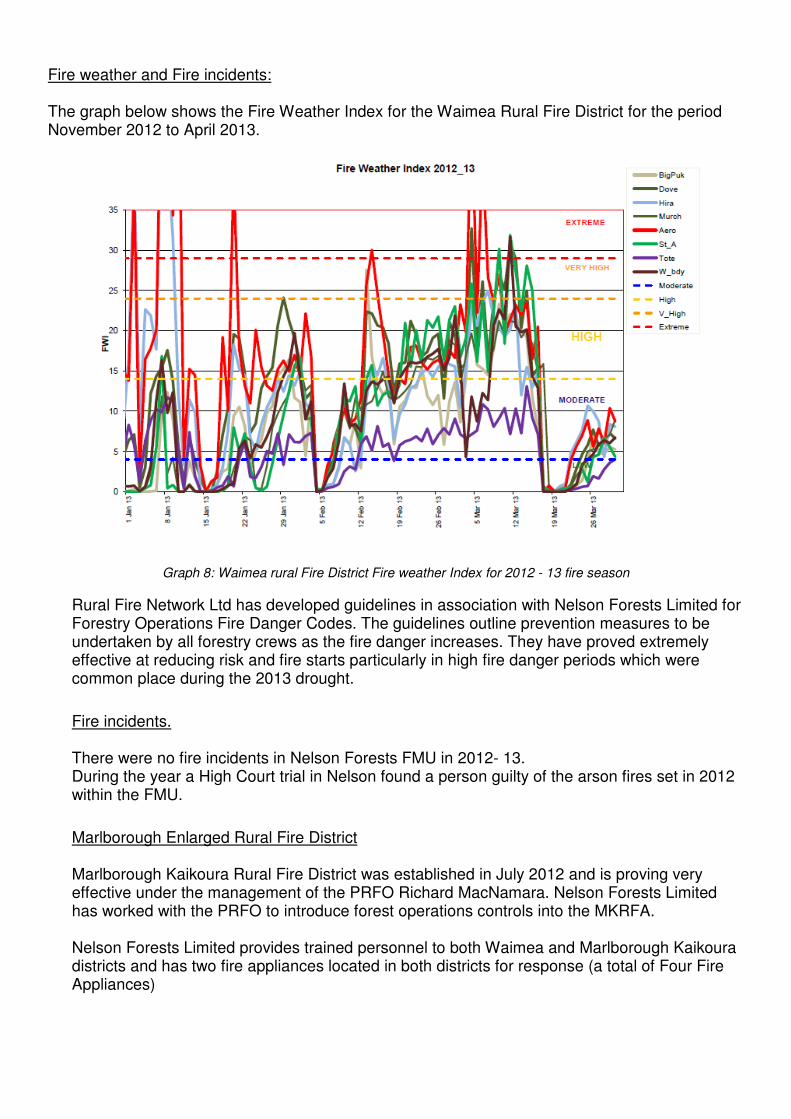
Fire weather and Fire incidents: The graph below shows the Fire Weather Index for the Waimea Rural Fire District for the period November 2012 to April 2013.
Graph 8: Waimea rural Fire District Fire weather Index for 2012 - 13 fire season
Rural Fire Network Ltd has developed guidelines in association with Nelson Forests Limited for Forestry Operations Fire Danger Codes. The guidelines outline prevention measures to be undertaken by all forestry crews as the fire danger increases. They have proved extremely effective at reducing risk and fire starts particularly in high fire danger periods which were common place during the 2013 drought.
Fire incidents. There were no fire incidents in Nelson Forests FMU in 2012- 13. During the year a High Court trial in Nelson found a person guilty of the arson fires set in 2012 within the FMU.
Marlborough Enlarged Rural Fire District Marlborough Kaikoura Rural Fire District was established in July 2012 and is proving very effective under the management of the PRFO Richard MacNamara. Nelson Forests Limited has worked with the PRFO to introduce forest operations controls into the MKRFA. Nelson Forests Limited provides trained personnel to both Waimea and Marlborough Kaikoura districts and has two fire appliances located in both districts for response (a total of Four Fire Appliances)
5. Soil and Water Under this criterion we report:
• Stream health monitoring,
• Environmental observations and incidents reported
• Fertiliser use in the FMU.
• In addition, and where available, we report on local authority state of the environment (SOE) reporting where their forest indicators include sites influenced by our activities within the FMU.
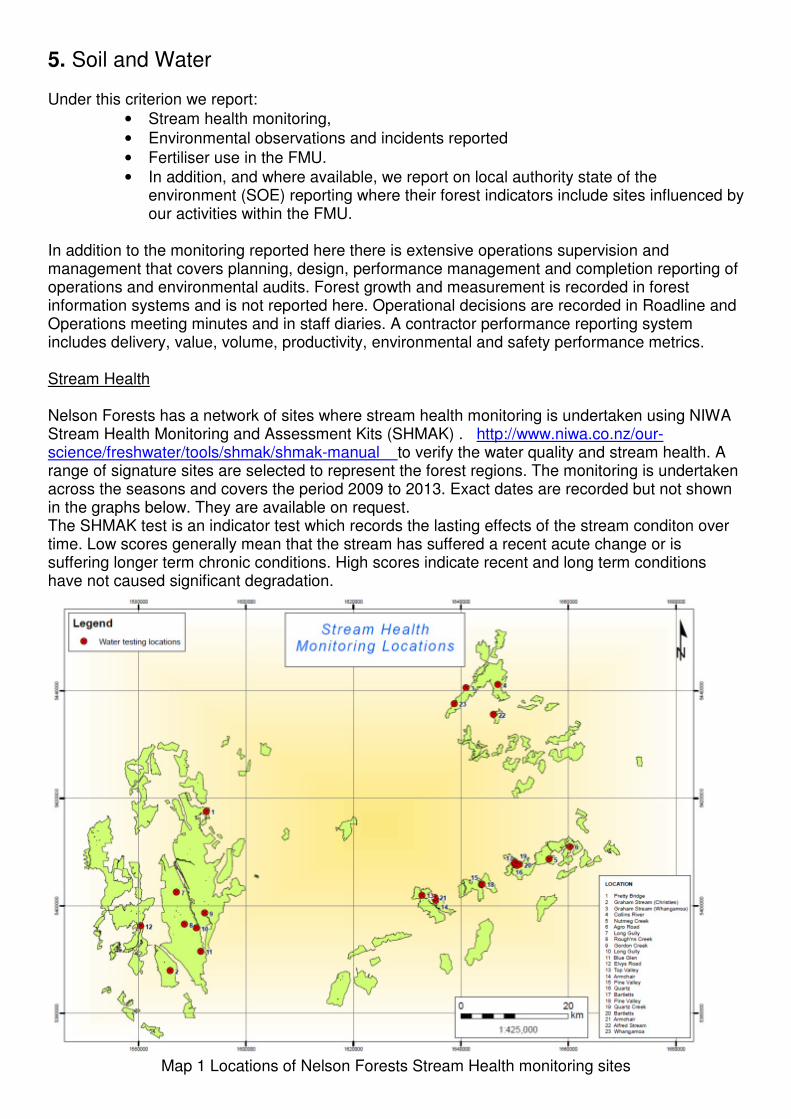
In addition to the monitoring reported here there is extensive operations supervision and management that covers planning, design, performance management and completion reporting of operations and environmental audits. Forest growth and measurement is recorded in forest information systems and is not reported here. Operational decisions are recorded in Roadline and Operations meeting minutes and in staff diaries. A contractor performance reporting system includes delivery, value, volume, productivity, environmental and safety performance metrics. Stream Health Nelson Forests has a network of sites where stream health monitoring is undertaken using NIWA Stream Health Monitoring and Assessment Kits (SHMAK) . http://www.niwa.co.nz/our-science/freshwater/tools/shmak/shmak-manual to verify the water quality and stream health. A range of signature sites are selected to represent the forest regions. The monitoring is undertaken across the seasons and covers the period 2009 to 2013. Exact dates are recorded but not shown in the graphs below. They are available on request. The SHMAK test is an indicator test which records the lasting effects of the stream conditon over time. Low scores generally mean that the stream has suffered a recent acute change or is suffering longer term chronic conditions. High scores indicate recent and long term conditions have not caused significant degradation.
Map 1 Locations of Nelson Forests Stream Health monitoring sites
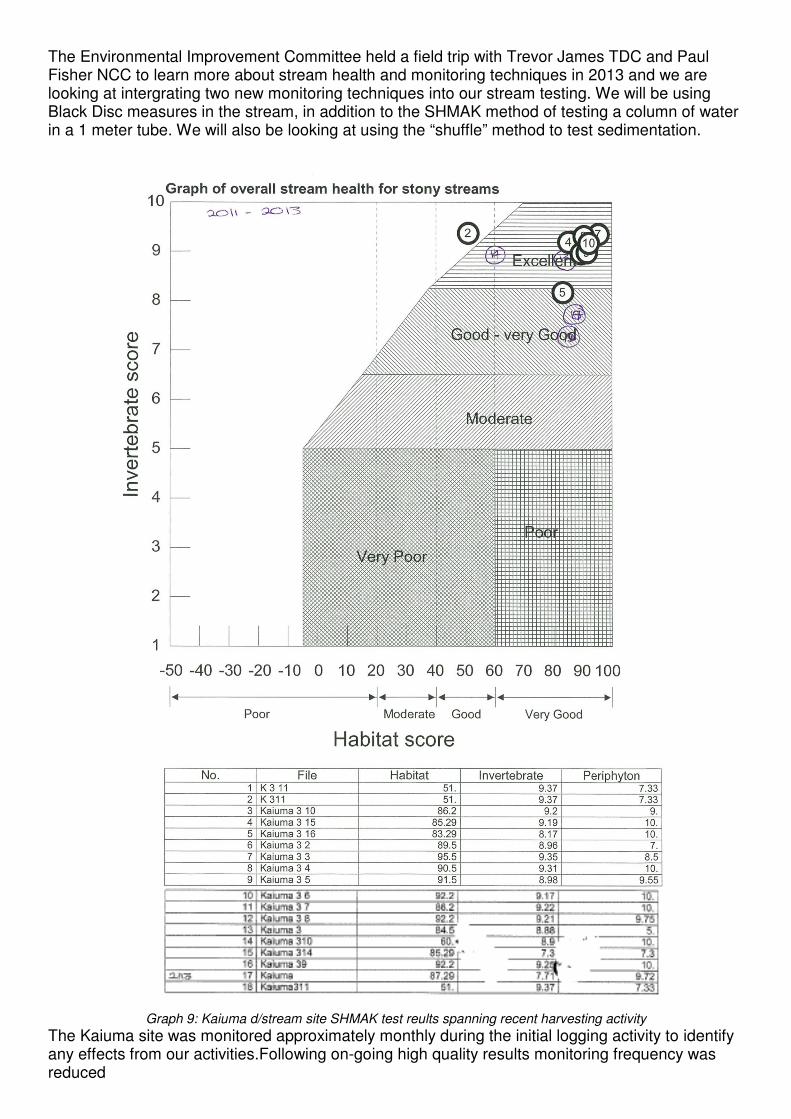
The Environmental Improvement Committee held a field trip with Trevor James TDC and Paul Fisher NCC to learn more about stream health and monitoring techniques in 2013 and we are looking at intergrating two new monitoring techniques into our stream testing. We will be using Black Disc measures in the stream, in addition to the SHMAK method of testing a column of water in a 1 meter tube. We will also be looking at using the “shuffle” method to test sedimentation.
Graph 9: Kaiuma d/stream site SHMAK test reults spanning recent harvesting activity
The Kaiuma site was monitored approximately monthly during the initial logging activity to identify any effects from our activities.Following on-going high quality results monitoring frequency was reduced
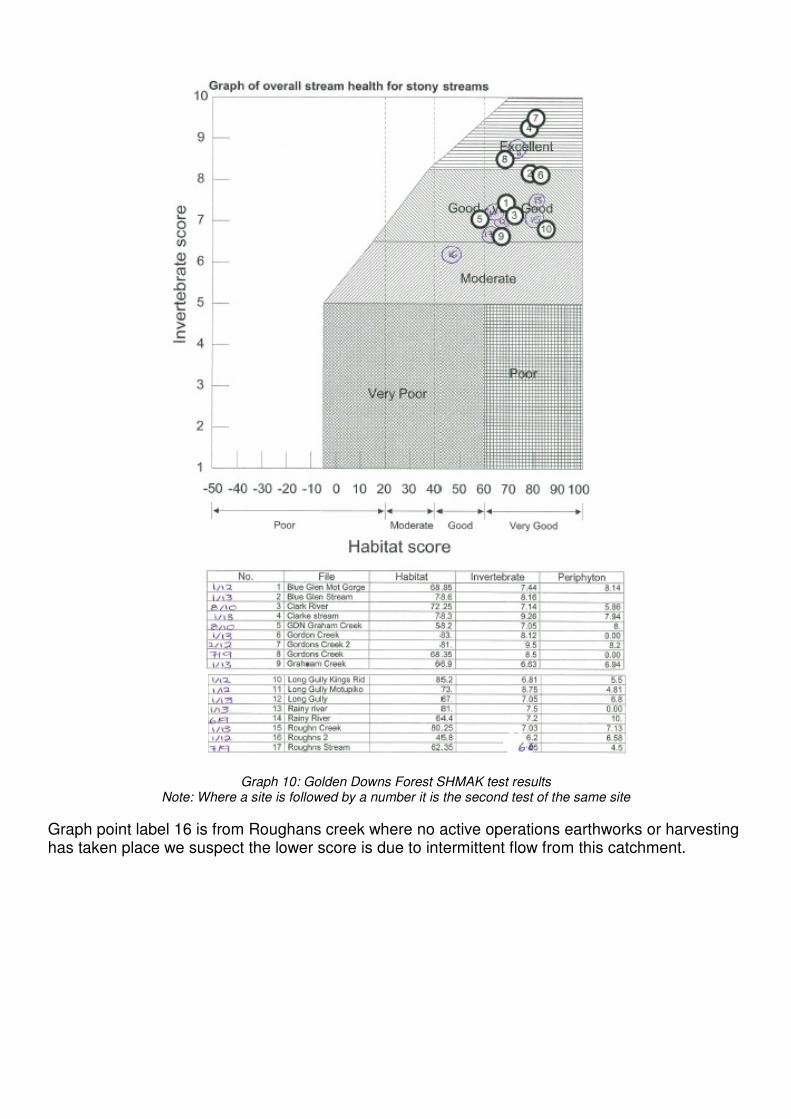
Graph 10: Golden Downs Forest SHMAK test results Note: Where a site is followed by a number it is the second test of the same site
Graph point label 16 is from Roughans creek where no active operations earthworks or harvesting has taken place we suspect the lower score is due to intermittent flow from this catchment.
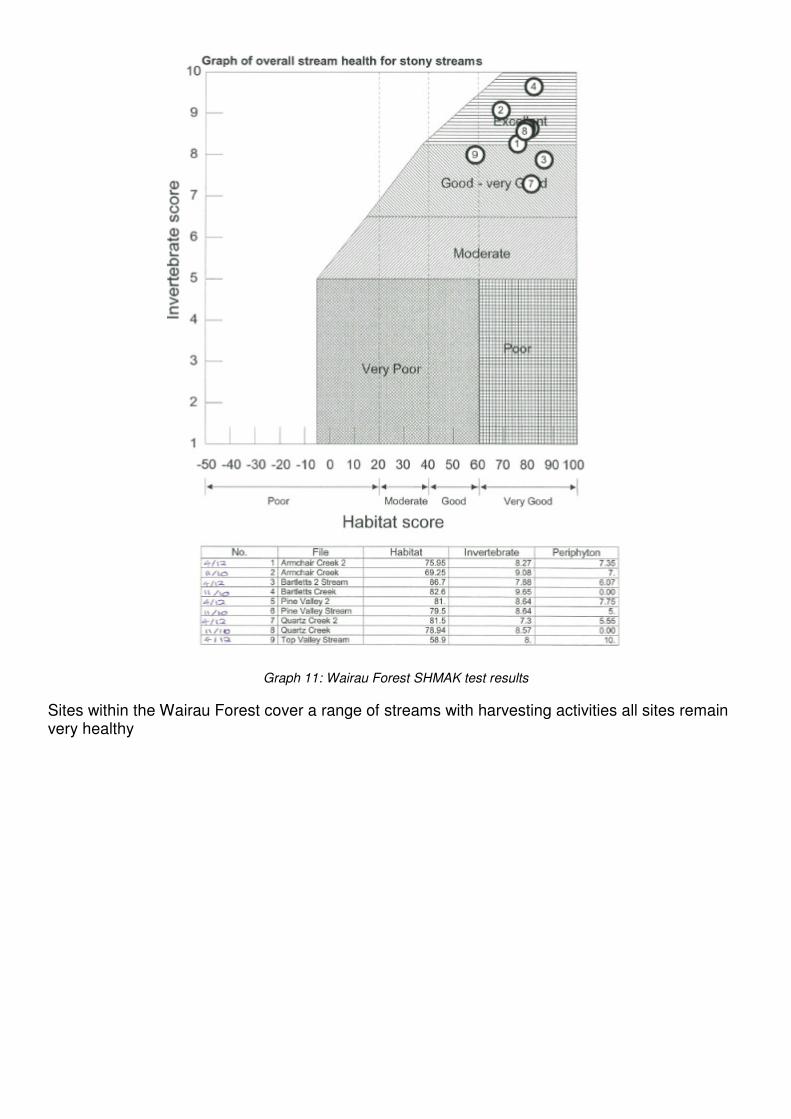
Graph 11: Wairau Forest SHMAK test results
Sites within the Wairau Forest cover a range of streams with harvesting activities all sites remain very healthy
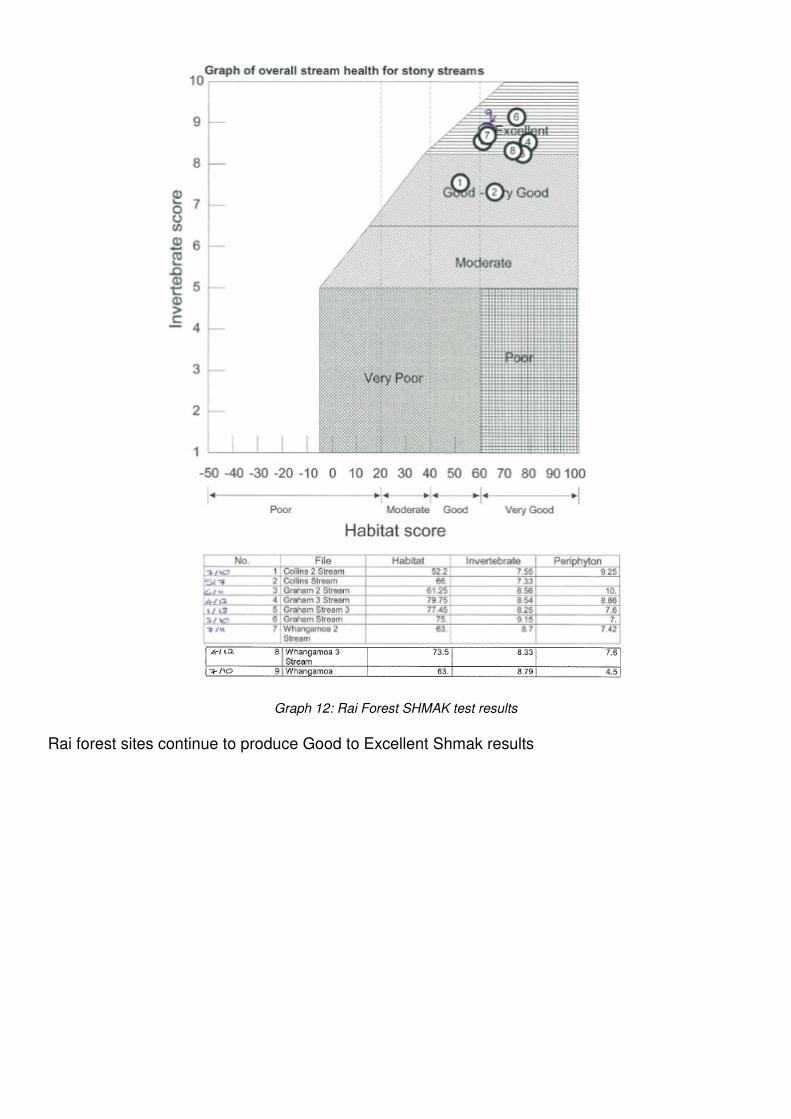
Graph 12: Rai Forest SHMAK test results
Rai forest sites continue to produce Good to Excellent Shmak results
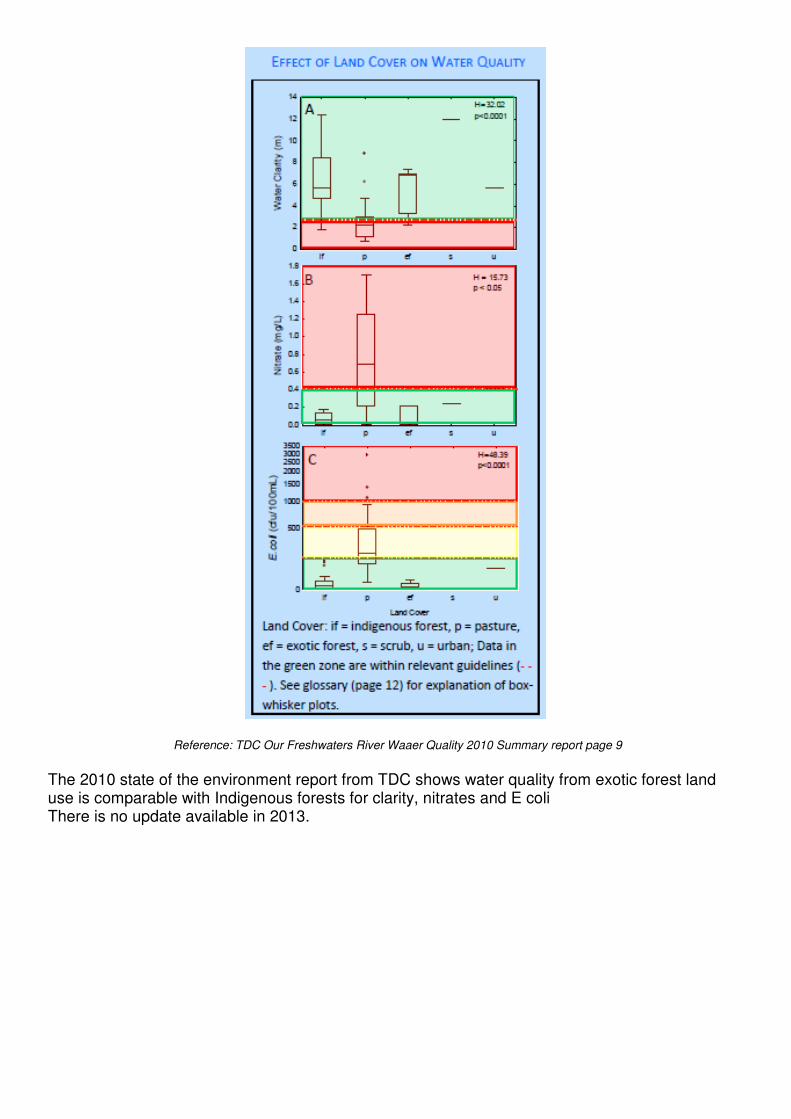
Reference: TDC Our Freshwaters River Waaer Quality 2010 Summary report page 9
The 2010 state of the environment report from TDC shows water quality from exotic forest land use is comparable with Indigenous forests for clarity, nitrates and E coli There is no update available in 2013.
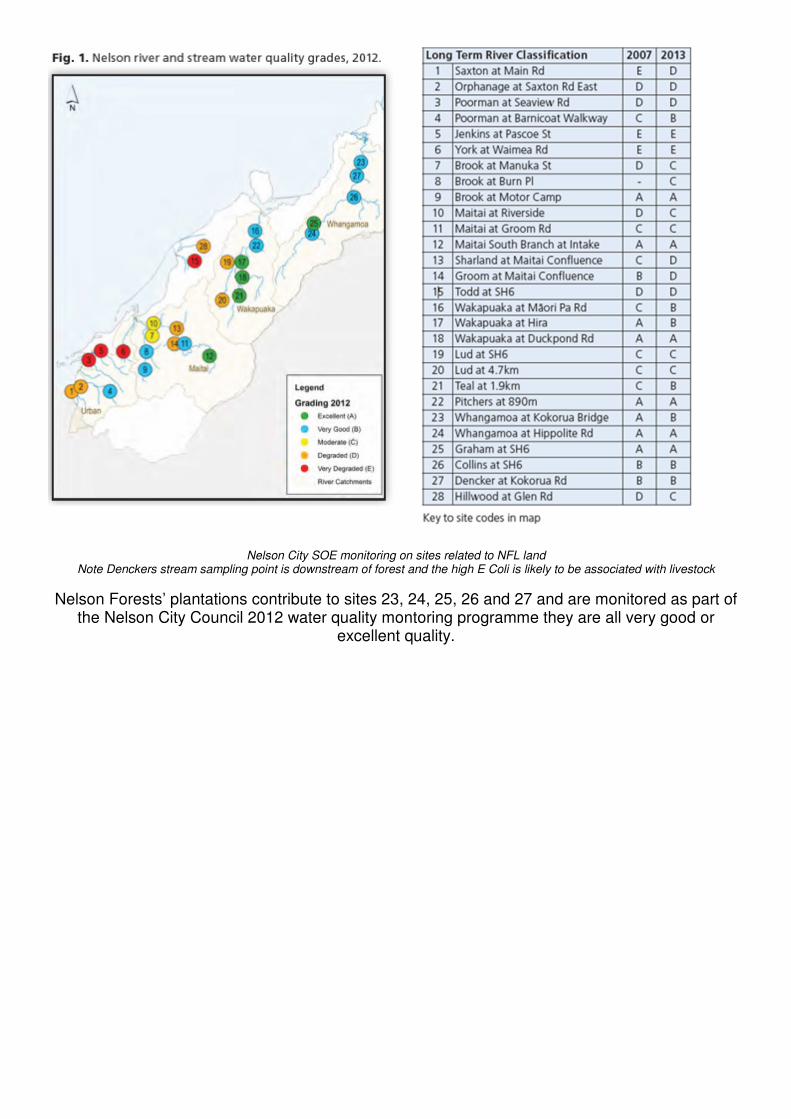
Nelson City SOE monitoring on sites related to NFL land
Note Denckers stream sampling point is downstream of forest and the high E Coli is likely to be associated with livestock
Nelson Forests’ plantations contribute to sites 23, 24, 25, 26 and 27 and are monitored as part of the Nelson City Council 2012 water quality montoring programme they are all very good or
excellent quality.
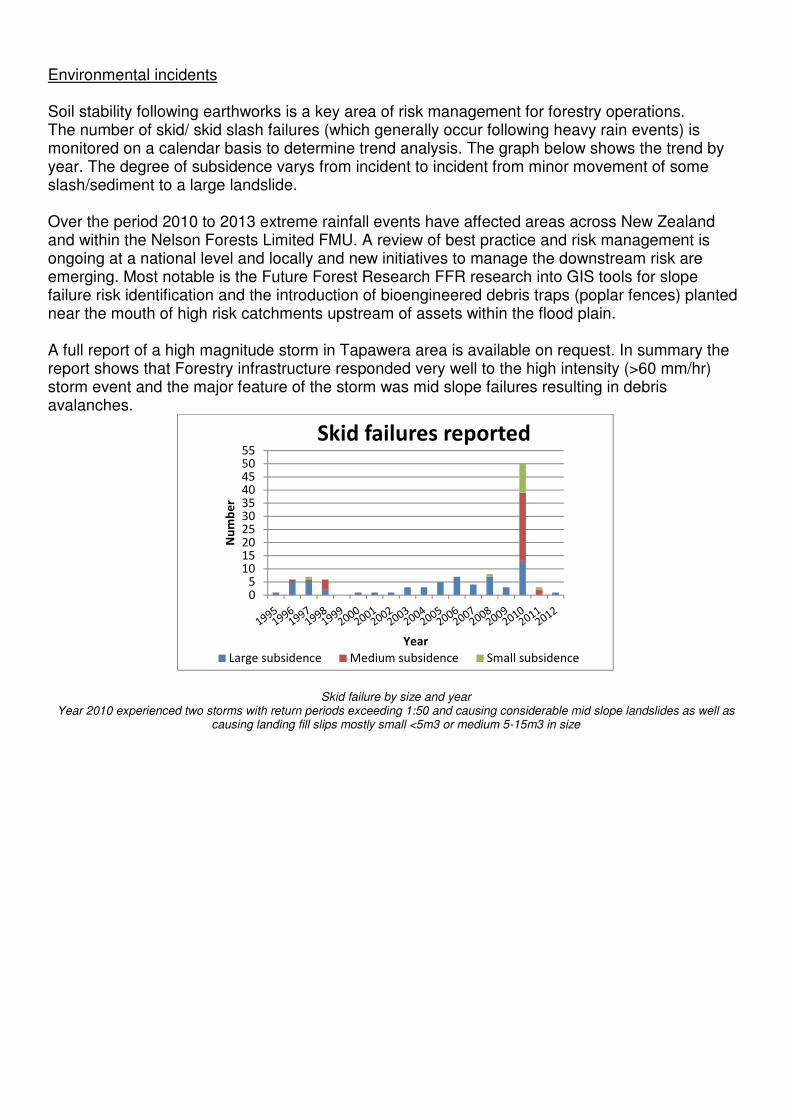
Environmental incidents Soil stability following earthworks is a key area of risk management for forestry operations. The number of skid/ skid slash failures (which generally occur following heavy rain events) is monitored on a calendar basis to determine trend analysis. The graph below shows the trend by year. The degree of subsidence varys from incident to incident from minor movement of some slash/sediment to a large landslide. Over the period 2010 to 2013 extreme rainfall events have affected areas across New Zealand and within the Nelson Forests Limited FMU. A review of best practice and risk management is ongoing at a national level and locally and new initiatives to manage the downstream risk are emerging. Most notable is the Future Forest Research FFR research into GIS tools for slope failure risk identification and the introduction of bioengineered debris traps (poplar fences) planted near the mouth of high risk catchments upstream of assets within the flood plain. A full report of a high magnitude storm in Tapawera area is available on request. In summary the report shows that Forestry infrastructure responded very well to the high intensity (>60 mm/hr) storm event and the major feature of the storm was mid slope failures resulting in debris avalanches.
Skid failure by size and year Year 2010 experienced two storms with return periods exceeding 1:50 and causing considerable mid slope landslides as well as
causing landing fill slips mostly small <5m3 or medium 5-15m3 in size
05
10152025303540455055
Nu
mb
er
Year
Skid failures reported
Large subsidence Medium subsidence Small subsidence
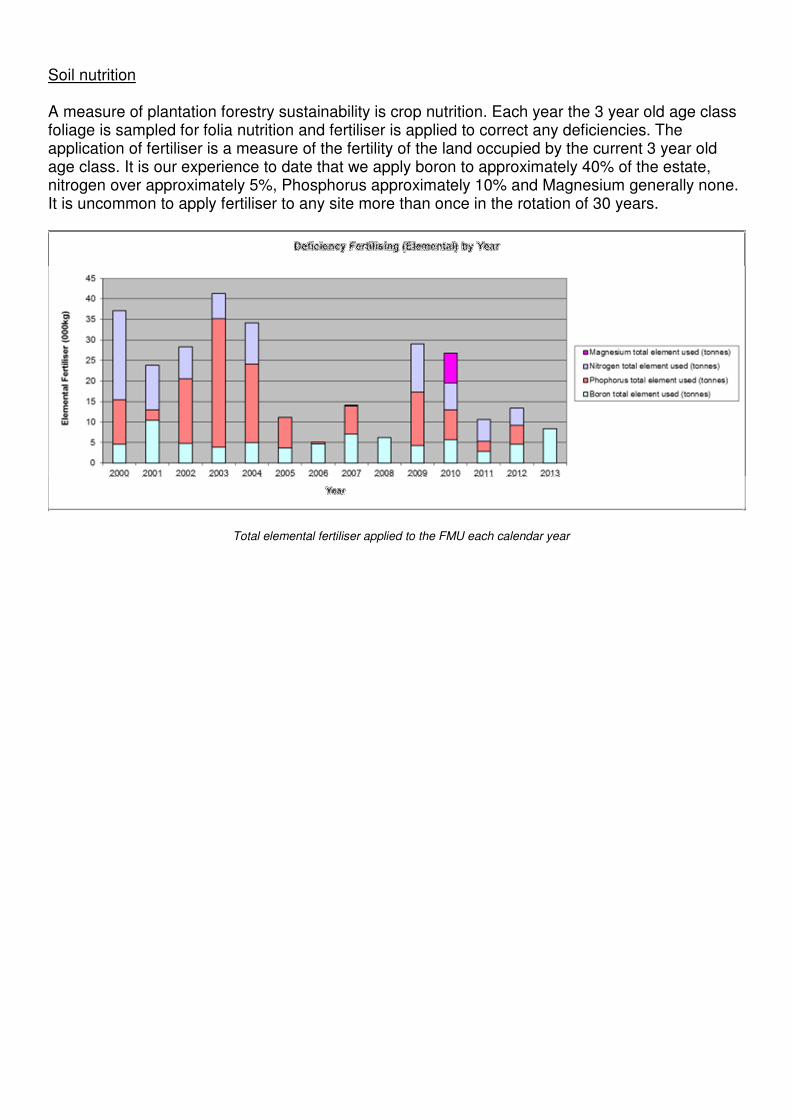
Soil nutrition A measure of plantation forestry sustainability is crop nutrition. Each year the 3 year old age class foliage is sampled for folia nutrition and fertiliser is applied to correct any deficiencies. The application of fertiliser is a measure of the fertility of the land occupied by the current 3 year old age class. It is our experience to date that we apply boron to approximately 40% of the estate, nitrogen over approximately 5%, Phosphorus approximately 10% and Magnesium generally none. It is uncommon to apply fertiliser to any site more than once in the rotation of 30 years.
Total elemental fertiliser applied to the FMU each calendar year
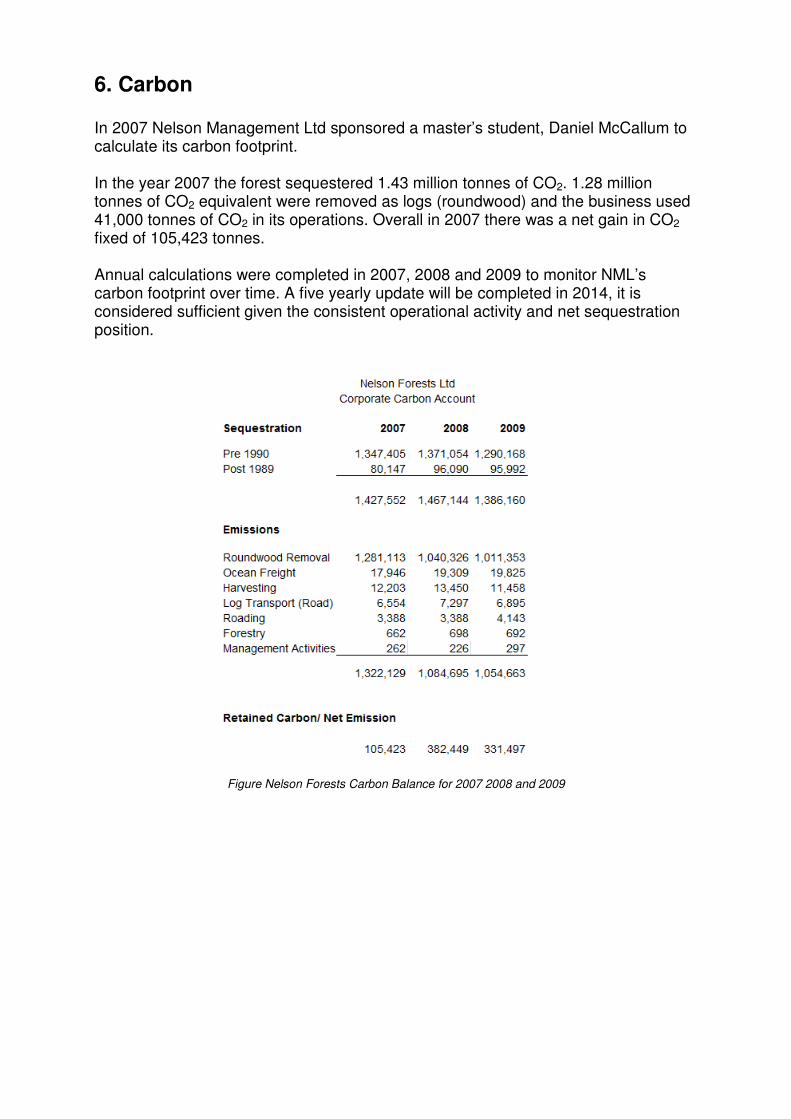
6. Carbon In 2007 Nelson Management Ltd sponsored a master’s student, Daniel McCallum to calculate its carbon footprint. In the year 2007 the forest sequestered 1.43 million tonnes of CO2. 1.28 million tonnes of CO2 equivalent were removed as logs (roundwood) and the business used 41,000 tonnes of CO2 in its operations. Overall in 2007 there was a net gain in CO2
fixed of 105,423 tonnes. Annual calculations were completed in 2007, 2008 and 2009 to monitor NML’s carbon footprint over time. A five yearly update will be completed in 2014, it is considered sufficient given the consistent operational activity and net sequestration position.
Figure Nelson Forests Carbon Balance for 2007 2008 and 2009
7. Socio Economic Benefits Under this criterion we monitor social and economic factors including: Social indicators
• Safety and wellness programmes and results
• Sponsorship
• Scholarships
• Forest Access, incuding grazing, recreation, major sports events Economic indicators
• Production and sale of timber
• Operational planning
• R&D and capital investments
• Regional economic development reports
• HR records
• Forest valuation Many of the socio economic reports are commercially sensitive or include personal information and are not reported here. Social Indicators:
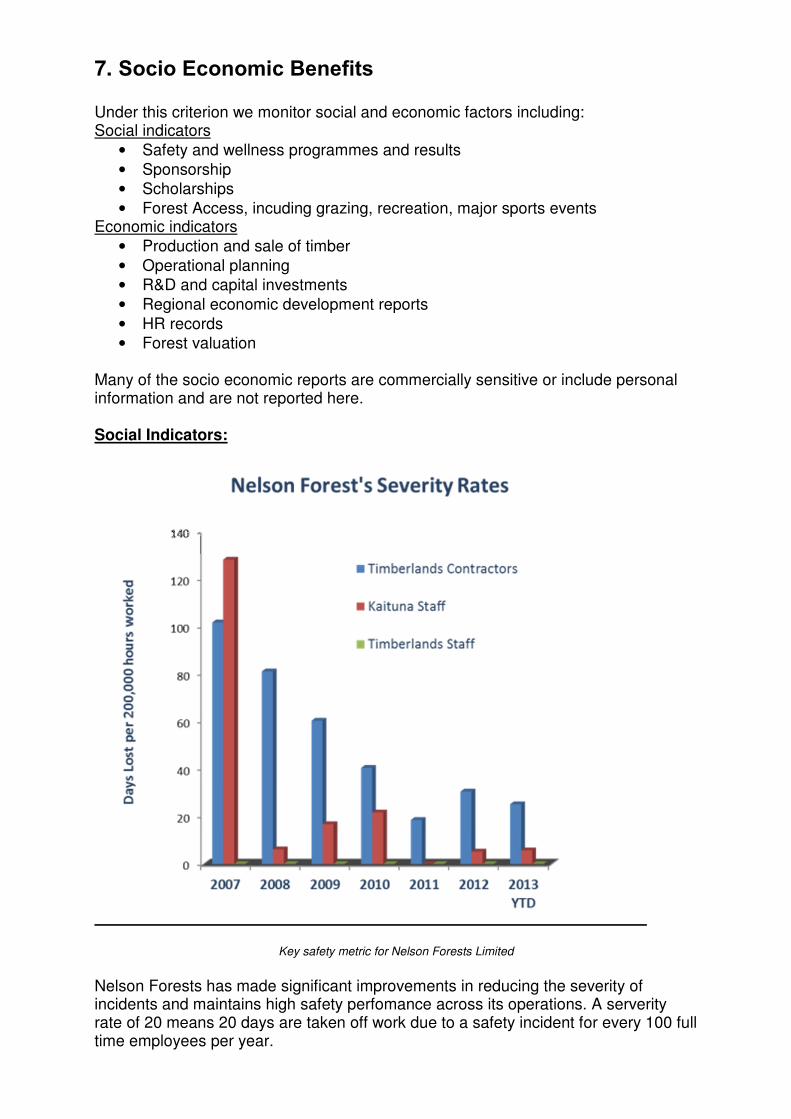
Key safety metric for Nelson Forests Limited
Nelson Forests has made significant improvements in reducing the severity of incidents and maintains high safety perfomance across its operations. A serverity rate of 20 means 20 days are taken off work due to a safety incident for every 100 full time employees per year.
Sponsorship: During the past 18 months Nelson Forests Limited sponsored the following groups Among others:
• Tasman Makos
• Nelson Football club
• Wanderers Sports club
• Tapawera Rugby club
• Nelson Marlborough Rescue Helicopter
• Maori Economic Summit Hui
• Waimea College and Golden Bay High School
• Rai Valley A&P show
• Motueka High School - vehicle for primary trades academy students In addition Nelson Forests limited has awarded sponsorship to a range of individuals across the communities of Nelson and Marlborough Scholarships and educational support: Nelson Forests also welcomes secondary and tertiary student groups including Marlborough Boys College rural studies class, University of Canterbury Forestry School year 3 class and Motueka High School primary trades academy class. Nelson Forests Limited Tertiary Scholarship programme providing funding and work experience for up to 4 students at any time and each scholarship can be awarded for up to 5 years of study per recipient. Economic indicators
• Production and sale of timber
• Operational planning
• R&D and capital investments
• Regional economic development reports
• HR records
• Forest valuation Business financial reports are prepared monthly they are not available for distribution outside the business. Operational planning is documented in working files and diaries of staff and not reported here. Examples are available on request R&D and capital investments: Nelson Forests Limited is a member / shareholder of three research companies namely the Radiata Pine Breeding Company, Future Forests limited and the Solid Wood Initiative. The programmes span the forest growing and wood processing value chain. Research topics include genetic improvement, forest productivity, integrated weed management (and identifying alternative chemicals), and solid wood processing. The research spans applied research as well as stretch or blue skies fundamental research programmes to improve the economic and environmental performance of the forest industry. Kaituna Sawmill completed a significant upgrade programme in 2012 with the installation of a bin sorter and trimmer enabling the increase in log input. The
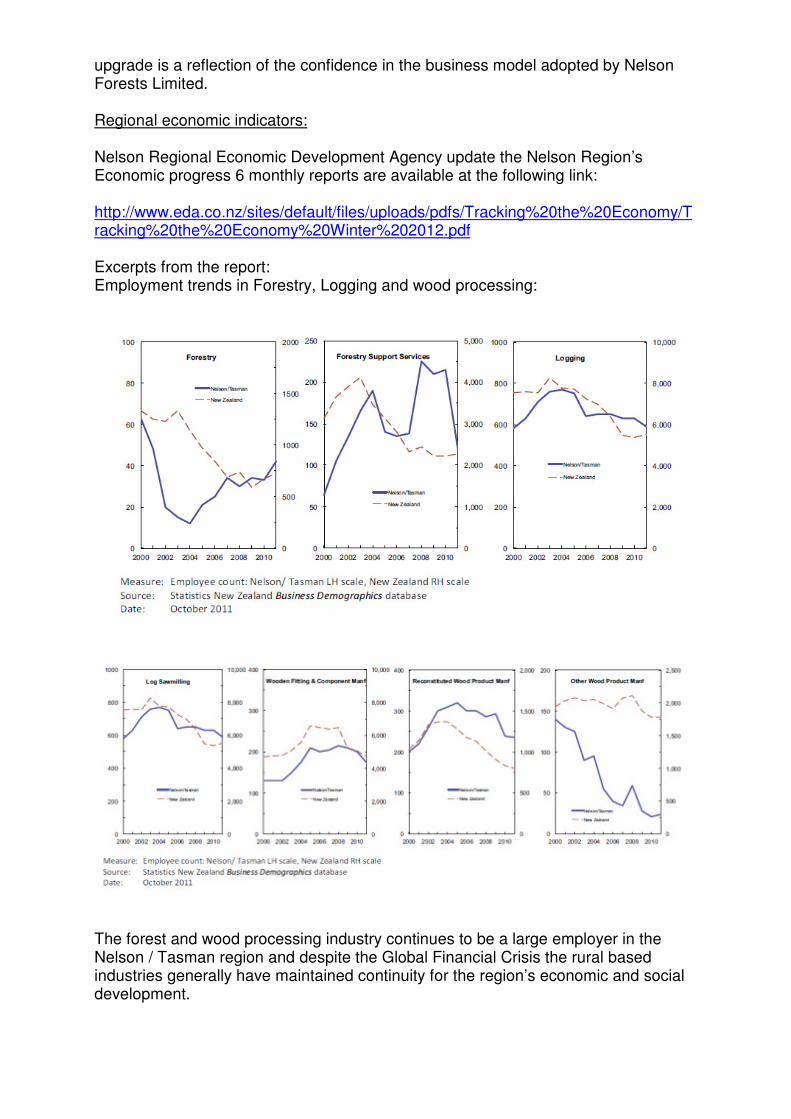
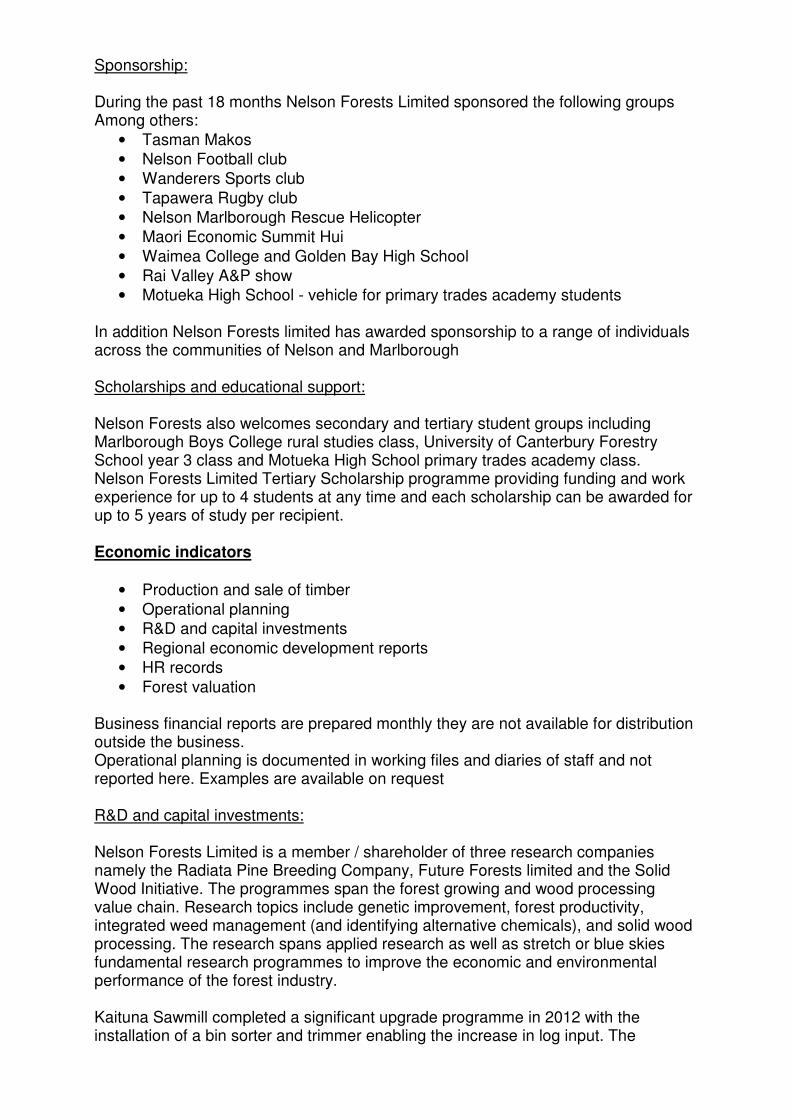
upgrade is a reflection of the confidence in the business model adopted by Nelson Forests Limited. Regional economic indicators: Nelson Regional Economic Development Agency update the Nelson Region’s Economic progress 6 monthly reports are available at the following link: http://www.eda.co.nz/sites/default/files/uploads/pdfs/Tracking%20the%20Economy/Tracking%20the%20Economy%20Winter%202012.pdf Excerpts from the report: Employment trends in Forestry, Logging and wood processing:
The forest and wood processing industry continues to be a large employer in the Nelson / Tasman region and despite the Global Financial Crisis the rural based industries generally have maintained continuity for the region’s economic and social development.
8. Legal, Institutional and Economic Frameworks Under this criterion the following reports are able to be generated:
• Legal area including forestry rights
• CFL Licences and conditions
• Rates and taxes paid
• Access agreements and security
• Compliance with laws including Resource Consents held
• EMS completions
• Environmental incidents
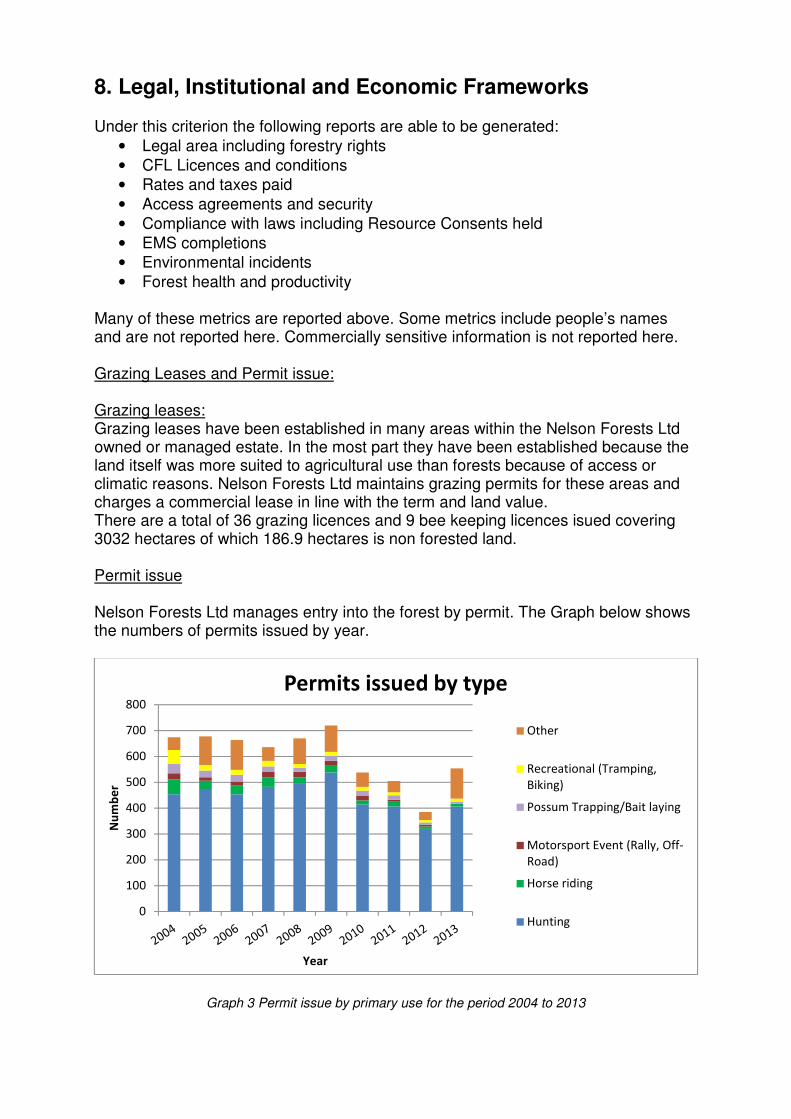
• Forest health and productivity Many of these metrics are reported above. Some metrics include people’s names and are not reported here. Commercially sensitive information is not reported here. Grazing Leases and Permit issue: Grazing leases: Grazing leases have been established in many areas within the Nelson Forests Ltd owned or managed estate. In the most part they have been established because the land itself was more suited to agricultural use than forests because of access or climatic reasons. Nelson Forests Ltd maintains grazing permits for these areas and charges a commercial lease in line with the term and land value. There are a total of 36 grazing licences and 9 bee keeping licences isued covering 3032 hectares of which 186.9 hectares is non forested land. Permit issue Nelson Forests Ltd manages entry into the forest by permit. The Graph below shows the numbers of permits issued by year.
Graph 3 Permit issue by primary use for the period 2004 to 2013
0
100
200
300
400
500
600
700
800
Nu
mb
er
Year
Permits issued by type
Other
Recreational (Tramping,
Biking)
Possum Trapping/Bait laying
Motorsport Event (Rally, Off-
Road)
Horse riding
Hunting
The decline in numbers of permits issued in 2011 and 2012 is believed to be the result of issuing permits for multiple forests and or activities which has reduced a number of duplicated permits otherwise represented in previous years. Each year between the months September and April the forest is generally closed due to fire risk. See section 4 for an overview of fire weather monitoring. Other activities Each year Nelson Forests holds a week long Coronation Forest commemorative event for the schools of Nelson region. Over 170 children aged between 9 and 10 attended Coronation Forest week in Nelson Forests in 2013. Each student planted up to 5 Radiata seedlings and learnt about the value of plantation forestry in providing wood for buildings, jobs for people and allowing native forests to be conserved. Three activities are delivered including planting plantation trees walking a conservation trial with ecologists describing the values in New Zealands natural forest and either visiting a harvesting operation OR undertaking a plantation study looking at the features of a growing plantation forest. The week is enjoyed by both the the schools participating and Nelson Forests staff.