Embed Size (px)
Citation preview
Neil McCullochAmit Grover
ESRC Development Economics ConferenceEffects of the Global Economic Crisis on Developing Countries – 21/22 January 2010
Estimating the impact of the financial crisis in Indonesia: combining rapid qualitative studies
with nationally representative surveys

Qualitative study of the financial crisis • In February 2009 IDS undertook a set of rapid qualitative
assessments in five countries including Indonesia.
• One urban and one rural village were selected for in depth interviews and focus group discussions
• Urban village: Gandasari (Jakarta) is a major Industrial Park with a large population migrant workers.
• Rural village: Simpang Empat (South Kalimantan) heavily dependent on local rubber plantations and coal industry

Key findings from the qualitative survey• High prices for food, agricultural inputs and transport
persisted in both locations Rural village: • Reduced worker income from declining production• Subsequent decline in other economic activities • Some shifts to working in the service sector
Urban village:• Reduction in working hours in the factories • Temporary lay off of permanent workers • Discontinuation of contract workers

Indonesian macroeconomic context
Growth % (y-o-y) 3rd Quarter 2008 1st Quarter 2009 3rd Quarter 2009GDP 6.4 4.4 4.2Inflation 13.51 8.481 2.831
Exports 10.6 -19.1 -22.32
Imports 11 -24.1 -30.842
Exchange rate (Rp/US$)
9,331 11,517 9,633
Investment 12.2 3.5 4
• This was no East Asian Crisis• However large falls in exports in the third quarter of 2009• Possible higher impact on commodity dependent communities
1 Inflation figures are y-o-y figures for the end of the last month of each quarter.2 Jan-Oct 2009 over Jan-Oct 2008.Source: BPS, World Bank (2009)

Data source• Statistics are constructed using the 2008 and 2009
Indonesian Labour Force Survey (Sakernas) • 218,833 individuals (69,114 households) sampled in Feb 08• 931,890 individuals (291,689 households) sampled in Aug 08.• 291,689 individuals (68,535 households) sampled in Feb 09 • February surveys are random subset of the August sample • Data collected for individuals who are 10 that live in a
physical building • Lodgings with > 10 people & people whose needs are
provided by an organisation are not sampled

Were children withdrawn from school ?No longer in school In school last week
Age and gender Feb-08 Aug-08 Feb-09 Feb-08 Aug-08 Feb-09
10 0.008 0.006 0.005** 0.987 0.988 0.99 11 0.011 0.011 0.01 0.983 0.981 0.986 12 0.037 0.034 0.036 0.958 0.956 0.959 13 0.079 0.07* 0.065** 0.915 0.919 0.928** 14 0.131 0.11*** 0.112** 0.86 0.879*** 0.881*** 15 0.201 0.2 0.191 0.791 0.786 0.8 16 0.279 0.287 0.275 0.712 0.698 0.713 17 0.386 0.408** 0.386 0.602 0.575*** 0.605
Male 0.157 0.154 0.149 0.836 0.834 0.844* Female 0.135 0.144** 0.137 0.857 0.845*** 0.856
Total (10-17) 0.146 0.149 0.143 0.846 0.839** 0.85
Source: Sakernas data for respective years
Note: Asterisks in each column indicates statistical significant changes from February 2008; * = significant at 10%; ** = significant at 5%; *** = significant at 1%

Fall in labour participation for under 18sParticipation
Age and gender Feb-08 Aug-08 Feb-09 10 0.015 0.015 0.013 11 0.031 0.023*** 0.025 12 0.057 0.04*** 0.043***13 0.09 0.066*** 0.07***14 0.133 0.102*** 0.111***
15-17 0.263 0.242*** 0.238***18-25 0.643 0.659*** 0.648 26-35 0.754 0.753 0.757 36-45 0.798 0.793 0.796 46-55 0.777 0.79*** 0.801***
56+ 0.543 0.53*** 0.549 Male (15+) 0.836 0.835 0.836
Female (15+) 0.512 0.511 0.518 Total (15+) 0.673 0.672 0.676
Source: Sakernas data for respective years

Unemployment fell for older workers but rose for younger ones
UnemploymentAge and gender Feb-08 Aug-08 Feb-09
10 0.065 0.148** 0.066 11 0.051 0.138*** 0.095 12 0.079 0.109 0.052 13 0.078 0.151*** 0.09 14 0.13 0.142 0.132
15-17 0.211 0.249*** 0.223 18-25 0.198 0.216*** 0.214***26-35 0.087 0.082* 0.082*36-45 0.051 0.036*** 0.043***46-55 0.023 0.017*** 0.016***
56+ 0.008 0.013*** 0.008 Male (15+) 0.079 0.076** 0.077
Female (15+) 0.093 0.097* 0.088*Total (15+) 0.085 0.084 0.081*

Hours worked unchanged during the crisisHours of work
Age and gender Feb-08 Aug-08 Feb-0910 15.201 17.226 17.78511 15.038 18.482 14.5112 17.372 18.681 19.1113 20.173 22.903 20.83114 24.362 26.272 23.639
15-17 33.257 35.702*** 33.73618-25 41.129 41.909*** 41.33226-35 42.556 42.788 42.56736-45 42.216 42.326 42.15246-55 40.395 40.55 40.354
56+ 34.77 35.228 35.077Male (15+) 42.099 42.614 42.053
Female (15+) 37.61 38.028 38.023Total (15+) 40.398 40.885 40.512
Source: Sakernas data for respective years

Share of employment and hours worked by sector
Share of Employment Hours of workSector of the individual Feb-08 Aug-08 Feb-09 Feb-08 Aug-08 Feb-09 Agriculture 0.421 0.405 *** 0.414 32.4 33.2 *** 32.6 Mining and Quarrying 0.010 0.010 0.011 45.2 44.2 44.0 Industry 0.122 0.122 0.120 43.8 43.7 43.6 Electricity, Gas and Water 0.002 0.002 0.002 42.6 44.0 42.8 Construction 0.046 0.053 *** 0.044 46.0 47.0 * 45.8 Trade Restaurant and Acc 0.203 0.207 0.209 * 49.3 49.3 48.9 Transport and Comm 0.058 0.060 0.056 48.4 49.1 48.9 Financial Inst, Real Estate 0.014 0.014 0.014 44.1 42.9 43.0 Social Services, Social & Pers 0.124 0.127 0.130 ** 43.0 42.0 *** 43.3
Source: Sakernas data for respective years
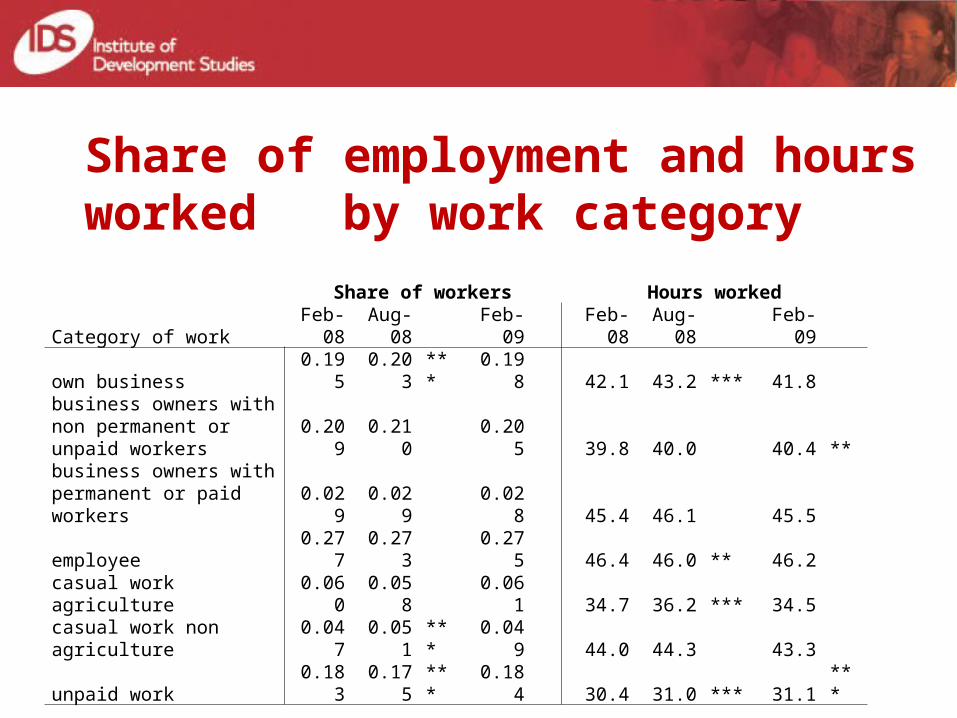
Share of employment and hours worked by work category
Share of workers Hours workedCategory of work Feb-08 Aug-08 Feb-09 Feb-08 Aug-08 Feb-09 own business 0.195 0.203 *** 0.198 42.1 43.2 *** 41.8 business owners with non permanent or unpaid workers 0.209 0.210 0.205 39.8 40.0 40.4 **business owners with permanent or paid workers 0.029 0.029 0.028 45.4 46.1 45.5 employee 0.277 0.273 0.275 46.4 46.0 ** 46.2 casual work agriculture 0.060 0.058 0.061 34.7 36.2 *** 34.5 casual work non agriculture 0.047 0.051 *** 0.049 44.0 44.3 43.3 unpaid work 0.183 0.175 *** 0.184 30.4 31.0 *** 31.1 ***

Wages increased during the crisisPercentage changes
Real Wage (Rupiah per month) Nominal Wage (Rupiah per month) Real Wages Nominal wages
Age and gender Feb-08 Aug-08 Feb-09 Feb-08 Aug-08 Feb-09 Feb08-
Aug08 Feb08-Feb09
Feb08-Aug08
Feb08-Feb09
15-17 469,651 470,892 487,492 493,976 502,855 529,973 0% 4% 2% 7%
18-25 724,545 700,371 766,104 761,080 747,424 831,871 -3% 6% -2% 9%
26-35 1,005,889 998,353 1,079,065* 1,056,669 1,065,434 1,171,276*** -1% 7% 1% 11%
36-45 1,311,045 1,332,889 1,465,920*** 1,377,236 1,423,376 1,591,641*** 2% 12% 3% 16%
46-55 1,608,741 1,641,481 1,789,487*** 1,689,170 1,752,972 1,943,712*** 2% 11% 4% 15%
56+ 1,243,424 1,216,640 1,497,141** 1,305,101 1,298,746 1,623,825** -2% 20% 0% 24%
Male 1,162,348 1,173,385 1,293,014*** 1,221,163 1,252,976 1,404,218*** 1% 11% 3% 15%
Female 886,075 909,449 984,577*** 930,151 970,307 1,068,290*** 3% 11% 4% 15%
Total 1,070,200 1,082,360 1,190,994*** 1,124,099 1,155,490* 1,293,105*** 1% 11% 3% 15%

Wages changes by sectorPercentage changes
Real Wage Rupiah per month Nominal Wage Rupiah per month Real Wage Nominal wages
Sector of the individual Feb-08 Aug-08 Feb-09 Feb-08 Aug-08 Feb-09 Feb08-
Aug08Feb08-Feb09
Feb08-Aug08
Feb08-Feb09
Agriculture 717,624 795,119*** 723,491 756,034 851,767*** 788,112 11% 1% 13% 4%Mining and Quarrying 2,015,396 2,102,264 1,840,817 *** 2,125,965 2,258,565 * 2,015,873 4% -9% 6% -5%Industry 920,908 869,769*** 1,002,005*** 966,614 927,115** 1,085,574*** -6% 9% -4% 12%Electricity, Gas and Water 1,848,231 1,767,199 1,806,329 1,941,746 1,888,439 1,959,084 -4% -2% -3% 1%
Construction 1,084,087 1,024,250 * 1,218,448*** 1,138,929 1,093,257 1,324,231*** -6% 12% -4% 16%Trade Restaurant and Acc 902,201 914,102 955,810** 946,907 974,677 1,035,862 *** 1% 6% 3% 9%
Transport and Comm 1,273,183 1,277,662 1,569,649*** 1,337,079 1,362,912 1,703,966*** 0% 23% 2% 27%Financial Inst, Real Estate 1,744,726 1,652,934 ** 1,831,938 ** 1,830,455 1,761,249 1,984,687 *** -5% 5% -4% 8%
Social Services, Social & Pers 1,181,987 1,246,432 *** 1,344,543*** 1,241,538 1,331,335 *** 1,461,161*** 5% 14% 7% 18%

Compositional changes affect Wages changes
0
1,000,000
2,000,000
3,000,000
4,000,000
5,000,000
6,000,000
10-14 15-19 20-24 25-29 30-34 35-39 40-44 45-49 50-54 55-59 60-64 65+
Age
Empl
oym
ent
Feb-08
Aug-08
Feb-09

Income did not rise for other work categories
Real Income/Real Wage
Category of work Feb-08 Aug-08 Feb-09
own business 706,257 825,304 *** 722,141 business owners with non permanent or unpaid workers
business owners with permanent or paid workers
employee 1,070,200 1,082,360 1,190,994 ***
casual work agriculture 362,462 385,016 357,935
casual work non agriculture 588,261 607,836 562,252
unpaid work

Reasons for ending employment Reason for ending work/changing job Aug-08 Feb-09 Fired/Made redundant 0.050 0.060 ***No demand or firm went bankrupt 0.141 0.177 ***Income too low 0.205 0.195 *Unsuitable work environment 0.093 0.094 Contract finished 0.157 0.165 Other 0.353 0.310 ***
Redundant or No demandSector of the individual Aug-08 Feb-09 Agriculture, Plant, Hunt 0.230 0.274 ***Mining and Quarrying 0.116 0.232 ***Industry 0.247 0.307 ***Electricity, Gas and Water 0.131 0.145 Construction 0.258 0.342 ***Trade Restaurant and Acc 0.168 0.161 Transport, Storage and Comm 0.139 0.185 **Financial Inst, Real Estate 0.098 0.119 Social Services, Social & Pers 0.082 0.118 ***

Multivariate analysis: school enrolmentSchool Dropout rates are higher for: •older males•large households with high dependency ratios •rural areas•households headed by casual workers •household headed by agriculture workers •children in households where the head and spouse achieve lower education qualifications
•Large differences in dropout rates between provinces. •Virtually no change in dropout rates before or during the crisis

Labour participation and unemploymentLabour participation •Labour participation increases with age and education•Women and large urban households less likely to participate•Small reductions in labour participation over time after controlling individual and household characteristicsUnemployment •Unemployment increases with household size and education•Older workers and households with higher dependency ratio less likely to be unemployed•Unemployment may have increased for young workers and reduced for older workers

Qualitative vs. Quantitative resultsQualitative (Feb 2009) Quantitative (Feb08-Aug08-Feb09)
School Attendance No change, but some arrears in payment
No change or continued improvement for 13/14 year olds.
possible seasonal withdrawal in August for girls and 17 year olds.
Female labour participation No change No change
Child labour No change Significant falls in the participation of 12-17 year olds in the labour force
Unemployment Increase for young migrant industrial workers; and workers associated with the rubber industry
Rising for 15-25 year olds; falling for 25-55 year olds
Hours of work Reduced for contract workers Virtually no significant changes by age or sector
Informality Some suggestions of increased informalityEvidence for increased own business and casual non-agricultural work in 2008, but little overall change
Wages and Income Large falls in take home pay for contract workers; reductions in income for local businesses
Significant and large increases in real wages for employees; but little change in incomes in the informal sector

Summary and conclusions• Indonesia weathered the financial crisis comparatively well• In spite of dramatic exports declines little evidence of
subgroups being particularly affected• Parents kept children in school as labour market for
younger worker deteriorated• Unemployment rose for workers between 18 and 25 but
fell for workers above this age • Surprising increase in real wages of employees• A lesser dependence on international trade and good
macroeconomic management are possible reasons why Indonesia fared better during the 2008-2009 financial crisis

Thank you


![[ESRC][K55]TankGame Project](https://img.pdfslide.us/doc/110x75/577cd6c01a28ab9e789d27bf/esrck55tankgame-project.jpg)


![ESRC Report [English]](https://img.pdfslide.us/doc/110x75/577d1fa91a28ab4e1e910c34/esrc-report-english.jpg)