Embed Size (px)
Citation preview
NEGOTIATION IN TECHNOLOGY LANDSCAPES: AN ACTOR-ISSUE ANALYSIS
Samuel Bendahan HEC School of Business University of Lausanne
CH-1015 Lausanne Phone: +41 21 692.3422
E-mail: [email protected]
Giovanni Camponovo HEC School of Business University of Lausanne
CH-1015 Lausanne Phone: +41 21 692.3420
E-mail: [email protected]
Jean-Sébastien Monzani HEC School of Business University of Lausanne
CH-1015 Lausanne Phone: +41 21 692.3423
E-mail: [email protected]
Yves Pigneur HEC School of Business University of Lausanne
CH-1015 Lausanne Phone: +41 21 692.3416
E-mail: [email protected]
18th November 2004
Actor-issue analysis
Page 2 of 33
NEGOTIATION IN TECHNOLOGY LANDSCAPES: AN ACTOR-ISSUE ANALYSIS
Acknowledgments
An earlier version of this paper was originally published in the Proceedings of the Thirty-Seventh Hawaii International Conference on System Sciences (IEEE Computer Society Press, 2004). The work presented in this paper was supported by the National Competence Center in Research on Mobile Information and Communication Systems (NCCR-MICS), a center supported by the Swiss National Science Foundation under grant number 5005-67322.
About the authors
Samuel Bendahan is a doctoral candidate in management at the HEC School of Business, the University of Lausanne. His research interests include organizational behavior, negotiation, and actor-issue analysis.
Giovanni Camponovo is a doctoral candidate in information systems at the HEC School of Business, the University of Lausanne. His research interests include assessment of technology environments and mobile business.
Jean-Sébastien Monzani received his doctoral degree in Computer Science from the Swiss Federal Institute of Technology Lausanne. His research interests include visualization, computer graphics and interaction.
Yves Pigneur is a professor of Information Systems at the HEC School of Business of the University of Lausanne. In 1994, he was a visiting professor in the IS department of Georgia State University (Atlanta) and the Hong Kong University of Science and Technology. In 2004, he is a visiting professor in the IS division of the University of British Columbia, in Vancouver. His research interests cover information system design, requirement engineering, management of information technology and e-business.
Actor-issue analysis
Page 3 of 33
NEGOTIATION IN TECHNOLOGY LANDSCAPES: AN ACTOR-ISSUE ANALYSIS
ABSTRACT: In large-scale negotiation problems and in assessments of complex and uncertain environments, it is vital to analyze the different stakeholders involved and to evaluate their positions in the negotiations. This article extends a model, which merges previous multi-issue and actor-focused methods, based on power relationships between stakeholders and their ability to bargain in order to increase their utility. The model has already used for assessing a public WLAN landscape. The article emphasizes the dynamic application of the model we developed for experimenting the negotiation evolution, shifting positions on some issues, and exchanging positions between actors. We also claim that such forecasting analyses of negotiation landscapes can be significantly improved using more appropriate visualization support. We propose new visualization tools for analyzing negotiation outcomes, representing negotiation landscapes, and applying what-if simulations, using passive influence, expected outcome and dissatisfaction, power distribution, proximity, and negotiation maps.
KEY WORDS AND PHRASES: negotiation, collective decision making, forecasting, scenario planning, actor-issue analysis, visualization
Actor-issue analysis
Page 4 of 33
NEGOTIATION IN TECHNOLOGY LANDSCAPES: AN ACTOR-ISSUE ANALYSIS
1 INTRODUCTION
It is widely recognized that the most critical decisions made by any organization typically involve numerous other parties, both internal and external to the organization. Strategic decisions relating to activities such as interacting in a highly competitive market with selected key players, choosing alliance partners, or positioning the organization along a value chain, just to name a few, all involve and impact other parties in various ways. Business leaders must constantly negotiate with other parties to achieve productive arrangements with potential partners, competitors, investors, board members, customers, suppliers, regulatory authorities, employees and labor unions. Problem solving in the information technology context follows the same pattern: information system architects currently must consider enlisting networks of partners to design and deploy information systems or e-business solutions.
Managers are therefore compelled to understand, anticipate and analyze decision-making in the context of other decision makers who may have diverging interests and priorities. Multi-party negotiation, for example, can be seen as one important form of interactive decision-making with other parties, where parties try to reach mutually satisfactory agreements with the others. As explained by Raiffa, [38] negotiation analysis has been broadly investigated in the context of decision making, behavioral decision-making, game theory and negotiation theory.
Negotiators are encountering a growing need to employ a variety of tools and negotiation support systems to support them through the negotiation process. Negotiation Support Systems (NSSs) have been analyzed extensively in IS literature [29] [43], and recently re-actualized in the e-business context [20] [26, 27] [52] [35]. Most of the current NSS models, however, address bilateral, multi-issue and session-based negotiation situations; few of them consider forecasting and predictive perspectives involved in planning, managing and dealing with multi-party negotiation.
In multi-party negotiation situations, negotiators try to achieve a thorough and comprehensive understanding of the goals and means of the other parties, and they aspire to adopt imaginative approaches toward proposing exchanges that leave all of the concerned parties better off. Inasmuch as it is difficult, and sometimes unrealistic, to gather adequate knowledge for achieving these goals, as business, technology, and society are being characterized by increasing complexity, uncertainty and disruptiveness, particularly in technological landscapes, a scenario planning approach [50] can be useful.
Only a few authors have proposed tools that take into account the involvement of multiple actors on multiple issues, and that enable users to predict the outcome of their negotiations (see e.g. [11] [44] [6] [3]).
Responding to the limitations of previous studies, the present research relies on the three following assumptions:
1. the preparation of multi-actor multi-issue negotiations, for example in technology landscapes, can be improved by a scenario-based approach;
2. a computer-aided decision system should help negotiators to design and to simulate different scenarios;
3. a visual tool should improve the interpretation and analysis of such scenarios.
Actor-issue analysis
Page 5 of 33
This paper proposes a highly visual negotiation-supporting system, to support decision-makers in forecasting the evolution of a negotiation, and through the process of designing scenarios and simulations for possible results of the negotiation. The system aims at facilitating the choice of a negotiation strategy when multiple actors are confronted with each other on multiple issues, the outcome of which they attempt to influence for their own advantage, through negotiation. Such situations occur in multiparty negotiations where the various stakeholders maintain different goals related to several objects under discussion. These situations have traditionally occurred in political negotiations, but they are also becoming commonplace in the business world as well as in technological landscapes, problem solving and design. Possible users of the system include individual actors involved in the negotiation process, or diverse parties and regulators who may be interested in the evolution of the considered landscape.
In a design science context, as discussed by March and Smith [31], research outputs include the following findings: the elements composing the ontology proposed in Section 2 below (the constructs in [31]); the ontology itself, which demonstrates the relationships between the chosen constructs (the model); input collection guidelines and computing rules used to derive the negotiation forecasts and exchange proposals (the method); and the system prototype itself, including the interactive visualization interface (the instantiation). These artifacts are intended to facilitate the formulation of a response to control the complexity and the uncertainty of multi-party negotiations in technology-intensive environments. This artifact can be used not only for assessing the actors, the issues, and their mutual influences on each other, but also for forecasting and elaborating scenarios, and in so doing, nurturing decision-makers.
As suggested by the design science approach, we have complemented the design activity of each of the artifacts listed above with an evaluation based on their application to concrete cases [34]. Throughout the present paper, we will illustrate the application of the theoretical concepts exposed in the different sections to a common case study of the situation of the Wireless LAN Internet Service Provider industry in Switzerland [14].
The system described in this paper is based on a set of constructs, described in the next section, which concern actors and the issues and relationships between them. The input for analyzing the negotiation landscape has been collected using a variation on a Delphi approach with a group of experts, as illustrated in a WLAN case study, in Section 3. Based on this input, a computational model has been proposed [8] and is extended in Section 4, for analyzing influences, issue evolution, power distribution and alliances. Section 5 details a state-of-the-art visualization technique, applied to strategic decision-making problems. Section 6 depicts original visual or graphical representations, which allow users to attain an intuitive view of situations within negotiation landscapes. Section 7 presents a method for using the suggested constructs and models for simulating the expected results of different actor positions, different negotiation strategies and different alliances among partners.
2 CONCEPTS FOR DEFINING A NEGOTIATION LANDSCAPE
The multi-issues and multi-actor negotiation support system presented in this paper builds on a set of previous models that have aimed at assessing situations in which multiple actors are confronted with multiple issues. These models have their roots in various disciplines and are suitable to solve different problems.
On the one hand, models designed for political forecasting [11] [44], collective decision-making [49] and negotiation support [3] [35] have been applied to multiparty political and business negotiations where multiple parties (actors) negotiate over several aspects (issues) of an agreement. An application of these models can help one party to prepare negotiation strategies that take into consideration the possible actions of other parties, as well as providing systematic support for identifying the best potential deals and alliances. On the other hand, similar models stemming from scenario planning [6] [19] are applied to
Actor-issue analysis
Page 6 of 33
assess the future prospects of business environments where various actors may influence the outcome of the key issues that will determine their future conditions. The models can be used either by an actor inside the environment in order to deduct viable strategies aimed at skewing environmental evolution towards its preferences, as well as by an external observer interested in forecasting her or his future conditions.
While arising from different disciplines, these models share the same basic idea, that a situation under examination can be formalized as an arena in which a set of actors contend against each other to determine the outcome of a set of key issues, which represent the various issues and perspectives that must be discussed. The actors that take part in this confrontation have distinct preferences about the outcome of these issues (position) as well as an opinion of their relative importance (salience). They can attempt to influence the outcome of a particular issue either directly, by using their power to influence the issue itself (clout), or indirectly, by using their influence on other actors in order to affect their behavior towards the issue (influence).
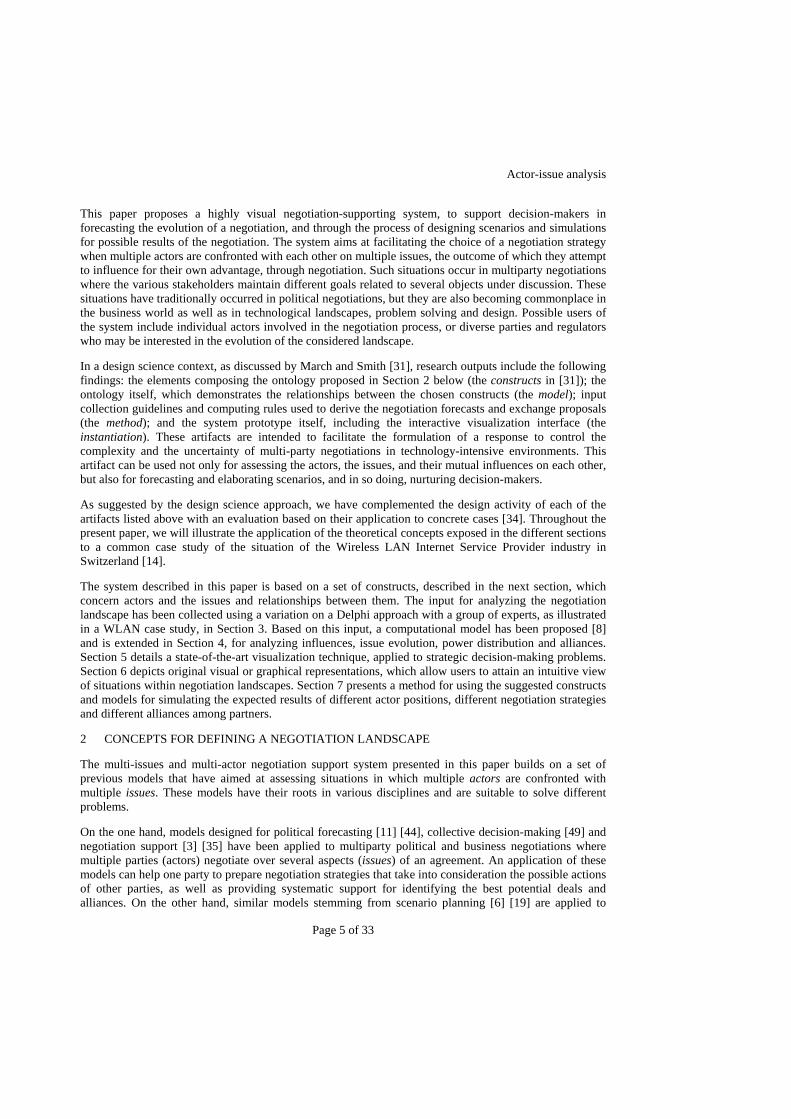
These models are based on the following set of concepts and relations: actors and issues are the entities characterizing the problem, whereas position, salience, clout and influence correspond to the relations between them as illustrated in Figure 1 below.
Actor IssuePosition, Salience, Clout
Influence
Actor IssuePosition, Salience, Clout
Influence
Figure 1: UML representation of the constructs (see Bendahan et al. [8])
2.1 Actor
For the purpose of our model, an actor can be defined as an entity that has an interest in the situation under examination and has the ability to play a role in its evolution. Two aspects are therefore essential for the selection of the relevant actors: 1) the actor must be interested and 2) it must be influential.
The first characteristic implies that actors must have a stake in the outcome of the negotiation process or in some of the issues involved. Previous works in stakeholder theory depict stakeholders as individuals, groups or organizations who can either affect or be affected by the achievement of the organization's objectives (in our case this would be the negotiation process) [18]. Specifically, the theory of stakeholder identification proposed by Mitchell et al. [33] can be invoked for identifying the most important stakeholders, as well as for estimating their salience, based on a combination of their power, legitimacy and urgency.
The second characteristic implies that actors have the ability to influence the outcome of the negotiation process. Inspired by the actors’ strategy analysis [6] [19], we consider an actor as influential if it has some means to influence either some of the issues or some of the other actors. In this respect, the actor network concept [40], used for analyzing policy making and technology policy, introduces interesting attributes, such as influence, reputation, cooperation, and information exchange. However, these theories consider absolute actor positions, and do not try to isolate or classify their positions for specific issues.
In our model, the first characteristic, implication, is taken into account by the fact that actors adopt a set of objectives and priorities related to the actualization of the different issues, formalized by a preference for
Actor-issue analysis
Page 7 of 33
the outcome of each issue (its position on each issue), as well as an estimation of their relative importance (its salience on each issue). The second characteristic, influence, is taken into account by evaluating the means that it can use to influence the outcome of the issues, distinguishing between the ability to control or influence the outcome of an issue directly (the clout over an issue) or indirectly, by influencing other actors (the influence over another actor).
In order to achieve their objectives, actors have the possibility to negotiate with each other by agreeing on mutually advantageous exchanges of positions on the different issues they encounter. If satisfactory agreements cannot be reached, the actors can mobilize their resources to fight each other to impose their will. In general, actors are expected to act rationally and to choose the strategy that maximizes their benefit.
In the case of multiparty negotiations, the parties that take part in the negotiations are obviously relevant actors. Nevertheless, actors who do not directly participate in the negotiation, but who may have the willingness and capacity to influence the outcome and future developments of some of the issues being negotiated, should also be considered. This may include actors in the task environment of the organization, such as competitors, suppliers, distributors, new entrants and substitute producers [36] [16], as well as other influential players in the general environment areas, such as political bodies, regulatory authorities, technology suppliers and various pressure groups [10] [4].
2.2 Issues
Issues can be generally defined as open and debatable questions, events, problems or other forthcoming developments that are open to discussion or dispute and whose realization can significantly influence the ability of an organization to achieve its objectives [5]. In a negotiation setting, issues can be pragmatically conceived as the various aspects related to the problem being discussed.
In particular, we are currently interested in those issues which are disputed by the different actors under examination, including issues toward which they actors take sensibly diverging positions, the issues that are salient in their outcome, and those that the actors can influence to some degree. Issues can be seen as battlefields where the actors collaborate with or fight against each other with the aim of skewing the outcomes towards their preferred positions [19].
The structural analysis method [6] [19] proposes a systematic and formal method for identifying, classifying and prioritizing issues based on the concepts of influence and dependence between issues. It classifies them as dominant, relay, dominated and autonomous issues. In this model, issues are seen as the key structural variables which may significantly affect the future developments of a situation under study. In a constantly evolving negotiation environment, issues are effective mechanisms for reflecting possible disruptions of current conditions, enabling negotiators to prepare for broader sets of negotiation scenarios.
2.3 Position, salience, clout and influence
The position of an actor in relation to an issue represents the actor's preferred outcome for the issue, i.e. the outcome which, if realized, best suits its objectives. It also indicates the direction towards which an actor may exert his or her influence as he or she attempts to skew the outcome as close as possible to his or her own preferred position.
The salience an issue bears for an actor represents the relative importance of the realization of a favorable outcome of the issue to the achievement of the actor's overall objectives, and thus the determination and effort with which he or she is willing to exert influence to affect the outcome. It exhibits the priorities of
Actor-issue analysis
Page 8 of 33
individual actors and the loss of utility that the actors would endure if the outcome of the issue was different from their ideal position.
The clout of an actor in regards to an issue represents the power that the actor possesses to directly influence the outcome of the issue, as compared with other players (i.e. the actual amount of control over the outcome). It is assumed that actors, in combination, have altogether the power to determine an issue's outcome along the continuum on which the positions are set. Otherwise it is possible to use a fictive actor enacting environmental trends.
The influence of an actor over another actor represents the power that the former has to influence the behavior of the latter. An actor may have an influence on another actor because it controls critical resources which are necessary for achieving the other actor's goals [35] or it may possess some means to influence the second actor's organizational behavior or decision makers.
3 METHOD FOR ELICITING INPUT: APPLICATION TO THE WISP INDUSTRY
To analyze a negotiation landscape applying the concepts defined above, the model for the present study requires that the lists of actors and issues is determined along with evaluations of the position, salience and clout of each actor on each issue, as well as the influence of each actor on each other actor.
The position of actor "a" on issue "i" (Positiona,i) is first set along a continuum between two extreme values representing the extreme opinions on the issue and then normalized between 0 and 1. It is supposed that this continuum represents the true scope of influence that the actors have on the issue.
The salience of actor "a" on issue "i" (Saliencea,i) is set along a linear continuum between 0 and 1: a salience of 0 means that the actor has absolutely no interest in the issue, while the value of 1 represents the strongest salience of the entire model. All saliencies are assumed to be comparable with each other.
The clout of actor "a" in relation to issue "i" (Clouta,i) is evaluated as the proportionate control an actor can exert over an issue. Because the total clout for an issue is set to 1, this equates as a percentage of control.
The influence of actor "a" on actor "b" (Influencea,b) is similarly evaluated as the first actor’s proportionate control over the second actor. Actors are assumed to be 100% controlled. Part of this control is actually exerted by actors over themselves, in the process of auto-determination, while the remainder is divided among other actors.
In order to measure these inputs, we suggest that the negotiator team can use a kind of Delphi method, as introduced by Linstone and Turoff [30], a technique for discerning common opinions regarding uncertain issues based on iterative submissions of questionnaires to groups of experts. A group monitor prepares and sends surveys to the experts, who independently give their opinions about the various items. The monitor summarizes the results and sends them back to the experts, who then have the opportunity to reconsider their previous answers based on this data. A few rounds may be needed to reach a group consensus. Scaling methods, structural modeling, and other multi-criteria methods [21, 22] [39] can improve the judgment, estimation, and summarization of the voting process inside the group.
In our case, a group of experts is ideally needed for identifying the relevant actors and issues of the negotiation, as well as for estimating the other parameters of the model (position, salience, clout and influence). Preferably, experts should be knowledgeable regarding the opinions of the different actors.
Actor-issue analysis
Page 9 of 33
3.1 The WISP industry case
In order to give the reader a more concrete understanding of the concepts previously mentioned, we will illustrate them through a case study based on the Wireless Internet Service Provider (WISP) industry from the viewpoint of current Swiss market conditions [8]. WISPs offer Internet access using Wireless LAN (WLAN) technologies [25] [28].
Because of the many unresolved issues and the interplay of many actors, a multi-issues actor analysis is appropriate to assess WISP services. Indeed, similar methods have already been applied to the mobile business industry as a base for designing future scenarios, and to inform the design of an illustrative case study by Aarnio et al. [1].
The inputs for the present case study were collected using a variation of a Delphi procedure. First, some experts from the Internet provider industry were interviewed [14], to identify the most relevant actors and issues. A questionnaire was then developed on the basis of these interviews and sent to a selection of academic experts who are well-informed about the field under study, to determine the other parameters. The results were synthesized and then discussed in a plenary session where experts could reconsider their positions until a consensus emerged among them. This procedure was followed to illustrate the application of the model to a concrete situation, thereby providing preliminary evidence of its applicability and to facilitate understanding. For that reason, the case focuses on a small number of issues and actors in order to keep the example simple.
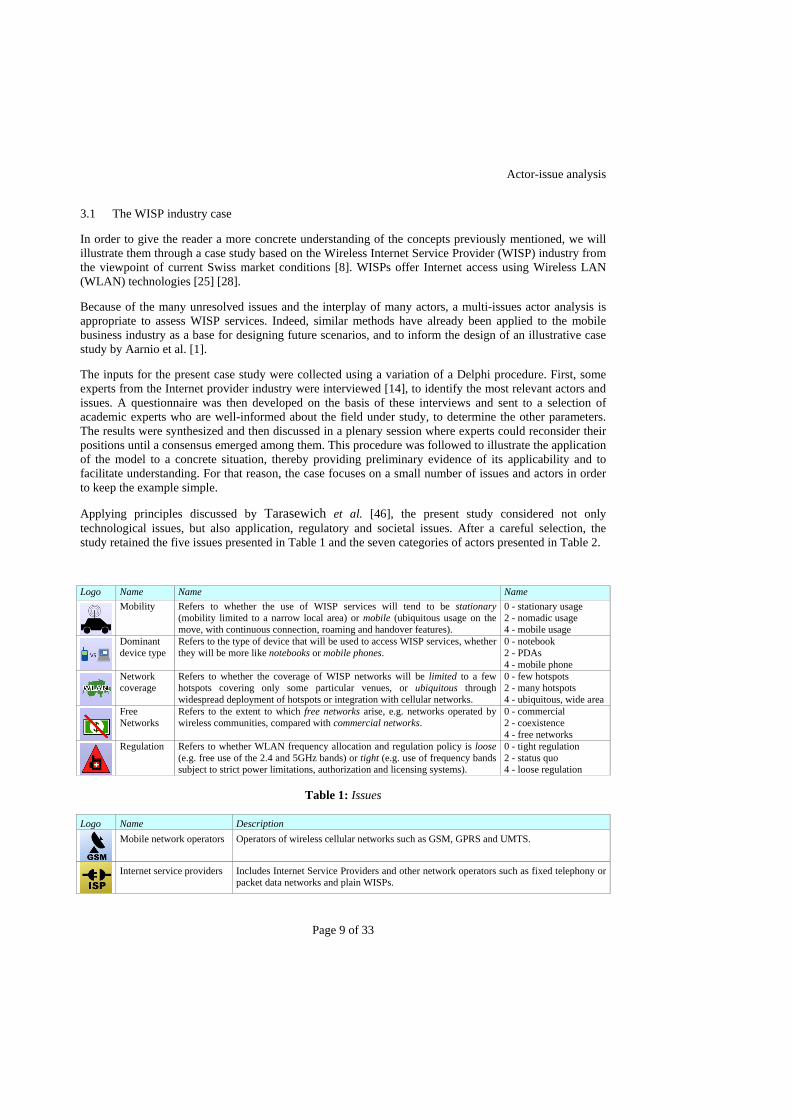
Applying principles discussed by Tarasewich et al. [46], the present study considered not only technological issues, but also application, regulatory and societal issues. After a careful selection, the study retained the five issues presented in Table 1 and the seven categories of actors presented in Table 2.
Logo Name Name Name
Mobility Refers to whether the use of WISP services will tend to be stationary (mobility limited to a narrow local area) or mobile (ubiquitous usage on the move, with continuous connection, roaming and handover features).
0 - stationary usage 2 - nomadic usage 4 - mobile usage
Dominant device type
Refers to the type of device that will be used to access WISP services, whether they will be more like notebooks or mobile phones.
0 - notebook 2 - PDAs 4 - mobile phone
Network coverage
Refers to whether the coverage of WISP networks will be limited to a few hotspots covering only some particular venues, or ubiquitous through widespread deployment of hotspots or integration with cellular networks.
0 - few hotspots 2 - many hotspots 4 - ubiquitous, wide area
Free Networks
Refers to the extent to which free networks arise, e.g. networks operated by wireless communities, compared with commercial networks.
0 - commercial 2 - coexistence 4 - free networks
Regulation Refers to whether WLAN frequency allocation and regulation policy is loose (e.g. free use of the 2.4 and 5GHz bands) or tight (e.g. use of frequency bands subject to strict power limitations, authorization and licensing systems).
0 - tight regulation 2 - status quo 4 - loose regulation
Table 1: Issues
Logo Name Description
Mobile network operators Operators of wireless cellular networks such as GSM, GPRS and UMTS.
Internet service providers Includes Internet Service Providers and other network operators such as fixed telephony or packet data networks and plain WISPs.
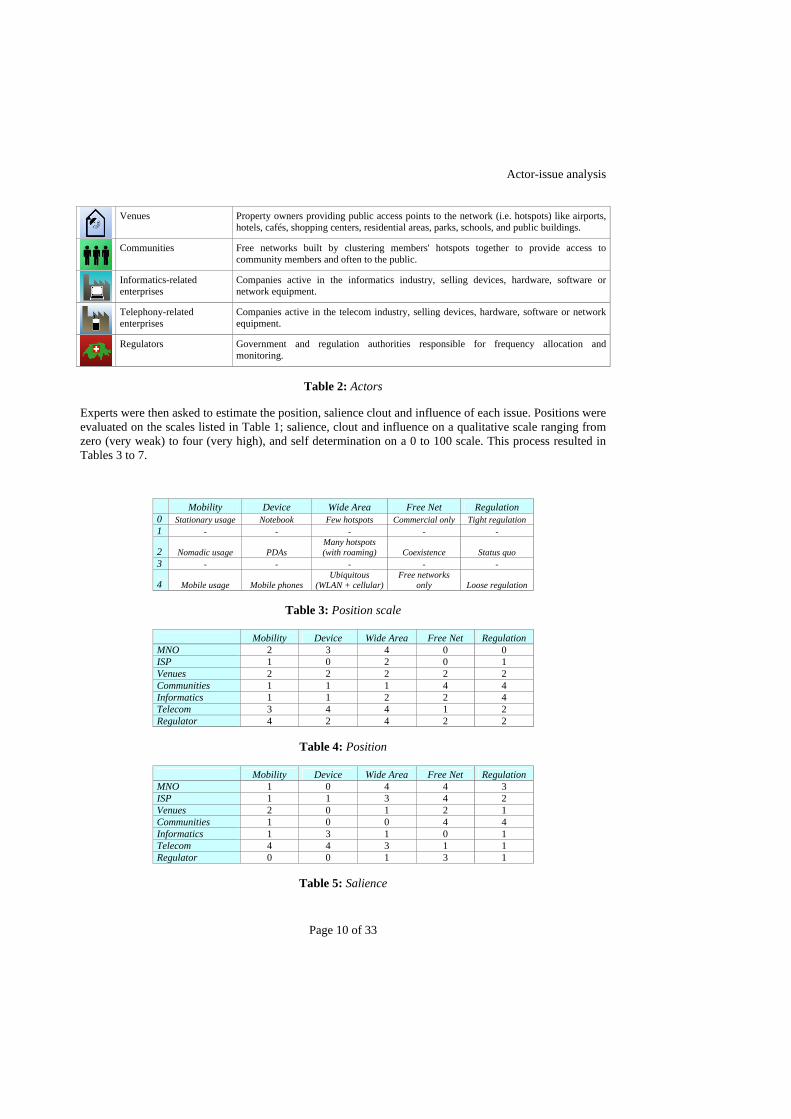
Actor-issue analysis
Page 10 of 33
Venues Property owners providing public access points to the network (i.e. hotspots) like airports, hotels, cafés, shopping centers, residential areas, parks, schools, and public buildings.
Communities Free networks built by clustering members' hotspots together to provide access to community members and often to the public.
Informatics-related enterprises
Companies active in the informatics industry, selling devices, hardware, software or network equipment.
Telephony-related enterprises
Companies active in the telecom industry, selling devices, hardware, software or network equipment.
Regulators Government and regulation authorities responsible for frequency allocation and monitoring.
Table 2: Actors
Experts were then asked to estimate the position, salience clout and influence of each issue. Positions were evaluated on the scales listed in Table 1; salience, clout and influence on a qualitative scale ranging from zero (very weak) to four (very high), and self determination on a 0 to 100 scale. This process resulted in Tables 3 to 7.
Mobility Device Wide Area Free Net Regulation 0 Stationary usage Notebook Few hotspots Commercial only Tight regulation 1 - - - - -
2 Nomadic usage PDAs Many hotspots (with roaming) Coexistence Status quo
3 - - - - -
4 Mobile usage Mobile phones Ubiquitous
(WLAN + cellular) Free networks
only Loose regulation
Table 3: Position scale
Mobility Device Wide Area Free Net Regulation MNO 2 3 4 0 0 ISP 1 0 2 0 1 Venues 2 2 2 2 2 Communities 1 1 1 4 4 Informatics 1 1 2 2 4 Telecom 3 4 4 1 2 Regulator 4 2 4 2 2
Table 4: Position
Mobility Device Wide Area Free Net Regulation MNO 1 0 4 4 3 ISP 1 1 3 4 2 Venues 2 0 1 2 1 Communities 1 0 0 4 4 Informatics 1 3 1 0 1 Telecom 4 4 3 1 1 Regulator 0 0 1 3 1
Table 5: Salience
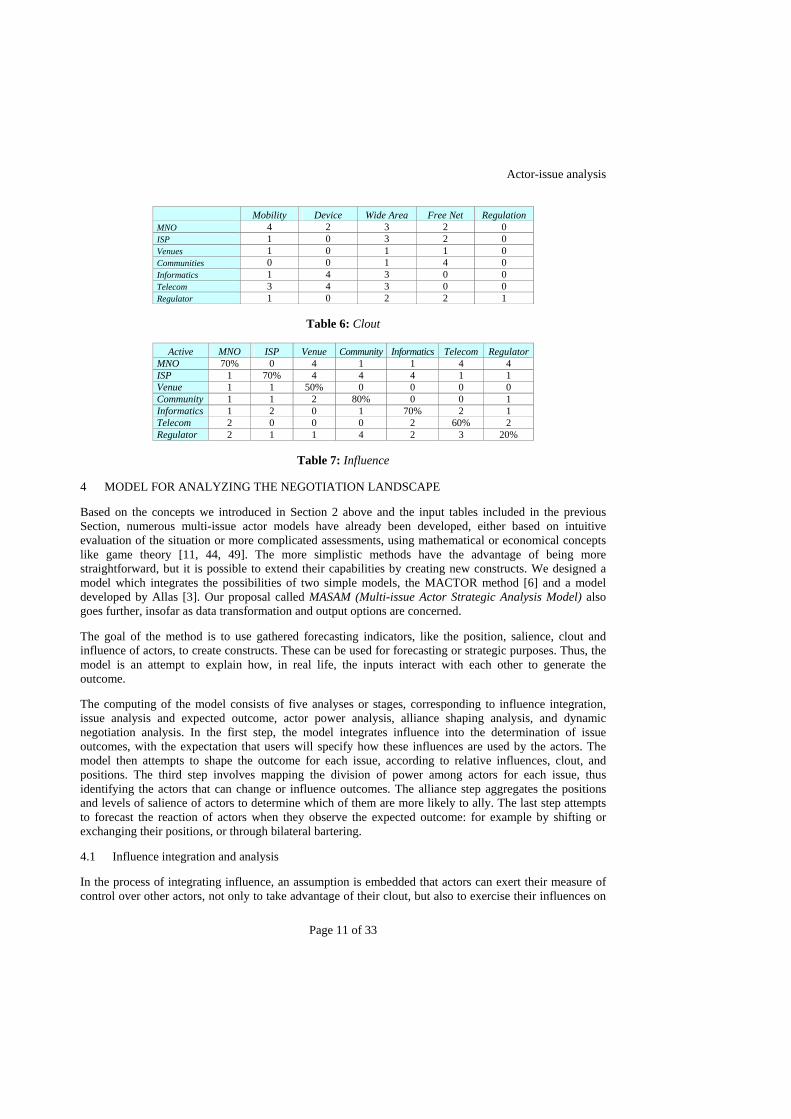
Actor-issue analysis
Page 11 of 33
Mobility Device Wide Area Free Net Regulation MNO 4 2 3 2 0 ISP 1 0 3 2 0 Venues 1 0 1 1 0 Communities 0 0 1 4 0 Informatics 1 4 3 0 0 Telecom 3 4 3 0 0 Regulator 1 0 2 2 1
Table 6: Clout
Active MNO ISP Venue Community Informatics Telecom Regulator MNO 70% 0 4 1 1 4 4 ISP 1 70% 4 4 4 1 1 Venue 1 1 50% 0 0 0 0 Community 1 1 2 80% 0 0 1 Informatics 1 2 0 1 70% 2 1 Telecom 2 0 0 0 2 60% 2 Regulator 2 1 1 4 2 3 20%
Table 7: Influence
4 MODEL FOR ANALYZING THE NEGOTIATION LANDSCAPE
Based on the concepts we introduced in Section 2 above and the input tables included in the previous Section, numerous multi-issue actor models have already been developed, either based on intuitive evaluation of the situation or more complicated assessments, using mathematical or economical concepts like game theory [11, 44, 49]. The more simplistic methods have the advantage of being more straightforward, but it is possible to extend their capabilities by creating new constructs. We designed a model which integrates the possibilities of two simple models, the MACTOR method [6] and a model developed by Allas [3]. Our proposal called MASAM (Multi-issue Actor Strategic Analysis Model) also goes further, insofar as data transformation and output options are concerned.
The goal of the method is to use gathered forecasting indicators, like the position, salience, clout and influence of actors, to create constructs. These can be used for forecasting or strategic purposes. Thus, the model is an attempt to explain how, in real life, the inputs interact with each other to generate the outcome.
The computing of the model consists of five analyses or stages, corresponding to influence integration, issue analysis and expected outcome, actor power analysis, alliance shaping analysis, and dynamic negotiation analysis. In the first step, the model integrates influence into the determination of issue outcomes, with the expectation that users will specify how these influences are used by the actors. The model then attempts to shape the outcome for each issue, according to relative influences, clout, and positions. The third step involves mapping the division of power among actors for each issue, thus identifying the actors that can change or influence outcomes. The alliance step aggregates the positions and levels of salience of actors to determine which of them are more likely to ally. The last step attempts to forecast the reaction of actors when they observe the expected outcome: for example by shifting or exchanging their positions, or through bilateral bartering.
4.1 Influence integration and analysis
In the process of integrating influence, an assumption is embedded that actors can exert their measure of control over other actors, not only to take advantage of their clout, but also to exercise their influences on
Actor-issue analysis
Page 12 of 33
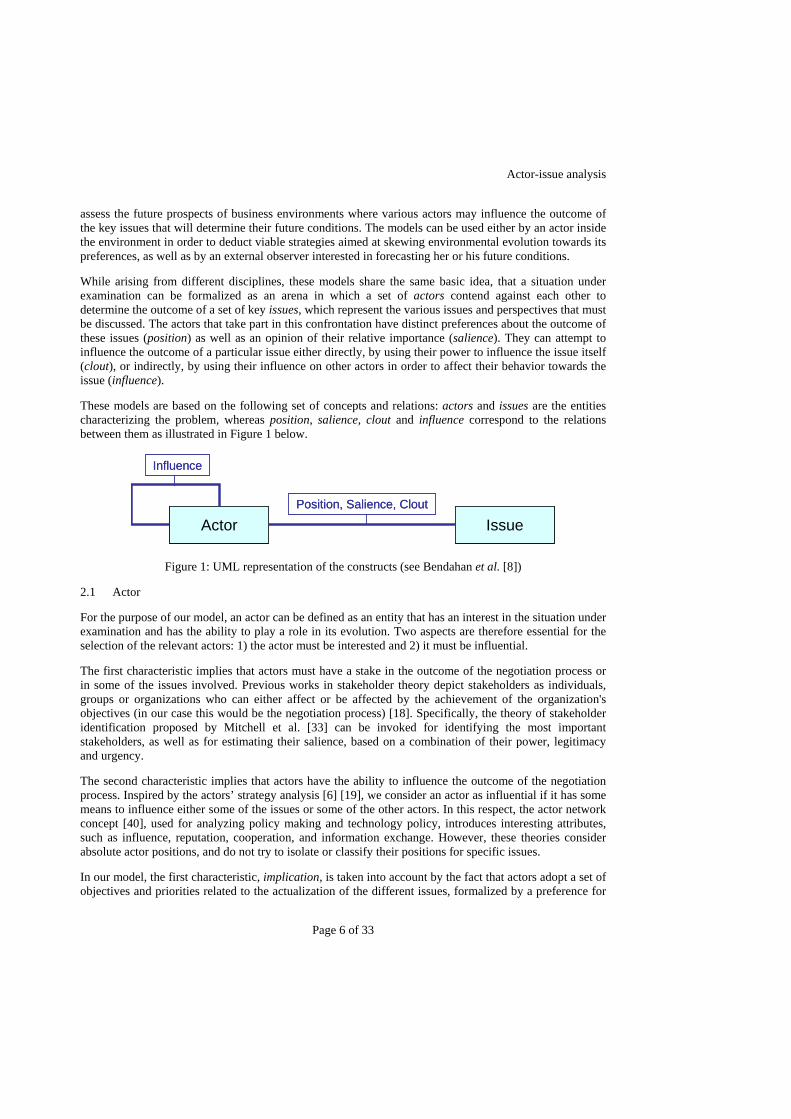
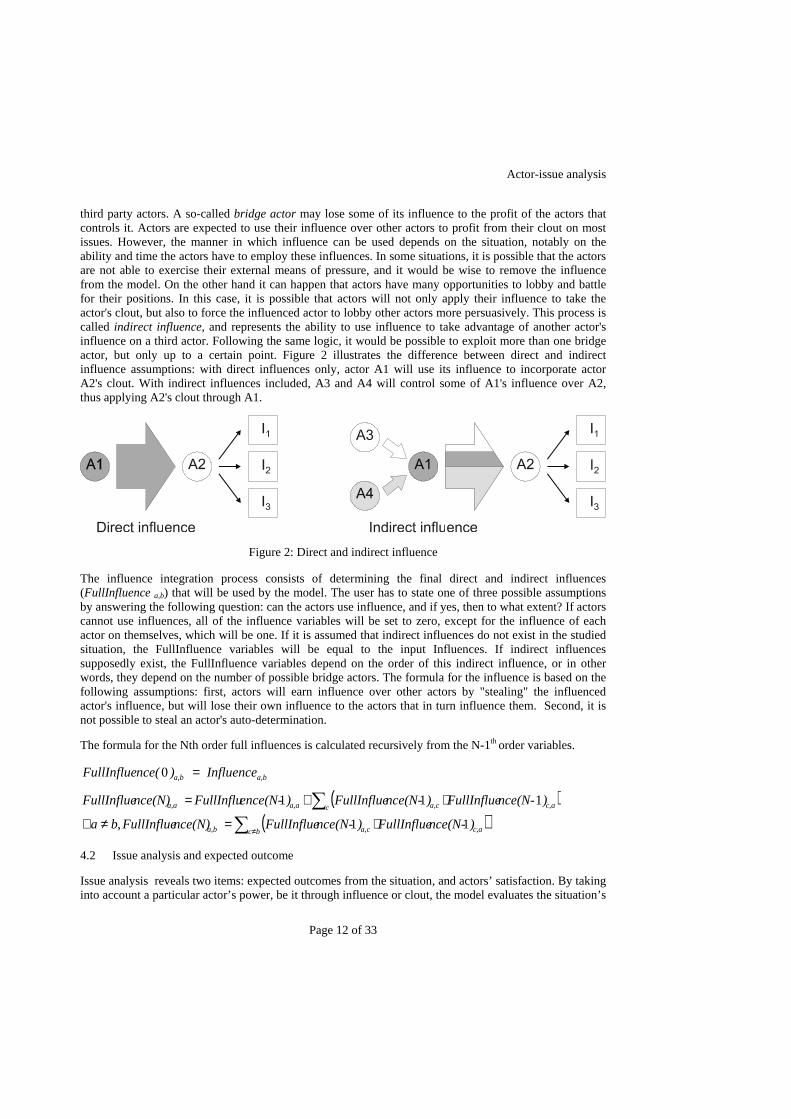
third party actors. A so-called bridge actor may lose some of its influence to the profit of the actors that controls it. Actors are expected to use their influence over other actors to profit from their clout on most issues. However, the manner in which influence can be used depends on the situation, notably on the ability and time the actors have to employ these influences. In some situations, it is possible that the actors are not able to exercise their external means of pressure, and it would be wise to remove the influence from the model. On the other hand it can happen that actors have many opportunities to lobby and battle for their positions. In this case, it is possible that actors will not only apply their influence to take the actor's clout, but also to force the influenced actor to lobby other actors more persuasively. This process is called indirect influence, and represents the ability to use influence to take advantage of another actor's influence on a third actor. Following the same logic, it would be possible to exploit more than one bridge actor, but only up to a certain point. Figure 2 illustrates the difference between direct and indirect influence assumptions: with direct influences only, actor A1 will use its influence to incorporate actor A2's clout. With indirect influences included, A3 and A4 will control some of A1's influence over A2, thus applying A2's clout through A1.
Figure 2: Direct and indirect influence
The influence integration process consists of determining the final direct and indirect influences (FullInfluence a,b) that will be used by the model. The user has to state one of three possible assumptions by answering the following question: can the actors use influence, and if yes, then to what extent? If actors cannot use influences, all of the influence variables will be set to zero, except for the influence of each actor on themselves, which will be one. If it is assumed that indirect influences do not exist in the studied situation, the FullInfluence variables will be equal to the input Influences. If indirect influences supposedly exist, the FullInfluence variables depend on the order of this indirect influence, or in other words, they depend on the number of possible bridge actors. The formula for the influence is based on the following assumptions: first, actors will earn influence over other actors by "stealing" the influenced actor's influence, but will lose their own influence to the actors that in turn influence them. Second, it is not possible to steal an actor's auto-determination.
The formula for the Nth order full influences is calculated recursively from the N-1th order variables.
a,ba,b Influence )nce(FullInflue =0
( )( )∑
∑
≠⋅=≠∀
⋅+=
bc c,aa,ca,b
c c,aa,ca,aa,a
)nce(N-FullInflue)nce(N-FullInflue nce(N)FullInflueba
)nce(N- FullInflue)nce(N-FullInflue)ence(N- FullInflu nce(N)FullInflue
11,
111
4.2 Issue analysis and expected outcome
Issue analysis reveals two items: expected outcomes from the situation, and actors’ satisfaction. By taking into account a particular actor’s power, be it through influence or clout, the model evaluates the situation’s
Actor-issue analysis
Page 13 of 33
outcome for each issue, with the assumption that all stakeholders will use their means to ensure that the issues end as close as possible to their desired positions. This result is the base on which negotiators can begin: it is the probable outcome if no actors bargain or negotiate, but instead only use their power to accomplish their wishes. The primary assumption behind the model's outcome determination is the way the actors can influence the issue. They have, together, the power to move the issue's outcome between 0 and 1, and they will at first attempt to bring it as close as possible to their own position. The model considers that the actors actually "vote" on the issue, and their votes are counted in proportion to their clout on the issue. The outcome (Outcome i) will be the average of the positions weighted by each actor's clout on issues, including the influence variable:
( )( )∑ ∑ ⋅⋅=a b b,ia,ba,ii CloutnceFullInflue Position Outcome
We will see later that although this estimation of the outcome is pertinent if the actors in a scenario have no idea of the future situation, they might shift their position in the vote to draw its outcome more to their own advantage. Consequently, the second stage of issue analysis addresses the potential stability of the outcome it predicts. Indeed, many of the actors may be dissatisfied with the outcome of a situation, particularly if the most salient actors are not the ones that hold the power. A dissatisfaction coefficient is calculated for each actor, depending on their position and their salience. They will be dissatisfied proportionally to the differences between their opinions and the outcome, and to their salience for this issue. Actors that are dissatisfied in the same way, in that they are willing to change the issue’s result in the same direction, are likely to destabilize the situation and to bargain in order to obtain satisfaction. The model computes a divergence coefficient (Divergence a,b) for each actor and issue, which represents how dissatisfied the actor is with the outcome, and in which direction the actor will try to change it. The dissatisfaction is assumed to be linearly dependent to the difference between the outcome and the actor's position, but if this assumption seems unrealistic in a particular case, the following formula can be adapted:
( ) a,iia,ia,i Salience - OutcomePosition Divergence ⋅=
For each issue, an aggregated dissatisfaction coefficient (Divergencei) illustrates how controversial the result is. A first step for negotiators would be to identify actors who may be dissatisfied regarding issues in relation to which they have no control: their needs and wishes can be evaluated and used to gain utilities on other salient issues. As well, actors that are satisfied with the results of controversial issues should do their best to cement the less likely outcome.
∑=a a,ii Divergence Divergence
Another method to determine an issue's weight on the debate involves computing an importance coefficient (Importancei), which represents the average salience of the actors on each issue. Indeed, the issues that have the most importance are the ones the actors believe to be essential and the ones for which they will be willing to expend the greatest efforts to achieve.
)(Average ,iaai SalienceImportance =
4.3 Actor power distribution and analysis
Actor analysis focuses on the true power repartition of actors. Initially, a few aggregated values can identify the actors that have the most clout on important issues (the ones on which actors are the most salient). As well, the model can take influences (direct and indirect) into account, and provide an
Actor-issue analysis
Page 14 of 33
assessment of their true clout, which is the real amount of control they exert over specific issues, including all the parameters that were entered. This new power repartition helps negotiators to spot the most powerful stakeholders. Powerful but non-salient actors, for example, are going to be important allies, inasmuch as they can modify or strengthen their positions at a low cost for themselves, in exchange for support on other issues.
The power coefficient (Power a,b) represents the clout of each actor on each issue, by considering the various influences between actors. The following formula demonstrates how to calculate the power coefficient:
( )∑ ⋅=b ib,ba,ia, CloutnceFullInfluePower
The power coefficient represents the addition of the direct clout of the actor, combined with all the actors it controls through indirect influences.
A global coefficient which represents the overall power is also assigned to all actors, and suggests the actor’s importance and implication in the studied situation. This power coefficient (Power a) is determined by combining the powers of this actor on all issues, weighted by the importance of these issues. Indeed, the relative power of actors will not only depend on the amount of clout but also of the issues.
4.4 Alliance shaping and actor proximity analysis
Alliance analysis attempts to match actors and to determine the most straightforward alliances or coalitions between them. The model supposes that actors that share similar points of view on issues they are salient on are more likely to be interested in an alliance. On the other hand, if actors are divergent on salient issues, they also tend to be divergent globally, fighting each other and belonging to different coalitions.
An alliance coefficient (Alliance a,b) determines the relationships between each pair of actors (a and b). This coefficient is based on two assumptions. First, for each issue, the nearer two actor's positions are in relation to each other, the more likely that they will be allies. The second assumption is that this chance to ally is also dependent on the saliencies of the actors on the issues: it is supposed that agreements or disagreements regarding salient issues are more likely to shape the relationships between actors. Other models, like Allas's proposition [3], identify the relationships between actors as either neutral, allied or enemy. Although our construct is not a discrete variable, a neutral value for an alliance coefficient has to be set: the value with which the user considers that the actors are neutral toward each other. If an alliance coefficient is below that value, the actors are allies, if it is above, they are enemies. The magnitude of the coefficient represents the strength of the animosity or agreement. The setting of a neutral value of positions implies a user-defined value that represents the maximum difference in relative position on an issue, which does not mean that the actors are enemies. This standard neutral value (NeutralValue) should be determined depending on the situation.
( )( )∑ ⋅⋅−=i ib,ia,ib,ia,ba, - SalienceSalienceueNeutralValPositionPositionAlliance
We are willing to display these distances graphically in a map (see Section 6.5), hence we need to create a construct that has no negative values. The alliance coefficient can be transformed into a distance coefficient (Distance a,b). This variable takes the value of 0 in case of a perfect alliance between actors,
( )∑ ⋅=i
ImportancePowerPower iia,a
Actor-issue analysis
Page 15 of 33
with higher values for the actors who are furthest apart. Under this assumption, the distance coefficient can be standardized with the following formula (where "Issues" is the number of issues):
( ) Max
ba,ba,
ba,ba, ueNeutralValIssuesAlliance
ueNeutralValIssuesAllianceDistance
⋅+⋅+
=
If actors exhibit low salience on particular issues, it is likely that most of the values of this distance will be near the value of 1 and rather close to each other, which may render the graphical display very uneasy and rather useless. The distance coefficient can be accentuated in order to reveal the differences of proximity more clearly, by standardizing the alliance in another way: assuming that the two closest actors of the model have a distance of 0, and the two farthest allies have a distance of 1. This assumption might, however, exaggerate the closeness of actors, but will support a clearer graphical representation of the most probable alliances.
( )( ) ( ) MinMax
Min
ba,ba,ba,ba,
ba,ba,ba,ba, AllianceAlliance
AllianceAllianceDistance
−−
=
4.5 Dynamic negotiation analysis
The last implementation of the model is the possibility to include bilateral negotiations and position shifting for strategic purposes. Position shifting can be included in the model if we make the assumption that actors, seeing that an expected outcome will not satisfy them, will modify their revealed position – the one they use to “vote,” so it becomes more extreme, thus bringing the weighted average more on their side. This represents the fact that in negotiations, actors are more likely to draw the outcome to their side, rather than defending a specific goal that is their own position. This position shift can be represented using the following algorithm:
For each actor and for each issue, if the actor's position is different from the expected outcome, the actor changes its revealed position.
That change consists in taking one step farther from her or his true position, compared to the expected outcome.
This algorithm runs until the system reaches an equilibrium: that is when the sum of all ∆positions between steps t-1 and t is lower than a threshold ε.
This algorithm represents the following assumed process: first, actors notice that the expected outcome is not going to be equal to their position, and they prefer a higher or lower outcome. They then radicalize their positions, attempting to employ their power as efficiently as possible in order to draw the outcome more towards their side. The algorithm's equilibrium is attained when the positions do not significantly change with the two first steps of the algorithm. This means that the actors no longer have the option of radicalizing their positions, and they may be satisfied with the new expected outcome.
The bilateral position exchange consists in a trade of revealed positions between two actors. These trades are likely to happen if the two actors have power over issues on which they are not salient, but in relation to which other actor is salient. In this case, the exchange will generate a gain of utility for the pair of actors. If we suppose that this gain of utility should be shared equally between the actors, the relative position change should be the following:
Actor-issue analysis
Page 16 of 33
( )( )ib,ia,ia,
jb,ja,jb,
jb,
ia,
Power
Power
∆
∆
SalienceSalience
SalienceSalience
Position
Position
++
=
4.6 Related work and contributions
The model we have developed is, to some extent, similar to the multi-criteria decision systems that have been extensively described in previous IS literature (see [22] for an overview). They have also been applied in GDSS [13] and, more recently in technology foresight contexts [39].
We have developed this model with the assumption that it should be possible to retain the strengths and correcting weaknesses of two forecasting models, the MACTOR model [6] and the Allas model [3], which are primarily based on the same kind of underlying concepts as our model. In an earlier article [8], we demonstrated that it was possible to correct the flaws of these models and to more adequately consider power and influence relationships. In the Mactor model, the concept of power is restricted to the influence between pairs of actors. Consequently, all the actors are treated as equally powerful on all issues (clout is not considered). Thus, indirect influence is not handled in a correct manner, since the weight of indirect influence decreases with the number of actors, and, if this number is high, direct influence is negated under the impact of indirect influences. In the Allas model, it is difficult to achieve a global understanding of the situation, inasmuch as this model considers only pairs of actors and issues, without providing analysts with an aggregation mechanism.
In the MASAM model, the expected outcome depends both on clout and influence. The divergence concept takes into account both the intensity of disagreement and actors’ attitudes towards expected outcomes. The power repartition also depends on influence and clout. In the alliance construct, an aggregating distance determines the actors’ allies and enemies, integrating convergence and divergence on issues. The concept of salience is more clearly maintained separate from the power concepts (clout and influence) in the different analyses.
5 VISUALIZING STRATEGIC DATA: A STATE-OF-THE-ART MODEL
When considering the output of multi-issue and multi-actor models, such as MASAM, one quickly notices that it becomes cumbersome to reduce a large amount of data into numbers, for analysis in table formats. As discussed by Dürsteler [17], for example, visualization has proven to be a better way to present information, inasmuch as tables have a readability limit of around twenty elements, while visualizations do not involve such constraints. Tufte [48], Spence [42] and Miller [32] have all engaged in comprehensive analyses of visualization strategies, as well as linking the modelling methods to human visual perception capabilities (see also the work of Harris [24] for a comprehensive list of graphic representations). However, we will narrow our focus to business information visualization and strategic visualization, as indicative applications of visualization techniques to decision-making. In other words: how can machines present data so people can discuss situations and make decisions based on quantitative and qualitative information? Tegarden has presented a useful survey of the applications of visualization technologies to business problem-solving [47]. Besides providing a list of useful visualizations, he has also stressed the importance of analyzing data (employing data-modelling approaches, for example), including observations of the scale and dimensionality of the data. In addition, he has reviewed several guidelines and recommendations for designing graphic user interfaces for business information visualization systems, which have a lot in common with common graphic user interfaces. Hao et al., from the HP Labs, have also [23] proposed an open framework with a set of general visualization tools targeted to solve numerous Business Intelligence problems.
Actor-issue analysis
Page 17 of 33
More specifically, tools have been developed to facilitate real-life negotiation support, such as The Mediator, Smart Settle, or Inspire, each of which provides varying amounts of graphic feedback. A more graphically sophisticated system has been proposed by Swaab et al. [45], to provide visual aid for real-life negotiation scenarios: a human facilitator quickly diagrams particular situations on a large computer display (in the case proposed by Swaab et al., depicting new buildings and roads that are about to be built) so that actors can discuss them in real-time. While emphasizing that their results might be applicable only to architectural projects, the authors have suggested that visualization supports a better and clearer understanding of disputed issues, compared to non-visualization. It helps to create a pro-social climate, building a common identity between the participants, simplifying processes of reaching consensus, and increasing satisfaction with the negotiation process (but curiously, not augmenting satisfaction with the outcome of the negotiation). One drawback of this method, however, is that the facilitator has to manually translate the negotiators’ wishes into pictorial representations.
However, few graphic representations have been developed for negotiation forecasting with multi-issue and multi-actor problems. MACTOR, a method presented by Godet [6], and which is similar to MASAM, has been widely used, but its graphic representations lack clarity. For example, rather than being merged, convergences and divergences between actors are represented on separate graphs, where actors (represented by nodes) are linked whenever they agree (or disagree). This causes focus problems, in that users must compare two graphs in order to completely understand the relationships that they describe. On the other hand, Godet has introduced a method of representing issues on a map, such that issues are closer whenever actors’ positions on them are similar: we have successfully extended this idea to provide a map of actors' relationships (see the Proximity Map in Section 6.5). Finally, Godet has merged on a third graph the correspondences between all actors and issues: issues and actors are positioned on a map, with actors who are willing to defend an issue with determination are placed in close proximity to the issue.
Allas’s [3] approach is notably different from other models; most of his graphic representations can be reduced to categorisation of elements over two criteria. All graphs thus generated have a similar look, basically a 2D plane divided into four sectors, corresponding to the compared elements. The greatest quality of these representations is that they are very easy to analyse. By separating the plane into four areas (top-left, top-right, bottom-left and bottom-right), it is easy to categorize actors or issues.
However, while Godet and Allas have proposed useful graphs for decision makers, their models neglect some important information. For example, there are no proposed representations for influences in MACTOR, except through tables that become less easy to read when the number of actors increases. Another major drawback arises from the scattering of information across numerous maps, without offering sufficient assistance when users need to obtain a quick glance of the locations where a specific actor is represented. All these limitations have motivated us to introduce more visual paradigms that help multi-issue and multi-actor negotiators, basically relying on two concepts: trying to gather information on the same graphs (while keeping them as simple as possible) and offering dynamic highlighting of concurrent representations of identical elements in a GUI.
5.1 Dynamic maps and treemaps
Selecting suitable graphs from the plethora of available representations is always a difficult task. In the case of MASAM, the negotiation problem includes changes in actors’ positions. In graphic terms, this means that the representations should evolve over time to reflect changes and developments in negotiation processes. There are two categories of data in MASAM. The first category comprises the alliance coefficients between actors. Skupin and Fabrikant [41] suggest that proximity data can be effectively translated into spring models, such as the method presented by Quinn [37]: actors represented on a 2D map are linked by invisible “springs” or “forces” and dynamically arrange themselves. This paradigm is
Actor-issue analysis
Page 18 of 33
easy to understand as the actors will tend to gather or move away on the screen, depending on their alliances.
The second category encompasses representations of clout, salience, and position, in addition to indications of the global importance of particular issues; in general, relationships are depicted through two variables. As a basis for our model, we have used Treemaps from Bederson et al. [7]: this method divides a rectangular surface, such that the size of the resulting surfaces can be compared one with another. This quickly gives a clear overview of the entire situation and maximizes the usable surface. The Map of the Market described by Wattenberg [51] is a good application of this technique.
6 VISUALIZING THE NEGOTIATION LANDSCAPE
In this section, we present the visualization tools developed for the MASAM model, and illustrate their application to the WISP case studies that are introduced in Section 3 above.
6.1 The visualization tool
The prototype of the visualization artefact we propose for supporting the MASAM model has been developed with Macromedia Flash. It provides tools for analysing influence, dissatisfaction and actor alliances, together with negotiation simulations. One of our assumptions is that a useful analysis will be easier to complete if all information is displayed on the screen simultaneously. Consequently, the proposed representations gather as much information as possible onto the same graphs. To make things easier to read, we also dynamically highlight symbols when a user rolls her or his mouse over them, to facilitate simultaneous consideration of all concurrent representations of an actor or an issue on the screen.
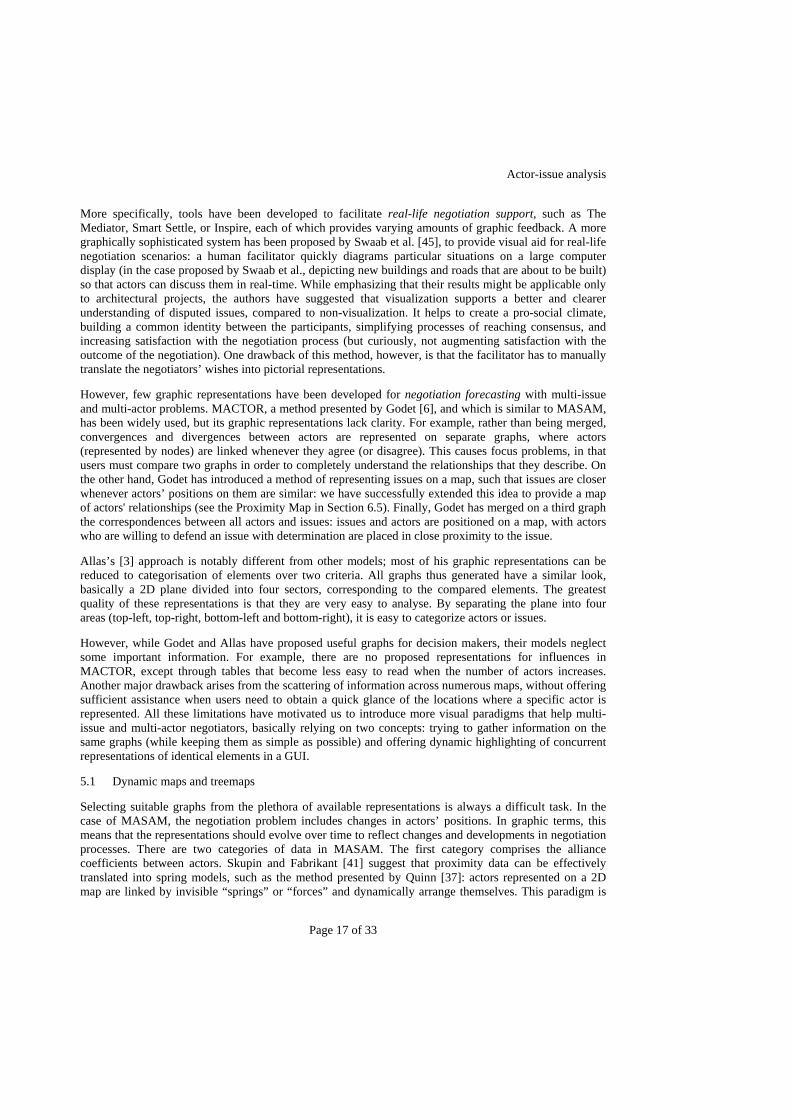
Figure 3: MASAM main screen (basic analysis tools)
Actor-issue analysis
Page 19 of 33
The visualization tool, as illustrated in Figure 3, displays, within the same graphic user interface, the informative windows (located on the left) and the analysis tools. Informative windows briefly summarize the stakeholders and issues through the list of actors, the list of issues, the main (selected) actor, and the actor's details (a pie chart of influences over an actor). During analysis, the user can temporarily hide information by creating groups of actors or issues, or rearranging the windows.
Analysis tools match the various analyses performed by MASAM: influence analysis with the Passive Influence Map and the Power Distribution Map, dissatisfaction analysis with the Expected Outcome and Dissatisfaction Map, actor alliance analysis with the Proximity Map, and negotiation simulation with the Negotiation Map. These tools are each discussed in detail in the following sections.
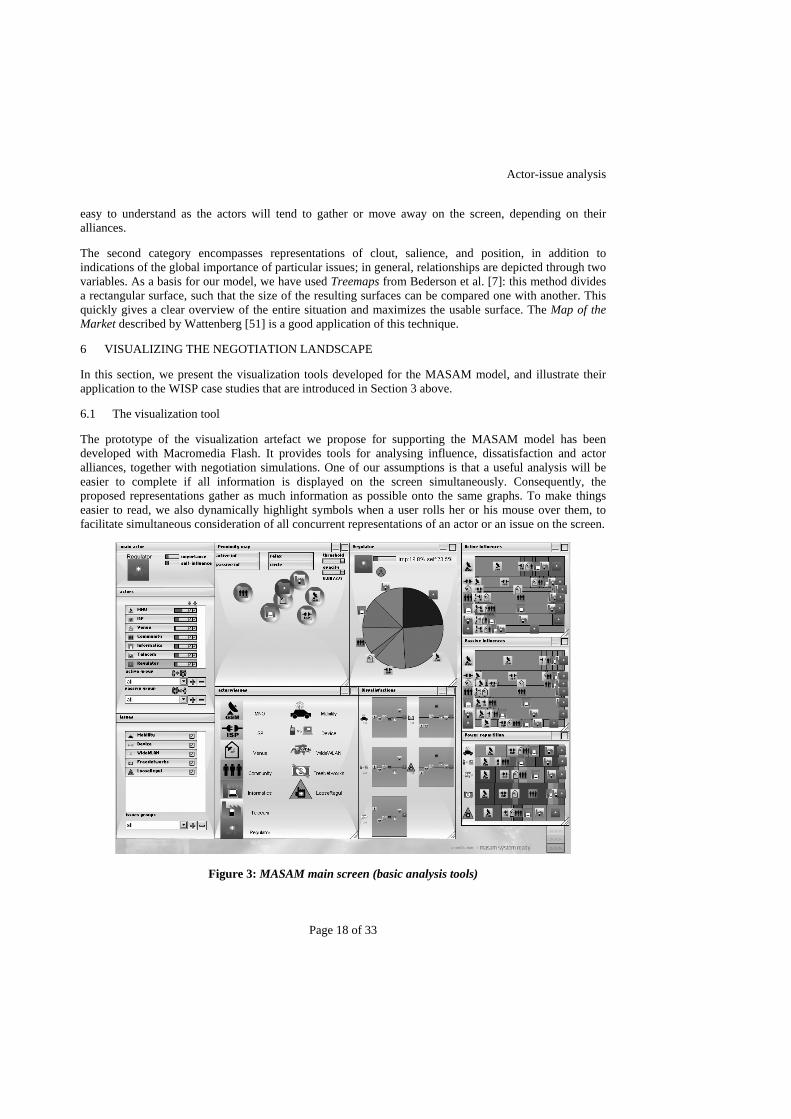
6.2 Influence analysis with the Passive Influence Map
Influence analysis is the study of direct or indirect influences between actors. The combined influences guiding any particular actor add up to 100%, as discussed above, and the influences can be divided into self-influence and all remaining influences on the actor. Rather than simply comparing influence values, we have combined this information with the importance of actors onto the Passive Influence Map. We have implemented this with a treemap, where resulting surfaces can be compared adjacent to each other, with influence on important actors exhibiting a higher weight.
Mobile NetworkOperators
WirelineISP Venues
CommunitiesTelephony
InformaticsRegulator
MobileNetwork
Operators
Wireline ISP(currently
highlighted)
Venues
Communities
Telephony
Informatics
Regulator
Figure 4: The Passive Influence Map.
Figure 4 illustrates the treemap of Passive Influences: this window is divided into rectangular rows (one per actor), with higher measurements proportional to the importance of the actors. Each row is segmented according to the influences on the actor: the width of each division is proportional to the influence and labelled with the symbol of its influencer. In order to separate self-influence from external influences, the
Actor-issue analysis
Page 20 of 33
rectangles are represented in different colours (green and red, respectively). The advantage of this method is twofold: first, influences can be compared by considering the widths of rectangles, and second, surface comparisons also reflect the relative importance of particular actors. This helps to value influences during negotiation (for instance, influences on important actors are more valuable and translate to larger areas).
Analysis of the Passive influences in the WISP case: The observation of the surfaces on the graph shows that MNO's are dominant, influent and uncontrolled. On the other hand, Venues is a weak actor, with little clout on important issues, and little influence on others. The Regulator, while rather powerful, is highly influenced, exhibiting a conciliator role. As we can see, surface comparison is a powerful, yet simple tool to gather information at a glance. It also follows the natural reactions of the brain: a first overview of the situation (where we notice the larger rectangles) followed by an in-depth inspection of cells.
6.3 Issue analysis with the Expected Outcome and Dissatisfaction Map
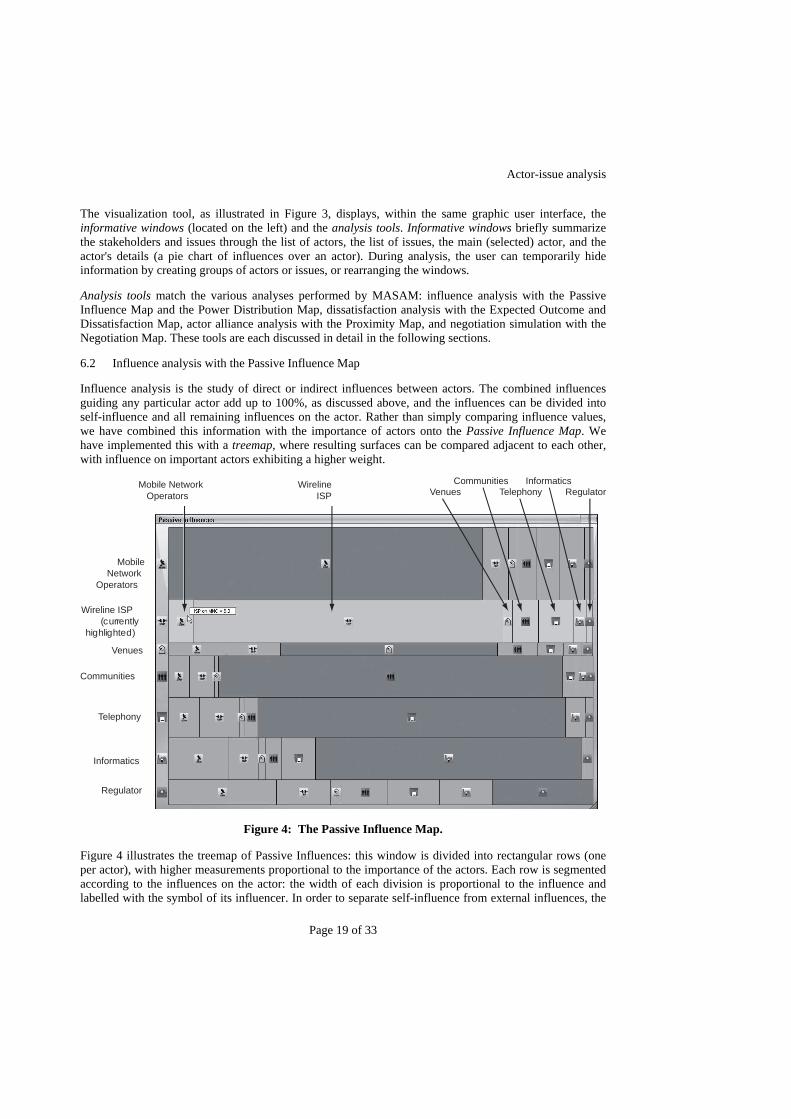
Figure 5: Expected Outcome and Dissatisfaction Map.
The Expected Outcome and Dissatisfaction Map (Figure 5) represents the dissatisfaction of actors regarding particular issues. Each issue is represented by a vertical scale, where actors are positioned according to their dissatisfaction with the expected outcome of the situation. Actors in the middle are not very dissatisfied, either because the expected outcome fits their needs or because the issue in question is not salient for them. Dissatisfied actors gather on both extremities of the scale: they generally exhibit high salience and positions highly diverging from the expected outcome. Actors on the top are willing to increase the outcome and actors on the bottom would like to lower it. As discussed below, this representation is also integrated into the more complete Negotiation Map.
Analysis of the expected outcome and dissatisfaction map in the WISP case: Figure 5 shows that for the issue of Free Networks, Communities (at the top of the illustration) and MNOs and ISPs (at the bottom) are the most dissatisfied actors. According to the issue’s importance, and to the high dissatisfaction the three actors exhibit, the other non-salient stakeholders may be tempted to offer their support to one of the other parties.
Mise en forme : Puces et
numéros
Actor-issue analysis
Page 21 of 33
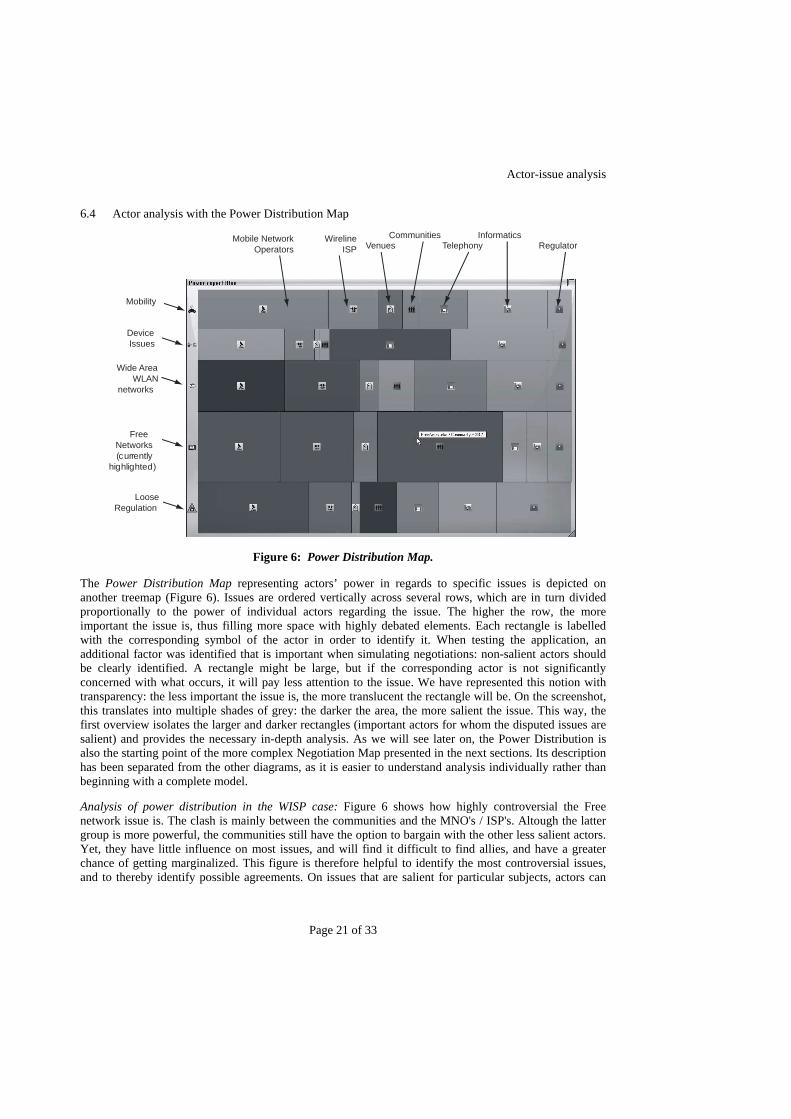
6.4 Actor analysis with the Power Distribution Map
Mobile NetworkOperators
WirelineISP Venues
CommunitiesTelephony
InformaticsRegulator
Mobility
DeviceIssues
Wide AreaWLAN
networks
FreeNetworks(currently
highlighted)
LooseRegulation
Figure 6: Power Distribution Map.
The Power Distribution Map representing actors’ power in regards to specific issues is depicted on another treemap (Figure 6). Issues are ordered vertically across several rows, which are in turn divided proportionally to the power of individual actors regarding the issue. The higher the row, the more important the issue is, thus filling more space with highly debated elements. Each rectangle is labelled with the corresponding symbol of the actor in order to identify it. When testing the application, an additional factor was identified that is important when simulating negotiations: non-salient actors should be clearly identified. A rectangle might be large, but if the corresponding actor is not significantly concerned with what occurs, it will pay less attention to the issue. We have represented this notion with transparency: the less important the issue is, the more translucent the rectangle will be. On the screenshot, this translates into multiple shades of grey: the darker the area, the more salient the issue. This way, the first overview isolates the larger and darker rectangles (important actors for whom the disputed issues are salient) and provides the necessary in-depth analysis. As we will see later on, the Power Distribution is also the starting point of the more complex Negotiation Map presented in the next sections. Its description has been separated from the other diagrams, as it is easier to understand analysis individually rather than beginning with a complete model.
Analysis of power distribution in the WISP case: Figure 6 shows how highly controversial the Free network issue is. The clash is mainly between the communities and the MNO's / ISP's. Altough the latter group is more powerful, the communities still have the option to bargain with the other less salient actors. Yet, they have little influence on most issues, and will find it difficult to find allies, and have a greater chance of getting marginalized. This figure is therefore helpful to identify the most controversial issues, and to thereby identify possible agreements. On issues that are salient for particular subjects, actors can
Actor-issue analysis
Page 22 of 33
easily find the areas controlled by uninterested stakeholders, and thus discern potential opportunities to earn additional support for their interests.
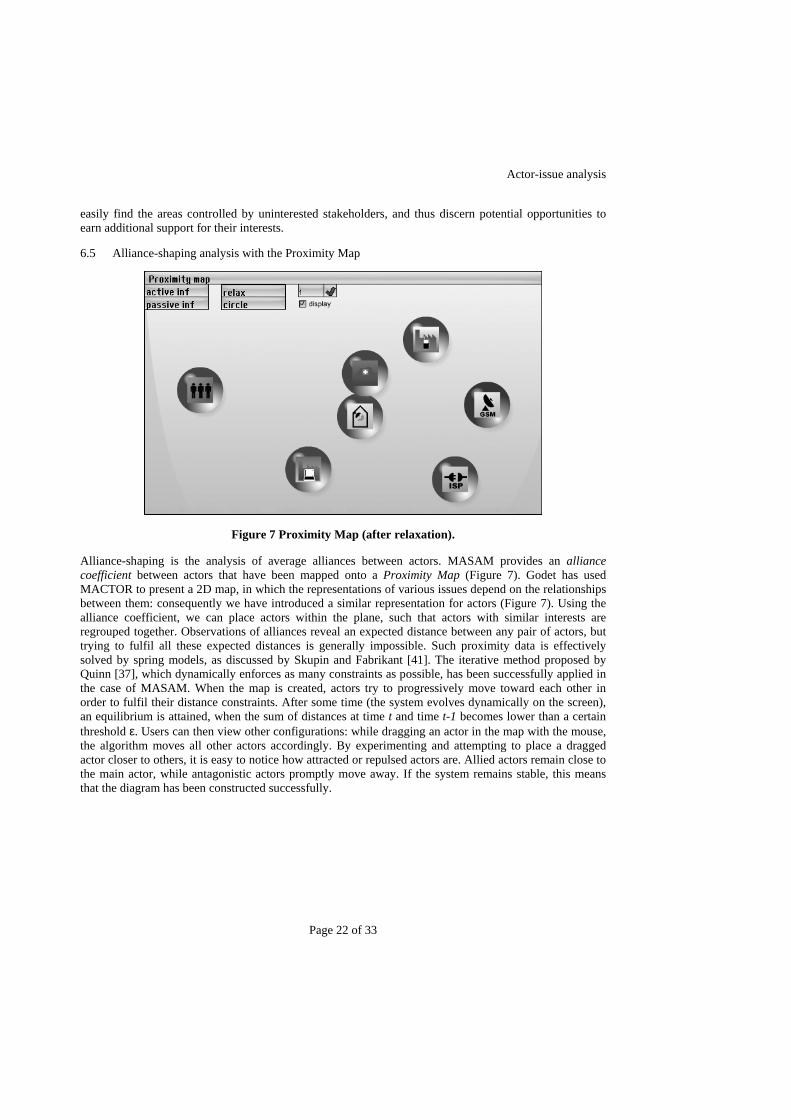
6.5 Alliance-shaping analysis with the Proximity Map
Figure 7 Proximity Map (after relaxation).
Alliance-shaping is the analysis of average alliances between actors. MASAM provides an alliance coefficient between actors that have been mapped onto a Proximity Map (Figure 7). Godet has used MACTOR to present a 2D map, in which the representations of various issues depend on the relationships between them: consequently we have introduced a similar representation for actors (Figure 7). Using the alliance coefficient, we can place actors within the plane, such that actors with similar interests are regrouped together. Observations of alliances reveal an expected distance between any pair of actors, but trying to fulfil all these expected distances is generally impossible. Such proximity data is effectively solved by spring models, as discussed by Skupin and Fabrikant [41]. The iterative method proposed by Quinn [37], which dynamically enforces as many constraints as possible, has been successfully applied in the case of MASAM. When the map is created, actors try to progressively move toward each other in order to fulfil their distance constraints. After some time (the system evolves dynamically on the screen), an equilibrium is attained, when the sum of distances at time t and time t-1 becomes lower than a certain threshold ε. Users can then view other configurations: while dragging an actor in the map with the mouse, the algorithm moves all other actors accordingly. By experimenting and attempting to place a dragged actor closer to others, it is easy to notice how attracted or repulsed actors are. Allied actors remain close to the main actor, while antagonistic actors promptly move away. If the system remains stable, this means that the diagram has been constructed successfully.
Actor-issue analysis
Page 23 of 33
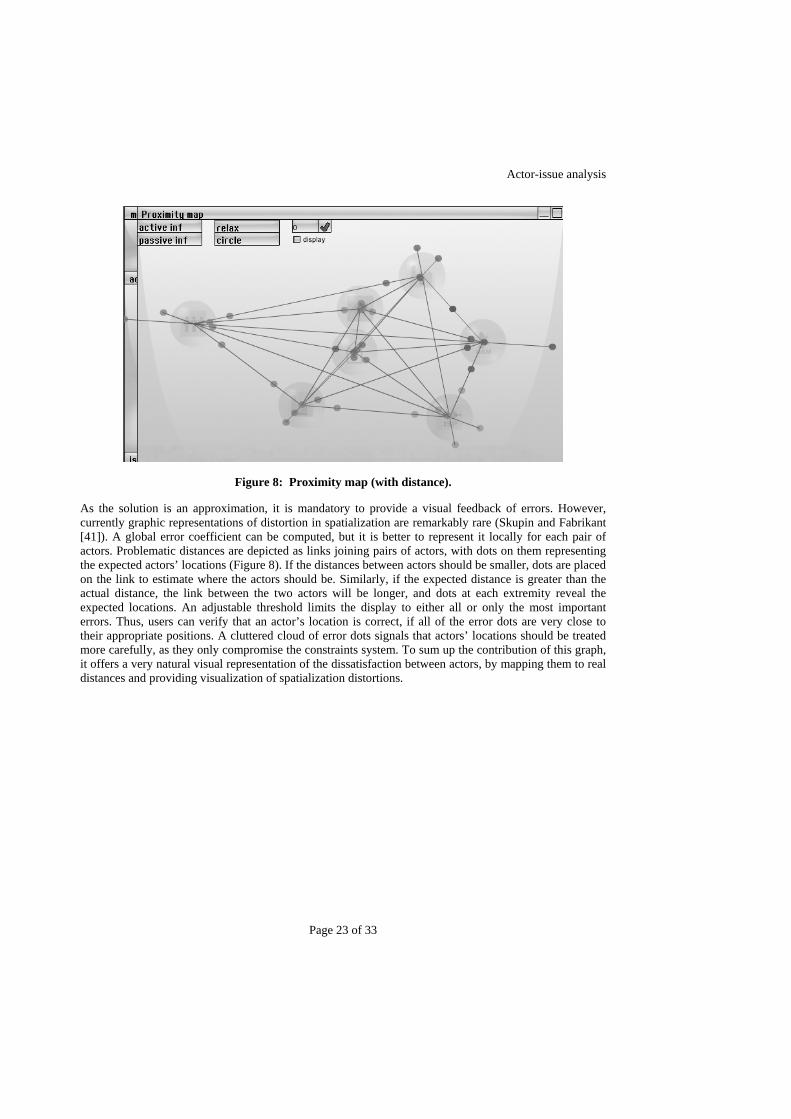
Figure 8: Proximity map (with distance).
As the solution is an approximation, it is mandatory to provide a visual feedback of errors. However, currently graphic representations of distortion in spatialization are remarkably rare (Skupin and Fabrikant [41]). A global error coefficient can be computed, but it is better to represent it locally for each pair of actors. Problematic distances are depicted as links joining pairs of actors, with dots on them representing the expected actors’ locations (Figure 8). If the distances between actors should be smaller, dots are placed on the link to estimate where the actors should be. Similarly, if the expected distance is greater than the actual distance, the link between the two actors will be longer, and dots at each extremity reveal the expected locations. An adjustable threshold limits the display to either all or only the most important errors. Thus, users can verify that an actor’s location is correct, if all of the error dots are very close to their appropriate positions. A cluttered cloud of error dots signals that actors’ locations should be treated more carefully, as they only compromise the constraints system. To sum up the contribution of this graph, it offers a very natural visual representation of the dissatisfaction between actors, by mapping them to real distances and providing visualization of spatialization distortions.
Actor-issue analysis
Page 24 of 33
FreeAccess
Mobility
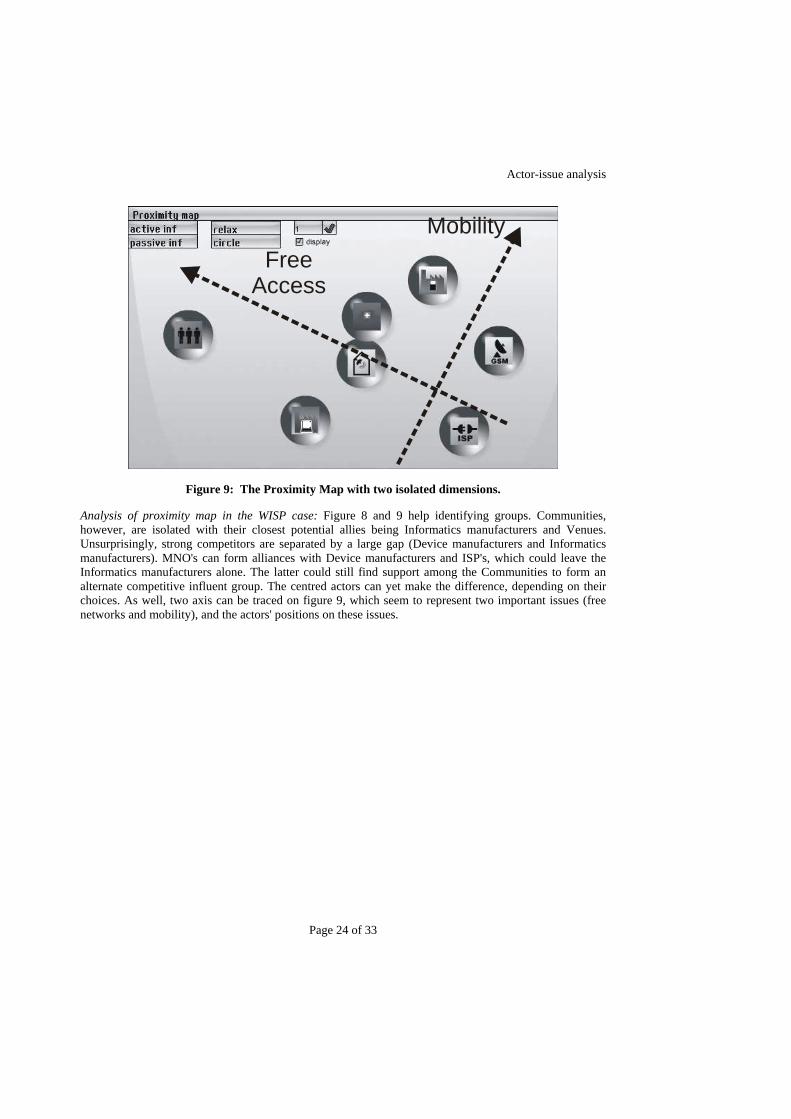
Figure 9: The Proximity Map with two isolated dimensions.
Analysis of proximity map in the WISP case: Figure 8 and 9 help identifying groups. Communities, however, are isolated with their closest potential allies being Informatics manufacturers and Venues. Unsurprisingly, strong competitors are separated by a large gap (Device manufacturers and Informatics manufacturers). MNO's can form alliances with Device manufacturers and ISP's, which could leave the Informatics manufacturers alone. The latter could still find support among the Communities to form an alternate competitive influent group. The centred actors can yet make the difference, depending on their choices. As well, two axis can be traced on figure 9, which seem to represent two important issues (free networks and mobility), and the actors' positions on these issues.
Actor-issue analysis
Page 25 of 33
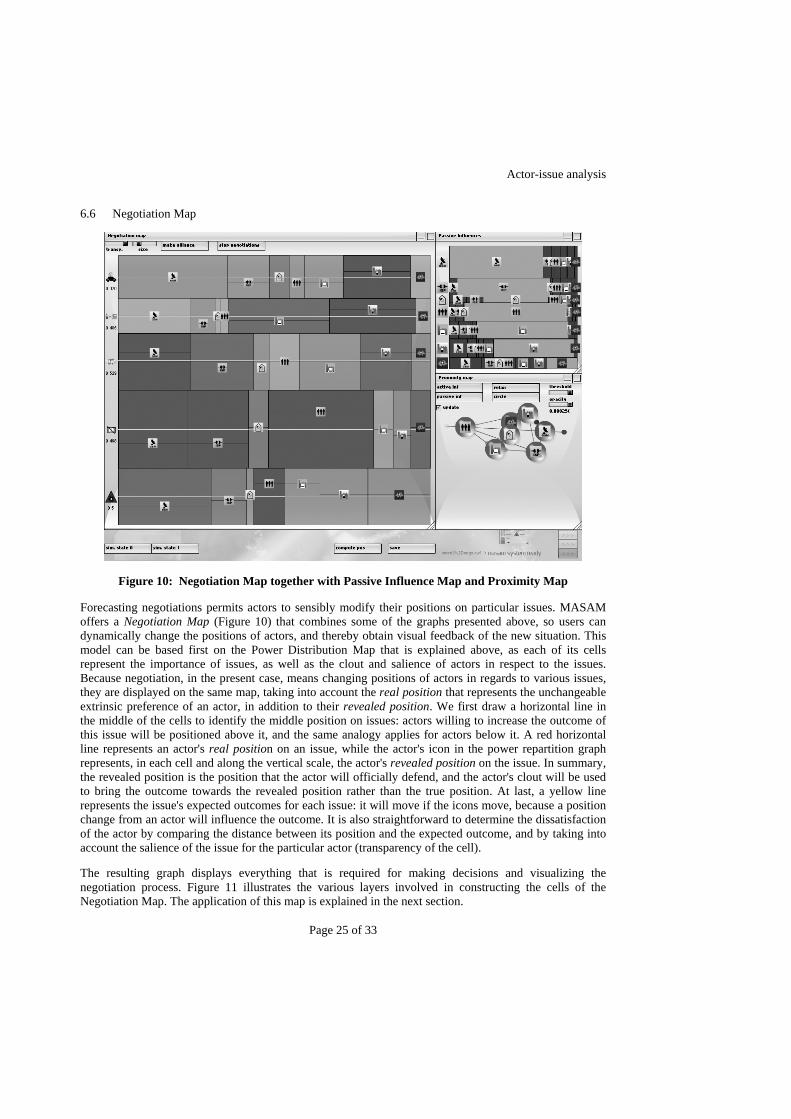
6.6 Negotiation Map
Figure 10: Negotiation Map together with Passive Influence Map and Proximity Map
Forecasting negotiations permits actors to sensibly modify their positions on particular issues. MASAM offers a Negotiation Map (Figure 10) that combines some of the graphs presented above, so users can dynamically change the positions of actors, and thereby obtain visual feedback of the new situation. This model can be based first on the Power Distribution Map that is explained above, as each of its cells represent the importance of issues, as well as the clout and salience of actors in respect to the issues. Because negotiation, in the present case, means changing positions of actors in regards to various issues, they are displayed on the same map, taking into account the real position that represents the unchangeable extrinsic preference of an actor, in addition to their revealed position. We first draw a horizontal line in the middle of the cells to identify the middle position on issues: actors willing to increase the outcome of this issue will be positioned above it, and the same analogy applies for actors below it. A red horizontal line represents an actor's real position on an issue, while the actor's icon in the power repartition graph represents, in each cell and along the vertical scale, the actor's revealed position on the issue. In summary, the revealed position is the position that the actor will officially defend, and the actor's clout will be used to bring the outcome towards the revealed position rather than the true position. At last, a yellow line represents the issue's expected outcomes for each issue: it will move if the icons move, because a position change from an actor will influence the outcome. It is also straightforward to determine the dissatisfaction of the actor by comparing the distance between its position and the expected outcome, and by taking into account the salience of the issue for the particular actor (transparency of the cell).
The resulting graph displays everything that is required for making decisions and visualizing the negotiation process. Figure 11 illustrates the various layers involved in constructing the cells of the Negotiation Map. The application of this map is explained in the next section.

Actor-issue analysis
Page 26 of 33
Power of actorA on issue I
Importanceof issue I
Position of actorA on issue I
Transparency =salience of A for I
Expected Outcome
Transparency =salience of A for I
Position of actorA on issue I
Importanceof issue I
Power of actorA on issue I
Expected Outcome
Icon can be draggedto change the position
of the actor duringnegotiation
Position of actorA on issue I
Position of actorduring negotiation
Figure 11: Cells of the Negotiation Map.
7 SIMULATION AND NEGOTIATION SCENARIOS
In the context of developing policies, authors such as Bueno de Mesquita [11, 12], Stockman [44], and Achterkamp [2] have developed models for forecasting collective decision-making, they have introduced a variety of simulation techniques, and they have compared the predictions generated with their models against relevant empirical data. Their models use the same input as the MASAM model, and also attempt to predict the outcomes of collective decisions. These outcomes depend on the choices made by the actors who are most interested in the issues. In the policy-making context, these outcomes are essentially determined by voting behavior. For a more efficient modeling process, the Allas model [3] has been developed as a simplified version of the models designed by Bueno de Mesquita [11, 12].
Dynamic applications of the MASAM model and the visual maps it generates are described in this section, in terms of evaluating different alternatives in a scenario-based approach [50]. MASAM allows users to observe the probable evolution of revealed positions and the possible emergence of coalitions of actors.
This section also illustrates how to take into consideration shifts and exchanges of positions between actors during negotiation and assessment processes. Thanks to the Negotiation Map and its assorted negotiation simulating capabilities, the possible bilateral position exchanges can be spotted and their effects can be forecasted. Actors can thus determine who their best potential partners are, and which position exchanges could be fair for both of the actors.
7.1 Using the maps for evolution analysis
The Proximity Map represents the alliance coefficient between actors, based on their positions and saliencies. In a more dynamic analysis of possible negotiation evolutions, real positions can be replaced by alleged positions declared by actors during negotiations (which may change). It is thus straightforward to determine a new Proximity Map whenever the revealed positions change. Furthermore, inasmuch as the map is computed by attempts to dynamically satisfy distance constraints when positions change, the map is automatically adjusted so users can monitor actors’ movements in relation to their alliances.
Users can simulate and experiment with changes in positions. As the experimentation proceeds, further states can be stored and recalled during the analysis, enabling users to compare between different
Actor-issue analysis
Page 27 of 33
situations. Based on this evolution of positions, MASAM smoothly moves the actors on the Proximity Map, and it updates the Negotiation Map, ensuring that changes between situations are noticeable (all saved states are easily accessible through dynamically created buttons on the bottom of the screen). Two possible position changes are described in the next section.
7.2 Position shifting
After the actors in a scenario have asserted their initial attitudes toward the issues in question, they then react to the resultant situation through a process of position shifting, in relation to the other actors and to the issues. Their strategies involve consolidating their positions, so that the expected outcomes move closer to their desired outcomes. As further explained in this section, actors can be classified into three groups: actors who are willing to shift their positions towards one extreme position regarding an issue, actors who are willing shift toward the other extreme, and actors who remain in a neutral position regarding the issue. In graphic terms, to which we refer through the rest of this section, the positions that the actors reveal will either move higher on the rows symbolizing specific issues in the Negotiation Map, they will move lower in the rows, or they will remain in the center if they are functioning as stabilizers for the issue. Consequently, the groupings of actors who are positioned at the higher limits of the rows and the actors who are positioned closer to the lower limits will function as coalitions of opinion regarding each issue.
Our model is based on the assumption that actors will try to evaluate the situation's evolution, and compare this forecast with their own desired positions. If particular actors think that these two values are divergent, they will define a new positioning strategy that could change the expected outcome. Depending on the particular issue in question, the three possible strategies noted above are available to an actor: they can influence an issue toward one position, thereby causing the line indicating the predicted outcome on the Negotiation Map to shift higher, they can cause the prediction to move lower on the Map, or they can stabilize the outcome. If the actor's position is higher than the expected outcome, that actor is more likely to defend a position that raises the outcome, rather than defending an absolute value for this position. The advantage of such a strategy is that other actors are likely to defend the outcome-raising strategy, and actors will support each other and diligently defend a more extreme point of view. All actors choosing the raising strategy will form a single-issue coalition, and the results will be more pronounced than if each of the actors individually defend an absolute value for the outcome. According to the same logic, actors that are unsatisfied with the expected outcome because it is too low will form a lowering coalition. The third coalition that could emerge comprises an alliance of stabilizers: actors that are more or less satisfied with the current outcome, and who will try to use their clout to rebalance the effects of the dynamic position shifting. If they have enough power to maintain the expected outcome, the coalition strategy will be a failure, but if one of the alliances is strong enough, the strategy can significantly change the outcome.
MASAM offers an automatic simulation of the shifting strategy. The algorithm functions progressively: at time t=0, all revealed positions are set to their corresponding real positions. Iteratively, each actor compares his or her real position at time t with the current expected outcome, adjusting his or her position accordingly by a small ∆position amount. The significance of this displacement is determined by the outcome, such that the new position rises if the actor expects a higher outcome. This produces new revealed positions for t+1 and the comparison begins again. Some damping ensures that the ∆position decreases gradually, leading to a stabilized situation after a period of time. The results include some extreme revealed positions (actors at either end of the scale), with the exceptions of actors for whom the issue in question is not salient (i.e., the actors are not willing to change). This suggests a rough idea of future possible alliances. The new expected outcome also reveals the dissatisfactions of actors after this first basic strategy has been applied.
Actor-issue analysis
Page 28 of 33
expectedoutcome
revealed and real positions are the same
Before position shifting
After position shifting
expectedoutcome
has changed
revealed positions changed
real positionsare the same
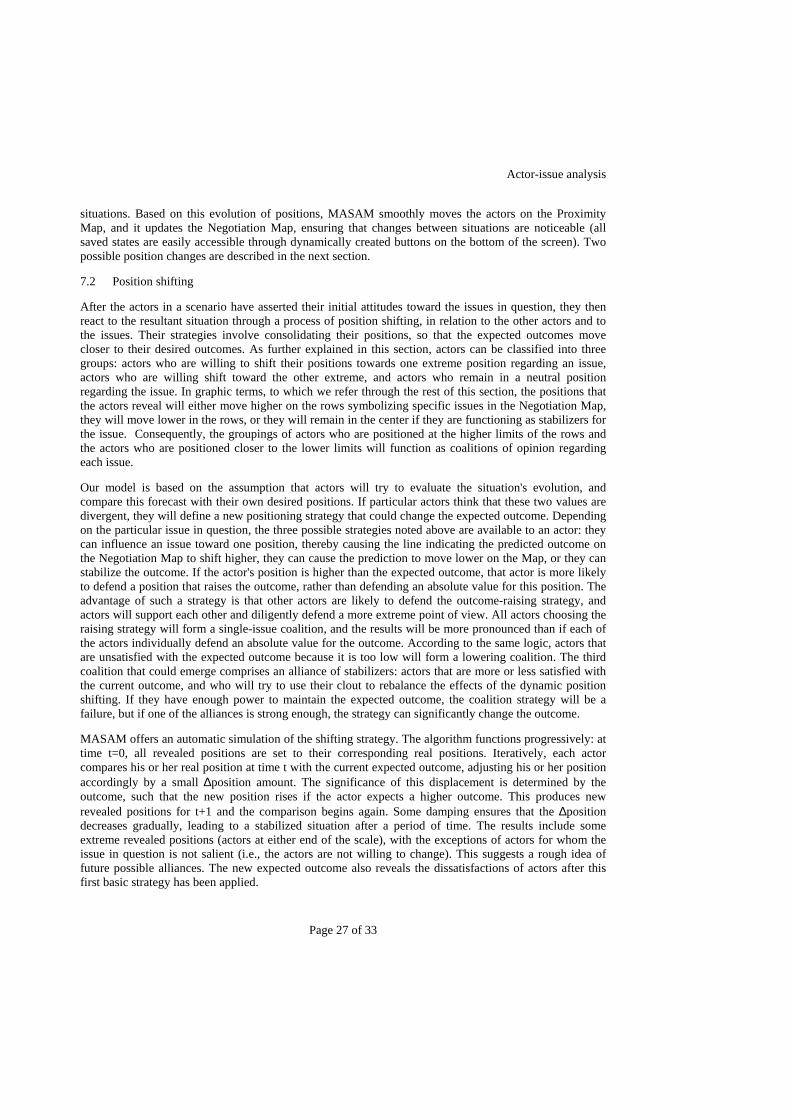
Figure 12 An example of position shifting
Application to the WISP case: Figure 12 illustrates an example of position-shifting. While the actors all seem to adopt moderate positions that are all different, the position shifting algorithm reveals two coalitions. The first coalition, battling for lower regulation, is composed of Operators and ISPs, which together have one third of the power. All five other actors are in the other coalition, and by shifting their positions, they are able to raise the expected outcome. Three of these actors are even very satisfied with that outcome. The weakness of this coalition is, however, its low average salience, represented by the lightness of the cells. Actors will be able to influence the less salient members of the coalition, like the Regulator or the Telecom firms, by offering a position change in another issue. The fact that the surface covered by non-salient actors is wide demonstrates that the issue is unstable, with a high potential of lowering if negotiations occur. The Communities are not very powerful on this issue, and their allies are unstable, indicating that they have a low chance of maintaining the outcome if the other actors negotiate with each other. Moreover, Operators and ISPs are much closer to the Telecom-related companies in the proximity map than are Communities, which would suggest that this particular raising coalition is even more likely to devolve.
7.3 Position exchange
Stockman and Van Oosten [44] have proposed an object-oriented model of policy networks, based on the exchange of voting positions. We have retained their assumptions in our exchange design. The utility function of an actor is depicted as a single peaked linear function of the difference between the expected outcome and the actor's position. The slope of this function is the salience for the actor. Actors are expected to be aware of the information included on the model, including saliencies, clout and positions. Stockman and Van Oosten have also assumed that exchanges are balanced, and therefore they ascribe the same utility to both negotiators. These assumptions have been adopted as a foundation for deciding whether a particular transaction is fair or not.
If actors remain dissatisfied, or if a user thinks that the position-shifting hypotheses do not adequately apply to the situation, there is another option for the actors to change the outcome: bargaining with other
Actor-issue analysis
Page 29 of 33
actors. The Negotiation Map can also be used to spot the most favorable opportunities for compromises. The principle of a bilateral exchange is simple: actors can change their revealed position on issues regarding which they are not significantly salient, and in exchange, other actors will change their own positions on different issues.
Therefore, rather than changing their revealed positions independently, two actors can choose to bargain. This process involves identifying a particular actor (A) who wishes to influence the outcome of an issue (I), and another actor (B) who is unsatisfied with a separate issue (J). A bargain is then possible if A is not salient on J and B is not salient on I, and if their position changes can influence the outcome of the issue. Therefore, a better deal might be found if A shifts their position on J and B shifts their position on I. This raises questions about the extent to which A should adjust its own position to match B's shift position, and whether the exchange is fair to both actors. MASAM provides a ratio of ∆position A,J / ∆position B,I that can be used to compute the position variation for one actor knowing the variation of the other actor. Diagramming the negotiations on a map is relatively straightforward: after pressing the corresponding button, a user selects two cells in the Negotiation Map, corresponding to the bargain. This sets up a link between the pairs of actors and issues, such that every position change on one actor will affect the other actor accordingly. The new expected outcomes are simultaneously updated, leading to a new situation for the user to consider. Such real-time feedback facilitates experimentation with the positional changes, to determine the best deals. Empirical evidence for the predictive power of this exchange strategy has already been demonstrated in other studies [2, 12, 44], but the absence of visualization has remained one of the prominent weaknesses of such models. The cognitive overload seems very high. The visual maps and the user interface we propose and illustrate thus offers significant advantages for users of such predictive models.
INSERT FIGURE 13
Figure 13 Position Exchange
Application to the WISP case: A position exchange can occur between the Operators and the Informatics firms for the Device issue and the Wide WLAN issue. This exchange could be profitable for both parties because they have diametrically opposed saliencies on two different issues, in relation to which they each possess a substantial power. The Operators attach a high importance to WLAN coverage and desire its outcome to rise. The Informatics firms inhabit a different position, but it is much less salient for them. On the other hand, the Operators don't really care about the devices, but this issue is of prime importance to Informatics firms (device manufacturers). The Operators could change their revealed position on the Device issue according to the output desired by Informatics firms, and in exchange, Informatics firms would raise their announced position on the wide WLAN issue. The model illustrated in Figure 13 reveals an exchange that would be fair. A forecaster could use this information to predict the terms of the bargain, while one of the two actors could know at which point the trade is fair.
8 CONCLUSION
In this article, we have proposed a negotiation support system for facilitating the choice of a negotiation strategy when multiple actors are confronted with each other on multiple issues, and when the actors attempt to influence the outcome through negotiation, for their own advantage. Such situations occur in multiparty negotiations where the various stakeholders have different goals on several issues under discussion.
We suggested some evidences that the model we propose is valuable, specifically in a scenario-based context. While most of the current NSS prototypes cater for bilateral, multi-issue and session-based negotiation situations, the paper proposed a fully functional tool that takes into account the involvement of
Actor-issue analysis
Page 30 of 33
a network of actors over multiple issues, and support negotiators with strategic analysis of the situation. Moreover, the system enables the decision makers to forecast the evolution of a negotiation process, design and assess several alternative scenarios on possible futures of a negotiation, and hence assists them in influencing the outcome at their advantage through negotiation.
We have observed that visualization is currently not adopted in a comprehensive manner in most negotiation situations. Consequently, we have proposed a set of visual maps to represent the negotiation landscape more effectively, revealing expected outcomes and dissatisfied actors, the power distribution between actors for different issues, proximities in the positions of actors, and potential alliances between the actors. We have endeavored to demonstrate the advantages of such visual maps for analyzing the landscape.
We have illuminated the advantages of using the model we have developed and its visual maps, to investigate complex and uncertain landscapes, to prepare the negotiations that will drive its evolution, and to design well-founded scenarios for the future. We plan to pursue this technology assessment with the actors of the subject WLAN industry themselves, using the same model and the same approach.
In future investigations, we plan to adopt a new research direction, concerning methods for eliciting inputs used by the model we have presented. The quality of the outcome produced by the model largely relies on the input provided by the experts during the elicitation phase, described in Section 3. Until now, we have used a Delphi method, which does not preclude either bad selections of the group of experts, or the biases these experts might introduce into their input. An alternative solution would be to adopt a Securities Trading of Concepts process (STOC) [15], or a prediction market approach [9] for the elicitation process. This prediction market could be computer-supported and would permit extension across a larger number of people (including students, academics, consultants, and employees), who are perhaps individually less knowledgeable than experts, but collectively better informed, if the assumptions of such predictive analytics theories are validated.
REFERENCES
1. Aarnio, A.; Enkeberg, A.; Heikkilä, J.; and Hirvola, S. Scenarios for mobile commerce in 2006, Research report, European Fifth Framework Project IST-1999-21000, (2002).
2. Achterkamp, M. Challenge versus exchange in collective decision making: a comparison of two simulation models based on simulated data. Computational & Mathematical Organization Theory, 8, (2002), 171-196.
3. Allas, T., and Georgiades, N. New tools for negotiators, McKinsey Quarterly, Vol. 2, (2001), 86-97.
4. Andrews, K.R. The Concept of Corporate Strategy. 3rd ed., Homewood: Dow Jones-Irwin, 1987.
5. Ansoff, H. Strategic issue management. Strategic Management Journal, 1, 2, (1980), 131-148.
6. Arcade, J.; Godet, M.; Meunier, F.; and Roubelat, F. Structural Analysis with the MICMAC method & Actors' Strategy with MACTOR method., in J. Glenn, ed., Futures Research Methodology, American Council for the United Nations University: The Millennium Project, 1999, 1-69.
Actor-issue analysis
Page 31 of 33
7. Bederson, B.; Schneiderman, B.; and Wattenberg, M. Ordered and quantum treemaps: making effective use of 2D space to display hierarchies. ACM Transactions on Graphics, 21, 4, (2002), 833-854.
8. Bendahan, S.; Camponovo, G.; and Pigneur, Y. Multi-issue actor analysis: tools and models for assessing technology environments. Journal of Decision Systems, 13, 2, (2004), 223-253.
9. Berg, J., and Riez, T. Prediction markets as decision support systems. Information Systems Frontiers, 5, 1, (2003), 79-93.
10. Bourgeois, L.J.I. Strategy and environment: a conceptual integration. Academy of Management Review, 5, 1, (1980), 25-39.
11. Bueno de Mesquita, B. Political forecasting: an expected utility method, in B. Bueno de Mesquita and F. Stockman, ed., European Community decision making models, applications and comparisons, New Haven: Yale University Press, 1994, 71-104.
12. Bueno de Mesquita, B., and Stockman, F. European Community Decision Making: Models, Applications, and Comparisons. Yale University Press, 1994.
13. Bui, T. Co-Op: A Group Decision Support System for Cooperative Multiple Criteria Group Decision Making. New York: Springer-Verlag, 1987.
14. Camponovo, G.; Heitmann, M.; Stanoevska, K.; and Pigneur, Y. Exploring the WISP industry - Swiss case study, in Proceedings of 16th Bled eCommerce Conference, Bled, 2003.
15. Chan, N.; Dahan, E.; Kim, A.; Lo, A.; and Poggio, T. Securities Trading of Concepts (STOC), eBusiness paper 172, MIT, (2002).
16. Dill, W.R. Environment as an influence on managerial autonomy. Administrative Science Quarterly, 2, 4, (1958), 409-443.
17. Dürsteler, J. Text, tables and graphics, Inf@Vis! website [checked on Nov. 04], (2002).
18. Freeman, E., Strategic Management - A Stakeholder Approach. 1984, HarperCollins: Boston.
19. Godet, M. Manuel de Prospective Stratégique. 2nd ed., Vol. 2, Paris: Dunod, 2001.
20. Goh, K.; Teo, H.; Wu, H.; and Wei, K. Computer-supported negotiations: an experimental study of bargaining in electronic commerce. Proceedings of the Twenty First International Conference on Information Systems, (2000), 104-116.
21. Hämäläinen, R. Decisionarium: aiding decisions, negotiating and collecting opinions on the web. Journal of Multi-Criteria Decision Analysis, 12, 2-3, (2004), 101-110.
22. Hämäläinen, R. Reversing the perspective on the applications of decision analysis. Decision Analysis, 1, 1, (2004), 9-35.
23. Hao, M.; Dayal, U.; and Hsu, M. Visual Data Mining for Business Intelligence Applications, in H. Lu and A. Zhou, ed., Proceedings of the First International Conference on Web-Age
Actor-issue analysis
Page 32 of 33
Information Management, Vol. 1846, Lecture Notes in Computer Science, New York: Springer, 2000, 1-14.
24. Harris, R. Information Graphics: A Comprehensive Illustrated Reference. Oxford: Oxford University Press, 2000.
25. Herslow, L.; Navarro, C.-J.; and Scholander, J., ed., Exploring the WISP industry - Analysing strategies for Wireless Internet Service Providers, Lund: Lund University, 2002.
26. Kersten, G.; Strecker, S.; and Lay, K. Protocols for electronic negotiation systems: theoretical foundations and design issues, InterNeg Working Paper INR 06/04, University of Ottawa and Carleton University, (2004).
27. Kersten, T. WWW-based negotiation support: design, implementation, and use. Decision Support Systems, 25, (1999), 135-154.
28. Lehr, W., and McKnight, L. Wireless internet access: 3G vs. WiFi ? Telecommunication Policy, 27, (2002), 351-370.
29. Lim, L.-H., Benbasat, Izak. A theoritical perspective of negotiation support systems. Journal of Management Information Systems, 9, 3, (1993), 27-44.
30. Linstone, H., and Turoff, M. The Delphi Method: Techniques and Applications. Massachusetts: Addison-Wesley, 1975.
31. March, S., and Smith, G. Design and natural science research in information technology. Decision Support Systems, 15, 4, (1995), 251-266.
32. Miller, D. The magical number seven, plus or minus two: Some limtis on our capacity for processing information. Psychological review, 63, (1956), 81-97.
33. Mitchell, R.; Agle, B.; and Wood, D. Toward a theory of stakeholder indetification and salience: defining the principle of who and what really counts. The Academy of Management Review, 22, 4, (1997), 853-886.
34. Monzani, J.; Bendahan, S.; and Pigneur, Y. Decision and visualization for negotiation, in Proceedings of Proceedings of the Thirty-Seventh Annual Hawaii International Conference on System Sciences, Hawaii, 2004, IEEE Computer Society 34-47.
35. Oliver, J. A Machine-Learning Approach to Automated Negotiation and Prospects for Electronic Commerce. Journal of Management Information Systems, 13, 3, (1997), 83 - 112.
36. Porter, M.E., Competitive strategy : techniques for analyzing industries and competitors. 1980, The Free Press: New York. 396.
37. Quinn, N., and Breuer, M. A force directed component placement procedure fro printed circuit boards. IEEE Transaction on Circuits Systems, 26, 6, (1979), 377-388.
Actor-issue analysis
Page 33 of 33
38. Raiffa, H. Negotiation Analysis: The Science and Art of Collaborative Decision Making. The Belknap Press of Harvard University Press, 2002.
39. Salo, A.; Gustafsson, T.; and Ramanathan, R. Multicriteria methods for technology foresight. Journal of Forecasting, 22, 2-3, (2003), 235-256.
40. Schneider, V.; Nguyen, G.; and Werle, R. Corporate actor networks in European policy making: harmonizing telecommunications policy. Journal of Common Market Studies, 32, (1994), 473-498.
41. Skupin, A., and Fabrikant, S.I. Spatialization methods: a cartographic research agenda for non-geographic information visualization. Cartography and Geographic Information Science, 30, 2, (2003), 95-115.
42. Spence, R. Information Visualization. Harlow: Addison-Wesley, 2001.
43. Starke, K., and Rangaswamy, A. Computer-mediated negotiations: review and research opportunities, Encyclopedia of Microcomputers, Vol. 26, New York: Marcel Inc, 1999.
44. Stockman, F., and Van Oosten, R. The Exchange of Voting Positions: an Object-Oriented Model of Policy Networks, European Community decision making models, applications and comparisons, Yale University Press, 1994, 105-128.
45. Swaab, R.; Postmes, T.; Neijens, P.; Kiers, M.H.; and Dumay, A.C.M. Multiparty negotiation support: the role of visualization's influence on the development of shared mental models. Journal of management Information Systems, 19, 1, (2002), 129-150.
46. Tarasewich, P.; Nickerson, R.; and Warkentin, M., Issues in Mobile eCommerce, in Communications of the AIS. 2002, 41-64.
47. Tegarden, D. Business information visualization. Communications of AIS, 1, 4, (1999),
48. Tufte, E. The Visual Display of Quantitative Information. 2nd ed., Cheshire: Graphics Press, 2001.
49. van Assen, M.; Stockman, F.; and Van Oosten, R. Conflict measures in cooperative exchange models of collective decision-making. Rationality and Society, 15, 1, (2003), 85-112.
50. Van Der Heijden, K. Scenarios: The Art of strategic Conversation. Wiley John and Sons, 1996.
51. Wattenberg, M. Visualizing the stock market. CHI'99, (1999), 188-189.
52. Yuan, Y., and Turel, O. A business model for e-negotiation in electronic commerce, INR 02/04, (2004).


![[Exercise Name] Actor Briefing [Date] Actor Briefing [Date]](https://img.pdfslide.us/doc/110x75/56649e615503460f94b5bd60/exercise-name-actor-briefing-date-actor-briefing-date.jpg)
![ACTOR ACTOR INTER- ACTION [AAI] - uffmm.org](https://img.pdfslide.us/doc/110x75/61dae413692c315fa73c1fc3/actor-actor-inter-action-aai-uffmmorg.jpg)