Embed Size (px)
Citation preview
Negotiated Salary Trial Program Annual Report for Year Two (July 2014 - June 2015)
Executive Summary
In June 2013, UC Provost and Executive Vice President Aimée Dorr approved a five-year general campus Negotiated Salary Trial Program (NSTP) on three campuses: UC Irvine, UC Los Angeles and UC San Diego. This report presents data on faculty participation from each campus as well as data on use and effectiveness of the program over the past two years. Data presented in this and subsequent annual reports, as well as a comprehensive report in the program’s fourth year, will be used to assess the program’s efficacy.
In its second year, 225 faculty enrolled in NSTP. This represents an increase of 71 faculty over the previous year. The negotiated salary component for these 225 faculty members was $6.7M in negotiated salary or $3M higher than the 2013-14 program which enrolled 154 faculty. As in the prior year, the program was most heavily used by faculty in engineering (102), biological sciences (25), public health (22), and physical sciences (21). There was representation from a wide range of disciplines, including arts, education, marine sciences and social sciences. After the first two years, teaching data demonstrate that teaching loads are not negatively affected by faculty participation in the program.
Comparing the 2014-15 faculty survey data to the prior year’s survey data, the results were essentially unchanged. For example, in both years, more than 90% of participants in the program agreed with the statement that NSTP was an “asset to the university.” The top five reasons for participating in the program were the same in each of the first two years: 1) “to bring my salary up to market rates,” 2) “to augment my salary,” 3) “to allow me to spend more time on my University research,” 4) “to allow me to reduce outside consulting as an income strategy,” and 5) “to make it possible for me to turn down an outside offer.” While participant support has been consistent over the last two years, administrative support for the program has increased. For example, administrators and academic staff responded more positively to these statements: 1) “the program is an asset,” 2) “the program’s benefits outweighed the administrative burden,” and 3) “the program was a valuable tool during recruitment.”
I. Background
In February 2013, following consultation with the Academic Senate and the Council of Vice Chancellors (COVC), UC Provost and Executive Vice President Aimée Dorr approved a five-year general campus NSTP on three campuses (UC Irvine, UC Los Angeles, and UC San Diego1). In addition, she created a joint Senate-Administration Taskforce, charged with designing metrics for evaluating the program’s effectiveness.
1 UC San Diego calls its campus program the General Campus Compensation Program, GCCP. This document will refer to all three campus programs as “NSTP.”
Annual Report for Year Two (July 2014 – June 2015) NSTP
UCOP Academic Personnel and Programs, December 11, 2015 page 2
In June 2013, the provost approved the Taskforce recommendations and the NSTP became operational on July 1, 2013. The basic documents for the systemwide program are appended; in addition, each campus has its own implementation document based closely on the systemwide template (see appendices for the basic program document [Appendix A], the goals and quantitative and qualitative metrics [Appendix B], and a memo clarifying the metrics [Appendix C]).
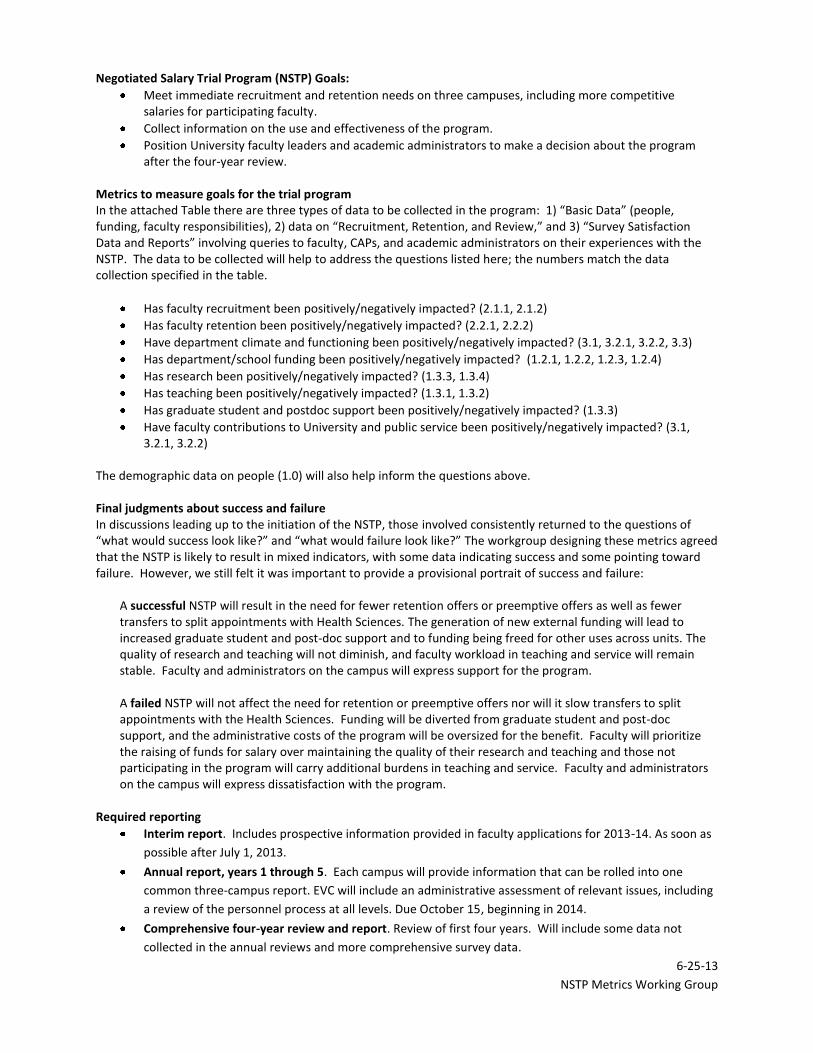
NSTP Goals. Three program goals outlined by the Taskforce guided the compilation of this report:
• Meet immediate recruitment and retention needs on three campuses, including more competitive salaries for participating faculty.
• Collect information on the use and effectiveness of the program.
• Position University faculty leaders and academic administrators to make a decision about continuing the program after the fourth year review.
Metrics and required reporting. As outlined by the Taskforce, three types of data are now collected to allow adequate review of the program: 1) basic data (people, funding, faculty responsibilities), 2) data on recruitment, retention, and review, and 3) survey data involving queries to faculty and academic administrators on their level of satisfaction with the NSTP.
In the course of the trial, there will be an annual report in years one through five, including—in year four—a comprehensive report on the first four years of the trial. While year one reporting included both an interim and an annual report, this second year report includes all elements of those two reports in a single report.
II. Faculty Participation and Demographics, 2014-15
This “Faculty Participation and Demographics” section of the report provides the following data as outlined by the Taskforce in June 2013 (Appendix B):
1.1.1. Those who participated and who did not. Divisions/schools/colleges participating: number and percentage of total campus.
1.1.2. Those who participated and who did not. Departments participating: number and percentages of total campus.
1.1.3. Those who participated and who did not. Faculty in participating departments, including both those who did and did not enroll: number and percentage of total campus.
1.1.4. Gender and race/ethnicity of faculty in participating units.
1.1.5. Rank of faculty in participating units.
1.1.6. Salary, including scale rate, above scale rate, off-scale, summer-ninths, negotiated amount, and stipends (note that summer-ninths and stipends are addressed in section V).
Annual Report for Year Two (July 2014 – June 2015) NSTP
UCOP Academic Personnel and Programs, December 11, 2015 page 3
Each campus continues to participate according to its individual implementation guidelines, previously approved by the UC Provost. Each campus also has determined which schools/colleges are eligible to participate: while UC Irvine and UC San Diego opened the program to all non-HSCP (Health Science Compensation Plan) schools in both years, in the first year UC Los Angeles limited its participation to two divisions/schools (life sciences and public health). Subsequently for 2014-15, UC Los Angeles has added two additional divisions/schools (engineering and physical sciences) for a total of four divisions/schools.
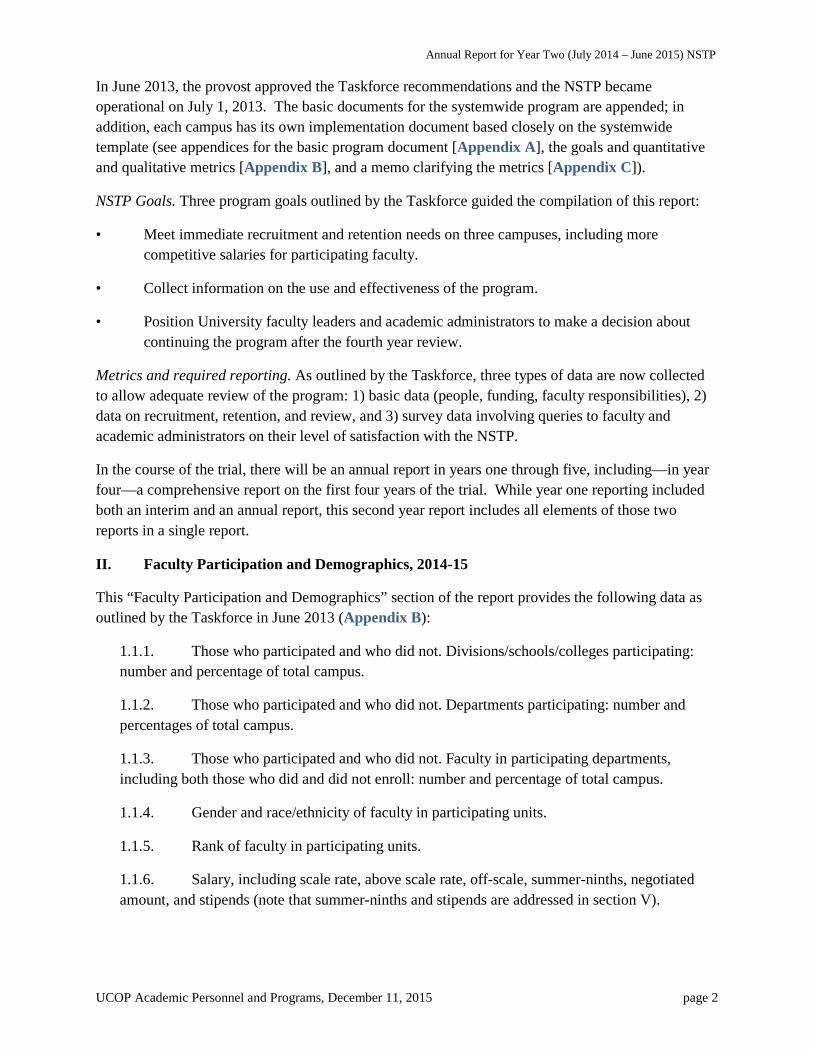
Figure 1 provides detail on the division/school/college NSTP participation. Over the previous year, an additional three new divisions/colleges/schools with 15 new departments participated, resulting in an increase of 71 participants; participants totaled 154 in 2013-14 and 225 in 2014-15. Of the 225, 104 were newly enrolled participants. Seventy-nine percent of faculty participants from 2013-14 (121 of 154) continued in 2014-15.
It is important to note that the faculty in schools where the HSCP is used or available are not eligible to participate in the NSTP. Schools excluded from the trial program are medicine at UC Irvine; medicine and dentistry at UC Los Angeles; and medicine and pharmacy at UC San Diego. While both UC Irvine and UC Los Angeles have participating units titled “public health,” neither is participating in the HSCP.
Figure 1 Campus Participation in NSTP by Divisions/Schools/Colleges and Department
2014-15 with Differences from 2013-14 Program
Note: Participating campus Divisions/Schools/Colleges include the following (totals exclude Health Sciences):
UC Irvine - Biological Sciences, Education, Engineering, Information and Computer Sciences, Physical Sciences, Public Health, Social Ecology, Social Sciences. UC Los Angeles - Engineering, Life Sciences, Physical Sciences, Public Health. UC San Diego - Arts and Humanities, Biological Sciences, Engineering, International Relations/Pacific Studies, Marine Sciences, Physical Sciences, Rady School of Management, Social Sciences. At UC San Diego, the Division of Biology was considered a division and department in 2013-14. Although there are now four departments within the division they will be aggregated under the label "Biological Sciences" for comparison purposes.
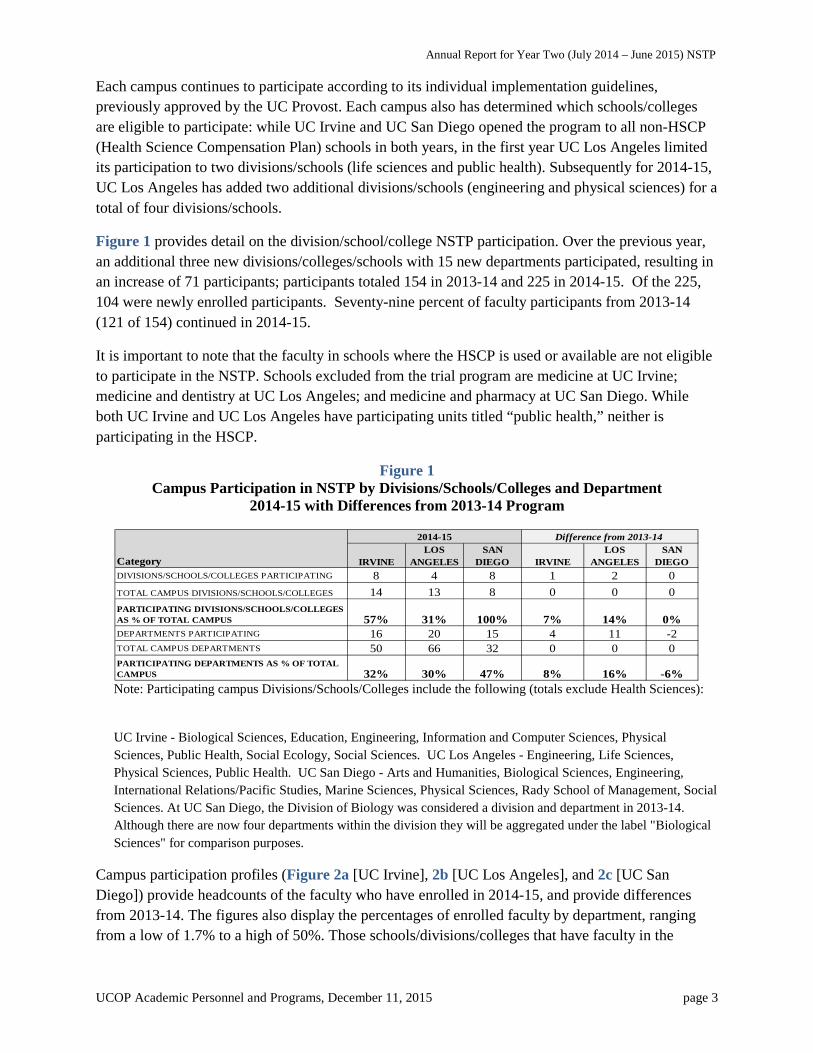
Campus participation profiles (Figure 2a [UC Irvine], 2b [UC Los Angeles], and 2c [UC San Diego]) provide headcounts of the faculty who have enrolled in 2014-15, and provide differences from 2013-14. The figures also display the percentages of enrolled faculty by department, ranging from a low of 1.7% to a high of 50%. Those schools/divisions/colleges that have faculty in the
IRVINELOS
ANGELESSAN
DIEGO IRVINELOS
ANGELESSAN
DIEGODIVISIONS/SCHOOLS/COLLEGES PARTICIPATING 8 4 8 1 2 0TOTAL CAMPUS DIVISIONS/SCHOOLS/COLLEGES 14 13 8 0 0 0PARTICIPATING DIVISIONS/SCHOOLS/COLLEGES AS % OF TOTAL CAMPUS 57% 31% 100% 7% 14% 0%DEPARTMENTS PARTICIPATING 16 20 15 4 11 -2TOTAL CAMPUS DEPARTMENTS 50 66 32 0 0 0PARTICIPATING DEPARTMENTS AS % OF TOTAL CAMPUS 32% 30% 47% 8% 16% -6%
Difference from 2013-14
Category
2014-15
Annual Report for Year Two (July 2014 – June 2015) NSTP
UCOP Academic Personnel and Programs, December 11, 2015 page 4
program are termed “participating” units; those individual faculty who are receiving negotiated salaries are termed “enrolled” faculty. Of those 225 faculty enrolled, 100 (44%) are at UC San Diego. All but three faculty members, on all campuses, are on academic year (9-month) appointments.
Figure 2a Headcount of Enrolled Faculty by Divisions/Schools/Colleges and Department
UC Irvine 2014-15 with Differences from 2013-14 Program
*The Public Health program is not yet officially a school at UC Irvine, but is listed separately for this report.
Figure 2b Headcount of Enrolled Faculty by Divisions/Schools/Colleges and Department
UC Los Angeles 2014-15 with Differences from 2013-14 Program
CAMPUS SCHOOL/DIVISION/COLLEGE DEPARTMENT NAMEHeadcount of Enrolled
Faculty % of Total
Total Department
Faculty
Enrolled Faculty/Total Department
FacultyHeadcount of
Enrolled Faculty
Irvine BIOLOGICAL SCIENCES DEVELOPMENTAL & CELL BIOLOGY 5 11.1% 21 23.8% 2ECOLOGY & EVOLUTIONARY BIOLOGY 1 2.2% 32 3.1% -2NEUROBIOLOGY & BEHAVIOR 6 13.3% 20 30.0% 2
EDUCATION EDUCATION 1 2.2% 22 4.5% n.a.ENGINEERING BIOMEDICAL ENGINEERING 2 4.4% 16 12.5% n.a.
ELECTRICAL ENGR & COMPUTER SCI 4 8.9% 32 12.5% 0MECHANICAL & AEROSPACE ENGR 2 4.4% 23 8.7% n.a.
INFORMATION AND COMPUTER SCIENCE COMPUTER SCIENCE 8 17.8% 36 22.2% -1PHYSICAL SCIENCES CHEMISTRY 2 4.4% 39 5.1% 0
EARTH SYSTEM SCIENCE 1 2.2% 21 4.8% n.a.MATHEMATICS 3 6.7% 33 9.1% 0PHYSICS AND ASTRONOMY 3 6.7% 39 7.7% 0
PUBLIC HEALTH* PUBLIC HEALTH 3 6.7% 13 23.1% 1SOCIAL ECOLOGY CRIMINOLOGY, LAW & SOCIETY 1 2.2% 18 5.6% -1
PSYCHOLOGY & SOCIAL BEHAVIOR 1 2.2% 22 4.5% 0SOCIAL SCIENCES COGNITIVE SCIENCES 2 4.4% 25 8.0% 0
Total 45 100.0% 412
Difference from 2013-142014-15
CAMPUS SCHOOL/DIVISION/COLLEGE DEPARTMENT NAMEHeadcount of Enrolled
Faculty% of Total
Total Department
Faculty
Enrolled Faculty/Total
Department Faculty
Headcount of Enrolled Faculty
Los Angeles ENGINEERING BIOENGINEERING 2 2.5% 10 20.0% n.a.CHEM & BIOMOLECULAR ENGR 5 6.3% 12 41.7% n.a.CIVIL & ENVRNTL ENGR 2 2.5% 17 11.8% n.a.COMPUTER SCIENCE 9 11.3% 28 32.1% n.a.ELECT ENGR 16 20.0% 42 38.1% n.a.MATERIALS SCI & ENGR 1 1.3% 14 7.1% n.a.MECH & AEROSPACE ENGR 9 11.3% 33 27.3% n.a.
LIFE SCIENCES INTEGRATIVE BIOLOGY & PHYSIOLOGY 3 3.8% 16 18.8% 0MOLECULAR CELL & DEVELOP BIO 3 3.8% 22 13.6% 0PSYCHOLOGY 7 8.8% 58 12.1% 2
PHYSICAL SCIENCES CHEM & BIOCHEMISTRY 1 1.3% 47 2.1% n.a.EARTH PLANET & SPACE SCI 1 1.3% 26 3.8% n.a.PHYSICS AND ASTRONOMY 1 1.3% 59 1.7% n.a.STATISTICS 1 1.3% 58 1.7% n.a.
PUBLIC HEALTH BIOSTATISTICS 6 7.5% 12 50.0% -2COMMUNITY HEALTH SCIENCES 2 2.5% 15 13.3% 0CTR OCCUPATIONAL & ENVRNTL HLTH 1 1.3% 4 25.0% -2ENVIRONMENTAL HEALTH SCIENCE 2 2.5% 7 28.6% 1EPIDEMIOLOGY 4 5.0% 8 50.0% -2HEALTH POLICY & MGT 4 5.0% 14 28.6% 1
Total 80 100.0% 502
2014-15Difference from
2013-14
Annual Report for Year Two (July 2014 – June 2015) NSTP
UCOP Academic Personnel and Programs, December 11, 2015 page 5
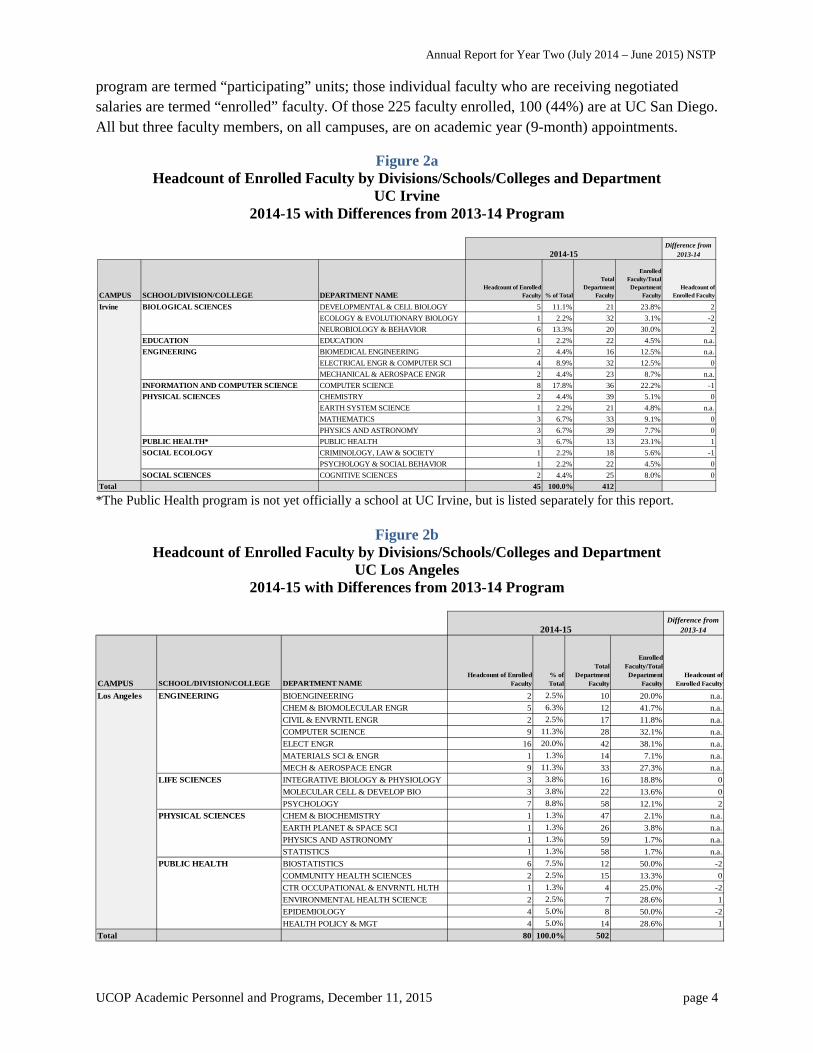
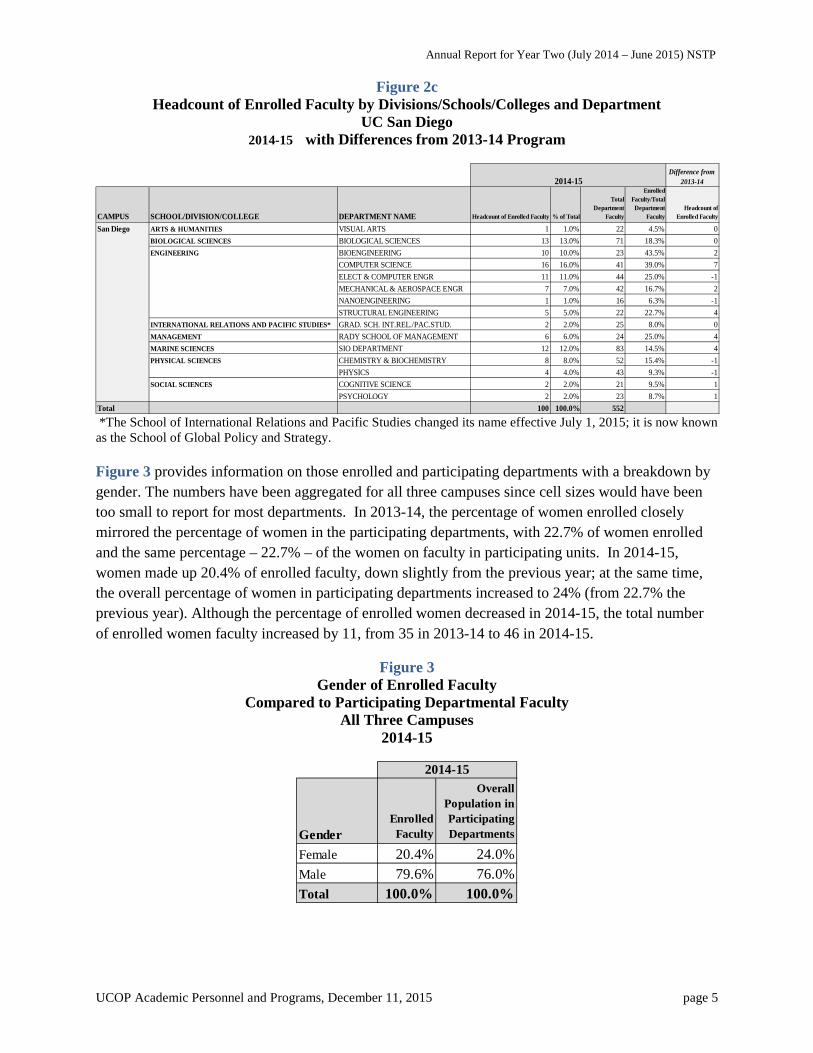
Figure 2c Headcount of Enrolled Faculty by Divisions/Schools/Colleges and Department
UC San Diego 2014-15 with Differences from 2013-14 Program
*The School of International Relations and Pacific Studies changed its name effective July 1, 2015; it is now known as the School of Global Policy and Strategy. Figure 3 provides information on those enrolled and participating departments with a breakdown by gender. The numbers have been aggregated for all three campuses since cell sizes would have been too small to report for most departments. In 2013-14, the percentage of women enrolled closely mirrored the percentage of women in the participating departments, with 22.7% of women enrolled and the same percentage – 22.7% – of the women on faculty in participating units. In 2014-15, women made up 20.4% of enrolled faculty, down slightly from the previous year; at the same time, the overall percentage of women in participating departments increased to 24% (from 22.7% the previous year). Although the percentage of enrolled women decreased in 2014-15, the total number of enrolled women faculty increased by 11, from 35 in 2013-14 to 46 in 2014-15.
Figure 3 Gender of Enrolled Faculty
Compared to Participating Departmental Faculty All Three Campuses
2014-15
CAMPUS SCHOOL/DIVISION/COLLEGE DEPARTMENT NAME Headcount of Enrolled Faculty % of Total
Total Department
Faculty
Enrolled Faculty/Total Department
FacultyHeadcount of
Enrolled Faculty
San Diego ARTS & HUMANITIES VISUAL ARTS 1 1.0% 22 4.5% 0BIOLOGICAL SCIENCES BIOLOGICAL SCIENCES 13 13.0% 71 18.3% 0ENGINEERING BIOENGINEERING 10 10.0% 23 43.5% 2
COMPUTER SCIENCE 16 16.0% 41 39.0% 7ELECT & COMPUTER ENGR 11 11.0% 44 25.0% -1MECHANICAL & AEROSPACE ENGR 7 7.0% 42 16.7% 2NANOENGINEERING 1 1.0% 16 6.3% -1STRUCTURAL ENGINEERING 5 5.0% 22 22.7% 4
INTERNATIONAL RELATIONS AND PACIFIC STUDIES* GRAD. SCH. INT.REL./PAC.STUD. 2 2.0% 25 8.0% 0MANAGEMENT RADY SCHOOL OF MANAGEMENT 6 6.0% 24 25.0% 4MARINE SCIENCES SIO DEPARTMENT 12 12.0% 83 14.5% 4PHYSICAL SCIENCES CHEMISTRY & BIOCHEMISTRY 8 8.0% 52 15.4% -1
PHYSICS 4 4.0% 43 9.3% -1SOCIAL SCIENCES COGNITIVE SCIENCE 2 2.0% 21 9.5% 1
PSYCHOLOGY 2 2.0% 23 8.7% 1Total 100 100.0% 552
2014-15Difference from
2013-14
GenderEnrolled
Faculty
Overall Population in Participating Departments
Female 20.4% 24.0%Male 79.6% 76.0%Total 100.0% 100.0%
2014-15
Annual Report for Year Two (July 2014 – June 2015) NSTP
UCOP Academic Personnel and Programs, December 11, 2015 page 6
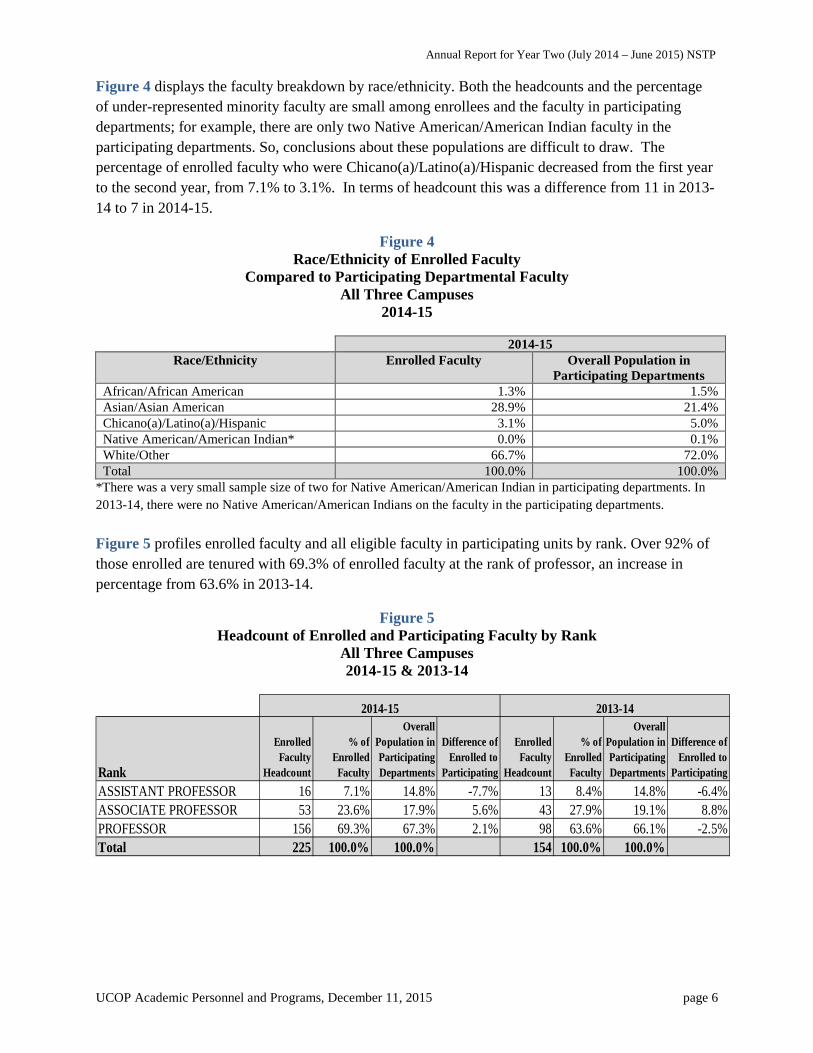
Figure 4 displays the faculty breakdown by race/ethnicity. Both the headcounts and the percentage of under-represented minority faculty are small among enrollees and the faculty in participating departments; for example, there are only two Native American/American Indian faculty in the participating departments. So, conclusions about these populations are difficult to draw. The percentage of enrolled faculty who were Chicano(a)/Latino(a)/Hispanic decreased from the first year to the second year, from 7.1% to 3.1%. In terms of headcount this was a difference from 11 in 2013-14 to 7 in 2014-15.
Figure 4 Race/Ethnicity of Enrolled Faculty
Compared to Participating Departmental Faculty All Three Campuses
2014-15
2014-15 Race/Ethnicity Enrolled Faculty Overall Population in
Participating Departments African/African American 1.3% 1.5% Asian/Asian American 28.9% 21.4% Chicano(a)/Latino(a)/Hispanic 3.1% 5.0% Native American/American Indian* 0.0% 0.1% White/Other 66.7% 72.0% Total 100.0% 100.0%
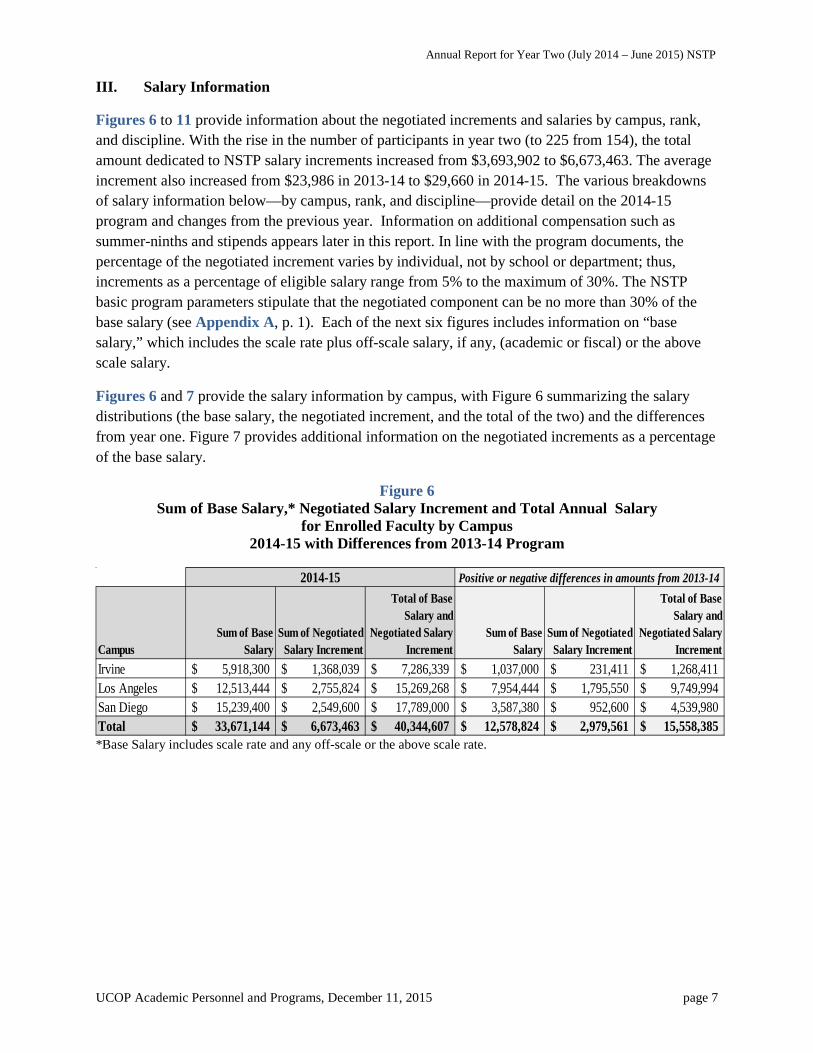
*There was a very small sample size of two for Native American/American Indian in participating departments. In 2013-14, there were no Native American/American Indians on the faculty in the participating departments. Figure 5 profiles enrolled faculty and all eligible faculty in participating units by rank. Over 92% of those enrolled are tenured with 69.3% of enrolled faculty at the rank of professor, an increase in percentage from 63.6% in 2013-14.
Figure 5 Headcount of Enrolled and Participating Faculty by Rank
All Three Campuses 2014-15 & 2013-14
Rank
Enrolled Faculty
Headcount
% of Enrolled
Faculty
Overall Population in Participating Departments
Difference of Enrolled to
Participating
Enrolled Faculty
Headcount
% of Enrolled
Faculty
Overall Population in Participating Departments
Difference of Enrolled to
ParticipatingASSISTANT PROFESSOR 16 7.1% 14.8% -7.7% 13 8.4% 14.8% -6.4%ASSOCIATE PROFESSOR 53 23.6% 17.9% 5.6% 43 27.9% 19.1% 8.8%PROFESSOR 156 69.3% 67.3% 2.1% 98 63.6% 66.1% -2.5%Total 225 100.0% 100.0% 154 100.0% 100.0%
2014-15 2013-14
Annual Report for Year Two (July 2014 – June 2015) NSTP
UCOP Academic Personnel and Programs, December 11, 2015 page 7
III. Salary Information
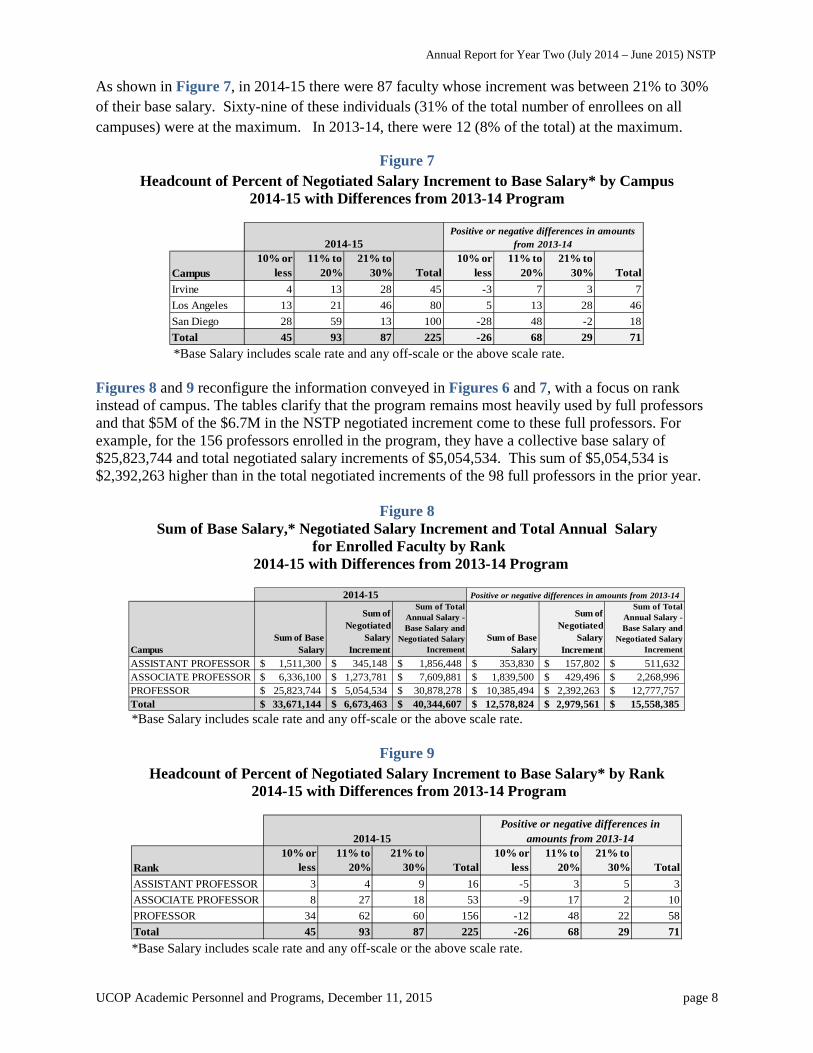
Figures 6 to 11 provide information about the negotiated increments and salaries by campus, rank, and discipline. With the rise in the number of participants in year two (to 225 from 154), the total amount dedicated to NSTP salary increments increased from $3,693,902 to $6,673,463. The average increment also increased from $23,986 in 2013-14 to $29,660 in 2014-15. The various breakdowns of salary information below—by campus, rank, and discipline—provide detail on the 2014-15 program and changes from the previous year. Information on additional compensation such as summer-ninths and stipends appears later in this report. In line with the program documents, the percentage of the negotiated increment varies by individual, not by school or department; thus, increments as a percentage of eligible salary range from 5% to the maximum of 30%. The NSTP basic program parameters stipulate that the negotiated component can be no more than 30% of the base salary (see Appendix A, p. 1). Each of the next six figures includes information on “base salary,” which includes the scale rate plus off-scale salary, if any, (academic or fiscal) or the above scale salary.
Figures 6 and 7 provide the salary information by campus, with Figure 6 summarizing the salary distributions (the base salary, the negotiated increment, and the total of the two) and the differences from year one. Figure 7 provides additional information on the negotiated increments as a percentage of the base salary.
Figure 6 Sum of Base Salary,* Negotiated Salary Increment and Total Annual Salary
for Enrolled Faculty by Campus 2014-15 with Differences from 2013-14 Program
*Base Salary includes scale rate and any off-scale or the above scale rate.
CampusSum of Base
SalarySum of Negotiated
Salary Increment
Total of Base Salary and
Negotiated Salary Increment
Sum of Base Salary
Sum of Negotiated Salary Increment
Total of Base Salary and
Negotiated Salary Increment
Irvine 5,918,300$ 1,368,039$ 7,286,339$ 1,037,000$ 231,411$ 1,268,411$ Los Angeles 12,513,444$ 2,755,824$ 15,269,268$ 7,954,444$ 1,795,550$ 9,749,994$ San Diego 15,239,400$ 2,549,600$ 17,789,000$ 3,587,380$ 952,600$ 4,539,980$ Total 33,671,144$ 6,673,463$ 40,344,607$ 12,578,824$ 2,979,561$ 15,558,385$
Positive or negative differences in amounts from 2013-142014-15
Annual Report for Year Two (July 2014 – June 2015) NSTP
UCOP Academic Personnel and Programs, December 11, 2015 page 8
As shown in Figure 7, in 2014-15 there were 87 faculty whose increment was between 21% to 30% of their base salary. Sixty-nine of these individuals (31% of the total number of enrollees on all campuses) were at the maximum. In 2013-14, there were 12 (8% of the total) at the maximum.
Figure 7 Headcount of Percent of Negotiated Salary Increment to Base Salary* by Campus
2014-15 with Differences from 2013-14 Program
*Base Salary includes scale rate and any off-scale or the above scale rate.
Figures 8 and 9 reconfigure the information conveyed in Figures 6 and 7, with a focus on rank instead of campus. The tables clarify that the program remains most heavily used by full professors and that $5M of the $6.7M in the NSTP negotiated increment come to these full professors. For example, for the 156 professors enrolled in the program, they have a collective base salary of $25,823,744 and total negotiated salary increments of $5,054,534. This sum of $5,054,534 is $2,392,263 higher than in the total negotiated increments of the 98 full professors in the prior year.
Figure 8 Sum of Base Salary,* Negotiated Salary Increment and Total Annual Salary
for Enrolled Faculty by Rank 2014-15 with Differences from 2013-14 Program
*Base Salary includes scale rate and any off-scale or the above scale rate.
Figure 9
Headcount of Percent of Negotiated Salary Increment to Base Salary* by Rank 2014-15 with Differences from 2013-14 Program
*Base Salary includes scale rate and any off-scale or the above scale rate.
Campus10% or
less11% to
20% 21% to
30% Total10% or
less11% to
20% 21% to
30% TotalIrvine 4 13 28 45 -3 7 3 7Los Angeles 13 21 46 80 5 13 28 46San Diego 28 59 13 100 -28 48 -2 18Total 45 93 87 225 -26 68 29 71
2014-15Positive or negative differences in amounts
from 2013-14
CampusSum of Base
Salary
Sum of Negotiated
Salary Increment
Sum of Total Annual Salary - Base Salary and
Negotiated Salary Increment
Sum of Base Salary
Sum of Negotiated
Salary Increment
Sum of Total Annual Salary - Base Salary and
Negotiated Salary Increment
ASSISTANT PROFESSOR 1,511,300$ 345,148$ 1,856,448$ 353,830$ 157,802$ 511,632$ ASSOCIATE PROFESSOR 6,336,100$ 1,273,781$ 7,609,881$ 1,839,500$ 429,496$ 2,268,996$ PROFESSOR 25,823,744$ 5,054,534$ 30,878,278$ 10,385,494$ 2,392,263$ 12,777,757$ Total 33,671,144$ 6,673,463$ 40,344,607$ 12,578,824$ 2,979,561$ 15,558,385$
2014-15 Positive or negative differences in amounts from 2013-14
Rank10% or
less11% to
20% 21% to
30% Total10% or
less11% to
20% 21% to
30% TotalASSISTANT PROFESSOR 3 4 9 16 -5 3 5 3ASSOCIATE PROFESSOR 8 27 18 53 -9 17 2 10PROFESSOR 34 62 60 156 -12 48 22 58Total 45 93 87 225 -26 68 29 71
2014-15Positive or negative differences in
amounts from 2013-14
Annual Report for Year Two (July 2014 – June 2015) NSTP
UCOP Academic Personnel and Programs, December 11, 2015 page 9
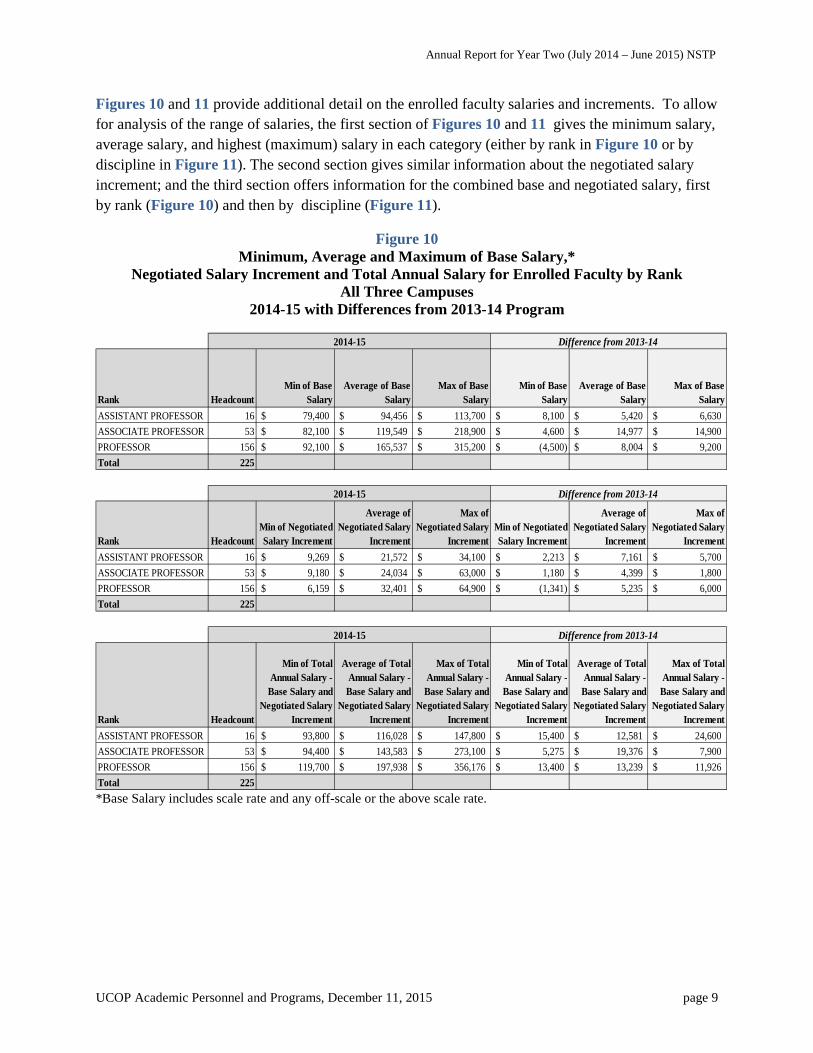
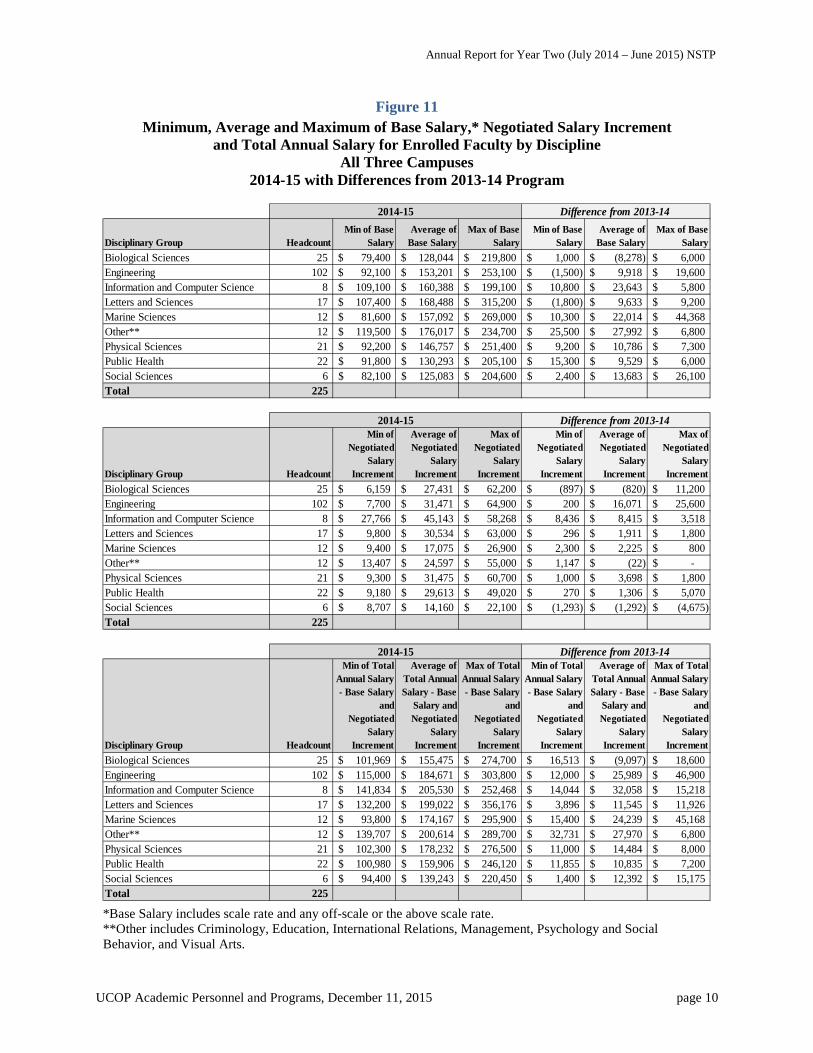
Figures 10 and 11 provide additional detail on the enrolled faculty salaries and increments. To allow for analysis of the range of salaries, the first section of Figures 10 and 11 gives the minimum salary, average salary, and highest (maximum) salary in each category (either by rank in Figure 10 or by discipline in Figure 11). The second section gives similar information about the negotiated salary increment; and the third section offers information for the combined base and negotiated salary, first by rank (Figure 10) and then by discipline (Figure 11).
Figure 10 Minimum, Average and Maximum of Base Salary,*
Negotiated Salary Increment and Total Annual Salary for Enrolled Faculty by Rank All Three Campuses
2014-15 with Differences from 2013-14 Program
*Base Salary includes scale rate and any off-scale or the above scale rate.
Rank HeadcountMin of Base
SalaryAverage of Base
SalaryMax of Base
SalaryMin of Base
SalaryAverage of Base
SalaryMax of Base
SalaryASSISTANT PROFESSOR 16 79,400$ 94,456$ 113,700$ 8,100$ 5,420$ 6,630$ ASSOCIATE PROFESSOR 53 82,100$ 119,549$ 218,900$ 4,600$ 14,977$ 14,900$ PROFESSOR 156 92,100$ 165,537$ 315,200$ (4,500)$ 8,004$ 9,200$ Total 225
Rank HeadcountMin of Negotiated Salary Increment
Average of Negotiated Salary
Increment
Max of Negotiated Salary
IncrementMin of Negotiated Salary Increment
Average of Negotiated Salary
Increment
Max of Negotiated Salary
IncrementASSISTANT PROFESSOR 16 9,269$ 21,572$ 34,100$ 2,213$ 7,161$ 5,700$ ASSOCIATE PROFESSOR 53 9,180$ 24,034$ 63,000$ 1,180$ 4,399$ 1,800$ PROFESSOR 156 6,159$ 32,401$ 64,900$ (1,341)$ 5,235$ 6,000$ Total 225
Rank Headcount
Min of Total Annual Salary -
Base Salary and Negotiated Salary
Increment
Average of Total Annual Salary -
Base Salary and Negotiated Salary
Increment
Max of Total Annual Salary -
Base Salary and Negotiated Salary
Increment
Min of Total Annual Salary -
Base Salary and Negotiated Salary
Increment
Average of Total Annual Salary -
Base Salary and Negotiated Salary
Increment
Max of Total Annual Salary -
Base Salary and Negotiated Salary
IncrementASSISTANT PROFESSOR 16 93,800$ 116,028$ 147,800$ 15,400$ 12,581$ 24,600$ ASSOCIATE PROFESSOR 53 94,400$ 143,583$ 273,100$ 5,275$ 19,376$ 7,900$ PROFESSOR 156 119,700$ 197,938$ 356,176$ 13,400$ 13,239$ 11,926$ Total 225
2014-15 Difference from 2013-14
Difference from 2013-142014-15
Difference from 2013-142014-15
Annual Report for Year Two (July 2014 – June 2015) NSTP
UCOP Academic Personnel and Programs, December 11, 2015 page 10
Figure 11
Minimum, Average and Maximum of Base Salary,* Negotiated Salary Increment and Total Annual Salary for Enrolled Faculty by Discipline
All Three Campuses 2014-15 with Differences from 2013-14 Program
*Base Salary includes scale rate and any off-scale or the above scale rate. **Other includes Criminology, Education, International Relations, Management, Psychology and Social Behavior, and Visual Arts.
Disciplinary Group HeadcountMin of Base
SalaryAverage of
Base SalaryMax of Base
SalaryMin of Base
SalaryAverage of
Base SalaryMax of Base
SalaryBiological Sciences 25 79,400$ 128,044$ 219,800$ 1,000$ (8,278)$ 6,000$ Engineering 102 92,100$ 153,201$ 253,100$ (1,500)$ 9,918$ 19,600$ Information and Computer Science 8 109,100$ 160,388$ 199,100$ 10,800$ 23,643$ 5,800$ Letters and Sciences 17 107,400$ 168,488$ 315,200$ (1,800)$ 9,633$ 9,200$ Marine Sciences 12 81,600$ 157,092$ 269,000$ 10,300$ 22,014$ 44,368$ Other** 12 119,500$ 176,017$ 234,700$ 25,500$ 27,992$ 6,800$ Physical Sciences 21 92,200$ 146,757$ 251,400$ 9,200$ 10,786$ 7,300$ Public Health 22 91,800$ 130,293$ 205,100$ 15,300$ 9,529$ 6,000$ Social Sciences 6 82,100$ 125,083$ 204,600$ 2,400$ 13,683$ 26,100$ Total 225
Disciplinary Group Headcount
Min of Negotiated
Salary Increment
Average of Negotiated
Salary Increment
Max of Negotiated
Salary Increment
Min of Negotiated
Salary Increment
Average of Negotiated
Salary Increment
Max of Negotiated
Salary Increment
Biological Sciences 25 6,159$ 27,431$ 62,200$ (897)$ (820)$ 11,200$ Engineering 102 7,700$ 31,471$ 64,900$ 200$ 16,071$ 25,600$ Information and Computer Science 8 27,766$ 45,143$ 58,268$ 8,436$ 8,415$ 3,518$ Letters and Sciences 17 9,800$ 30,534$ 63,000$ 296$ 1,911$ 1,800$ Marine Sciences 12 9,400$ 17,075$ 26,900$ 2,300$ 2,225$ 800$ Other** 12 13,407$ 24,597$ 55,000$ 1,147$ (22)$ -$ Physical Sciences 21 9,300$ 31,475$ 60,700$ 1,000$ 3,698$ 1,800$ Public Health 22 9,180$ 29,613$ 49,020$ 270$ 1,306$ 5,070$ Social Sciences 6 8,707$ 14,160$ 22,100$ (1,293)$ (1,292)$ (4,675)$ Total 225
Disciplinary Group Headcount
Min of Total Annual Salary - Base Salary
and Negotiated
Salary Increment
Average of Total Annual Salary - Base
Salary and Negotiated
Salary Increment
Max of Total Annual Salary - Base Salary
and Negotiated
Salary Increment
Min of Total Annual Salary - Base Salary
and Negotiated
Salary Increment
Average of Total Annual Salary - Base
Salary and Negotiated
Salary Increment
Max of Total Annual Salary - Base Salary
and Negotiated
Salary Increment
Biological Sciences 25 101,969$ 155,475$ 274,700$ 16,513$ (9,097)$ 18,600$ Engineering 102 115,000$ 184,671$ 303,800$ 12,000$ 25,989$ 46,900$ Information and Computer Science 8 141,834$ 205,530$ 252,468$ 14,044$ 32,058$ 15,218$ Letters and Sciences 17 132,200$ 199,022$ 356,176$ 3,896$ 11,545$ 11,926$ Marine Sciences 12 93,800$ 174,167$ 295,900$ 15,400$ 24,239$ 45,168$ Other** 12 139,707$ 200,614$ 289,700$ 32,731$ 27,970$ 6,800$ Physical Sciences 21 102,300$ 178,232$ 276,500$ 11,000$ 14,484$ 8,000$ Public Health 22 100,980$ 159,906$ 246,120$ 11,855$ 10,835$ 7,200$ Social Sciences 6 94,400$ 139,243$ 220,450$ 1,400$ 12,392$ 15,175$ Total 225
2014-15
2014-15
2014-15
Difference from 2013-14
Difference from 2013-14
Difference from 2013-14
Annual Report for Year Two (July 2014 – June 2015) NSTP
UCOP Academic Personnel and Programs, December 11, 2015 page 11
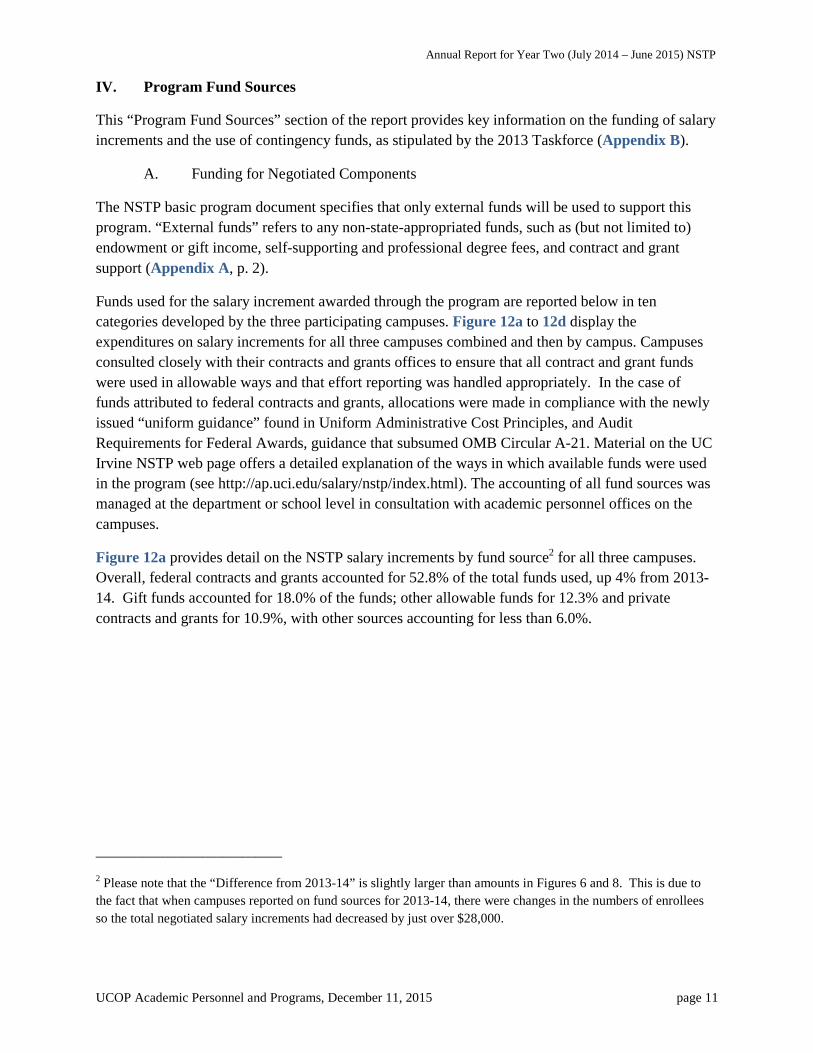
IV. Program Fund Sources
This “Program Fund Sources” section of the report provides key information on the funding of salary increments and the use of contingency funds, as stipulated by the 2013 Taskforce (Appendix B).
A. Funding for Negotiated Components
The NSTP basic program document specifies that only external funds will be used to support this program. “External funds” refers to any non-state-appropriated funds, such as (but not limited to) endowment or gift income, self-supporting and professional degree fees, and contract and grant support (Appendix A, p. 2).
Funds used for the salary increment awarded through the program are reported below in ten categories developed by the three participating campuses. Figure 12a to 12d display the expenditures on salary increments for all three campuses combined and then by campus. Campuses consulted closely with their contracts and grants offices to ensure that all contract and grant funds were used in allowable ways and that effort reporting was handled appropriately. In the case of funds attributed to federal contracts and grants, allocations were made in compliance with the newly issued “uniform guidance” found in Uniform Administrative Cost Principles, and Audit Requirements for Federal Awards, guidance that subsumed OMB Circular A-21. Material on the UC Irvine NSTP web page offers a detailed explanation of the ways in which available funds were used in the program (see http://ap.uci.edu/salary/nstp/index.html). The accounting of all fund sources was managed at the department or school level in consultation with academic personnel offices on the campuses.
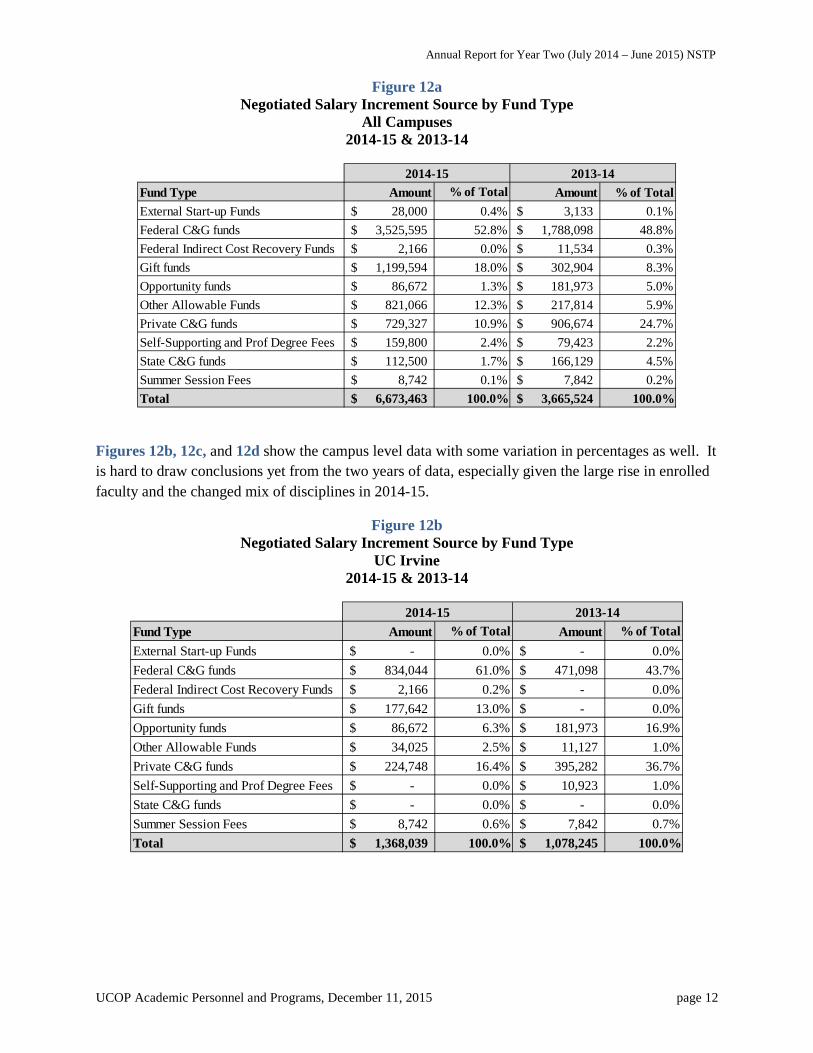
Figure 12a provides detail on the NSTP salary increments by fund source2 for all three campuses. Overall, federal contracts and grants accounted for 52.8% of the total funds used, up 4% from 2013-14. Gift funds accounted for 18.0% of the funds; other allowable funds for 12.3% and private contracts and grants for 10.9%, with other sources accounting for less than 6.0%.
____________________________
2 Please note that the “Difference from 2013-14” is slightly larger than amounts in Figures 6 and 8. This is due to the fact that when campuses reported on fund sources for 2013-14, there were changes in the numbers of enrollees so the total negotiated salary increments had decreased by just over $28,000.
Annual Report for Year Two (July 2014 – June 2015) NSTP
UCOP Academic Personnel and Programs, December 11, 2015 page 12
Figure 12a Negotiated Salary Increment Source by Fund Type
All Campuses 2014-15 & 2013-14
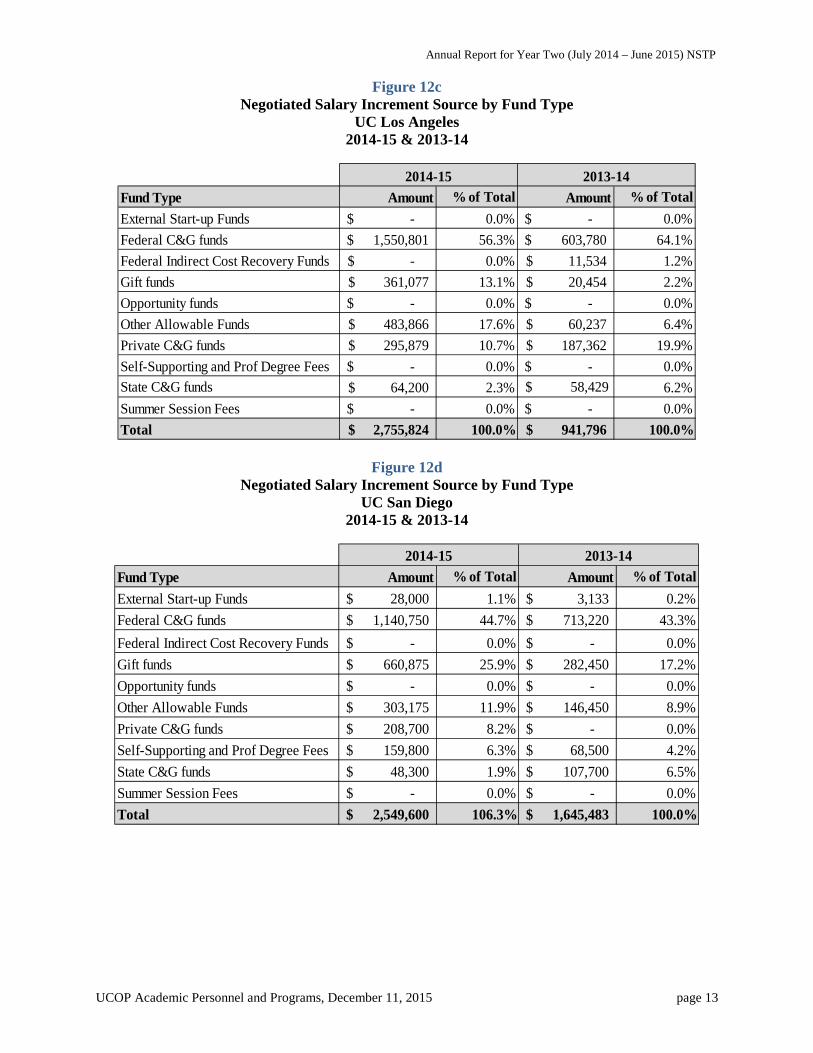
Figures 12b, 12c, and 12d show the campus level data with some variation in percentages as well. It is hard to draw conclusions yet from the two years of data, especially given the large rise in enrolled faculty and the changed mix of disciplines in 2014-15.
Figure 12b Negotiated Salary Increment Source by Fund Type
UC Irvine 2014-15 & 2013-14
Fund Type Amount % of Total Amount % of TotalExternal Start-up Funds 28,000$ 0.4% 3,133$ 0.1%Federal C&G funds 3,525,595$ 52.8% 1,788,098$ 48.8%Federal Indirect Cost Recovery Funds 2,166$ 0.0% 11,534$ 0.3%Gift funds 1,199,594$ 18.0% 302,904$ 8.3%Opportunity funds 86,672$ 1.3% 181,973$ 5.0%Other Allowable Funds 821,066$ 12.3% 217,814$ 5.9%Private C&G funds 729,327$ 10.9% 906,674$ 24.7%Self-Supporting and Prof Degree Fees 159,800$ 2.4% 79,423$ 2.2%State C&G funds 112,500$ 1.7% 166,129$ 4.5%Summer Session Fees 8,742$ 0.1% 7,842$ 0.2%Total 6,673,463$ 100.0% 3,665,524$ 100.0%
2013-142014-15
Fund Type Amount % of Total Amount % of TotalExternal Start-up Funds -$ 0.0% -$ 0.0%Federal C&G funds 834,044$ 61.0% 471,098$ 43.7%Federal Indirect Cost Recovery Funds 2,166$ 0.2% -$ 0.0%Gift funds 177,642$ 13.0% -$ 0.0%Opportunity funds 86,672$ 6.3% 181,973$ 16.9%Other Allowable Funds 34,025$ 2.5% 11,127$ 1.0%Private C&G funds 224,748$ 16.4% 395,282$ 36.7%Self-Supporting and Prof Degree Fees -$ 0.0% 10,923$ 1.0%State C&G funds -$ 0.0% -$ 0.0%Summer Session Fees 8,742$ 0.6% 7,842$ 0.7%Total 1,368,039$ 100.0% 1,078,245$ 100.0%
2014-15 2013-14
Annual Report for Year Two (July 2014 – June 2015) NSTP
UCOP Academic Personnel and Programs, December 11, 2015 page 13
Figure 12c Negotiated Salary Increment Source by Fund Type
UC Los Angeles 2014-15 & 2013-14
Figure 12d Negotiated Salary Increment Source by Fund Type
UC San Diego 2014-15 & 2013-14
Fund Type Amount % of Total Amount % of TotalExternal Start-up Funds -$ 0.0% -$ 0.0%Federal C&G funds 1,550,801$ 56.3% 603,780$ 64.1%Federal Indirect Cost Recovery Funds -$ 0.0% 11,534$ 1.2%Gift funds 361,077$ 13.1% 20,454$ 2.2%Opportunity funds -$ 0.0% -$ 0.0%Other Allowable Funds 483,866$ 17.6% 60,237$ 6.4%Private C&G funds 295,879$ 10.7% 187,362$ 19.9%Self-Supporting and Prof Degree Fees -$ 0.0% -$ 0.0%State C&G funds 64,200$ 2.3% $ 58,429 6.2%Summer Session Fees -$ 0.0% -$ 0.0%Total 2,755,824$ 100.0% 941,796$ 100.0%
2014-15 2013-14
Fund Type Amount % of Total Amount % of TotalExternal Start-up Funds 28,000$ 1.1% 3,133$ 0.2%Federal C&G funds 1,140,750$ 44.7% 713,220$ 43.3%Federal Indirect Cost Recovery Funds -$ 0.0% -$ 0.0%Gift funds 660,875$ 25.9% 282,450$ 17.2%Opportunity funds -$ 0.0% -$ 0.0%Other Allowable Funds 303,175$ 11.9% 146,450$ 8.9%Private C&G funds 208,700$ 8.2% -$ 0.0%Self-Supporting and Prof Degree Fees 159,800$ 6.3% 68,500$ 4.2%State C&G funds 48,300$ 1.9% 107,700$ 6.5%Summer Session Fees -$ 0.0% -$ 0.0%Total 2,549,600$ 106.3% 1,645,483$ 100.0%
2014-15 2013-14
Annual Report for Year Two (July 2014 – June 2015) NSTP
UCOP Academic Personnel and Programs, December 11, 2015 page 14
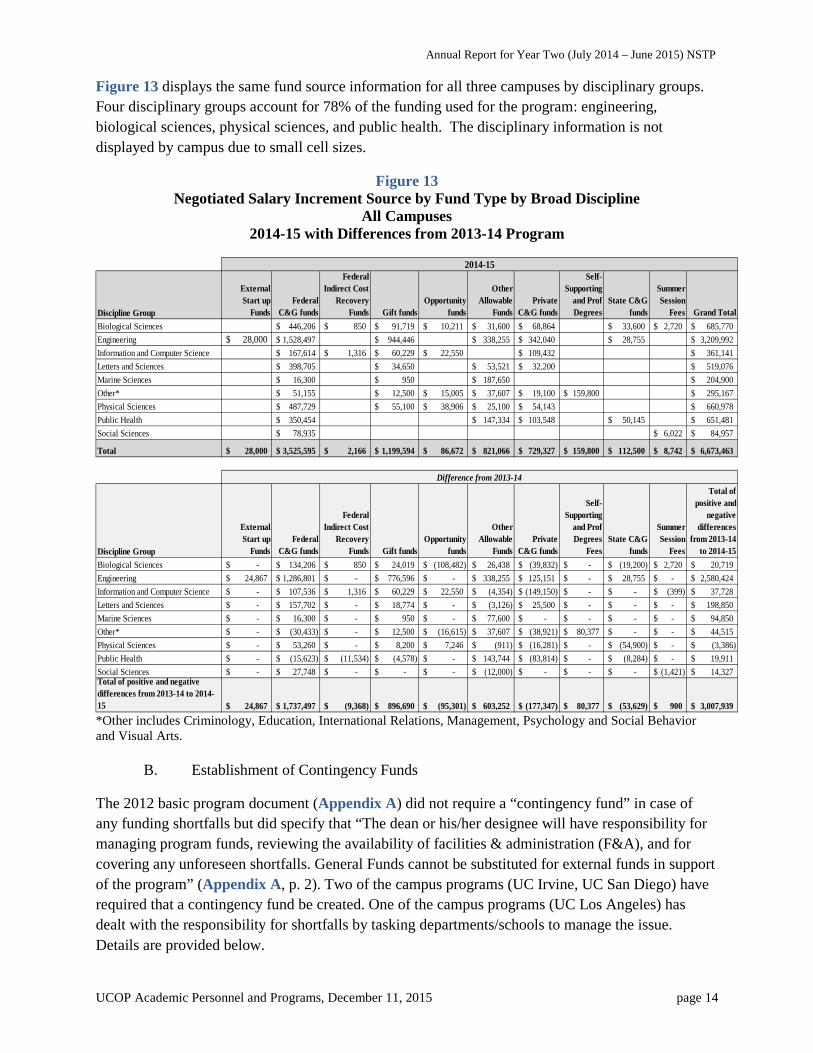
Figure 13 displays the same fund source information for all three campuses by disciplinary groups. Four disciplinary groups account for 78% of the funding used for the program: engineering, biological sciences, physical sciences, and public health. The disciplinary information is not displayed by campus due to small cell sizes.
Figure 13 Negotiated Salary Increment Source by Fund Type by Broad Discipline
All Campuses 2014-15 with Differences from 2013-14 Program
*Other includes Criminology, Education, International Relations, Management, Psychology and Social Behavior and Visual Arts.
B. Establishment of Contingency Funds
The 2012 basic program document (Appendix A) did not require a “contingency fund” in case of any funding shortfalls but did specify that “The dean or his/her designee will have responsibility for managing program funds, reviewing the availability of facilities & administration (F&A), and for covering any unforeseen shortfalls. General Funds cannot be substituted for external funds in support of the program” (Appendix A, p. 2). Two of the campus programs (UC Irvine, UC San Diego) have required that a contingency fund be created. One of the campus programs (UC Los Angeles) has dealt with the responsibility for shortfalls by tasking departments/schools to manage the issue. Details are provided below.
Discipline Group
External Start up
FundsFederal
C&G funds
Federal Indirect Cost
Recovery Funds Gift funds
Opportunity funds
Other Allowable
FundsPrivate
C&G funds
Self-Supporting
and Prof Degrees
State C&G funds
Summer Session
Fees Grand TotalBiological Sciences 446,206$ 850$ 91,719$ 10,211$ 31,600$ 68,864$ 33,600$ 2,720$ 685,770$ Engineering 28,000$ 1,528,497$ 944,446$ 338,255$ 342,040$ 28,755$ 3,209,992$ Information and Computer Science 167,614$ 1,316$ 60,229$ 22,550$ 109,432$ 361,141$ Letters and Sciences 398,705$ 34,650$ 53,521$ 32,200$ 519,076$ Marine Sciences 16,300$ 950$ 187,650$ 204,900$ Other* 51,155$ 12,500$ 15,005$ 37,607$ 19,100$ 159,800$ 295,167$ Physical Sciences 487,729$ 55,100$ 38,906$ 25,100$ 54,143$ 660,978$ Public Health 350,454$ 147,334$ 103,548$ 50,145$ 651,481$ Social Sciences 78,935$ 6,022$ 84,957$
Total 28,000$ 3,525,595$ 2,166$ 1,199,594$ 86,672$ 821,066$ 729,327$ 159,800$ 112,500$ 8,742$ 6,673,463$
Discipline Group
External Start up
FundsFederal
C&G funds
Federal Indirect Cost
Recovery Funds Gift funds
Opportunity funds
Other Allowable
FundsPrivate
C&G funds
Self-Supporting
and Prof Degrees
FeesState C&G
funds
Summer Session
Fees
Total of positive and
negative differences
from 2013-14 to 2014-15
Biological Sciences -$ 134,206$ 850$ 24,019$ (108,482)$ 26,438$ (39,832)$ -$ (19,200)$ 2,720$ 20,719$ Engineering 24,867$ 1,286,801$ -$ 776,596$ -$ 338,255$ 125,151$ -$ 28,755$ -$ 2,580,424$ Information and Computer Science -$ 107,536$ 1,316$ 60,229$ 22,550$ (4,354)$ (149,150)$ -$ -$ (399)$ 37,728$ Letters and Sciences -$ 157,702$ -$ 18,774$ -$ (3,126)$ 25,500$ -$ -$ -$ 198,850$ Marine Sciences -$ 16,300$ -$ 950$ -$ 77,600$ -$ -$ -$ -$ 94,850$ Other* -$ (30,433)$ -$ 12,500$ (16,615)$ 37,607$ (38,921)$ 80,377$ -$ -$ 44,515$ Physical Sciences -$ 53,260$ -$ 8,200$ 7,246$ (911)$ (16,281)$ -$ (54,900)$ -$ (3,386)$ Public Health -$ (15,623)$ (11,534)$ (4,578)$ -$ 143,744$ (83,814)$ -$ (8,284)$ -$ 19,911$ Social Sciences -$ 27,748$ -$ -$ -$ (12,000)$ -$ -$ -$ (1,421)$ 14,327$ Total of positive and negative differences from 2013-14 to 2014-15 24,867$ 1,737,497$ (9,368)$ 896,690$ (95,301)$ 603,252$ (177,347)$ 80,377$ (53,629)$ 900$ 3,007,939$
Difference from 2013-14
2014-15
Annual Report for Year Two (July 2014 – June 2015) NSTP
UCOP Academic Personnel and Programs, December 11, 2015 page 15
Campuses with a Contingency Fund
For UC Irvine and UC San Diego, a key component of the NSTP is the development of a sufficient contingency fund to assure the campus does not incur unexpected costs due to the plan. Each faculty member with a negotiated salary increment is required to contribute an amount equal to 10% of the negotiated salary increment to the contingency fund. At UC San Diego, enrolled faculty replace a portion of their base salary with an external fund source(s), thereby releasing core funding (e.g., 19900A) used for the contingency amount. The department maintains and earmarks the pool of released salary for the contingency fund. At UC Irvine, enrolled faculty have two options; they may either replace a portion of their base salary with an external fund source in the same fashion as UC San Diego enrolled faculty, or they may utilize available fund sources, such as unrestricted gift or start-up funds to be set aside as contingency funding. Each participating school maintains and earmarks the pool of funding for the contingency fund. Further detail on the management and use of the contingency funds are in the campus implementation documents.
Campuses Without a Contingency Fund
At UC Los Angeles, the campus implementation document provides guidelines on the contingency fund in section “X, Financial Responsibility.” Pursuant to section X, it states that “the dean may establish a contingency fund at a designated percentage rate to ensure coverage of TUCS obligations;” guidance is also given on how such a fund could be managed. Within that flexibility, the participating schools at UC Los Angeles have managed their financial responsibilities by requiring NSTP participants or their departments to provide an unrestricted full accounting unit (FAU) which would be used to fund any negotiated salary component, if necessary. Primarily, these unrestricted funds are gifts, indirect cost recovery (ICR), or other unrestricted sources belonging to the participant, but by negotiation with the chair, departmental discretionary funds such as ICR or summer revenue may be identified as the source of the alternative contingency funding. Review by fund managers and by chairs ensures that these sources are indeed eligible and available for this purpose. A faculty member who cannot provide a fund source, or alternatively gain the approval of the chair to have the department backstop the main source of funding, will not be approved to participate in NSTP. It is also divisional policy that a faculty member who had to invoke the use of his or her contingency fund would not be allowed to participate in the following year.
V. Summer Salary and Administrative Stipends
This “Summer Salary and Administrative Stipends” section of the report provides data on summer-ninths and stipends for enrolled faculty, as stipulated by the 2013 Taskforce (Appendix B).
A. Summer Salary
When the NSTP was designed, it was assumed that faculty who already had sufficient support to fund three months of summer salary would be most likely to enroll because they had already maximized their compensation outside of the program. Although the ability to fund three ninths summer salary is not a program requirement, the data below suggest the vast majority of faculty elected to be paid three ninths at the total UC salary rate, which includes the negotiated salary increment. Data show that during the first year, 92% of NSTP participants earned the maximum of
Annual Report for Year Two (July 2014 – June 2015) NSTP
UCOP Academic Personnel and Programs, December 11, 2015 page 16
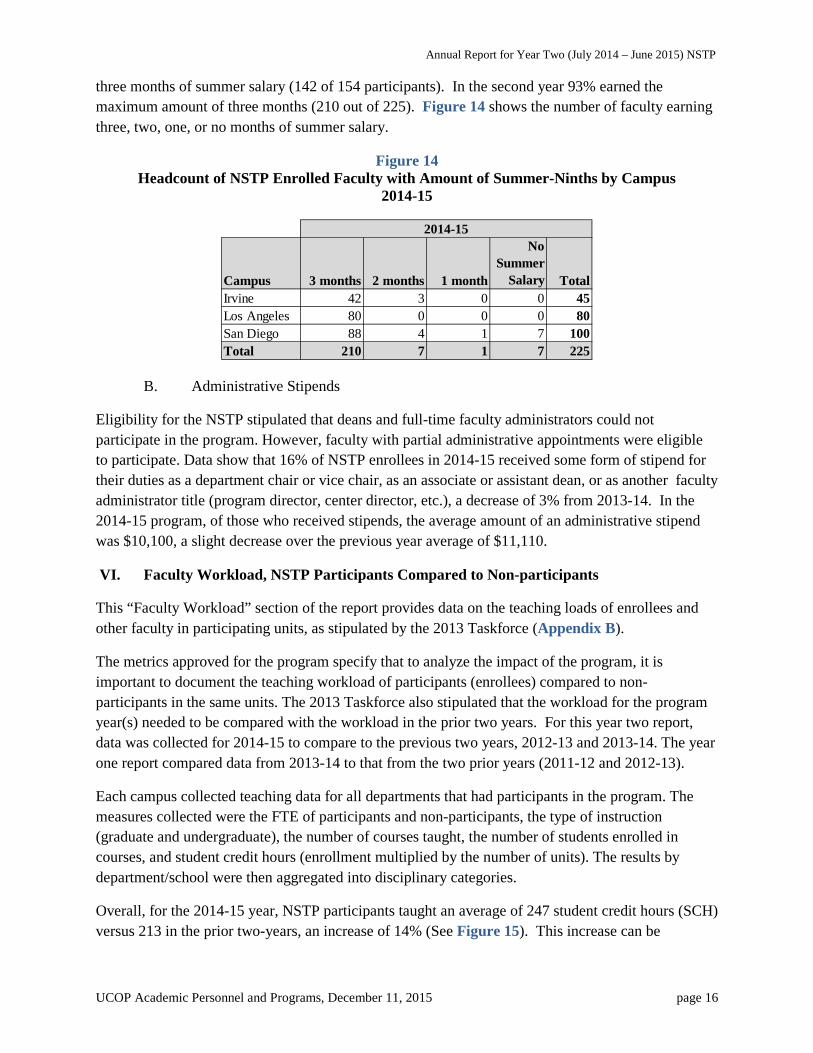
three months of summer salary (142 of 154 participants). In the second year 93% earned the maximum amount of three months (210 out of 225). Figure 14 shows the number of faculty earning three, two, one, or no months of summer salary.
Figure 14 Headcount of NSTP Enrolled Faculty with Amount of Summer-Ninths by Campus
2014-15
B. Administrative Stipends
Eligibility for the NSTP stipulated that deans and full-time faculty administrators could not participate in the program. However, faculty with partial administrative appointments were eligible to participate. Data show that 16% of NSTP enrollees in 2014-15 received some form of stipend for their duties as a department chair or vice chair, as an associate or assistant dean, or as another faculty administrator title (program director, center director, etc.), a decrease of 3% from 2013-14. In the 2014-15 program, of those who received stipends, the average amount of an administrative stipend was $10,100, a slight decrease over the previous year average of $11,110.
VI. Faculty Workload, NSTP Participants Compared to Non-participants
This “Faculty Workload” section of the report provides data on the teaching loads of enrollees and other faculty in participating units, as stipulated by the 2013 Taskforce (Appendix B).
The metrics approved for the program specify that to analyze the impact of the program, it is important to document the teaching workload of participants (enrollees) compared to non-participants in the same units. The 2013 Taskforce also stipulated that the workload for the program year(s) needed to be compared with the workload in the prior two years. For this year two report, data was collected for 2014-15 to compare to the previous two years, 2012-13 and 2013-14. The year one report compared data from 2013-14 to that from the two prior years (2011-12 and 2012-13).
Each campus collected teaching data for all departments that had participants in the program. The measures collected were the FTE of participants and non-participants, the type of instruction (graduate and undergraduate), the number of courses taught, the number of students enrolled in courses, and student credit hours (enrollment multiplied by the number of units). The results by department/school were then aggregated into disciplinary categories.
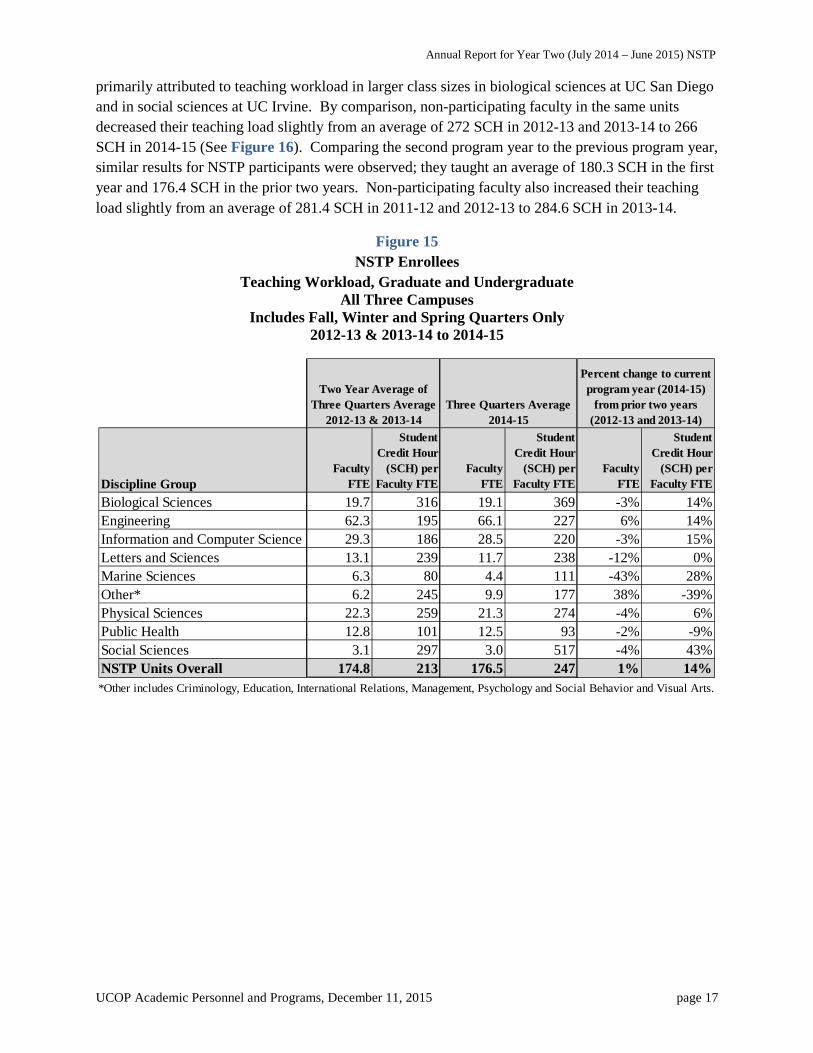
Overall, for the 2014-15 year, NSTP participants taught an average of 247 student credit hours (SCH) versus 213 in the prior two-years, an increase of 14% (See Figure 15). This increase can be
Campus 3 months 2 months 1 month
No Summer
Salary TotalIrvine 42 3 0 0 45Los Angeles 80 0 0 0 80San Diego 88 4 1 7 100Total 210 7 1 7 225
2014-15
Annual Report for Year Two (July 2014 – June 2015) NSTP
UCOP Academic Personnel and Programs, December 11, 2015 page 17
primarily attributed to teaching workload in larger class sizes in biological sciences at UC San Diego and in social sciences at UC Irvine. By comparison, non-participating faculty in the same units decreased their teaching load slightly from an average of 272 SCH in 2012-13 and 2013-14 to 266 SCH in 2014-15 (See Figure 16). Comparing the second program year to the previous program year, similar results for NSTP participants were observed; they taught an average of 180.3 SCH in the first year and 176.4 SCH in the prior two years. Non-participating faculty also increased their teaching load slightly from an average of 281.4 SCH in 2011-12 and 2012-13 to 284.6 SCH in 2013-14.
Figure 15 NSTP Enrollees
Teaching Workload, Graduate and Undergraduate All Three Campuses
Includes Fall, Winter and Spring Quarters Only 2012-13 & 2013-14 to 2014-15
Discipline GroupFaculty
FTE
Student Credit Hour
(SCH) per Faculty FTE
Faculty FTE
Student Credit Hour
(SCH) per Faculty FTE
Faculty FTE
Student Credit Hour
(SCH) per Faculty FTE
Biological Sciences 19.7 316 19.1 369 -3% 14%Engineering 62.3 195 66.1 227 6% 14%Information and Computer Science 29.3 186 28.5 220 -3% 15%Letters and Sciences 13.1 239 11.7 238 -12% 0%Marine Sciences 6.3 80 4.4 111 -43% 28%Other* 6.2 245 9.9 177 38% -39%Physical Sciences 22.3 259 21.3 274 -4% 6%Public Health 12.8 101 12.5 93 -2% -9%Social Sciences 3.1 297 3.0 517 -4% 43%NSTP Units Overall 174.8 213 176.5 247 1% 14%
Percent change to current program year (2014-15)
from prior two years (2012-13 and 2013-14)
Two Year Average of Three Quarters Average
2012-13 & 2013-14Three Quarters Average
2014-15
*Other includes Criminology, Education, International Relations, Management, Psychology and Social Behavior and Visual Arts.
Annual Report for Year Two (July 2014 – June 2015) NSTP
UCOP Academic Personnel and Programs, December 11, 2015 page 18
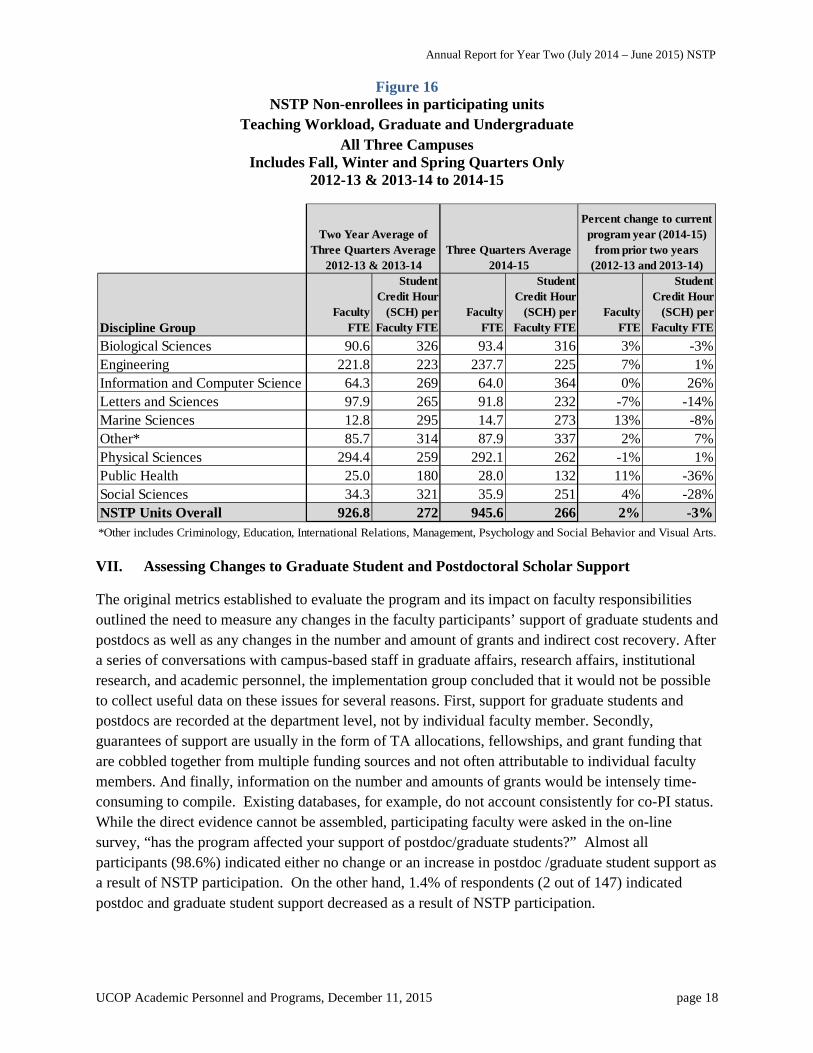
Figure 16 NSTP Non-enrollees in participating units
Teaching Workload, Graduate and Undergraduate All Three Campuses
Includes Fall, Winter and Spring Quarters Only 2012-13 & 2013-14 to 2014-15
VII. Assessing Changes to Graduate Student and Postdoctoral Scholar Support
The original metrics established to evaluate the program and its impact on faculty responsibilities outlined the need to measure any changes in the faculty participants’ support of graduate students and postdocs as well as any changes in the number and amount of grants and indirect cost recovery. After a series of conversations with campus-based staff in graduate affairs, research affairs, institutional research, and academic personnel, the implementation group concluded that it would not be possible to collect useful data on these issues for several reasons. First, support for graduate students and postdocs are recorded at the department level, not by individual faculty member. Secondly, guarantees of support are usually in the form of TA allocations, fellowships, and grant funding that are cobbled together from multiple funding sources and not often attributable to individual faculty members. And finally, information on the number and amounts of grants would be intensely time-consuming to compile. Existing databases, for example, do not account consistently for co-PI status. While the direct evidence cannot be assembled, participating faculty were asked in the on-line survey, “has the program affected your support of postdoc/graduate students?” Almost all participants (98.6%) indicated either no change or an increase in postdoc /graduate student support as a result of NSTP participation. On the other hand, 1.4% of respondents (2 out of 147) indicated postdoc and graduate student support decreased as a result of NSTP participation.
Discipline GroupFaculty
FTE
Student Credit Hour
(SCH) per Faculty FTE
Faculty FTE
Student Credit Hour
(SCH) per Faculty FTE
Faculty FTE
Student Credit Hour
(SCH) per Faculty FTE
Biological Sciences 90.6 326 93.4 316 3% -3%Engineering 221.8 223 237.7 225 7% 1%Information and Computer Science 64.3 269 64.0 364 0% 26%Letters and Sciences 97.9 265 91.8 232 -7% -14%Marine Sciences 12.8 295 14.7 273 13% -8%Other* 85.7 314 87.9 337 2% 7%Physical Sciences 294.4 259 292.1 262 -1% 1%Public Health 25.0 180 28.0 132 11% -36%Social Sciences 34.3 321 35.9 251 4% -28%NSTP Units Overall 926.8 272 945.6 266 2% -3%
Percent change to current program year (2014-15)
from prior two years (2012-13 and 2013-14)
Two Year Average of Three Quarters Average
2012-13 & 2013-14Three Quarters Average
2014-15
*Other includes Criminology, Education, International Relations, Management, Psychology and Social Behavior and Visual Arts.
Annual Report for Year Two (July 2014 – June 2015) NSTP
UCOP Academic Personnel and Programs, December 11, 2015 page 19
The executive vice chancellors/provosts commented on these issues of faculty responsibilities in their campus reports; they noted that there is no evidence of any decreasing support of graduate students and postdocs or in the number and amount of grants due to NSTP participation. In fact, UC Los Angeles reported for the School of Public Health that NSTP made a positive impact on the hiring of graduate student researchers and postdocs because of the increased number of contracts and grants funding that participants sought out due to the program.
VIII. Faculty and Administrator Survey Summaries
The Taskforce metrics included the administration of annual surveys to collect participant (enrolled), non-participant, and administrator/staff input on the program, in an effort to supplement the data above. The two surveys – one for faculty participants and non-participants and one for administrators/staff – were designed with the help of Taskforce member Professor Elizabeth Deakin (UC Berkeley) and reviewed by the Taskforce members and the implementation team. For year two, the surveys were administered in June and July 2015 (see Appendix D for full detail on the surveys).
Analysis of the faculty comments shows that attitudes about the program vary depending on status as participant or non-participant. The majority of participants are satisfied with the program and salary increment; they cite key reasons for participating as bringing salaries to market rates (79%), augmenting salary (61%), allowing the faculty member to spend more time on research (44%), and reducing outside consulting (36%). Similar to the previous year, 99% of faculty participants indicated that their support of postdoc/graduate students either increased or did not change as a result of the program. Two-thirds of the non-participants were positive or neutral about the program. One-third of the non-participants expressed a variety of concerns including the possibility that participants would reduce their support of graduate students, the potential negative effect of pay disparities on department climate, and the potential liability for the department if there were funding shortfalls. Fifteen percent of non-participants were concerned that the program could cause conflicts in their departments. Among the participant respondents, none had indicated that their teaching load decreased as a result of program participation.
The survey of those administering the NSTP was distributed to a wide range of those involved in the implementation of the program, from provosts and deans to department CAOs and MSOs. Those at higher levels of authority – deans, for example – had the highest level of satisfaction, while those who dealt with the transactional details were more concerned that the benefits to faculty might not outweigh administrative costs. Administrators expressed general satisfaction with the program. More than 78% of all respondents believed the NSTP to be an asset to the University. These views were held most strongly by the executive vice chancellors/provosts/vice provosts/associate vice provosts (100%), deans and college provosts (87%), academic personnel staff (78%), and department chairs (75%).
Compared to the past year, administrators cited more support for the program with respect to its administrative burden; 78% of respondents believed the program outweighed its administrative burden compared to 71% in the prior year.
Annual Report for Year Two (July 2014 – June 2015) NSTP
UCOP Academic Personnel and Programs, December 11, 2015 page 20
With respect to recruitment and retention, the administrative respondents reported that NSTP was used more often in recruitment in 2014-15. Thirty-seven percent of respondents cited it being a valuable tool in recruitment, an 11% increase from the prior year. Thirty nine percent reported that NSTP was a valuable tool in retention, nearly the same as the 38% who reported NSTP’s value in retention the previous year.
IX. Campus Reports from Executive Vice Chancellors/Provosts
This “Campus Reports from Executive Vice Chancellors/Provosts” section of the report is responsive to Taskforce direction that the EVCs report to the UC Provost annually with an administrative assessment of the program (see 3.2.2 in Appendix B).
As a part of the standard annual reporting process, each campus executive vice chancellor and provost was asked to provide “an administrative assessment of relevant issues, including a review of the personnel process at all levels.” Vice Provost Susan Carlson emailed each campus a set of thirteen questions on the NSTP program, with questions drawn from the metrics table developed by the 2013 Taskforce. The questions covered the development and use of the contingency fund; the impact of NSTP on recruitment and retention of faculty; and the effect of the program on teaching, research productivity, research funding, postdoc and graduate student support, academic review, allocation of FTEs, and department climate.
For the 2014-15 program year, each campus reported more direct evidence than in the first year of the positive impacts across several areas: faculty morale, retention and recruitment. In terms of faculty recruitment, all campuses reported that NSTP was a contributing factor in at least one or more faculty recruitments. For example, UC San Diego reported that the program was a factor in three successful hires.
On the subject of faculty retention, UC Los Angeles and UC San Diego reported positive impacts of NSTP; UC San Diego experienced a 54% drop in pre-emptive cases. UC Los Angeles reported a reduction in the number of requests for a health sciences split appointment and one successful retention.
Although UC San Diego and UC Irvine reported that they didn’t have information to assess any effect on the support of postdocs and graduate students, UC Los Angeles mentioned that the program has had a positive effect on support of postdocs/graduate students in the School of Public Health.
All three of the campuses reported that there were no changes in recruitment priorities or FTE allocations as a result of NSTP. Two campuses reported that NSTP had a positive impact on faculty morale while one campus experienced a “significant reduction” in opposition to the program.
In the first year, the campuses reported an increased staff load to administer the program and all suggested that the experience of the first year has led to improvements in the processes of application and evaluation in the second year. During the second year, UC San Diego reported that many of the staff felt more familiar with the process.
Annual Report for Year Two (July 2014 – June 2015) NSTP
UCOP Academic Personnel and Programs, December 11, 2015 page 21
The overall assessments indicate that, from the administrative point of view, the program is working with minimal operational concerns. UC Irvine has refined its participant application forms for 2015-16 in order to more easily collect data requested for assessment. UC San Diego stated that the campus remains enthusiastic about NSTP with more than “10% of the faculty now participating.” UC Los Angeles advocated for the program to not only continue but to expand.
Each of the three reports is attached in Appendix E.
X. Cross-campus Discussion and Next Steps
A group of program administrators from all three campuses and UCOP convened at UC Irvine on November 18th, 2014 to share information and discuss issues such as program administration, improving metrics and improving partnerships with Senate Committees. For example, representatives from UC Irvine shared that they had updated their policies during the first year in response to feedback from faculty.
This report on the program’s second year will be shared with academic administrators, faculty leaders, and other campus administrators involved in the program. During the spring of 2016, Vice Provost Susan Carlson will work with the campuses and with the Academic Council chair to plan for the comprehensive review during year four of the program (2016-17).
Any feedback on this report should be sent to Vice Provost Carlson at the Office of the President ([email protected]).
XI. Appendices
A. Basic Program Document (June 2012)
B. Goals and Quantitative and Qualitative Metrics Documents (June 25, 2013)
C. Memo Clarifying Metrics (August 8, 2014)
D. Faculty and Administrator Survey Results Summary, 2014-15
E. Executive Vice Chancellor Response Memos, 2015 (UC Irvine, UC Los Angeles, UC San Diego)
1
General Campus Negotiated Salary Trial Program
June 15, 2012
Since at least 1995, UC faculty and administrators have been working to design a negotiated salary plan
for faculty on the general campus. Given the concerns about proposed APM – 668 (“Negotiated Salary
Program”), a Taskforce of campus administrators and faculty met in the spring of 2012 to design a Trial
Program to test the effectiveness of the concept on a few UC campuses. The Trial outlined below will
respond to an immediate recruitment and retention need on three campuses (UC San Diego, UCLA, and
UC Irvine) and will allow the University to collect valuable data on the use and effectiveness of the
program. Subsequently and with the data generated and collected through the Trial, parties can have a
more informed discussion of the need for a systemwide policy. This Trial would be operational on July 1,
2013.
A. Program Components
Overview: The four-year Negotiated Salary Trial Program (Trial) will allow up to
three UC campuses to test a negotiated salary process for general
campus faculty. Eligible faculty will be able to voluntarily contribute
external fund sources toward their total salary, with the negotiated
salary amount funded through external sources. The amount of
negotiated salary will have a cap of 30% of the base salary (academic or
fiscal, including off-scale); and the Dean or designee will have
responsibility for managing funding of the negotiated salary program.
Merit review will continue according to campus policy, and each
participating campus will determine the appropriate role for its
Committee on Academic Personnel (CAP) or equivalent committee.
Scope: Administrators and Divisional Senates on three campuses (UCI, UCLA,
and UCSD) will consult on potential participation. Once a Trial Program
has been approved, the EVC on each campus, with Senate input, will
coordinate with divisions/schools/departments that will take part.
Eligibility: Ladder-rank and in-residence faculty who have advanced in rank or step
in their last academic review (or equivalent satisfactory review) are
eligible, provided the faculty member’s campus and
division/school/department has opted to participate. HSCP members
and full-time deans and faculty administrators (as defined in APM – 240
& 246) are not eligible.
Faculty responsibilities: Participating faculty are expected to meet all teaching, research and
service obligations and to be in compliance with all applicable University
policies, procedures, and training requirements. The campus will ensure
that policies about the buy-out of teaching are maintained.
Appendix A: NSTP Basic Program Document
2
Fund management: Only external funds will be used to support this program. “External
funds” refers to any non-state-appropriated funds, such as (but not
limited to) endowment or gift income, professional degree fees, self-
supporting degree fees, and contract and grant support. The Dean or
his/her designee will have responsibility for managing program funds,
reviewing the availability of F&A, and for covering any unforeseen
shortfalls. General Funds cannot be substituted for external funds in
support of the program.
Salary: The total negotiated salary will be comprised of the salary covered
under the University of California Retirement Plan (UCRP) (scale base
plus off-scale components) and a negotiated salary component.1
Negotiations will be conducted annually to determine an individual’s
total negotiated salary for the following year. The total negotiated
salary must be effective for one full year, corresponding with the
University fiscal cycle of July 1 – June 30 and may not be changed during
that year. The faculty member’s salary (scale plus off-scale) will not be
permanently affected (neither increased nor decreased) as a result of
participating in this program.
Process: As outlined in the Implementation Procedures, eligible faculty will work
with the department chair and department business officer to develop a
proposal for a negotiated salary, with proposals approved by the dean.
Reporting/Review: At the end of each fiscal year, the systemwide Provost will gather (from
each EVC whose campus is participating) data on the program, compile
it, and share with the COVC and the Academic Senate. A comprehensive
review will be undertaken during year three. Trend data will be
provided in year two and after. Details of the report elements are listed
below in section B. An interim report on participation will be submitted
as soon as possible after the Trial begins on July 1, 2013.
Implementation: This document will serve as the Program Policy document with all items
outlined here to be constant among all participating campuses. The
systemwide Provost will also develop “Implementation Procedures for a
Trial Negotiated Salary Program” with details about the procedural
details of running the program on campus. Each campus will adapt this
template to its own approval and review structures. Departures from
this Program document and the “Implementation Procedures” must be
approved by the systemwide Provost with input from the Chair of the
Senate.
1 Faculty will remain on pre-existing appointments (either academic or fiscal); those on academic year
appointments remain eligible for summer ninths which will continue to be processed under pre-existing guidelines.
3
Compliance: When Federal projects are involved, the program must be compliant
with Office of Management and Budget (OMB) Circular A-21.
Participating faculty retain their obligation to abide by University policy
including Conflict of Interest, Conflict of Commitment, the Faculty Code
of Conduct, and the policy on the requirement to submit proposals and
receive awards for grants and contracts through the University.
Duration and termination: The program will run for four years, beginning July 1, 2013, with a full
review during the third year. At that time, the Provost and Academic
Senate will determine the advisability of adding policy language to the
APM, continuing the Trial, or terminating the Trial. The systemwide
Provost may suspend the Trial effective June 30 of any year should the
program be deemed to put the University at risk; an individual campus
EVC may suspend the campus participation effective June 30 of any
year.
B. Metrics, Reporting, and Assessment
An interim report on participation will be submitted as soon as possible after the Trial begins on July 1,
2013, including prospective information provided in the faculty applications for 2013-14. In addition,
annually at the end of the fiscal year, the Office of the President will collect information on the
operation of the program from each participating campus. The goal of the data collection will be to
identify any positive or negative impacts of the Trial Program; i.e., was faculty retention
positively/negatively impacted? was teaching positively/negatively impacted? was graduate student
and postdoc support adequate? etc. The systemwide Provost will distribute a combined report to COVC
and the Academic Council for review and feedback. The following information will be collected:
Funding
Information on external funding utilized in connection with Trial: track funding by type
(endowment funds, contracts and grants [by agency], gifts, fees, etc.).
Development and use of the program funds.
Demographic information on faculty, teaching, and research support in participating units
Collection of information on all faculty in participating departments : a) department and school
or division, rank and step, gender, race/ethnicity, b) salary, including off-scale, summer ninths,
negotiated amount, c) teaching loads, including those who bought out a teaching assignment
during the year (data both before and during Trial period) and indication of teaching done on-
load or as overload.
Data on graduate student and post-doc support by department and individual (data both before
and during Trial period).
4
Surveys
Faculty and administrators with expertise in survey design and administration will develop surveys
for faculty and administrators involved to assess effectiveness of the program on Trial campuses.
The surveys will allow for assessments of conflicts of interest and commitment as well as morale.
They will be used to ascertain the extent to which this program has successfully helped with hiring
and retention and has not been detrimental.
In addition, each annual report by the campus EVC will include an administrative assessment of relevant
issues, including a review of the personnel process at various stages: CAP, department chairs, and
deans.
A comprehensive three-year review will assess whether the Trial Program has helped UC meet
University goals effectively. After the three-year reports are reviewed by the Academic Council and the
COVC, the systemwide Provost will recommend to the President whether the Trial Program should be 1)
reviewed for inclusion in the APM, 2) maintained for an additional trial period, perhaps on additional
campuses, or 3) terminated.
Appendix B: NSTP Metrics Report
Negotiated Salary Trial Program (NSTP) Goals:
Meet immediate recruitment and retention needs on three campuses, including more competitive salaries for participating faculty.
Collect information on the use and effectiveness of the program.
Position University faculty leaders and academic administrators to make a decision about the program after the four-year review.
Metrics to measure goals for the trial program In the attached Table there are three types of data to be collected in the program: 1) “Basic Data” (people, funding, faculty responsibilities), 2) data on “Recruitment, Retention, and Review,” and 3) “Survey Satisfaction Data and Reports” involving queries to faculty, CAPs, and academic administrators on their experiences with the NSTP. The data to be collected will help to address the questions listed here; the numbers match the data collection specified in the table.
Has faculty recruitment been positively/negatively impacted? (2.1.1, 2.1.2)
Has faculty retention been positively/negatively impacted? (2.2.1, 2.2.2)
Have department climate and functioning been positively/negatively impacted? (3.1, 3.2.1, 3.2.2, 3.3)
Has department/school funding been positively/negatively impacted? (1.2.1, 1.2.2, 1.2.3, 1.2.4)
Has research been positively/negatively impacted? (1.3.3, 1.3.4)
Has teaching been positively/negatively impacted? (1.3.1, 1.3.2)
Has graduate student and postdoc support been positively/negatively impacted? (1.3.3)
Have faculty contributions to University and public service been positively/negatively impacted? (3.1, 3.2.1, 3.2.2)
The demographic data on people (1.0) will also help inform the questions above. Final judgments about success and failure In discussions leading up to the initiation of the NSTP, those involved consistently returned to the questions of “what would success look like?” and “what would failure look like?” The workgroup designing these metrics agreed that the NSTP is likely to result in mixed indicators, with some data indicating success and some pointing toward failure. However, we still felt it was important to provide a provisional portrait of success and failure:
A successful NSTP will result in the need for fewer retention offers or preemptive offers as well as fewer transfers to split appointments with Health Sciences. The generation of new external funding will lead to increased graduate student and post-doc support and to funding being freed for other uses across units. The quality of research and teaching will not diminish, and faculty workload in teaching and service will remain stable. Faculty and administrators on the campus will express support for the program. A failed NSTP will not affect the need for retention or preemptive offers nor will it slow transfers to split appointments with the Health Sciences. Funding will be diverted from graduate student and post-doc support, and the administrative costs of the program will be oversized for the benefit. Faculty will prioritize the raising of funds for salary over maintaining the quality of their research and teaching and those not participating in the program will carry additional burdens in teaching and service. Faculty and administrators on the campus will express dissatisfaction with the program.
Required reporting
Interim report. Includes prospective information provided in faculty applications for 2013-14. As soon as
possible after July 1, 2013.
Annual report, years 1 through 5. Each campus will provide information that can be rolled into one
common three-campus report. EVC will include an administrative assessment of relevant issues, including
a review of the personnel process at all levels. Due October 15, beginning in 2014.
Comprehensive four-year review and report. Review of first four years. Will include some data not
collected in the annual reviews and more comprehensive survey data.
6-25-13
NSTP Metrics Working Group
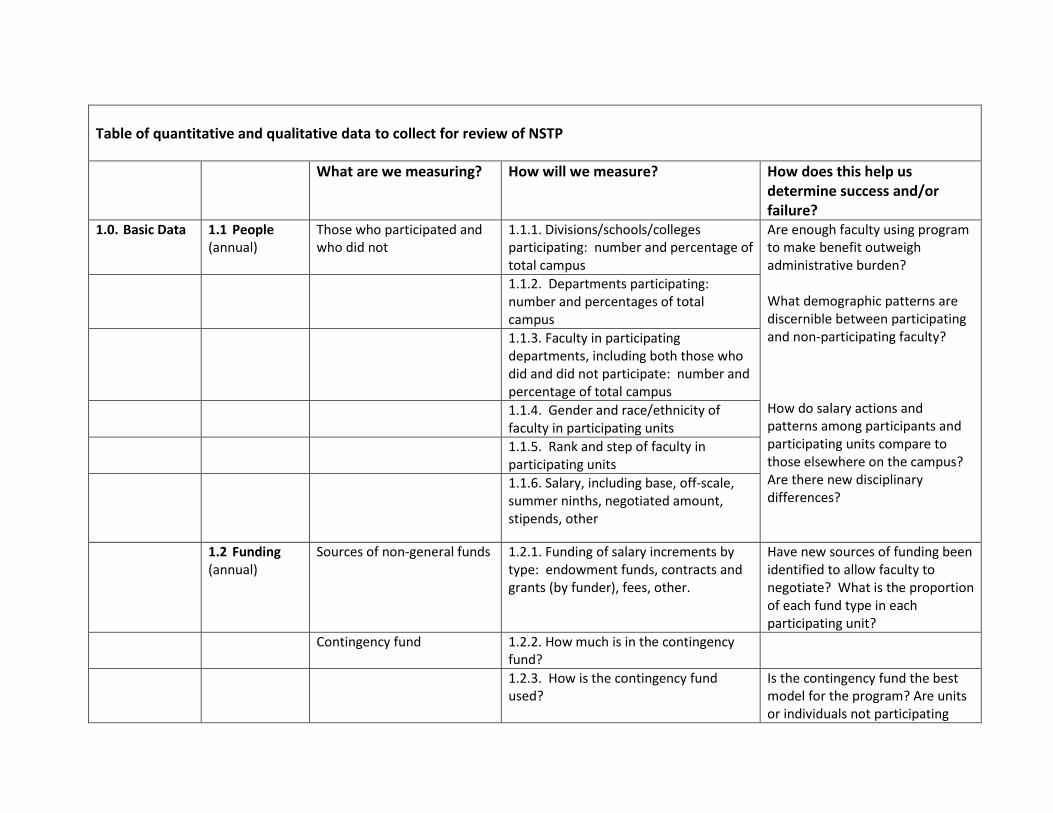
Table of quantitative and qualitative data to collect for review of NSTP
What are we measuring? How will we measure? How does this help us determine success and/or failure?
1.0. Basic Data 1.1 People (annual)
Those who participated and who did not
1.1.1. Divisions/schools/colleges participating: number and percentage of total campus
Are enough faculty using program to make benefit outweigh administrative burden? What demographic patterns are discernible between participating and non-participating faculty? How do salary actions and patterns among participants and participating units compare to those elsewhere on the campus? Are there new disciplinary differences?
1.1.2. Departments participating: number and percentages of total campus
1.1.3. Faculty in participating departments, including both those who did and did not participate: number and percentage of total campus
1.1.4. Gender and race/ethnicity of faculty in participating units
1.1.5. Rank and step of faculty in participating units
1.1.6. Salary, including base, off-scale, summer ninths, negotiated amount, stipends, other
1.2 Funding (annual)
Sources of non-general funds
1.2.1. Funding of salary increments by type: endowment funds, contracts and grants (by funder), fees, other.
Have new sources of funding been identified to allow faculty to negotiate? What is the proportion of each fund type in each participating unit?
Contingency fund 1.2.2. How much is in the contingency fund?
1.2.3. How is the contingency fund used?
Is the contingency fund the best model for the program? Are units or individuals not participating
benefitting from the program?
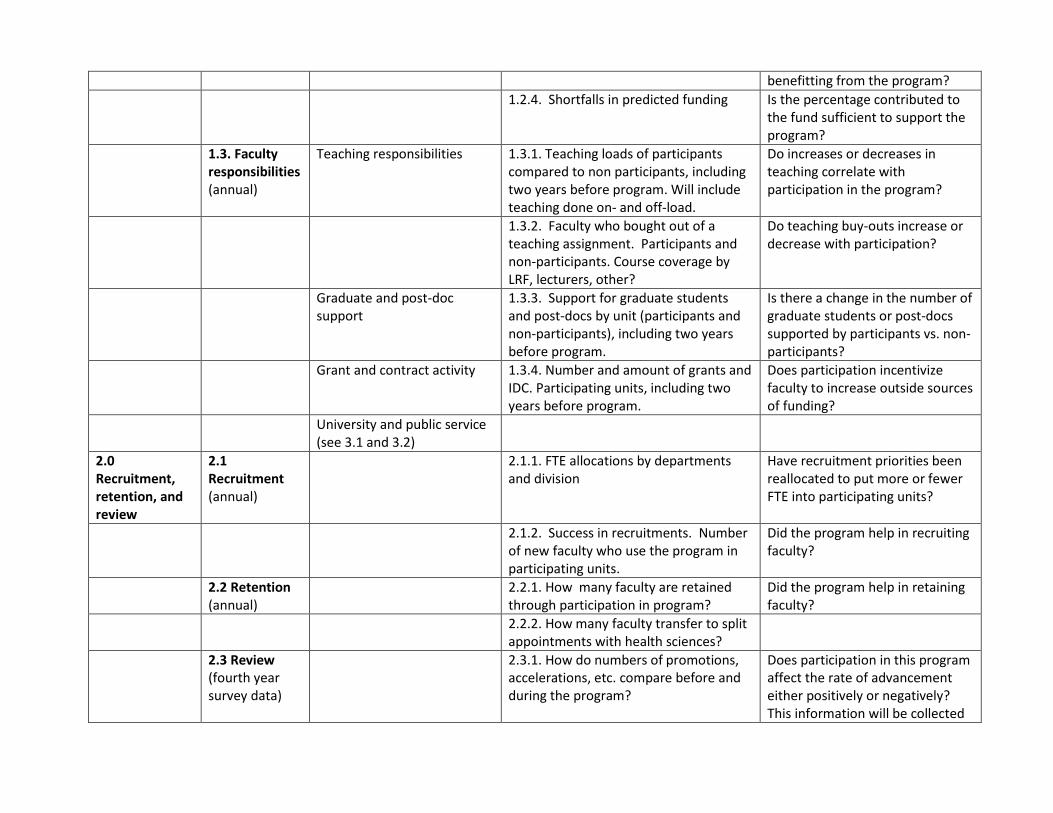
1.2.4. Shortfalls in predicted funding Is the percentage contributed to the fund sufficient to support the program?
1.3. Faculty responsibilities (annual)
Teaching responsibilities 1.3.1. Teaching loads of participants compared to non participants, including two years before program. Will include teaching done on- and off-load.
Do increases or decreases in teaching correlate with participation in the program?
1.3.2. Faculty who bought out of a teaching assignment. Participants and non-participants. Course coverage by LRF, lecturers, other?
Do teaching buy-outs increase or decrease with participation?
Graduate and post-doc support
1.3.3. Support for graduate students and post-docs by unit (participants and non-participants), including two years before program.
Is there a change in the number of graduate students or post-docs supported by participants vs. non-participants?
Grant and contract activity 1.3.4. Number and amount of grants and IDC. Participating units, including two years before program.
Does participation incentivize faculty to increase outside sources of funding?
University and public service (see 3.1 and 3.2)
2.0 Recruitment, retention, and review
2.1 Recruitment (annual)
2.1.1. FTE allocations by departments and division
Have recruitment priorities been reallocated to put more or fewer FTE into participating units?
2.1.2. Success in recruitments. Number of new faculty who use the program in participating units.
Did the program help in recruiting faculty?
2.2 Retention (annual)
2.2.1. How many faculty are retained through participation in program?
Did the program help in retaining faculty?
2.2.2. How many faculty transfer to split appointments with health sciences?
2.3 Review (fourth year survey data)
2.3.1. How do numbers of promotions, accelerations, etc. compare before and during the program?
Does participation in this program affect the rate of advancement either positively or negatively? This information will be collected
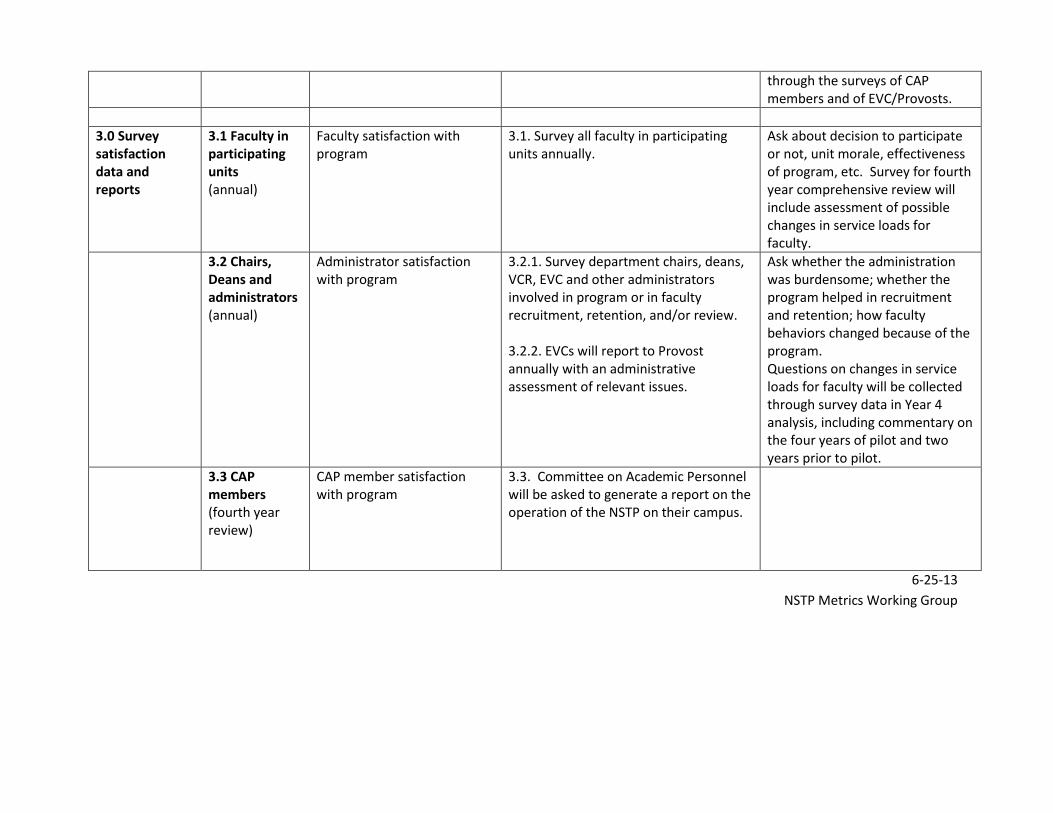
through the surveys of CAP members and of EVC/Provosts.
3.0 Survey satisfaction data and reports
3.1 Faculty in participating units (annual)
Faculty satisfaction with program
3.1. Survey all faculty in participating units annually.
Ask about decision to participate or not, unit morale, effectiveness of program, etc. Survey for fourth year comprehensive review will include assessment of possible changes in service loads for faculty.
3.2 Chairs, Deans and administrators (annual)
Administrator satisfaction with program
3.2.1. Survey department chairs, deans, VCR, EVC and other administrators involved in program or in faculty recruitment, retention, and/or review. 3.2.2. EVCs will report to Provost annually with an administrative assessment of relevant issues.
Ask whether the administration was burdensome; whether the program helped in recruitment and retention; how faculty behaviors changed because of the program. Questions on changes in service loads for faculty will be collected through survey data in Year 4 analysis, including commentary on the four years of pilot and two years prior to pilot.
3.3 CAP members (fourth year review)
CAP member satisfaction with program
3.3. Committee on Academic Personnel will be asked to generate a report on the operation of the NSTP on their campus.
6-25-13
NSTP Metrics Working Group
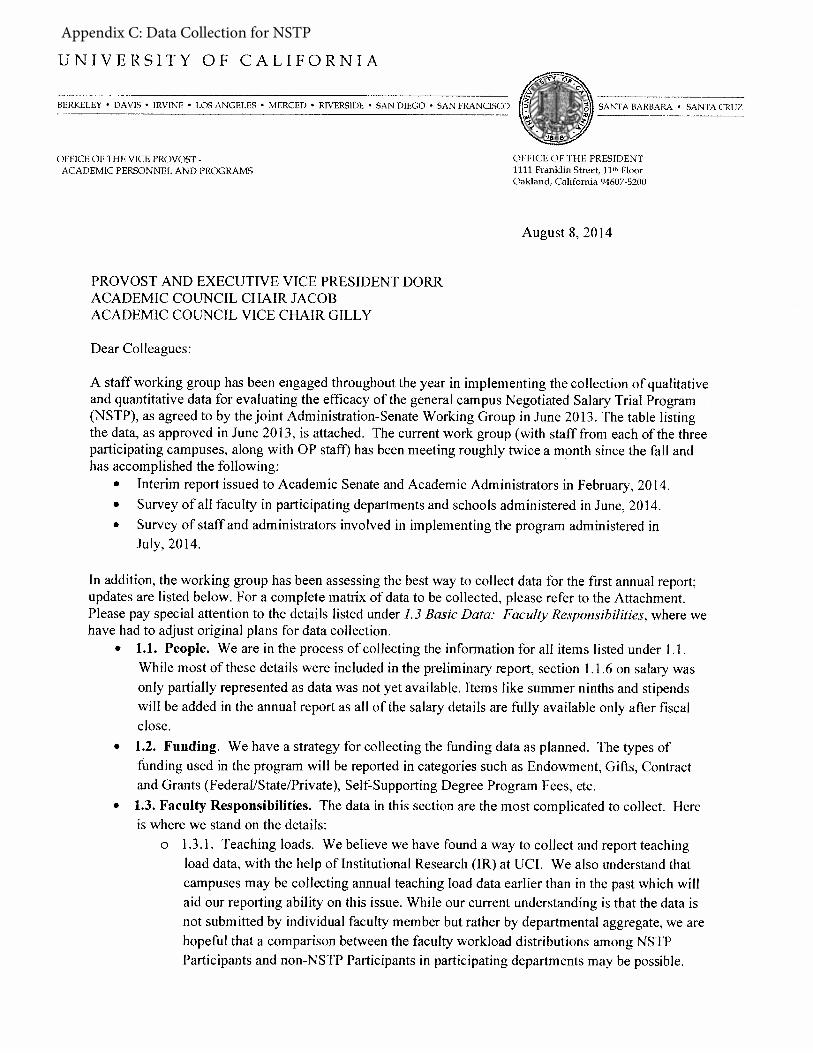
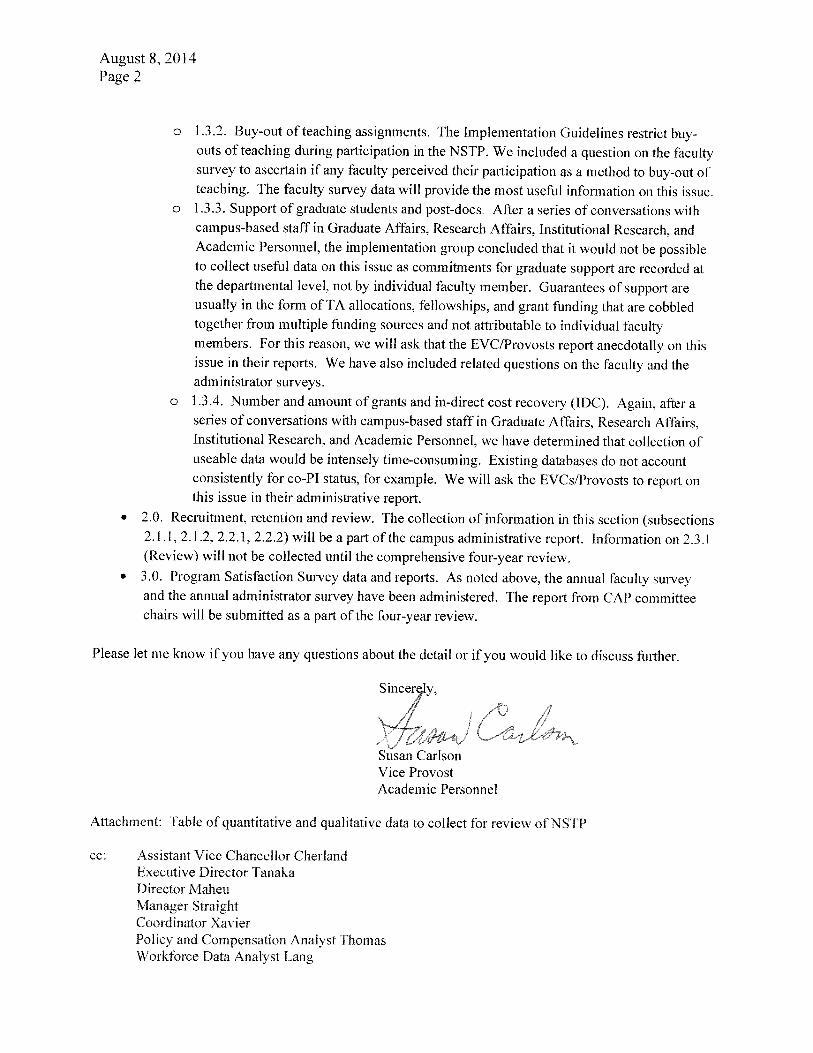
Appendix C: Data Collection for NSTP
Appendix D: Negotiated Salary Trial Program 2014-15 Faculty and Administrator Survey Results
1
NSTP 2014-15 Faculty and Administrator Survey Development The June 15, 2012 draft Implementation Procedures for a Negotiated Salary Trial Program described the need for surveys to be used to assess the effectiveness of the General Campus Negotiated Trial Program (NSTP) on the three campuses participating in the trial (Irvine, Los Angeles, and San Diego). The procedures specified that “faculty and administrators with expertise in survey design and administration would develop surveys for faculty and administrators involved to assess whether conflicts of interest and commitment ensued over the course of the program, whether departmental morale was affected, and whether the program successfully helped faculty recruitment and retention.”
In June 2013, the NSTP Metrics Work Group, comprised of Senate faculty and administrators, was convened by the Provost. The work group developed quantitative and qualitative metrics to be used for assessing the program. The survey instruments focused on these key areas:
• Has faculty retention been positively/negatively impacted? • Have department climate and functioning been positively/negatively impacted? • Has research been positively/negatively impacted? • Has teaching been positively/negatively impacted? • Has graduate student and postdoc support been positively/negatively impacted? • Have faculty contributions to University and public service been positively/negatively impacted?
NSTP 2014-15 Faculty Survey Administration
The annual survey was first administered in June 2014 seeking input on the first year of the NSTP program; results of that survey are available in the first annual report. During the administration of the second annual survey, the questions in the survey remained the same as in the first year. On May 28, 2015, the faculty web-based survey was sent to 1,368 faculty in units participating in the second year of the program on the Irvine, Los Angeles, and San Diego campuses. Four hundred sixty-eight faculty members took the survey, yielding an overall response rate of approximately 34%. Response rates varied substantially between program participants and non-participants. Among NSTP participants, 147 of the 225 individuals surveyed responded to at least one of the survey questions, yielding a response rate of 65%. Three hundred twenty-one of the 1,193 surveyed non-participants took part in the survey, resulting in a response rate of 27%. The survey questions are shown below. Participants responded to items about the program’s impact on their own work-related activities, satisfaction with the program, and the program’s perceived impact on the University. Non-participants were surveyed on their familiarity with the program and their eligibility to participate. Open ended comments were solicited on many of these questions.
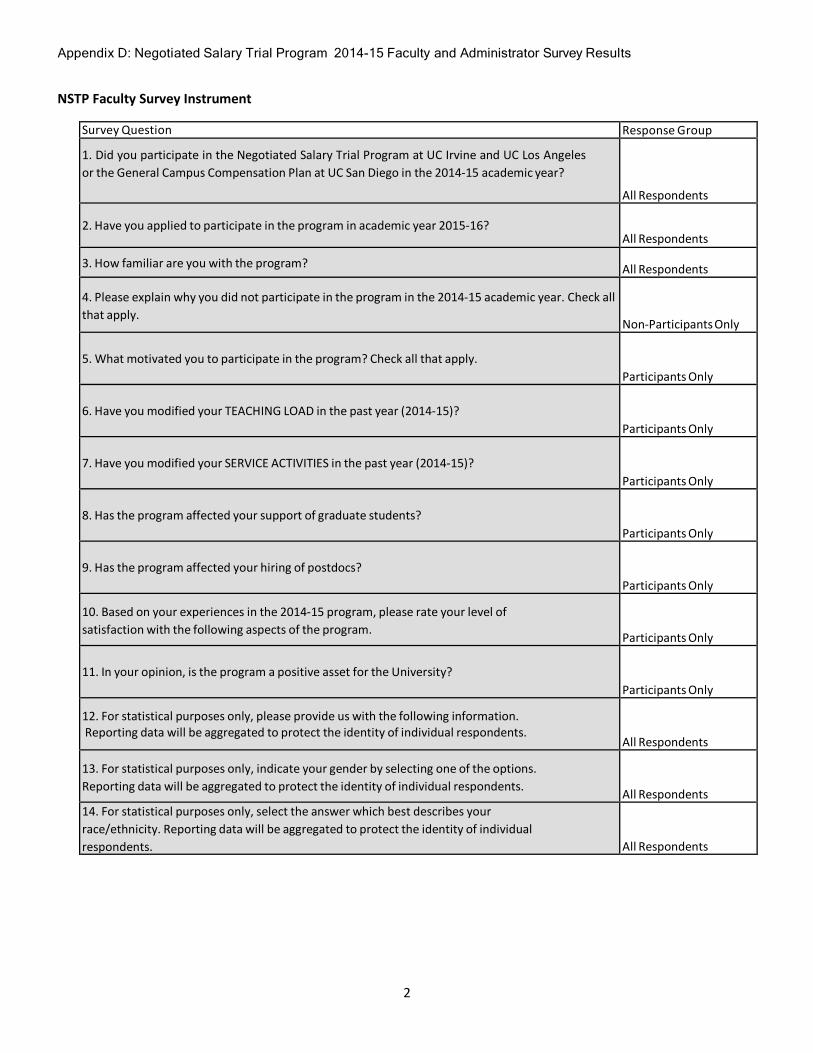
Appendix D: Negotiated Salary Trial Program 2014-15 Faculty and Administrator Survey Results
2
NSTP Faculty Survey Instrument
Survey Question Response Group
1. Did you participate in the Negotiated Salary Trial Program at UC Irvine and UC Los Angeles or the General Campus Compensation Plan at UC San Diego in the 2014-15 academic year?
All Respondents
2. Have you applied to participate in the program in academic year 2015-16?
All Respondents
3. How familiar are you with the program? All Respondents
4. Please explain why you did not participate in the program in the 2014-15 academic year. Check all that apply.
Non-Participants Only
5. What motivated you to participate in the program? Check all that apply.
Participants Only
6. Have you modified your TEACHING LOAD in the past year (2014-15)?
Participants Only
7. Have you modified your SERVICE ACTIVITIES in the past year (2014-15)?
Participants Only
8. Has the program affected your support of graduate students?
Participants Only
9. Has the program affected your hiring of postdocs?
Participants Only
10. Based on your experiences in the 2014-15 program, please rate your level of satisfaction with the following aspects of the program.
Participants Only
11. In your opinion, is the program a positive asset for the University?
Participants Only
12. For statistical purposes only, please provide us with the following information. Reporting data will be aggregated to protect the identity of individual respondents.
All Respondents
13. For statistical purposes only, indicate your gender by selecting one of the options. Reporting data will be aggregated to protect the identity of individual respondents.
All Respondents
14. For statistical purposes only, select the answer which best describes your race/ethnicity. Reporting data will be aggregated to protect the identity of individual respondents.
All Respondents
Appendix D: Negotiated Salary Trial Program 2014-15 Faculty and Administrator Survey Results
3
NSTP 2014-15 Faculty Survey Response Summary
Faculty participants in this second annual survey indicated general satisfaction with the program. Eighty-nine percent were satisfied or highly satisfied with the salary increment. A majority were “satisfied” or “highly satisfied” with the application process and program administration--70% and 78%, respectively. A large majority, or 87%, reportedly reapplied for 2015-16, and 96% of program participants indicated that the program was a “positive asset to the University.”1 The top five reasons faculty gave for participating in the program were: 1) to bring my salary to market rates (79%), 2) to augment my salary (61%), 3) to allow me to spend more time on my University research (44%), 4) to allow me to reduce outside consulting as additional income (36%), and 5) to make it possible to turn down an outside offer (34%). Comments from program participants also indicate general satisfaction with the program. More than two-thirds of program participants’ comments viewed the program in a favorable light. Perceived benefits of the program include the following: increasing a department’s ability to compete for top faculty, offering more opportunities for retention incentives, providing an additional incentive to perform research, and allowing faculty to spend less time consulting and more time with students. Program participants were less satisfied with the administrative process. Thirty-percent of the comments from participants' contained concerns, most commonly about the burdensome application process; restrictive funding deadlines; and excessive contingency fund requirements. A small minority of comments also reflected concerns about how NSTP compensation factored into retirement benefits. A majority of the non-participants’ comments were neutral or positive. Criticisms of the program mainly focused on the perception of pay disparities among departments as a result of the program’s implementation; concern that the existence of programs such as these would reduce the likelihood of salary scale adjustments; potential liability for the department if there were funding shortfalls; and the perception that program participation would discourage graduate student support. Participants were asked how the program affects teaching, public service activities, graduate student support, and postdoctoral scholar hiring. None of the program participants indicated that they reduced their teaching load or “service activities” as a result of the program. Two faculty members indicated that they reduced their support for graduate students and postdocs as a result of participation in the program. Summary responses to the survey are below. NSTP 2014-15 Faculty Survey Response Summary Relative to Prior Year Compared to the prior year, the second year survey results are largely the same. In both years, more than 90% of participants in the program agreed that it was an asset to the university. The top five reasons faculty gave for participating in the program were also similar. Figure 1 offers a side by side comparison, with the relative percentages of the top five reasons in each of the first two years: “ to bring my salary up to market rates”, “to augment my salary”, “to allow me to spend more time on my University research”,”to allow me to reduce outside consulting as an income strategy”, and”to make it possible for me to turn down an outside offer”.
1 Non-Participants were not asked these questions based on this assumption that they would be unfamiliar with the details of the program and its implementation.
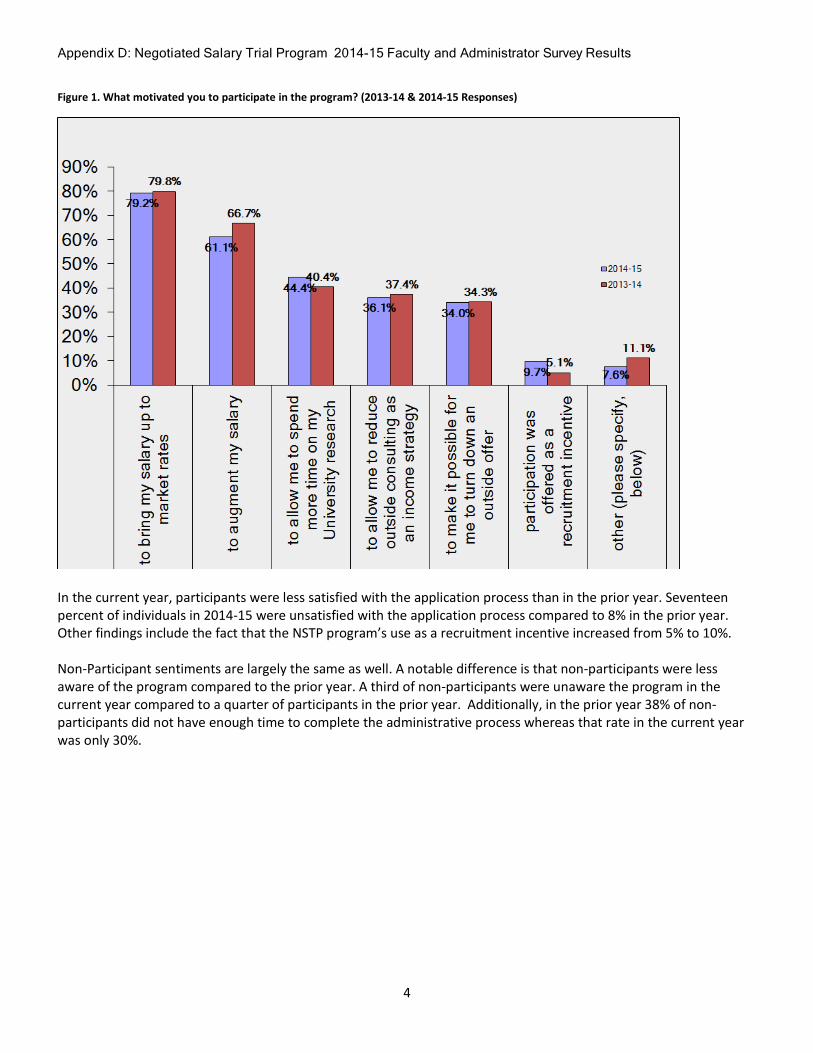
Appendix D: Negotiated Salary Trial Program 2014-15 Faculty and Administrator Survey Results
4
Figure 1. What motivated you to participate in the program? (2013-14 & 2014-15 Responses)
In the current year, participants were less satisfied with the application process than in the prior year. Seventeen percent of individuals in 2014-15 were unsatisfied with the application process compared to 8% in the prior year. Other findings include the fact that the NSTP program’s use as a recruitment incentive increased from 5% to 10%. Non-Participant sentiments are largely the same as well. A notable difference is that non-participants were less aware of the program compared to the prior year. A third of non-participants were unaware the program in the current year compared to a quarter of participants in the prior year. Additionally, in the prior year 38% of non-participants did not have enough time to complete the administrative process whereas that rate in the current year was only 30%.
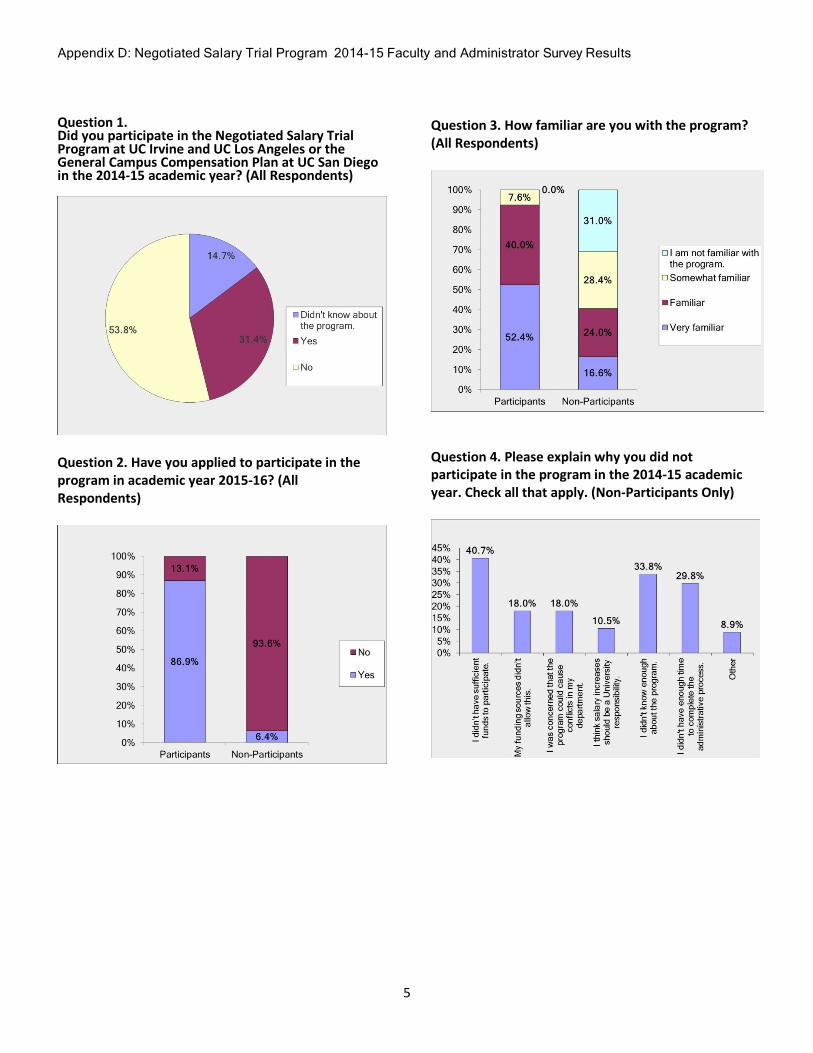
Appendix D: Negotiated Salary Trial Program 2014-15 Faculty and Administrator Survey Results
5
Question 1. Did you participate in the Negotiated Salary Trial Program at UC Irvine and UC Los Angeles or the General Campus Compensation Plan at UC San Diego in the 2014-15 academic year? (All Respondents)
Question 2. Have you applied to participate in the program in academic year 2015-16? (All Respondents)
Question 3. How familiar are you with the program? (All Respondents)
Question 4. Please explain why you did not participate in the program in the 2014-15 academic year. Check all that apply. (Non-Participants Only)
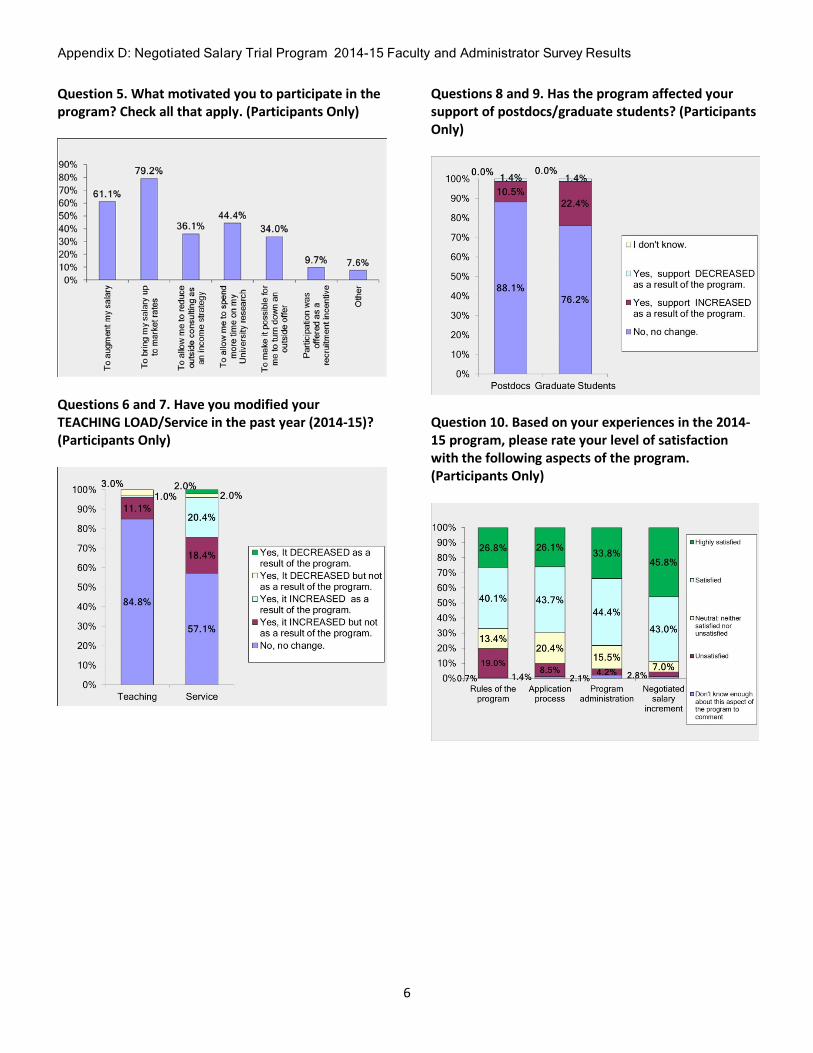
Appendix D: Negotiated Salary Trial Program 2014-15 Faculty and Administrator Survey Results
6
Question 5. What motivated you to participate in the program? Check all that apply. (Participants Only)
Questions 6 and 7. Have you modified your TEACHING LOAD/Service in the past year (2014-15)? (Participants Only)
Questions 8 and 9. Has the program affected your support of postdocs/graduate students? (Participants Only)
Question 10. Based on your experiences in the 2014-15 program, please rate your level of satisfaction with the following aspects of the program. (Participants Only)
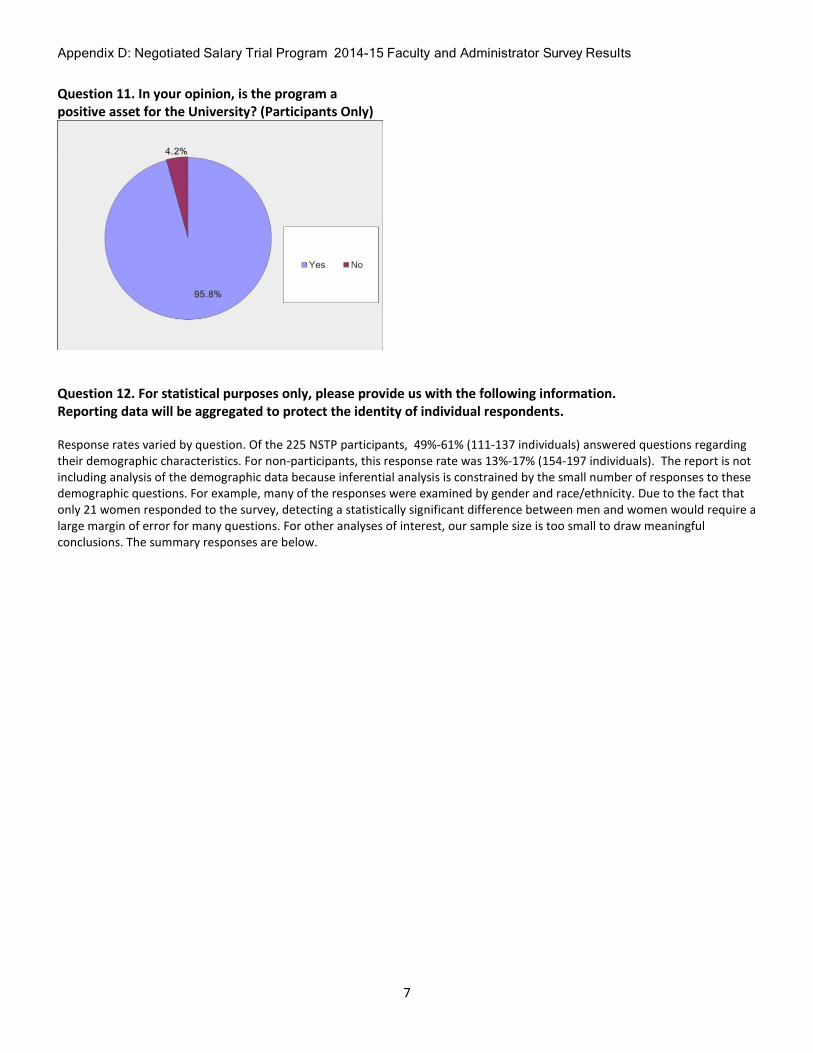
Appendix D: Negotiated Salary Trial Program 2014-15 Faculty and Administrator Survey Results
7
Question 11. In your opinion, is the program a positive asset for the University? (Participants Only)
Question 12. For statistical purposes only, please provide us with the following information. Reporting data will be aggregated to protect the identity of individual respondents. Response rates varied by question. Of the 225 NSTP participants, 49%-61% (111-137 individuals) answered questions regarding their demographic characteristics. For non-participants, this response rate was 13%-17% (154-197 individuals). The report is not including analysis of the demographic data because inferential analysis is constrained by the small number of responses to these demographic questions. For example, many of the responses were examined by gender and race/ethnicity. Due to the fact that only 21 women responded to the survey, detecting a statistically significant difference between men and women would require a large margin of error for many questions. For other analyses of interest, our sample size is too small to draw meaningful conclusions. The summary responses are below.
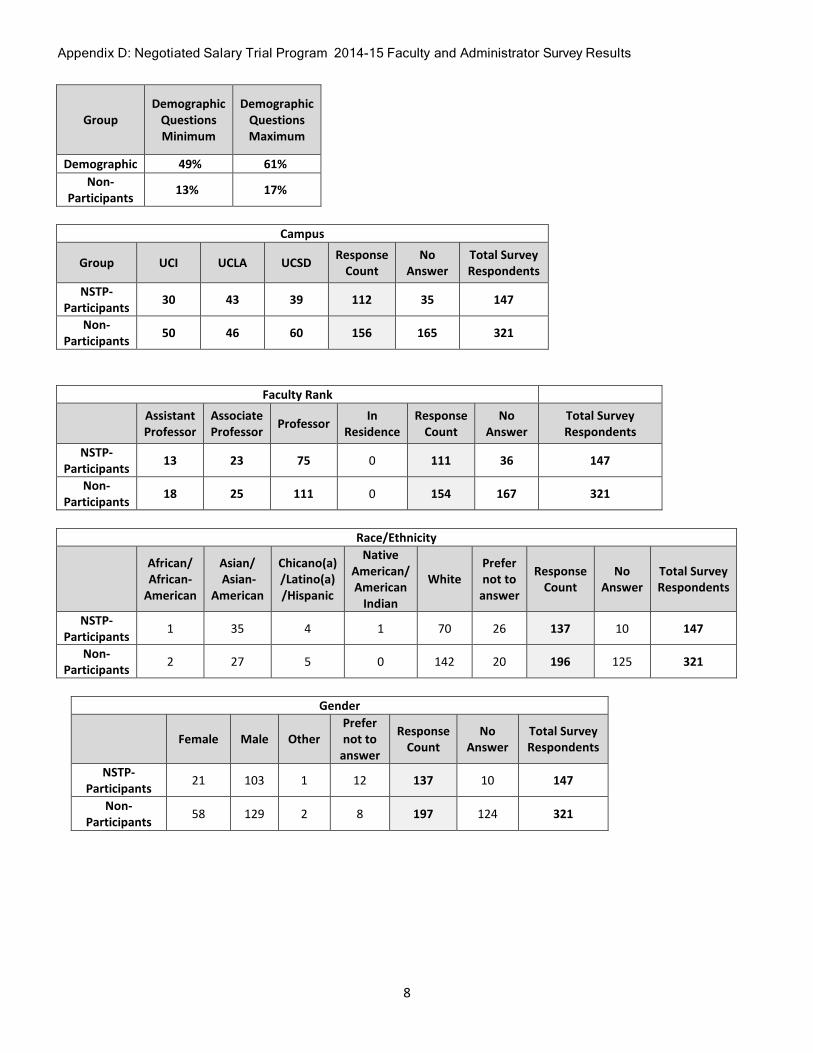
Appendix D: Negotiated Salary Trial Program 2014-15 Faculty and Administrator Survey Results
8
Group Demographic
Questions Minimum
Demographic Questions Maximum
Demographic 49% 61% Non-
Participants 13% 17%
Campus
Group UCI UCLA UCSD Response Count
No Answer
Total Survey Respondents
NSTP-Participants 30 43 39 112 35 147
Non-Participants 50 46 60 156 165 321
Faculty Rank
Assistant Professor
Associate Professor Professor In
Residence Response
Count No
Answer Total Survey Respondents
NSTP-Participants 13 23 75 0 111 36 147
Non-Participants 18 25 111 0 154 167 321
Race/Ethnicity
African/ African-
American
Asian/ Asian-
American
Chicano(a) /Latino(a) /Hispanic
Native American/ American
Indian
White Prefer not to
answer
Response Count
No Answer
Total Survey Respondents
NSTP-Participants 1 35 4 1 70 26 137 10 147
Non-Participants 2 27 5 0 142 20 196 125 321
Gender
Female Male Other Prefer not to
answer
Response Count
No Answer
Total Survey Respondents
NSTP-Participants 21 103 1 12 137 10 147
Non-Participants 58 129 2 8 197 124 321
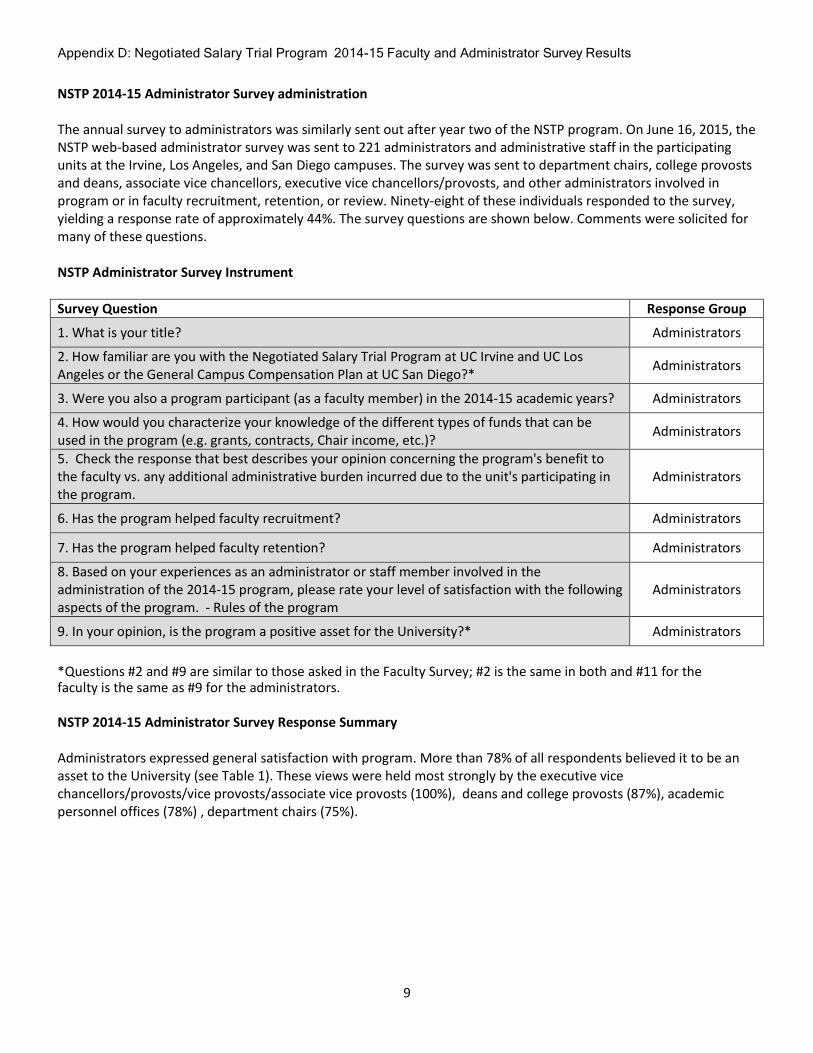
Appendix D: Negotiated Salary Trial Program 2014-15 Faculty and Administrator Survey Results
9
NSTP 2014-15 Administrator Survey administration The annual survey to administrators was similarly sent out after year two of the NSTP program. On June 16, 2015, the NSTP web-based administrator survey was sent to 221 administrators and administrative staff in the participating units at the Irvine, Los Angeles, and San Diego campuses. The survey was sent to department chairs, college provosts and deans, associate vice chancellors, executive vice chancellors/provosts, and other administrators involved in program or in faculty recruitment, retention, or review. Ninety-eight of these individuals responded to the survey, yielding a response rate of approximately 44%. The survey questions are shown below. Comments were solicited for many of these questions. NSTP Administrator Survey Instrument Survey Question Response Group
1. What is your title? Administrators
2. How familiar are you with the Negotiated Salary Trial Program at UC Irvine and UC Los Angeles or the General Campus Compensation Plan at UC San Diego?* Administrators
3. Were you also a program participant (as a faculty member) in the 2014-15 academic years? Administrators
4. How would you characterize your knowledge of the different types of funds that can be used in the program (e.g. grants, contracts, Chair income, etc.)? Administrators
5. Check the response that best describes your opinion concerning the program's benefit to the faculty vs. any additional administrative burden incurred due to the unit's participating in the program.
Administrators
6. Has the program helped faculty recruitment? Administrators
7. Has the program helped faculty retention? Administrators
8. Based on your experiences as an administrator or staff member involved in the administration of the 2014-15 program, please rate your level of satisfaction with the following aspects of the program. - Rules of the program
Administrators
9. In your opinion, is the program a positive asset for the University?* Administrators
*Questions #2 and #9 are similar to those asked in the Faculty Survey; #2 is the same in both and #11 for the faculty is the same as #9 for the administrators. NSTP 2014-15 Administrator Survey Response Summary Administrators expressed general satisfaction with program. More than 78% of all respondents believed it to be an asset to the University (see Table 1). These views were held most strongly by the executive vice chancellors/provosts/vice provosts/associate vice provosts (100%), deans and college provosts (87%), academic personnel offices (78%) , department chairs (75%).
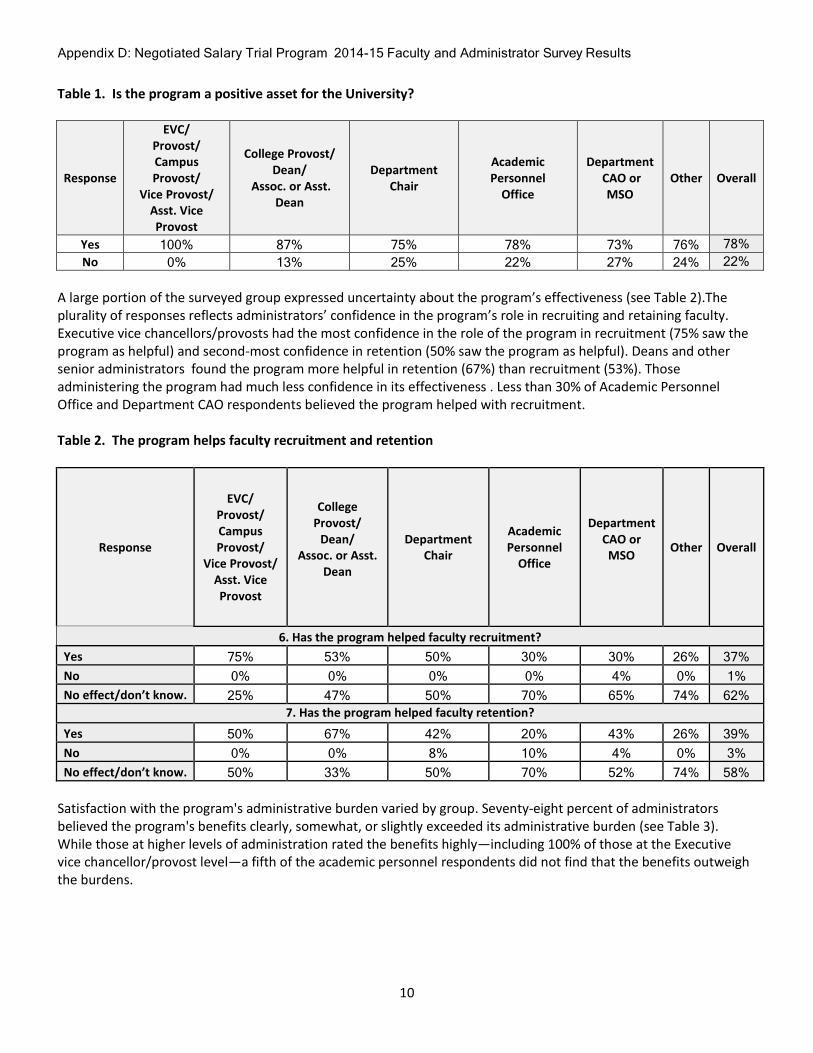
Appendix D: Negotiated Salary Trial Program 2014-15 Faculty and Administrator Survey Results
10
Table 1. Is the program a positive asset for the University?
Response
EVC/ Provost/ Campus Provost/
Vice Provost/ Asst. Vice Provost
College Provost/ Dean/
Assoc. or Asst. Dean
Department Chair
Academic Personnel
Office
Department CAO or
MSO Other Overall
Yes 100% 87% 75% 78% 73% 76% 78% No 0% 13% 25% 22% 27% 24% 22%
A large portion of the surveyed group expressed uncertainty about the program’s effectiveness (see Table 2).The plurality of responses reflects administrators’ confidence in the program’s role in recruiting and retaining faculty. Executive vice chancellors/provosts had the most confidence in the role of the program in recruitment (75% saw the program as helpful) and second-most confidence in retention (50% saw the program as helpful). Deans and other senior administrators found the program more helpful in retention (67%) than recruitment (53%). Those administering the program had much less confidence in its effectiveness . Less than 30% of Academic Personnel Office and Department CAO respondents believed the program helped with recruitment. Table 2. The program helps faculty recruitment and retention
Response
EVC/ Provost/ Campus Provost/
Vice Provost/ Asst. Vice Provost
College Provost/
Dean/ Assoc. or Asst.
Dean
Department Chair
Academic Personnel
Office
Department CAO or MSO
Other Overall
6. Has the program helped faculty recruitment? Yes 75% 53% 50% 30% 30% 26% 37% No 0% 0% 0% 0% 4% 0% 1% No effect/don’t know. 25% 47% 50% 70% 65% 74% 62%
7. Has the program helped faculty retention?
Yes 50% 67% 42% 20% 43% 26% 39% No 0% 0% 8% 10% 4% 0% 3% No effect/don’t know. 50% 33% 50% 70% 52% 74% 58%
Satisfaction with the program's administrative burden varied by group. Seventy-eight percent of administrators believed the program's benefits clearly, somewhat, or slightly exceeded its administrative burden (see Table 3). While those at higher levels of administration rated the benefits highly—including 100% of those at the Executive vice chancellor/provost level—a fifth of the academic personnel respondents did not find that the benefits outweigh the burdens.
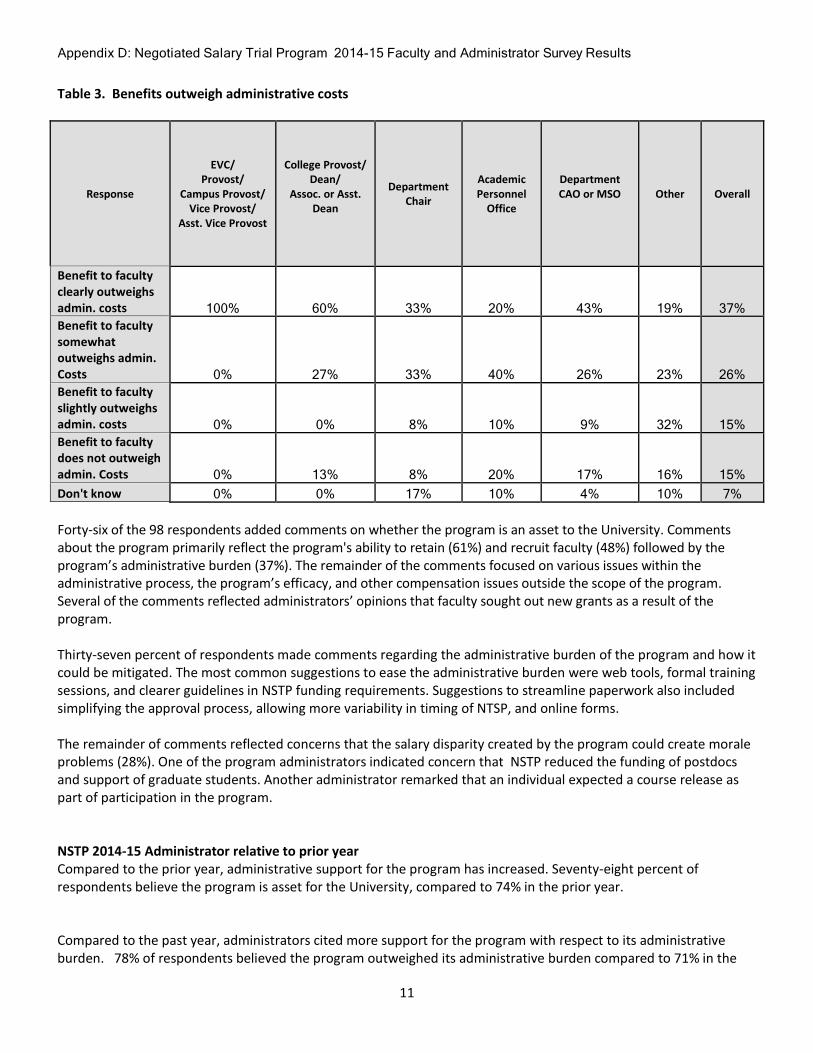
Appendix D: Negotiated Salary Trial Program 2014-15 Faculty and Administrator Survey Results
11
Table 3. Benefits outweigh administrative costs
Response
EVC/ Provost/
Campus Provost/ Vice Provost/
Asst. Vice Provost
College Provost/ Dean/
Assoc. or Asst. Dean
Department Chair
Academic Personnel
Office
Department CAO or MSO
Other Overall
Benefit to faculty clearly outweighs admin. costs 100% 60% 33% 20% 43% 19% 37% Benefit to faculty somewhat outweighs admin. Costs 0% 27% 33% 40% 26% 23% 26% Benefit to faculty slightly outweighs admin. costs 0% 0% 8% 10% 9% 32% 15% Benefit to faculty does not outweigh admin. Costs 0% 13% 8% 20% 17% 16% 15% Don't know 0% 0% 17% 10% 4% 10% 7% Forty-six of the 98 respondents added comments on whether the program is an asset to the University. Comments about the program primarily reflect the program's ability to retain (61%) and recruit faculty (48%) followed by the program’s administrative burden (37%). The remainder of the comments focused on various issues within the administrative process, the program’s efficacy, and other compensation issues outside the scope of the program. Several of the comments reflected administrators’ opinions that faculty sought out new grants as a result of the program. Thirty-seven percent of respondents made comments regarding the administrative burden of the program and how it could be mitigated. The most common suggestions to ease the administrative burden were web tools, formal training sessions, and clearer guidelines in NSTP funding requirements. Suggestions to streamline paperwork also included simplifying the approval process, allowing more variability in timing of NTSP, and online forms. The remainder of comments reflected concerns that the salary disparity created by the program could create morale problems (28%). One of the program administrators indicated concern that NSTP reduced the funding of postdocs and support of graduate students. Another administrator remarked that an individual expected a course release as part of participation in the program. NSTP 2014-15 Administrator relative to prior year Compared to the prior year, administrative support for the program has increased. Seventy-eight percent of respondents believe the program is asset for the University, compared to 74% in the prior year. Compared to the past year, administrators cited more support for the program with respect to its administrative burden. 78% of respondents believed the program outweighed its administrative burden compared to 71% in the
Appendix D: Negotiated Salary Trial Program 2014-15 Faculty and Administrator Survey Results
12
prior year. With respect to recruitment and retention, the respondents cited that NSTP was used more often in recruitment in 2014-15. Thirty-seven percent of respondents cited it being a valuable tool in recruitment, an 11% increase from the prior year. The retention component remains relatively unchanged compared to the prior year’s 38%; in this second year, it was 39%. Fewer administrators were unsatisfied with the rules of the program (18%), the application process (19%), and program administration (15%).Dissatisfaction in these categories were approximately 10% lower than the survey results in the prior year. Dissatisfaction with the negotiated salary increment increased slightly from 6.8% to 8.9%; this increase was not statistically significant.
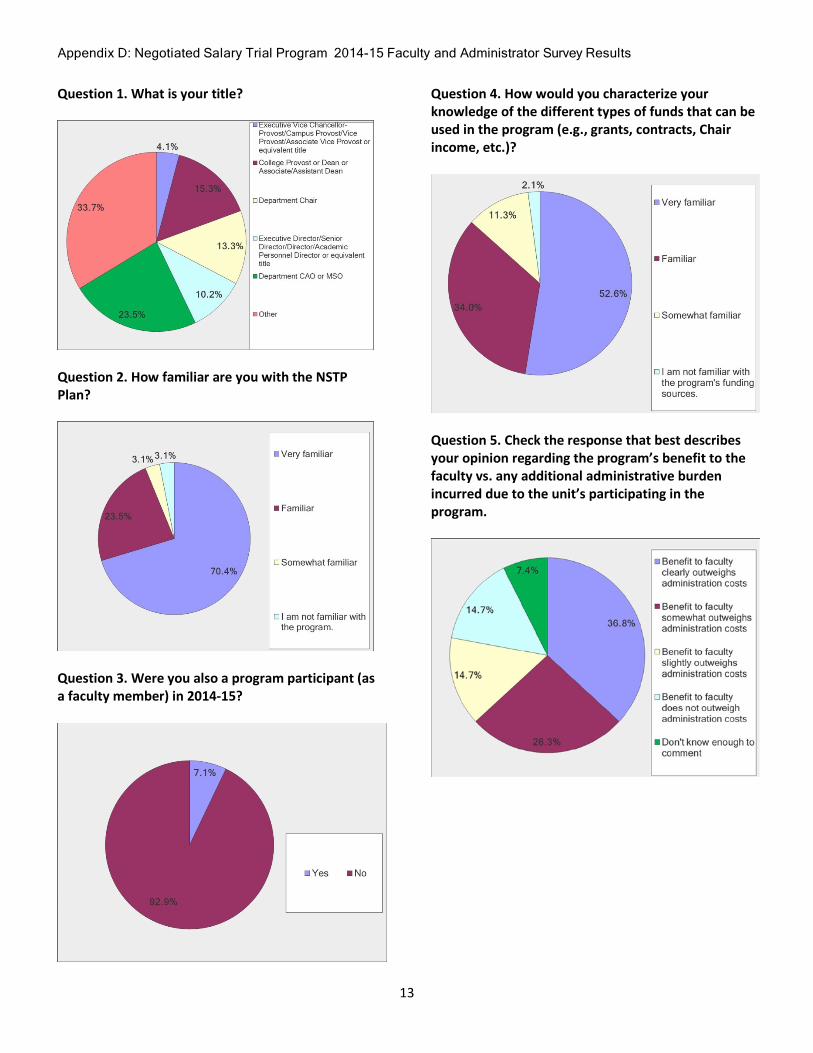
Appendix D: Negotiated Salary Trial Program 2014-15 Faculty and Administrator Survey Results
13
Question 1. What is your title?
Question 2. How familiar are you with the NSTP Plan?
Question 3. Were you also a program participant (as a faculty member) in 2014-15?
Question 4. How would you characterize your knowledge of the different types of funds that can be used in the program (e.g., grants, contracts, Chair income, etc.)?
Question 5. Check the response that best describes your opinion regarding the program’s benefit to the faculty vs. any additional administrative burden incurred due to the unit’s participating in the program.
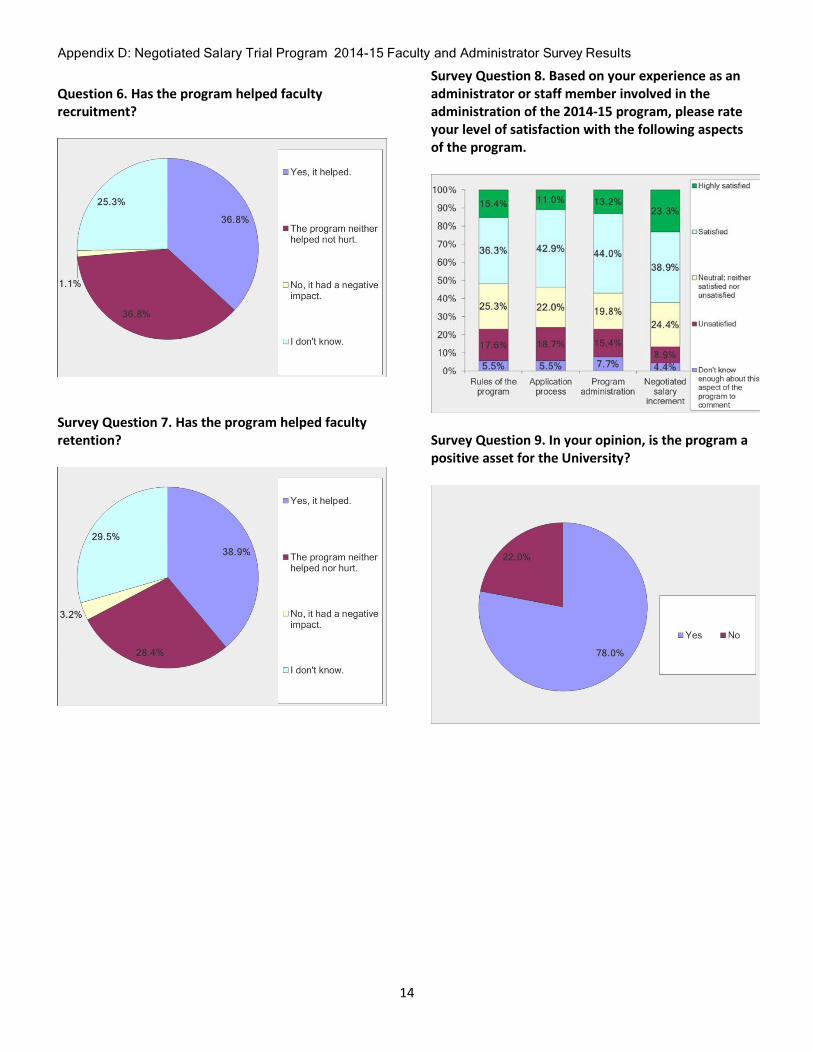
Appendix D: Negotiated Salary Trial Program 2014-15 Faculty and Administrator Survey Results
14
Question 6. Has the program helped faculty recruitment?
Survey Question 7. Has the program helped faculty retention?
Survey Question 8. Based on your experience as an administrator or staff member involved in the administration of the 2014-15 program, please rate your level of satisfaction with the following aspects of the program.
Survey Question 9. In your opinion, is the program a positive asset for the University?
UNIVERSITY OF CALIFORNIA, IRVINEBERKELEY • DAVIS • IRVINE • LOS ANGELES • MERCED • RIVERSIDE • SAN DIEGO • SAN FRANCISCO SANTA BARBARA • SANTA CRUZ
October 14, 2015
Susan Carlson Vice Provost, Academic Personnel and Programs University of California Office of the President 1111 Franklin Street – 11th floor Oakland, CA 94607
Dear Vice Provost Carlson:
In response to your September 10, 2015 request for administrative assessment of the second year of the Negotiated Salary Trial Program (NSTP) at the Irvine campus, we provide the following information reflecting our experience in 2014-15. It should be noted that we formed a campus joint Administration/Academic Senate committee to redesign our application materials for 2015-16 participants so that we could both collect data to specifically answer some of the questions that were defined by Office of the President (UCOP) in July 2014, including those on recruitment and retention. Unfortunately, we do not have this for the 2014-15 participants since they completed the old form.
Question 1 – Contingency funds are constituted in more than one way on the three campuses and some are not in use yet. If, on your campus, the funds were used in this second year, please explain how the funds established in participating units were used? (1.2.3). Response – Each participating school is responsible for creating and administering its own contingency fund. There was no use of the contingency funds for this past year that we are aware of.
Question 2 – As appropriate, please comment on whether the percentage contributed to the contingency fund in each participating unit is sufficient to support the program and to prevent shortfalls. (1.2.4) Response – Each participating unit (school) was required to establish a contingency fund, meaning that the funds are disaggregated across the campus. The minimum amount of each contingency fund was set at ten percent of the Negotiated Salary Component. As a result, we did not anticipate that units would have sufficient funding to support a major shortfall until the third year of the trial. One school is already considering reducing the percentage contribution to the contingency fund for next year’s program since they have not used any to date.
Question 3 – Have recruitment priorities been altered to re-allocate more or fewer FTEs into participating units due to the NSTP? (2.1.1.). Response – The NSTP has had no impact on recruitment priorities or FTE allocation at the Irvine Campus.
Question 4 – Was the program a factor in successful faculty recruitments? For example, did new and early-career-faculty participate in the program? Did you use NSTP in hiring negotiations? Response – One newly recruited faculty member participated in the NSTP in 2014-15. Information about the NSTP was included in many of the offer and retention letters for the 2014-15 new faculty cohort. For the 2015-16 program we have revised our application form to specifically ask the Chair to indicate if/how the NSTP was communicated to the requestor.
Appendix E: NSTP EVC-P Assessment Reports
Susan Carlson Vice Provost, Academic Personnel and Programs October 14, 2015 Page 2 of 3 Question 5 – Did the program have positive, negative, or no impact on faculty retention? Please describe its impact (e.g. fewer retention or preemptive offers; successful counter-offers; fewer requests for split appointments with Health Sciences). If possible, please quantify the number of successful retentions in participating units in 2014-15. (2.2.2) Response –We do not have reliable information on whether the NSTP was discussed as part of a retention offer for the 2014-15 cohort. However the new application for the 2015-16 cohort specifically asks the Chair to indicate whether the requestor had a formal retention offer in the past two or past five years. This information will be available next year. Question 6 – In our survey of faculty we asked about any possible buy-out of teaching, with only two faculty members responding in the positive. On your campus, did any faculty member who participated in the program buy-out of their teaching assignments? If so, please explain the circumstance(s). (1.3.2). Response – Only two out of forty-five faculty participants bought out of teaching assignments—one did so in the initial year of receiving a large, five year federal grant, in order to get the project launched, and the other conducted research on two NIH Research Project Grants (R01s) and one NIH Exploratory/Developmental Research Grant Award (R21). To get additional information on how the program impacts the teaching mission, the Chairs were required on the 2015-16 application form to confirm that the requestor will fulfill all of their teaching obligations. Question 7 – Has there been an effect, attributable to the NSTP, on research productivity for either participant or non-participant faculty in the units involved with the program? For example, did you find that participation in the program incentivizes faculty to increase outside funding? (1.3.4) Response – We have revised our forms to capture total expenditures from all fund sources for the previous year of the participants in the 2015-16 academic year. That said, while this will help us assess activity, it will be difficult to attribute any increase/decrease directly to the NSTP. Measures over time will be the best way to assess whether or not the NSTP was a factor. Question 8 – Has graduate student support or postdoc hiring in the unit (for both NSTP participants and non-participants) been positively or negatively impacted by the program? (1.3.3) Response – We monitor the layoff process centrally and have engaged a process to review potential staffing reductions for program participants, before they occur. For future years, we have revised our NSTP forms to capture participants’ research group members (research staff, postdocs and graduate students) for both the current and previous years, so that we can better measure changes. We will also collect information about staffing changes as a result of the faculty’s mentees obtaining support from other sources. Question 9 – Do you have evidence that the program has had an effect on the number and/or size of grant awards and in-direct costs? (1.3.4) Response – We do not yet have evidence that suggests that the NSTP has impacted grant awards, size of awards or in-direct costs associated with the same. We have revised our forms to more easily collect this data on the grant support of NSTP participants, so that we can track this in future years. Question 10 – In this second year, have academic personnel review processes been affected by the trial program? (3.2.2) Response – The NSTP has had no impact on qualitative aspects of academic personnel review processes. Our new application forms this year substantially reduced the burden for faculty and staff in applying for and in administering the NSTP program. Unfortunately this year, the retroactive salary adjustments affected the NSTP salaries after they had been completed, so this significantly added to the workload.
Susan Carlson Vice Provost, Academic Personnel and Programs October 14, 2015 Page 3 of 3 Question 11 – Has department/school/college climate and functioning been positively or negatively impacted as a result of the program? (3.1-3.3) Response – Opposition to the program, which was initially substantial on our campus, has diminished significantly this year. We think this is in part due to our administration working closely with the Academic Senate in revising the application forms for 2015-16, which gave both parties a better understanding of the other’s perspective. We will continue to work closely with the Academic Senate throughout this trial program. Question 12 – Some have envisioned that those not participating in the program might still benefit from it, perhaps from the availability of funds in the contingency fund. Have any units or individuals not participating in the program benefitted from the program in this second year? (1.2.3) Response – Units or individuals not participating in the program have not yet benefitted from the program in the second year, but at least one unit has begun thinking about how it might be able to utilize contingency funds in a way that is likely to benefit the School as a whole, not just those participating in NSTP. Question 13 – Has the program affected the quality of teaching or research in the units? (1.3.1-1.3.4) Response – There is no evidence to suggest that the program has affected the quality of teaching or research in any campus unit. If you require additional information, please contact me.
Sincerely,
Diane K. O’Dowd Vice Provost
cc: Provost and Executive Vice Chancellor Lavernia Assistant Vice Chancellor Tenma
UNIVERSITY OF CALIFORNIA, LOS ANGELES UCLA
BERKELEY · DAVIS · IRVINE · LOS ANGELES · MERCED · RIVERSIDE · SAN DIEGO · SAN FRANCISCO SANTA BARBARA · SANTA CRUZ
CAROLE GOLDBERG VICE CHANCELLOR, ACADEMIC PERSONNEL
OFFICE OF THE CHANCELLOR 2138 MURPHY HALL, BOX 951405
LOS ANGELES, CALIFORNIA 90095-1405
October 15, 2015
Vice Provost Susan Carlson Academic Personnel University of California Office of the President 1111 Franklin Street, 11th Floor Oakland, California 94607 Dear Susan: As requested, attached is a summary of responses to the evaluation questions about the Negotiated Salary Trial Program (NSTP). For 2014-15, UCLA expanded from two to four participating units: the Fielding School of Public Health, the Division of Life Sciences in the College of Letters and Science, the Henry Samueli School of Engineering and Applied Science, and the Division of Physical Sciences in the College of Letters and Science. We are very pleased to have the opportunity to participate in NSTP and hope the program not only continues but also expands. Please contact me if you have further questions. Thank you for the opportunity to comment on the program.
Sincerely,
Carole Goldberg Vice Chancellor, Academic Personnel
Attachment cc: Chancellor Gene D. Block Executive Vice Chancellor and Provost Scott L. Waugh Dean Vijay Dhir
Dean Jody Heymann Dean Joseph Rudnick
Dean Victoria Sork
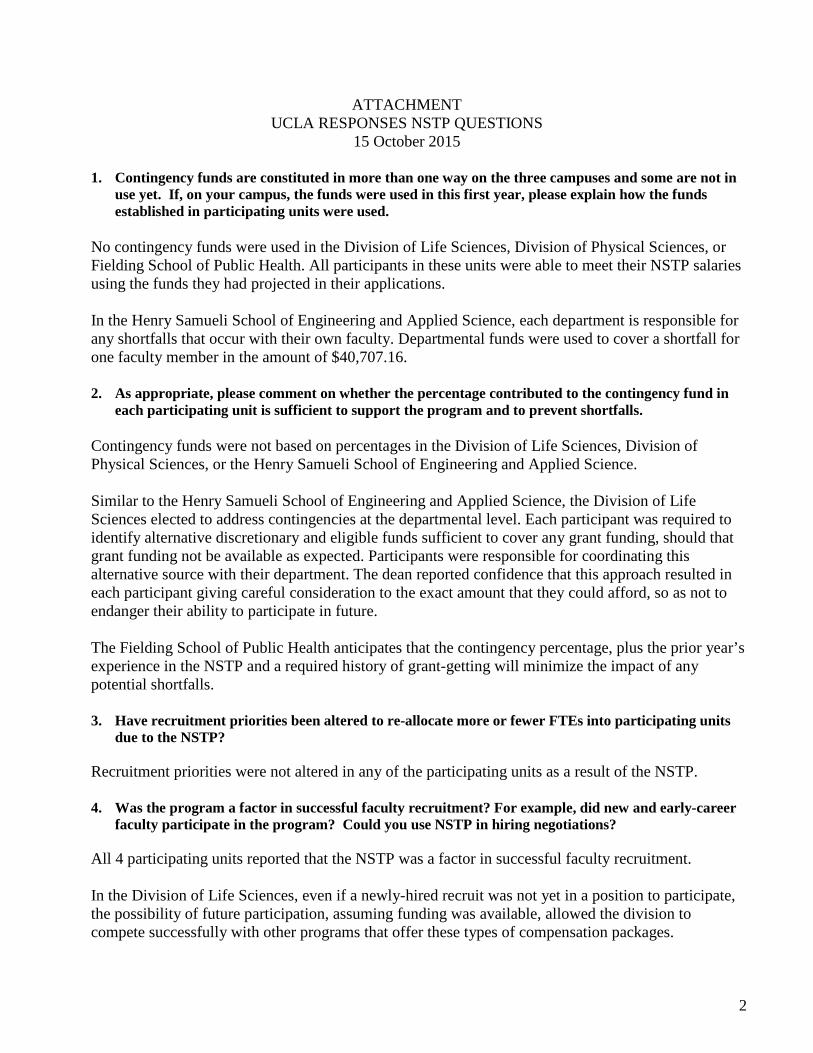
2
ATTACHMENT UCLA RESPONSES NSTP QUESTIONS
15 October 2015
1. Contingency funds are constituted in more than one way on the three campuses and some are not in use yet. If, on your campus, the funds were used in this first year, please explain how the funds established in participating units were used.
No contingency funds were used in the Division of Life Sciences, Division of Physical Sciences, or Fielding School of Public Health. All participants in these units were able to meet their NSTP salaries using the funds they had projected in their applications. In the Henry Samueli School of Engineering and Applied Science, each department is responsible for any shortfalls that occur with their own faculty. Departmental funds were used to cover a shortfall for one faculty member in the amount of $40,707.16. 2. As appropriate, please comment on whether the percentage contributed to the contingency fund in
each participating unit is sufficient to support the program and to prevent shortfalls. Contingency funds were not based on percentages in the Division of Life Sciences, Division of Physical Sciences, or the Henry Samueli School of Engineering and Applied Science. Similar to the Henry Samueli School of Engineering and Applied Science, the Division of Life Sciences elected to address contingencies at the departmental level. Each participant was required to identify alternative discretionary and eligible funds sufficient to cover any grant funding, should that grant funding not be available as expected. Participants were responsible for coordinating this alternative source with their department. The dean reported confidence that this approach resulted in each participant giving careful consideration to the exact amount that they could afford, so as not to endanger their ability to participate in future. The Fielding School of Public Health anticipates that the contingency percentage, plus the prior year’s experience in the NSTP and a required history of grant-getting will minimize the impact of any potential shortfalls. 3. Have recruitment priorities been altered to re-allocate more or fewer FTEs into participating units
due to the NSTP?
Recruitment priorities were not altered in any of the participating units as a result of the NSTP.
4. Was the program a factor in successful faculty recruitment? For example, did new and early-career faculty participate in the program? Could you use NSTP in hiring negotiations?
All 4 participating units reported that the NSTP was a factor in successful faculty recruitment. In the Division of Life Sciences, even if a newly-hired recruit was not yet in a position to participate, the possibility of future participation, assuming funding was available, allowed the division to compete successfully with other programs that offer these types of compensation packages.
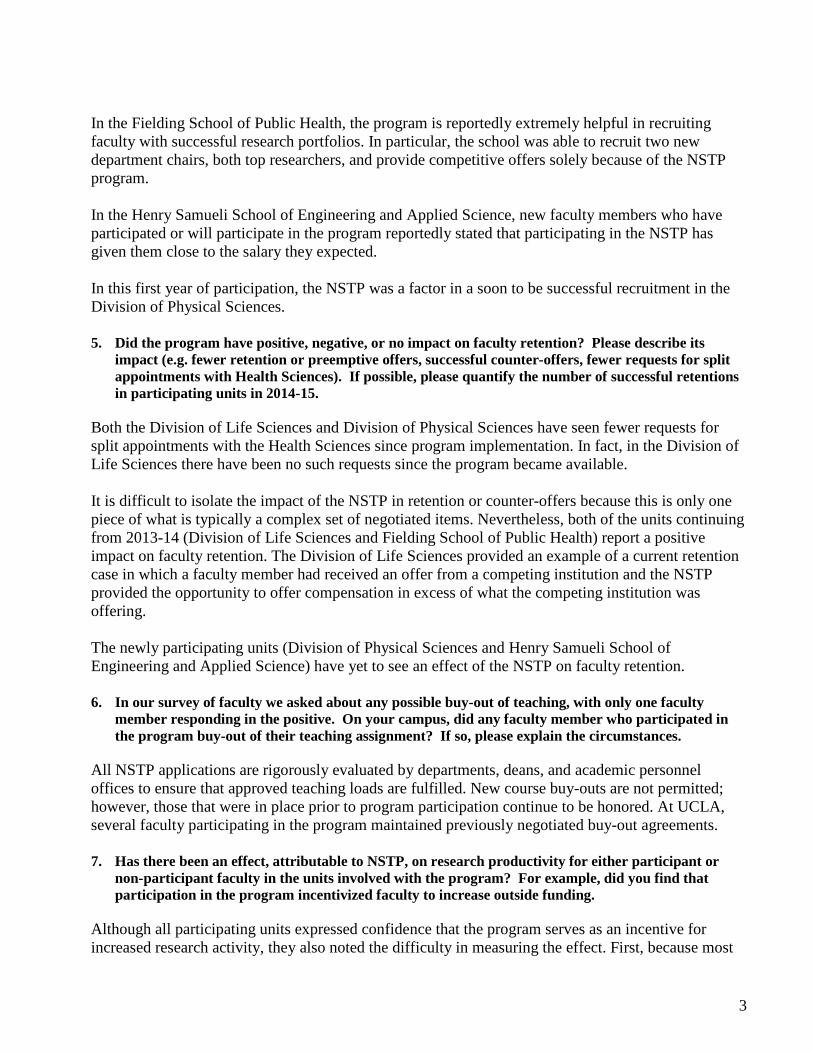
3
In the Fielding School of Public Health, the program is reportedly extremely helpful in recruiting faculty with successful research portfolios. In particular, the school was able to recruit two new department chairs, both top researchers, and provide competitive offers solely because of the NSTP program. In the Henry Samueli School of Engineering and Applied Science, new faculty members who have participated or will participate in the program reportedly stated that participating in the NSTP has given them close to the salary they expected. In this first year of participation, the NSTP was a factor in a soon to be successful recruitment in the Division of Physical Sciences. 5. Did the program have positive, negative, or no impact on faculty retention? Please describe its
impact (e.g. fewer retention or preemptive offers, successful counter-offers, fewer requests for split appointments with Health Sciences). If possible, please quantify the number of successful retentions in participating units in 2014-15.
Both the Division of Life Sciences and Division of Physical Sciences have seen fewer requests for split appointments with the Health Sciences since program implementation. In fact, in the Division of Life Sciences there have been no such requests since the program became available. It is difficult to isolate the impact of the NSTP in retention or counter-offers because this is only one piece of what is typically a complex set of negotiated items. Nevertheless, both of the units continuing from 2013-14 (Division of Life Sciences and Fielding School of Public Health) report a positive impact on faculty retention. The Division of Life Sciences provided an example of a current retention case in which a faculty member had received an offer from a competing institution and the NSTP provided the opportunity to offer compensation in excess of what the competing institution was offering.
The newly participating units (Division of Physical Sciences and Henry Samueli School of Engineering and Applied Science) have yet to see an effect of the NSTP on faculty retention.
6. In our survey of faculty we asked about any possible buy-out of teaching, with only one faculty
member responding in the positive. On your campus, did any faculty member who participated in the program buy-out of their teaching assignment? If so, please explain the circumstances.
All NSTP applications are rigorously evaluated by departments, deans, and academic personnel offices to ensure that approved teaching loads are fulfilled. New course buy-outs are not permitted; however, those that were in place prior to program participation continue to be honored. At UCLA, several faculty participating in the program maintained previously negotiated buy-out agreements.
7. Has there been an effect, attributable to NSTP, on research productivity for either participant or
non-participant faculty in the units involved with the program? For example, did you find that participation in the program incentivized faculty to increase outside funding.
Although all participating units expressed confidence that the program serves as an incentive for increased research activity, they also noted the difficulty in measuring the effect. First, because most
4
enrolled faculty are already highly active in submitting grants to support their research activities, there is not likely to be an observable change in the number of grant submissions or research productivity. The lag between application and actual receipt of award, along with the extremely complex nature of why a given grant is funded and another is not, also make it difficult to establish a link between the NSTP and research productivity/outside funding. A compensation program similar to the NSTP has been in place in the Fielding School of Public Health for over 15 years. Approximately 12 years ago, faculty began to participate in greater numbers and since that time the School’s contracts and grants program has doubled. Although this trend cannot be wholly attributed to the NSTP, it is likely the NSTP will continue the trend.
8. Has graduate student support or postdoc hiring in the unit (for both NSTP participants and non-
participants) been positively or negatively impacted by the program?
NSTP participants are required to verify that they will not reduce funding for graduate students or postdocs on their applications. The Division of Life Sciences, Division of Physical Sciences, and Henry Samueli School of Engineering and Applied Science report no evidence of effects on these populations attributable to the NSTP. In the Fielding School of Public Health, the program has reportedly made a positive impact on the hiring of graduate student researchers and postdocs because of the increased number of contracts and grants funding and expanded research programs.
9. Do you have evidence that the program has had an effect on the number and/or size of grant awards
and indirect costs?
A similar program to the NSTP has been in place in the Fielding School of Public Health for over 15 years. Since the program’s inception, the school’s contracts and grants program has doubled. No evidence exists in any of the other three participating units that there has been an effect on the number or size of grant awards and indirect costs.
10. In this second year, have academic personnel review processes been affected by the trial program?
Only the Division of Life Sciences and the Fielding School of Public Health are in their second year of the program. The Division of Life Sciences has seen an impact on academic personnel staff. Extra care is needed by fund managers, Chairs, and the Dean’s office, to ensure that the fund source(s) the faculty plan to use to participate in NSTP are eligible and sufficient, and that the departments understand their share of any risk of participation. However, these personnel are all reportedly very pleased that their faculty members are able to participate in the program and understand that the additional review activities are necessary to sustain this program. The Division of Physical Sciences, Fielding School of Public Health, and Henry Samueli School of Engineering and Applied Science report no impact on academic personnel review processes.
5
11. Has departmental/school/climate and functioning been positively or negatively impacted as a result of the program?
The Division of Life Sciences, Fielding School of Public Health, and Henry Samueli School of Engineering and Applied Science each report that the program has had a positive effect on faculty morale. The Division of Physical Sciences did not have enough information to comment on departmental/school/climate in this first year of participation, other than to say that there has been no observable negative effect.
12. Some have envisioned that those not participating in the program might still benefit from it, perhaps
from the availability of funds in the contingency fund. Have any units or individuals not participating in the program benefited from the program in this first year?
The Fielding School of Public Health considers the benefits of the program to extend to non-participants because of the increased research, service, and public impact from the grants. The Division of Life Sciences reports a crucial benefit to non-participants of knowing the option to participate will be available to them in the future. The Henry Samueli School of Engineering and Applied Science and the Division of Physical Sciences have not yet seen benefits to non-participants.
13. Has the program affected the quality of teaching or research in the units? None of the participating units has a way to assess the impact of the program on the quality of teaching or research of their faculty.
UNIVERSITY OF CALIFORNIA, SAN DIEGO UCSD
BERKELEY DAVIS IRVINE LOS ANGELES MERCED RIVERSIDE SAN DIEGO SAN FRANCISCO
SANTA BARBARA SANTA CRUZ
OFFICE OF THE ASSOCIATE VICE CHANCELLOR 9500 GILMAN DRIVE ACADEMIC PERSONNEL LA JOLLA, CALIFORNIA 92093-0001
October 13, 2015 Vice Provost Susan Carlson Office of the President University of California 1111 Franklin Street Oakland, CA 94607-5200 Dear Susan: On behalf of Executive Vice Chancellor Subramani, I am pleased to provide you our annual report on Year 2 of the Negotiated Salary Trial Program (NSTP), or General Campus Compensation Plan (GCCP) as it is called at UC San Diego. In Year 1, we had 82 participants and in Year 2 we had 100 participants. Once again, the NSTP served as a vital tool for recruiting new faculty and retaining our current faculty by providing more market competitive salaries. The program proved even more popular in Year 2 as evidenced by a 22% growth in overall participation. Efforts by the divisional deans’ offices and departments to encourage more participation amongst female faculty proved effective with a 30% increase in the number of female enrollees. In addition, the average negotiated increment rose from 15% to 17%. In reviewing the Year 2 data, we felt it was important to assess any substantial changes in enrollees from Year 1. A total of 63 faculty members enrolled in both Year 1 and 2. Of the 19 faculty members who did not re-enroll in Year 2, 3 were due to separation from UC San Diego, 1 did not meet the good standing requirement in the second year, 9 did not have sufficient funding to continue, 5 chose to redirect their funding to other areas of their research program, and 1 opted to participate in the course buyout program instead. Many staff involved in the submission and approval of the proposals (including department fund managers, divisional deans’ offices, and the Academic Compensation office) felt more familiar with the program in Year 2. However, the affected offices are still adjusting to the significant workload increase related to administration of the program. Further improvements to the business process will be implemented throughout the pilot phase and beyond. Another significant complication has been both the timing and details of other faculty salary increases effective July 1. These decisions have come very late in the past two years. Delays add burden on staff time to implement base salary changes, summer salary, and GCCP. We request such decisions be implemented much earlier. Other benefits realized and cited in Year 1 of the program continued into Year 2. This included improved compliance with mandatory training and compliance with contract and grant reporting requirements.
The metrics and questions specified in your memo of September 10, 2015, are addressed below:
1. Accumulated contingency funds were not utilized in the Year 1 of the program. Our local implementation guidelines require that the contingency fund reach 20% at steady state before those funds can be redirected for other uses. As we required each enrollee to contribute only 10% to the contingency fund, steady state was not anticipated until the end of Year 2. Thus, contingency funds may not be redirected for other uses until Year 3 of the program.
It is important to note that one faculty member did request to use contingency funds during an unexpected leave of absence. However, the dean required the faculty member to first use an accumulated balance of unrestricted funds that had been “banked” over some years by the faculty member. Below is an excerpt of the guidance provided in response to the faculty member’s inquiry: “The academic divisions are responsible for developing guidelines for the use of GCCP contingency funds in their respective areas. There is no explicit requirement that the contingency fund be used in medical leave cases. It is at the discretion of the Dean’s Office to require faculty to use banked funds before requesting dispensation from the contingency fund…The guidelines do not include any guarantee that an individual’s contribution(s) to the contingency fund be returned for their own use.”
2. As we do not allow individuals to enroll in the program unless funding has been secured in advance, we do not expect funding shortfalls related to loss of the negotiated increment. For that reason, we are confident that the current contingency fund percentage is sufficient to support the program. Medical leaves may necessitate use of the contingency fund if a faculty member does not have banked funds available (reference the example cited in point 1 above). As medical leaves are infrequent, however, we expect the current contingency fund contributions will be sufficient to cover such costs.
3. Our recruitment priorities have not been altered based on the departments’ participation
in the program. Faculty FTE allocations at UC San Diego are based on strategic goals and priorities related to enrollment needs, diversity and excellence initiatives, research, scholarship, and other criteria.
4. As expected, the NSTP has been a contributing factor in the successful recruitment of
several faculty members in both Years 1 and 2 of the program. In Year 2, two newly hired Assistant Professors and one full Professor enrolled in the program. Departments again cited the NSTP as an important incentive during hiring negotiations.
5. Though we cannot show a direct causal correlation, we believe the NSTP has been a
key factor in the reduction of pre-emptive retention and retention cases. Combining Year 1 and Year 2 data, there has been a 54% reduction in pre-emptive cases and a 21% reduction in retention cases compared to the year prior to the NSTP pilot. We hypothesize that participating faculty are able to raise their salaries to more competitive market rates and thus have less incentive to seek out and entertain outside offers. Supporting this is the evidence that we were able to retain more than 90% of our faculty who were willing to negotiate with us when they had an outside offer; our success shows that these faculty members are happy and want to stay here. NSTP allows them to help themselves financially, which is the primary enticement from outside offers.
6. UC San Diego does not allow faculty who enroll in the NSTP to participate in the Faculty Leverage Buyout Program. One faculty member who enrolled in Year 1 of the NSTP opted out in Year 2 in order to participate in the course buyout program instead.
7. There is no effective way, beyond anecdotal evidence or qualitative faculty survey
results, to attribute changes in research productivity to the NSTP. The 22% increase in participation from Year 1 to Year 2 and the increase in the average negotiated increment are positive indicators that additional external funding was sought and obtained. Also, a representative sampling of the new enrollees in Year 2 found that up to 25% who had insufficient funds to enroll in the first year were able to secure sufficient resources to participate in the second year. About the same percentage delayed their participation until Year 2 because they felt uncertain about the program and their funding in Year 1.
8. At UC San Diego, graduate student support is generally cobbled together from multiple sources such as TA allocations, fellowships, and grant funding that are recorded at the departmental level and thus cannot be attributed to specific faculty. Changes in overall support may be impacted by the current population/year of study of the graduate students, revisions to allocation models and more. Therefore, it is not possible to show a direct correlation between NSTP participants and the graduate students they support. Before a request for NSTP participation is considered, the department chair must certify that the faculty member has fulfilled graduate student support obligations. The same holds true for postdoc support. Changes in postdoc hiring cannot be directly tied to a faculty member’s participation in the NSTP. Whether a postdoc is hired in a particular year depends on multiple factors including the availability of qualified postdocs, the status of research projects, etc. As our faculty recognize that postdocs are an important factor in the success of UC San Diego’s general research mission and, in many cases, key to the faculty member’s individual projects, it is unlikely that NSTP participation will lead to a decrease in postdoc hiring. As discussed above, 19 faculty members who enrolled in Year 1 did not to participate in Year 2. Five of these individuals reportedly opted out of participating a second year in order to redirect their resources to other areas of their research programs including graduate support.
9. It is not be possible to show a direct causal link between NSTP participation and the number and/or size of grant awards and indirect costs. It has been reported that the NSTP has served as a motivational factor for faculty to seek external funding for new projects in order to ensure participation in future years.
10. The Committee on Academic Personnel (CAP) reviews the good standing status of each
faculty proposed for NSTP participation. Beginning with Year 2 of the program, CAP requested the most recent review result for each proposed faculty member. CAP also reviewed the most recent file of individuals who had a ‘no change’ review in any of the three prior review periods. In Year 2, one faculty member was denied NSTP participation for not meeting the good standing criteria based on insufficient progress to warrant advancement in the most recent review. As per CAP’s recommendation, we continue to monitor the participation rates of female and underrepresented minority faculty members.
11. Feedback regarding the program continued to be positive in Year 2. The Executive Vice
Chancellor continues to encourage the deans and chairs to utilize the NSTP in recruitment and retention efforts.
12. As the contingency fund balance may not be redirected for use to support other faculty
or programs until Year 3 of the NSTP, there is nothing to report at this time.
13. There is no direct evidence that the NSTP affected the quality of teaching or research in the participating units but it likely serves to motivate faculty behavior in both areas. In order to enroll in the NSTP, faculty must meet good standing criteria which includes effective teaching and maintenance of a positive research trajectory.
After reviewing the participation and feedback of the first two years of the program, UC San Diego remains enthusiastic about the NSTP and hopeful for continuation of the program beyond the pilot period. It is contributing to recruitment successes, significantly to retention, and more broadly to faculty satisfaction. It is important to note that with more than 10% of faculty on the UC San Diego general campus now participating in this program, it will be virtually impossible to undo this program. Many existing and particularly new faculty are concerned about what will happen after the pilot phase is completed. Providing a mechanism that engages faculty directly in the effort to achieve market competitive salaries benefits the academic mission of the campus. The NSTP has been proven an effective and necessary tool to recruit and retain our world-class faculty. Sincerely,
Tamara Wall Associate Vice Chancellor
Academic Personnel
c: EVC Subramani Executive Director Tanaka AVC Palmer Director Maheu


![Better Profits through Better Projects - All Ohio 4-23-14 [Read-Only] · 2019-01-24 · Cost plus negotiated fee ... salary increases. Multiplier Times Salary No need to constantly](https://img.pdfslide.us/doc/110x75/5eb53dfbbdbb073b184ab9aa/better-profits-through-better-projects-all-ohio-4-23-14-read-only-2019-01-24.jpg)