Embed Size (px)
Citation preview
Negative Word-of-Mouth by Dissatisfied Consumers: A Pilot StudyAuthor(s): Marsha L. RichinsSource: The Journal of Marketing, Vol. 47, No. 1 (Winter, 1983), pp. 68-78Published by: American Marketing AssociationStable URL: http://www.jstor.org/stable/3203428Accessed: 28/09/2009 00:05
Your use of the JSTOR archive indicates your acceptance of JSTOR's Terms and Conditions of Use, available athttp://www.jstor.org/page/info/about/policies/terms.jsp. JSTOR's Terms and Conditions of Use provides, in part, that unlessyou have obtained prior permission, you may not download an entire issue of a journal or multiple copies of articles, and youmay use content in the JSTOR archive only for your personal, non-commercial use.
Please contact the publisher regarding any further use of this work. Publisher contact information may be obtained athttp://www.jstor.org/action/showPublisher?publisherCode=ama.
Each copy of any part of a JSTOR transmission must contain the same copyright notice that appears on the screen or printedpage of such transmission.
JSTOR is a not-for-profit organization founded in 1995 to build trusted digital archives for scholarship. We work with thescholarly community to preserve their work and the materials they rely upon, and to build a common research platform thatpromotes the discovery and use of these resources. For more information about JSTOR, please contact [email protected].
American Marketing Association is collaborating with JSTOR to digitize, preserve and extend access to TheJournal of Marketing.
http://www.jstor.org
Marsha L. Richins
Negative Word- of-Mouth by Dissatisfied
Consumers: A Pilot Study
Introduction M ARKETING firms have traditionally been in-
terested in customer satisfaction, and with good reason. Customers continue to purchase those prod- ucts with which they are satisfied, and in telling oth- ers about particularly pleasing products, they may in- fluence the brand perceptions of those with whom they communicate.
Prior to the 1970s little was published in the mar- keting literature about customer satisfaction. Partially in response to the consumer movement, however, in- terest in this topic rapidly grew. Several conferences were held (e.g., Day 1977, Hunt 1977) and articles began appearing in the marketing literature. A number of these studies discussed the appropriate ways to measure satisfaction levels (Andreasen 1977, West- brook 1980). Others investigated the causes and sources of dissatisfaction (Day and Landon 1976; Diamond, Ward and Faber 1976), and some ad- dressed the theoretical bases of satisfaction (Oliver 1980, Swan and Combs 1976). While work pro- gressed in this area, however, much less attention was
While marketing scholars have emphasized the importance of customer satisfaction, few studies have examined in detail consumers' responses to dissatisfaction. This study examines correlates of one possible response-telling others about the dissatisfaction-and identifies variables that dis- tinguish this response from others. Variables in- vestigated include the nature of the dissatisfac- tion, perceptions of blame for the dissatisfaction, and perceptions of retailer responsiveness. Mar- keting management and consumer behavior re- search implications are discussed.
given to consumers' reactions to dissatisfaction. Po- tential responses include (a) switching brands or re- fusing to repatronize the offending store, (b) making a complaint to the seller or to a third party, and (c) telling others about the unsatisfactory product or re- tailer.
The potential impact of these responses on a firm can be significant. One nationwide study (Technical Assistance Research Programs 1979) reported that depending on the nature of the dissatisfaction, from 30 to over 90% of dissatisfied respondents did not intend to repurchase the brand involved. Data re- ported by Diener and Greyser (1978) indicated that 34% of those dissatisfied with a personal care product told others about their dissatisfaction. If the number of consumers experiencing dissatisfaction is high enough, such responses may have lasting effects in terms of negative image and reduced sales for the firm.
Many firms have not worried about these negative effects because they believed few consumers were dissatisfied with their products. Managers tended to use complaint rates as dissatisfaction indicators and assumed that if complaint rates are low, overall dis- satisfaction is low and thus the negative effects de- scribed above are neglible. A number of studies (Best and Andreasen 1977, Day and Landon 1976) have
Journal of Marketing Vol. 47 (Winter 1983), 68-78. 68 / Journal of Marketing, Winter 1983
Marsha L. Richins is Assistant Professor of Marketing, Louisiana State University.
challenged this assumption. While estimates of the incidence of complaints in response to dissatisfaction vary, it is generally accepted that the incidence of complaints is lower than the incidence of either of the other responses. In addition, the vast majority of com- plaints are made at the retail level, and when small- ticket items are involved, information about the com- plaint is rarely passed on to manufacturers. Thus, fre- quency of reported complaints, especially at the man- ufacturer's level, may grossly underestimate consumer dissatisfaction and the firm's vulnerability to negative word-of-mouth; brand switching will be greater than the number of registered complaints would lead man- agers to believe.
While little research has studied responses to dis- satisfaction directly, some areas of the consumer be- havior literature appear at least indirectly relevant to the three possible responses.
Repeat Purchase Behavior
Repeat purchase behavior is most often addressed in brand loyalty research. Much of this literature has been concerned with conceptualizing, measuring and modeling brand loyalty. The effects of a dissatisfac- tory experience on repeat purchase behavior have rarely been investigated directly.
One study (Technical Assistance Report Programs 1979) reported that those dissatisfied customers who made a complaint about their dissatisfaction reported higher repurchase intentions than those who did not complain, even if their complaint was not satisfactor- ily handled. Newman and Werbel (1973) noted that consumers not fully satisfied with a brand are less likely to repurchase that brand than satisfied cus- tomers. Many researchers believe that brand loyalty includes a positive attitude or preference toward a brand as well as simple repeat purchase (Jacoby and Chestnut 1978). Beyond this, however, little is known about the influence of dissatisfaction on brand loyalty and switching.
Complaint Behavior
The second possible response to dissatisfaction- making a complaint in an attempt to remedy the dis- satisfaction-has received more attention in the lit- erature. This research appears to have grown directly out of the consumer movement, and perhaps the ma- jority of the studies have been based on analysis of private or government agency complaint files. Some generalizations that have emerged from research on consumer complaining include the following:
* Those who complain when dissatisfied tend to be members of more upscale socioeconomic groups than those who do not complain (War- land, Herrmann and Willitts 1975).
* Personality characteristics, including dogma- tism, locus of control, and self-confidence, are only weakly related to complaint behavior, if at all (Settle and Golden 1974, Zaichkowsky and Liefeld 1977).
* The severity of the dissatisfaction or problems caused by the dissatisfaction is positively re- lated to complaint behavior (Lawther, Krishnan and Valle 1979; Swan and Longman 1973).
* The greater the blame for the dissatisfaction placed on someone other than the one dissat- isfied, the greater the likelihood of complaint action (Lawther, Krishnan and Valle 1979; Valle and Koeske 1977).
* The more positive the perception of retailer re- sponsiveness to customer complaints, the greater the likelihood of complaint action (Grabicke 1980; Granbois, Summers and Frazier 1977).
Word-of-Mouth
Word-of-mouth (WOM) behavior, the third response to dissatisfaction, has received the least attention of all three areas and is often subsumed under the opin- ion leadership rubric. In applying opinion leadership findings to dissatisfaction responses, however, a num- ber of limitations become evident. Most writers have considered only positive and not negative word-of- mouth (though it is mentioned by both Arndt (1968) and Dichter (1966)), and it is usually discussed in terms of informing others about new products (dif- fusion of innovations) rather than consumer commu- nications about existing products. Finally, those en- gaging in negative WOM activities may not actually be opinion leaders. A review of work investigating impacts of negative information on consumers (Wein- berger, Allen and Dillon 1981) listed only one study (Arndt 1968) investigating negative word-of-mouth. Thus this literature sheds little light on dissatisfaction response. While a few studies in the dissatisfaction literature have examined negative WOM activities, these have been limited to reporting the incidence of this behavior. No published research has examined why some dissatisfied consumers engage in WOM while others do not, nor have correlates of negative word-of-mouth activity been investigated. This is clearly a gap in understanding consumer behavior, since several researchers (Lutz 1975, Wright 1974) have found that consumers seem to place more weight on negative information in making evaluations (see, however, Scott and Tybout 1981). In addition, it is well-accepted by marketing scholars and managers that nonmarketing dominated sources of information are given substantial weight by consumers in forming opinions and making product decisions.
Negative Word-of-Mouth by Dissatisfied Consumers: A Pilot Study / 69
Scope of the Empirical Investigation
The study reported here investigates WOM commu- nication as a response to dissatisfaction. Its first ob- jective is to determine whether the same variables that affect complaining also affect WOM. Of the many variables showing a relationship to complaining, three were chosen for this investigation: Severity of the dis- satisfaction or problems caused by the dissatisfaction, attributions of blame for the dissatisfaction, and per- ceptions of retailer responsiveness to complaints. Three hypotheses relevant to this objective were de- veloped.
H1: As the severity of the problem associated with a dissatisfaction increases, the ten- dency to engage in negative WOM ac- tivities increases.
H2: The greater the blame for the dissatis- faction placed on members of the distri- bution channel (marketing institutions), rather than on the consumer, the greater the tendency to engage in negative WOM.
H3: The more negative the perception of re- tailer responsiveness to complaints about dissatisfaction, should they be regis- tered, the greater the likelihood the dis- satisfied consumer will engage in nega- tive WOM. If an individual is dissatisfied with a product but believes attempts to achieve remedy through marketing chan- nels will be either unsuccessful or re- quire extensive effort, it is conceivable that a less risky and less effortful re- sponse, telling others about the dissatis- faction, will be undertaken.
The second objective is to identify variables de- termining which response to dissatisfaction, among those available, a consumer will make. Some of these responses may be ranked a priori by the level of effort involved. Doing nothing, for instance, requires no effort or resources, while making a complaint often involves a great deal of effort and inconvenience. Telling others about the dissatisfaction requires a low to intermediate level of effort expenditure. Brand switching is more difficult to rank. The effort in- volved here depends in part on the availability of ac- ceptable substitutes at retail stores the consumer reg- ularly patronizes, search required to identify these substitutes, and other variables. For this study, vari- ables influencing the three responses ranked on effort were examined to determine which response to dis- satisfaction a consumer may make.
One variable that may influence consumer re-
sponse is dissatisfaction severity. If a dissatisfaction is very minor, a consumer may take no action at all. For very serious dissatisfactions, however, a great deal of effort might be expended in response. A sec- ond variable is blame attribution. If the consumer blames him/herself for the dissatisfaction, e.g., through carelessness in the choice or use of the product, no action may be taken. Thus:
H4: The more serious the problem associated with a dissatisfaction, the greater the ef- fort a consumer is likely to expend in response to the dissatisfaction.
H5: The greater the blame for the dissatis- faction placed on marketing institutions, the greater the effort a consumer is likely to expend in response to the dissatisfac- tion.
For those dissatisfactions serious enough to arouse some action, the choice of action depends on a num- ber of variables. One important variable that may in- fluence this choice is consumer perception of retailer responsiveness.
H6: For those consumers taking some action in response to dissatisfaction, the less positive the perception of retailer respon- siveness should a complaint be regis- tered, the greater the likelihood the ac- tion will involve WOM but not complaint behavior.
Data Collection The investigation was carried out in two stages. In exploratory work, depth interviews were conducted with eight adult consumers to probe their beliefs about the variables included in the hypotheses. Next, ex- ploratory questionnaires containing open-end items were administered to 53 adult consumers and 72 col- lege students to identify relevant aspects of unsatis- factory experiences and complaint situations and to identify attributions consumers make. Based on this work and extensive pretesting, a questionnaire was developed for use in the descriptive phase of research.
The final version of the questionnaire consisted of four major sections: (1) identification of the dissatis- faction, problem severity and response; (2) attribu- tions of blame and responsibility for the dissatisfac- tion; (3) perceptions of the complaint situation and the costs and benefits associated with it; and (4) demo- graphic items. The questionnaire was administered to a sample of middle to upper middle-class adult male and female consumers in Austin, Texas. All respond- ents were prescreened, and only those who had ex- perienced a dissatisfaction with either a clothing item
70 / Journal of Marketing, Winter 1983
or a small or large appliance within the prior six months were questioned. These two product cate- gories were chosen because they are relatively dissim- ilar, yet adult consumers of both sexes can be ex- pected to have had experience with them. The use of different product classes in the analysis also increases the generalizability of findings beyond a single prod- uct class if relationships among variables are similar for the two classes.
Interviewers visited respondents' homes, pre- screened respondents, dropped off the questionnaires and returned the following day to pick up completed forms. Two call-backs were used for initial contact and three call-backs for questionnaire pick-up when necessary. Of the 261 individuals who reported dis- satisfactions, completed questionnaires were obtained from 214, a response rate of 82%. Of this number 13 were eliminated for incomplete responses on one or more sections of the survey, leaving a sample size of 201 cases for analysis. A breakdown of the sample by sex and relevant product is shown below:
Males Females
Total
Appliances Clothing 40 19 80 62
120 81
Total
59 142 201
WOM and complaint rates did not differ significantly for the two product groups (WOM X2 = 1.50, df = 1, p = .22; complaint x2 = 1.14, df = 1, p = .29).
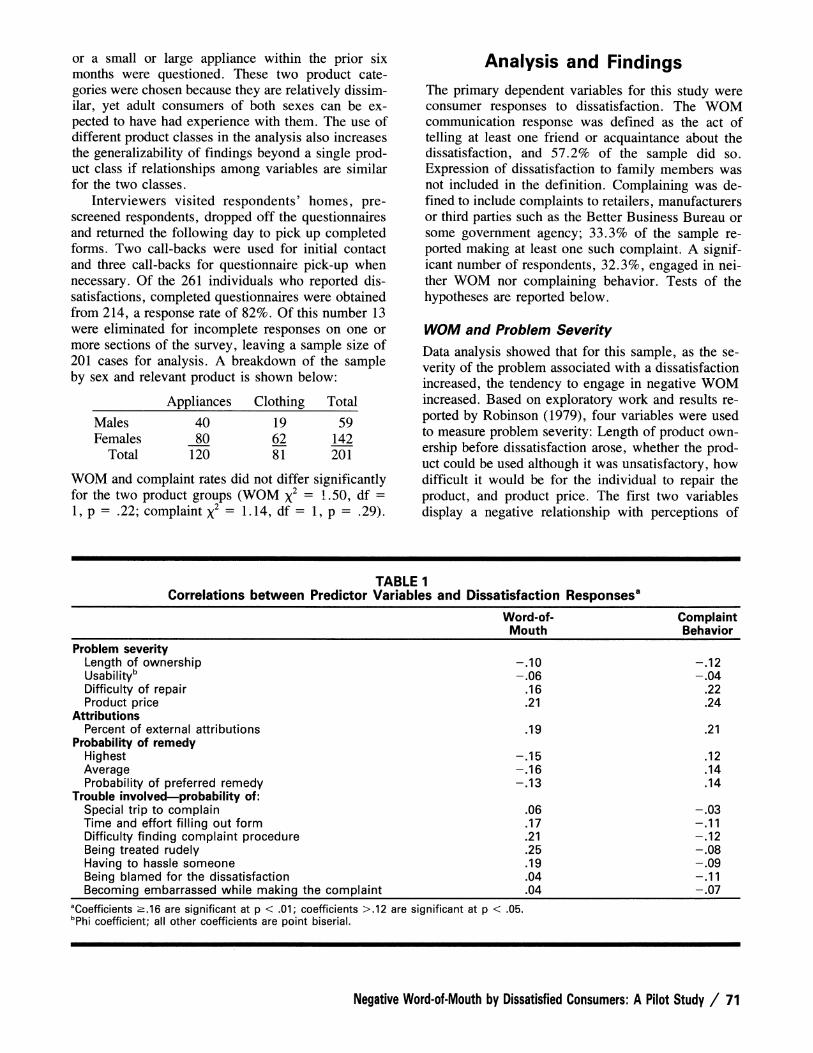
Analysis and Findings The primary dependent variables for this study were consumer responses to dissatisfaction. The WOM communication response was defined as the act of telling at least one friend or acquaintance about the dissatisfaction, and 57.2% of the sample did so. Expression of dissatisfaction to family members was not included in the definition. Complaining was de- fined to include complaints to retailers, manufacturers or third parties such as the Better Business Bureau or some government agency; 33.3% of the sample re- ported making at least one such complaint. A signif- icant number of respondents, 32.3%, engaged in nei- ther WOM nor complaining behavior. Tests of the hypotheses are reported below.
WOM and Problem Severity Data analysis showed that for this sample, as the se- verity of the problem associated with a dissatisfaction increased, the tendency to engage in negative WOM increased. Based on exploratory work and results re- ported by Robinson (1979), four variables were used to measure problem severity: Length of product own- ership before dissatisfaction arose, whether the prod- uct could be used although it was unsatisfactory, how difficult it would be for the individual to repair the product, and product price. The first two variables display a negative relationship with perceptions of
Correlations between Predictor
Problem severity Length of ownership Usabilityb Difficulty of repair Product price
Attributions Percent of external attributions
Probability of remedy Highest Average Probability of preferred remedy
Trouble involved-probability of: Special trip to complain Time and effort filling out form Difficulty finding complaint procedure Being treated rudely Having to hassle someone Being blamed for the dissatisfaction Becoming embarrassed while making the complaint
aCoefficients >.16 are significant at p < .01; coefficients >.12 are significant at p < .05. bPhi coefficient; all other coefficients are point biserial.
Negative Word-of-Mouth by Dissatisfied Consumers: A Pilot Study / 71
TABLE 1 Variables and Dissatisfaction Responses8
Word-of- Mouth
Complaint Behavior
.10
.06
.16
.21
-.12 -.04
.22
.24
.19
.15
.16
.13
.21
.12
.14
.14
.06
.17
.21
.25
.19
.04
.04
-.03 -.11 -.12 -.08 -.09 -.11 -.07
I
I
problem severity and thus with WOM, while the oth- ers are positively related. Length of ownership and product cost were measured on continuous scales; us- ability was measured as a bivalent dichotomous vari- able, and difficulty of repair was measured on a 5- point scale. Point biserial correlations between these variables and WOM are reported in Table 1. For com- parison, correlations with complaint behavior are also shown. Since correlations for the two separate product classes are not significantly different for any of the variables, only correlations for the combined sample are reported. While all correlations are of the expected sign, those calculated for length of ownership and product usability are not significant at p < .05.
These analyses tend to support HI, although not strongly. The more serious the problem associated with the dissatisfaction, the more likely consumers are to tell others about it.
WOM and Attributions
H2 proposed that when greater blame for a dissatis- faction is placed on marketing institutions than on the consumer, there will be more negative WOM. This hypothesis was also supported. The survey instru- ment, developed from depth interviews and explora- tory questionnaires, contained a list of 26 possible attributions of blame one might apply to a dissatis- faction. One-half of these placed the blame externally (e.g., the dissatisfaction occurred because the quality of the materials and/or workmanship was inferior) and one-half were internal attributions (e.g., the dis- satisfaction occurred because the respondent didn't adequately inspect the product before buying it). Re- spondents checked as many attributions as applied to the particular dissatisfaction situation.
To control for variability in number of responses checked, H2 was tested using an index measure. The total number of external attributions indicated by each respondent was divided by the total number of attri- butions indicated, yielding a percentage measure. A respondent marking three attributions, two of them external, would thus score .67 on this index. Point biserial correlations between this index and WOM is .19, as reported in Table 1. As hypothesized, those individuals marking a higher percentage of external attributions of blame are more likely to tell others about their dissatisfaction. Since an index of percent- age of internal attributions is the exact complement of the external index, it would show the same level of correlation with WOM but in the opposite direc- tion. Thus, external attributions of blame are posi- tively related to WOM, and internal attributions neg- atively related.
WOM and Retailer Responsiveness
Retailer responsiveness can be measured on two di- mensions. One dimension is the retailer's willingness to provide a remedy for the dissatisfaction should a consumer complain. The second dimension measures the extent to which the retailer makes the complaint handling mechanism available, including the number of barriers a consumer may face in making a com- plaint. Analysis indicated that both dimensions relate to negative WOM in response to a dissatisfaction.
To evaluate the first dimension, respondents were asked to report on a four-point scale the likelihood of receiving each of three possible remedies should they complain: repair of the product, replacement or refund of the purchase price. They also reported which of these three remedies they most preferred.
The nature of the product involved in the dissat- isfaction undoubtedly affects consumers' expectations of remedy and the form of remedy. Appliances, es- pecially larger ones, are usually repaired rather than replaced if they are faulty. For less expensive items such as clothing or small appliances, replacement or refund of the purchase price is a more likely remedy than product repair. Because of the diverse nature of the product classes involved in this study, measures independent of these product influences were neces- sary. Three measures were used: the highest perceived probability for any of the three remedies, the average of the probabilities that each of the three remedies would occur, and the perceived likelihood of receiv- ing the remedy the respondent indicated he/she would most prefer. The correlations between these measures and WOM are reported in Table 1. Those individuals who have low confidence in the effectiveness of mak- ing complaints are more likely to tell others about their dissatisfactions than those expecting remedy.
With regard to the inconvenience or barriers de- terring a complaint, respondents were asked a series of questions concerning their perceptions of com- plaining and the complaint interaction. Five items in this series related directly to the trouble involved in making a complaint and two concerned psychological variables. Respondents were asked to rate the likeli- hood of each event occurring. Point biserial correla- tions between these perceptions and WOM are pre- sented in Table 1. Neither of the psychological variables showed a relationship with WOM, nor did the more objective variable of making a special trip to the store to complain. This latter finding is no doubt due to the extremely low variance on this item, with 82% of total sample respondents indicating that it was somewhat to very likely that a special trip would be required. Though the relationships shown in Table 1 are not extremely strong, they do support
72 / Journal of Marketing, Winter 1983
H3: the more negative a consumer's perceptions of retailer responsiveness to consumer complaints, the more likely that individual is to engage in negative WOM.
Problem Severity, Attributions and Consumer Action The remaining analyses presented in this report con- cern consumers' choices of action once dissatisfaction occurs. For the analyses reported in this section, the sample was divided into three groups depending on responses to dissatisfaction. Sixty-five respondents in the sample neither complained nor told others about their dissatisfaction experience, 69 engaged in WOM activities but did not complain, and 67 actually made complaints to the retailer or manufacturer involved. Some individuals in this latter group engaged in WOM in addition to making a complaint. It was as- sumed that members of the first group had made the least effort in response to the dissatisfaction, members of the third group had made the most effort, while the second group exerted an intermediate level of effort.
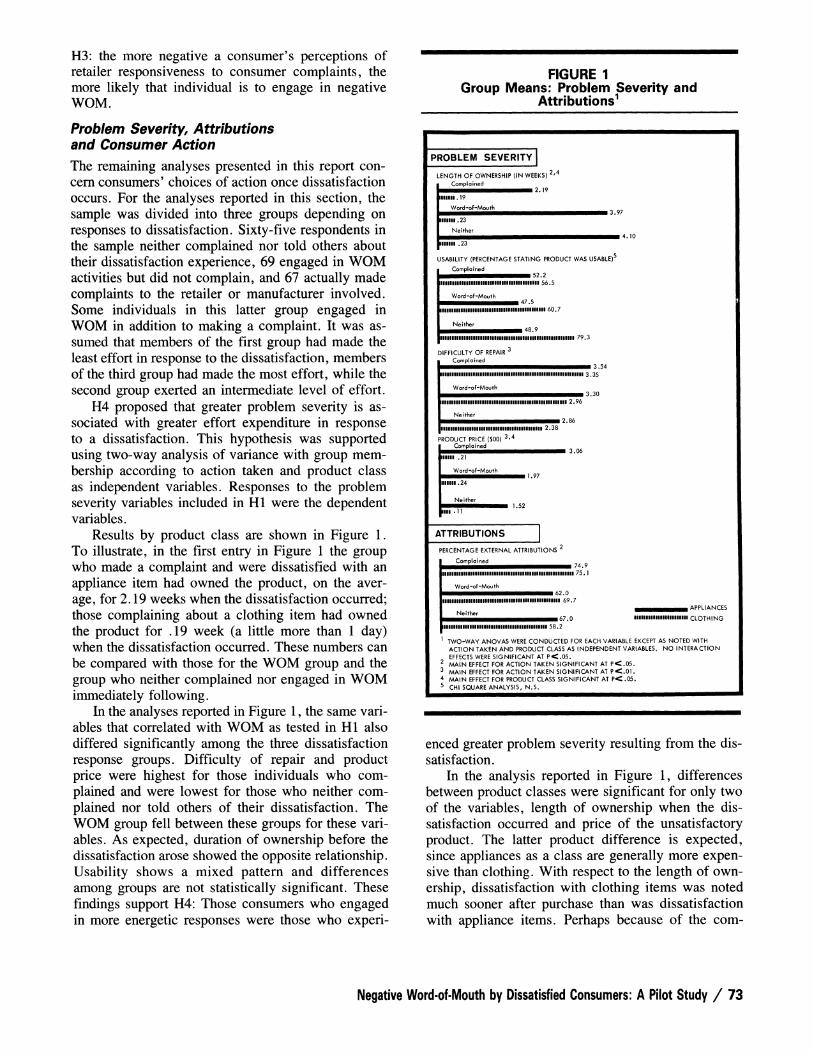
H4 proposed that greater problem severity is as- sociated with greater effort expenditure in response to a dissatisfaction. This hypothesis was supported using two-way analysis of variance with group mem- bership according to action taken and product class as independent variables. Responses to the problem severity variables included in HI were the dependent variables.
Results by product class are shown in Figure 1. To illustrate, in the first entry in Figure 1 the group who made a complaint and were dissatisfied with an appliance item had owned the product, on the aver- age, for 2.19 weeks when the dissatisfaction occurred; those complaining about a clothing item had owned the product for .19 week (a little more than 1 day) when the dissatisfaction occurred. These numbers can be compared with those for the WOM group and the group who neither complained nor engaged in WOM immediately following.
In the analyses reported in Figure 1, the same vari- ables that correlated with WOM as tested in HI also differed significantly among the three dissatisfaction response groups. Difficulty of repair and product price were highest for those individuals who com- plained and were lowest for those who neither com- plained nor told others of their dissatisfaction. The WOM group fell between these groups for these vari- ables. As expected, duration of ownership before the dissatisfaction arose showed the opposite relationship. Usability shows a mixed pattern and differences among groups are not statistically significant. These findings support H4: Those consumers who engaged in more energetic responses were those who experi-
FIGURE 1 Group Means: Problem Severity and
Attributions'
PROBLEM SEVERITY ) LENGTH OF OWNERSHIP (IN WEEKS) 2,4
Complained 2. 19
11 19
Word-of-Mou th 3.97
Jm,.23 Neither
4.10 3"1"1" .23
USABILITY (PERCENTAGE STATING PRODUCT WAS USABLE)5
Complained 52.2
i11Ulllll111111111111lllll11111UlUllUl 56.5
Word-of-Mouth 47.5
l1ullllllllllllluuullllllllllllUllllllll l60.7
Neither 48.9
I~~~~~~~lllllllllllllllllllll lll lll l ~79.3
DIFFICULTY OF REPAIR 3
Complained 3 54
IIIIhhhIIIIIIhhhIIIII hIhIIIIIhIIIIIIII IlUl llllh 3 35
Word-of-Mouth 3.30
111llllllll111111111111l1111111111111 l111111 2.96
Neither 2.86
l*llUllllllllUlulluui lllaulluu llllmm l 2.38
PRODUCT PRICE ($00) 3,4 Complained 3.06
nue .21
Word-of-Mouth 1 .97
.24
Neither 1.52
l .11
ATTRIBUTIONS
PERCENTAGE EXTERNAL ATTRIBUTIONS 2
Complained 74 u Immmu,.uuumm.m"|||||" I.u,|Iuuuuummm.uuu|Illlllll 75. 1
Word-of-Mouth 62.0
~lIIIIIIIIIIIIIIIIIIIIIlUlUIIIIII 69.7
H Iher APPLIANCE 67.0 llIIEIIIIIIIIIElUlII CLOTHING
IIIIIIIIlUlllllUllllUllUllll 58.2
TWO-WAY ANOVAS WERE CONDUCTED FOR EACH VARIABLE EXCEPT AS NOTED WITH ACTION TAKEN AND PRODUCT CLASS AS INDEPENDENT VARIABLES. NO INTERACTION EFFECTS WERE SIGNIFICANT AT P<.05.
2 MAIN EFFECT FOR ACTION TAKEN SIGNIFICANT AT P.05. 3 MAIN EFFECT FOR ACTION TAKEN SIGNIFICANT AT P<.01. 4 MAIN EFFECT FOR PRODUCT CLASS SIGNIFICANT AT P< .05. 5 CHI SQUARE ANALYSIS, N.S.
ES
3
enced greater problem severity resulting from the dis- satisfaction.
In the analysis reported in Figure 1, differences between product classes were significant for only two of the variables, length of ownership when the dis- satisfaction occurred and price of the unsatisfactory product. The latter product difference is expected, since appliances as a class are generally more expen- sive than clothing. With respect to the length of own- ership, dissatisfaction with clothing items was noted much sooner after purchase than was dissatisfaction with appliance items. Perhaps because of the com-
Negative Word-of-Mouth by Dissatisfied Consumers: A Pilot Study / 73
I
M
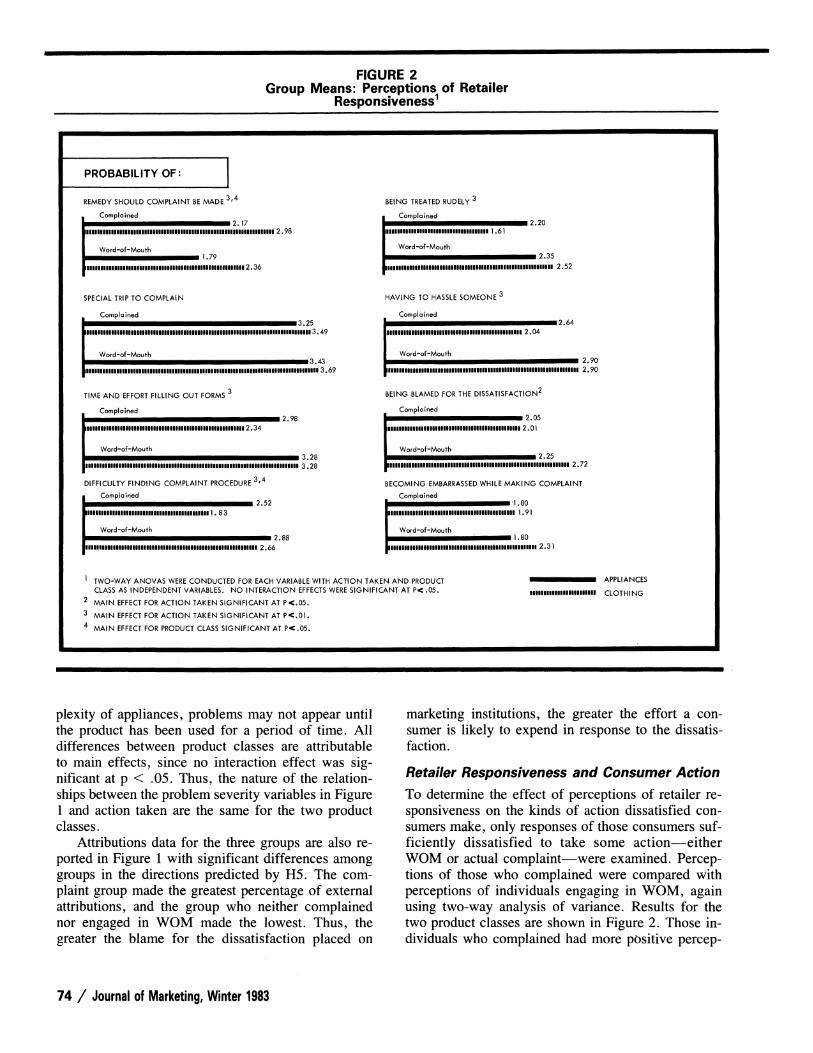
FIGURE 2 Group Means: Perceptions of Retailer
Responsiveness1
PROBABILITY OF:
REMEDY SHOULD COMPLAINT BE MADE 3'4
SPECIAL TRIP TO COMPLAIN
Complained I3.25
, III l UlIIIIIIIIIIIIIIIIIIIIIIIUIUIIIIIIII IIIUlUUlII EU mENU 3.49
Word-of-Mouth l 3.43
Ilnn llnnunluulnn l nnnnnUlllllnUIulluuuuuiuuuuuUuiuIIuuUlU lnhIU l 3.69
TIME AND EFFORT FILLING OUT FORMS 3
Complained 2.98
llEUEllllllllllllllllllllllllllllll|Ul IUlllllllllllllU 2.34
Word-of-Mouth
DIFFICULTY FINDING COMPLAINT PROCEDURE 3'4
* Complained
IU IIIIIIIIIIIIIIIIIIIIIIUlIIIIIIi11111 iiE 1 . 83
Word-of-Mouth
2.52
(1~liiiiiiiiiiiiiiiiiiiniiiiiii 2.6688 Illlllllllllllllllllllllllllllllllllllllllllllllllllllllllllll 2.66
3.28 3.28
BEING TREATED RUDELY 3
Complained 2.20 I 111UUUU11111111111111111111111111 1.61
Word-of-Mouth 2.35
I In unUlllllllllll UIn1111 3llllUnUln n lllllllnl 2.52
HAVING TO HASSLE SOMEONE 3
Complained -2.64
Illllllllllllllllllllllllllllllllllllllllll 2.04
Word-of-Mouth
Ull llEEIIIIEIIIIIIIIIIEEIIIUlIEIEIIIIIII EIIEIIIIIEIIIIIIII
BEING BLAMED FOR THE DISSATISFACTION2
Complained 2.05
1111111111111111111111111111111111111111 2.01
Word-of-Mouth 2.25
EEEEEEE1 1 E1IIEE111111111111111111lllIIIIIIIII IIIU IEEEIIIIIIUU U
m 2.90 11 2.90
2.72
BECOMING EMBARRASSED WHILE MAKING COMPLAINT
Complained 1 .80
I II IIIII I I III11111111111111111111111111111 1.91
Word-of-Mouth 1 .80
I. IIIIIIg*ImmIIIuIuIm IIIIIIIIIIIIilimuum"ili||1 2.31
1 TWO-WAY ANOVAS WERE CONDUCTED FOR EACH VARIABLE WITH ACTION TAKEN AND PRODUCT CLASS AS INDEPENDENT VARIABLES. NO INTERACTION EFFECTS WERE SIGNIFICANT AT P< .05.
2 MAIN EFFECT FOR ACTION TAKEN SIGNIFICANT AT P<.05.
3 MAIN EFFECT FOR ACTION TAKEN SIGNIFICANT AT P<.01.
MAIN EFFECT FOR PRODUCT CLASS SIGNIFICANT AT P<.05.
plexity of appliances, problems may not appear until the product has been used for a period of time. All differences between product classes are attributable to main effects, since no interaction effect was sig- nificant at p < .05. Thus, the nature of the relation- ships between the problem severity variables in Figure 1 and action taken are the same for the two product classes.
Attributions data for the three groups are also re- ported in Figure 1 with significant differences among groups in the directions predicted by H5. The com- plaint group made the greatest percentage of external attributions, and the group who neither complained nor engaged in WOM made the lowest. Thus, the greater the blame for the dissatisfaction placed on
marketing institutions, the greater the effort a con- sumer is likely to expend in response to the dissatis- faction.
Retailer Responsiveness and Consumer Action
To determine the effect of perceptions of retailer re- sponsiveness on the kinds of action dissatisfied con- sumers make, only responses of those consumers suf- ficiently dissatisfied to take some action-either WOM or actual complaint-were examined. Percep- tions of those who complained were compared with perceptions of individuals engaging in WOM, again using two-way analysis of variance. Results for the two product classes are shown in Figure 2. Those in- dividuals who complained had more positive percep-
74 / Journal of Marketing, Winter 1983
APPLIANCES
IElUllllllllllnllllll CLOTHI NG
I -
L I I
Il
tions of retailer responsiveness on all variables except two, relating to the likelihood of having to make a special trip to complain and the likelihood of becom- ing embarrassed while complaining.
There were significant product differences for two of the variables reflecting retailer responsiveness- consumers who experienced dissatisfaction with an appliance had lower expectations of remedies for their dissatisfactions and greater expectations of experienc- ing difficulty in finding the appropriate complaint pro- cedure should they complain. Since these product dif- ferences again are due only to main effects, the nature of the relationship between retailer responsiveness and action taken are the same for the two product classes.
These analyses provide rather strong support for H6. If a consumer is dissatisfied enough to take some action in response to a dissatisfaction, the less positive the perception of retailer responsiveness, the greater the likelihood the action will involve WOM but not complaint behavior. In examining the results for this and other hypotheses, however, caution is appropriate since the use of multiple univariate tests increases the chances of finding statistical significance.
Combined Effects
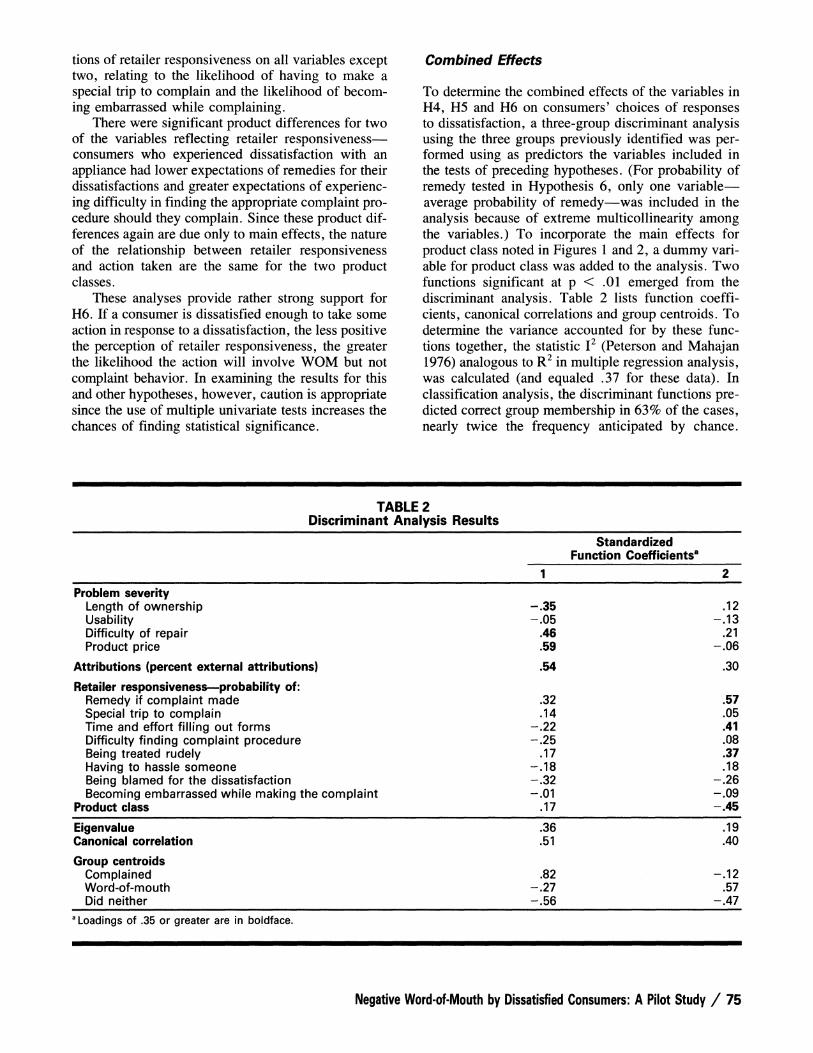
To determine the combined effects of the variables in H4, H5 and H6 on consumers' choices of responses to dissatisfaction, a three-group discriminant analysis using the three groups previously identified was per- formed using as predictors the variables included in the tests of preceding hypotheses. (For probability of remedy tested in Hypothesis 6, only one variable- average probability of remedy-was included in the analysis because of extreme multicollinearity among the variables.) To incorporate the main effects for product class noted in Figures 1 and 2, a dummy vari- able for product class was added to the analysis. Two functions significant at p < .01 emerged from the discriminant analysis. Table 2 lists function coeffi- cients, canonical correlations and group centroids. To determine the variance accounted for by these func- tions together, the statistic I2 (Peterson and Mahajan 1976) analogous to R2 in multiple regression analysis, was calculated (and equaled .37 for these data). In classification analysis, the discriminant functions pre- dicted correct group membership in 63% of the cases, nearly twice the frequency anticipated by chance.
TABLE 2 Discriminant Analysis Results
Standardized Function Coefficients'
1 2 Problem severity
Length of ownership -.35 .12 Usability -.05 -.13 Difficulty of repair .46 .21 Product price .59 -.06
Attributions (percent external attributions) .54 .30
Retailer responsiveness-probability of: Remedy if complaint made .32 .57 Special trip to complain .14 .05 Time and effort filling out forms -.22 .41 Difficulty finding complaint procedure -.25 .08 Being treated rudely .17 .37 Having to hassle someone -.18 .18 Being blamed for the dissatisfaction -.32 -.26 Becoming embarrassed while making the complaint -.01 -.09
Product class .17 -.45
Eigenvalue .36 .19 Canonical correlation .51 .40
Group centroids Complained .82 -.12 Word-of-mouth -.27 .57 Did neither -.56 -.47
aLoadings of .35 or greater are in boldface.
Negative Word-of-Mouth by Dissatisfied Consumers: A Pilot Study / 75
I ,
Thus, the three sets of variables used in this study concerning consumers' perceptions of the dissatisfac- tion and retailer responsiveness do a relatively good job of predicting consumer response to a specific dis- satisfaction.
Earlier it was suggested that severity of the prob- lem situation caused by the dissatisfaction and attri- butions of blame determines whether action is taken in response to dissatisfaction and the effort involved in this response. Further, perceptions of retailer re- sponsiveness affect which response should be in- voked, if any occur at all. This hypothesis receives further support in an examination of the discriminant functions and group centroids shown in Table 2. The items loading most highly on Function 1 relate to problem severity and attributions; those loading highly on function 2 relate primarily to perceptions of retailer responsiveness and product class. With respect to group centroids, the complaining group scored high- est of the three groups on function 1, the WOM group scored highest on function 2, and the group who nei- ther complained nor told others of their dissatisfaction scored the lowest on both functions. This result fur- ther supports the contention that problem severity is the crucial determinant of effort of response, while the choice between WOM and complaint behavior is influenced by perceptions of retailer responsiveness.
Conclusions and Implications This study has shown that the nature of the dissatis- faction problem, consumers' attributions of blame for the dissatisfaction and perceptions of the complaint situation are related to responses to dissatisfaction. Further, these relationships apply to varied product classes.
These findings have several implications for man- agement. When a minor dissatisfaction is experi- enced, consumers' responses often are minimal. Most often consumers neither complain nor spread negative reports of the product involved. When the dissatis- faction is serious enough, consumers tend to com- plain, regardless of other factors in the situation. It is at moderate levels of dissatisfaction that manage- ment policy may have the most impact. If complaints are encouraged, the retailer has the chance to remedy legitimate complaints and win back a customer who may also make positive reports to others, enhancing goodwill. Even if the complaint is not settled to the consumer's satisfaction, he/she is more likely to re- purchase than if no complaint is made (Technical Assistance Research Programs 1979). If complaints are discouraged, fewer consumers may indeed com- plain; instead, they may tell others of their unsatis- factory experiences and may not repurchase the prod- uct in the future. Some level of dissatisfaction is
inevitable in the marketplace. Even with conscien- tious quality control, there will be some defects and some dissatisfied customers. But the way manage- ment deals with these dissatisfactions can have im- portant impacts on brand and store image.
There are a number of steps a marketing institu- tion can take to decrease the impact of dissatisfactions that occur and lessen the incidence of negative word- of-mouth. At the least, they need to show their cus- tomers that they are responsive to legitimate com- plaints. Manufacturers may do this through detailed warranty and complaint procedure information on la- bels or in package inserts. Some companies have even offered toll-free telephone numbers to receive cus- tomer comments and complaints. Retailers can show their receptivity through store signs, inserts in monthly customer billings and by positive employee attitudes. Perhaps the best way to show responsiveness to cus- tomer complaints is by prompt and courteous handling of legitimate dissatisfactions. Such responsiveness may avert negative WOM and may even create pos- itive WOM.
This study noted that consumer perceptions of in- stitutional responsiveness depended on which product was the source of dissatisfaction. Perceived respon- siveness for complaints about appliance items was lower than for clothing items. Consumer perceptions are usually (though not always) based either on prior personal experience or reports of the prior experiences of others. It is undoubtedly more expensive to remedy a dissatisfaction concerning an appliance because these items are more expensive. Retailers may be re- luctant to make these expenditures and may commu- nicate this reluctance by making complaint procedures more difficult. Also, dissatisfactions with appliance items tend to occur farther from the point of purchase than dissatisfactions with clothing items. By the time the dissatisfaction occurs, the retailer's warranty on the product may have expired, so the complaint is referred to the manufacturer who usually provides a longer warranty period. While the manufacturer may indeed remedy the dissatisfaction, this referral step adds more paperwork and delay, sometimes creating the impression of unresponsiveness.
In dealing with complaints, marketing institutions must examine not only the costs of the remedy but the costs of not settling the complaint as well. These latter costs are, of course, more difficult to assess, but managers must be aware that they include the poten- tial for negative WOM in addition to the potential lost repeat business.
This study also has important implications for con- sumer behavior researchers. While it has shown that a number of variables both within and outside man- agement control affect consumer responses to dissat- isfaction, this single study has only scratched the sur-
76 / Journal of Marketing, Winter 1983
face. One area needing further investigation is brand
switching in response to dissatisfaction. Despite re- search on brand loyalty, it is not clear how frequently brand switching in response to dissatisfaction occurs, how the nature of the dissatisfaction influences
switching, what kinds of products are more suscep- tible to this response, and a host of other details. The
phenomenon of negative word-of-mouth also bears further investigation, including determination of the
extent of negative WOM and its effects on recipients of negative communications concerning products and retailers. Additional factors that may influence neg- ative WOM such as personality variables (including sociability), situational variables (e.g., proximity of others when the dissatisfaction occurs) and attitudinal variables (e.g., attitudes toward business), also need investigation.
REFERENCES Andreasen, Alan R. (1977), "A Taxonomy of Consumer Sat-
isfaction/Dissatisfaction Measures," Journal of Consumer Affairs, 11 (Winter), 11-24.
Arndt, Johan (1968), "Word-of-Mouth Advertising and Per- ceived Risk," in Perspectives in Consumer Behavior, H. Kassarjian and T. Robertson, eds., Glenview, IL: Scott, Foresman.
Best, Arthur and Alan R. Andreasen (1977), "Consumer Re- sponse to Unsatisfactory Purchases: A Survey of Perceiving Defects, Voicing Complaints and Obtaining Redress," Law and Society Review, 11 (Spring), 701-742.
Day, Ralph L., ed. (1977), Consumer Satisfaction, Dissatis- faction and Complaining Behavior. Bloomington, IN: In- diana University Press.
and E. Laird Landon, Jr. (1976), "Collecting Com- prehensive Consumer Complaint Data by Survey Re- search," in Advances in Consumer Research, 3, B. B. Anderson, ed., Atlanta: Association for Consumer Re- search, 263-268.
Diamond, Steven L., Scott Ward and Ronald Faber (1976), "Consumer Problems and Consumerism: Analysis of Calls to a Consumer Hot Line," Journal of Marketing, 40 (Jan- uary), 58-62.
Dichter, Ernest (1966), "How Word-of-Mouth Advertising Works," Harvard Business Review, 44 (November-De- cember), 147-157.
Diener, Betty J. and Stephen A. Greyser (1978), "Consumer Views of Redress Needs," Journal of Marketing, 42 (Oc- tober), 21-27.
Grabicke, K. (1980), "Consumer Satisfaction, Dissatisfaction and Complaining Behavior," paper presented at the Fifth Annual Colloquium of the European Association of Eco- nomic Psychologists, Leuven and Brussels.
Granbois, Donald, John O. Summers and Gary L. Frazier (1977), "Correlates of Consumer Expectation and Com- plaining Behavior," in Consumer Satisfaction, Dissatisfac- tion and Complaining Behavior, R. L. Day, ed., Bloom- ington, IN: Indiana University Press, 18-25.
Hunt, H. Keith, ed. (1977), Conceptualization and Measure- ment of Consumer Satisfaction and Dissatisfaction, Cam- bridge, MA: Marketing Science Institute.
Jacoby, Jacob and Robert W. Chestnut (1978), Brand Loyalty Measurement and Management, New York: Wiley.
Lawther, Karen, S. Krishnan and Valerie A. Valle (1979), "The Consumer Complaint Process: Directions for Theo- retical Development," in New Dimensions for Consumer Satisfaction and Complaining Behavior, R. L. Day and H. K. Hunt, eds., Bloomington, IN: Indiana University Press, 10-14.
Lutz, Richard J. (1975), "Changing Brand Attitudes through Modification of Cognitive Structure," Journal of Con- sumer Research, 1 (March), 49-59.
Newman, Joseph W. and Richard A. Werbel (1973), "Mul- tivariate Analysis of Brand Loyalty for Major Household Appliances," Journal of Marketing Research, 10 (Novem- ber), 404-409.
Oliver, Richard L. (1980), "A Cognitive Model of the An- tecedents and Consequences of Satisfaction Decisions," Journal of Marketing Research, 17 (November), 460-469.
Peterson, Robert A. and Vijay Mahajan (1976), "Practical Significance and Partitioning Variance in Discriminate Analysis," Decision Sciences, 7 (October) 649-658.
Robinson, Larry M. (1979), "Consumer Complaint Behavior: A Review with Implications for Further Research," in New Dimensions of Consumer Satisfaction and Complaining Behavior, R. L. Day and H. K. Hunt, eds., Bloomington, IN: Indiana University Press, 41-50.
Scott, Carol A. and Alice M. Tybout (1981), "Theoretical Perspectives on the Impact of Negative Information: Does Valence Matter?," in Advances in Consumer Research, 8, K. B. Monroe, ed., Ann Arbor, MI: Association for Con- sumer Research, 408-409.
Settle, Robert B. and Linda L. Golden (1974), "Attribution and Action When a Product Fails," paper presented to the Fifth Annual Conference of the Association for Consumer Research, Chicago.
Swan, John E. and Linda Jones Combs (1976), "Product Per- formance and Consumer Satisfaction: A New Concept," Journal of Marketing, 40 (April), 25-33.
and Douglas S. Longman (1973), "Consumer Sat- isfaction with Automobile Repair Performance: Attitudes Toward the Industry and Governmental Control," in Com- bined Proceedings, B. W. Becker and H. Becker, eds., Chicago: American Marketing Association, 249-255.
Technical Assistance Research Programs (1979), Consumer Complaint Handling in America: Summary of Findings and Recommendations, Washington, DC: U.S. Office of Con- sumer Affairs.
Valle, Valerie A. and Randi Koeske (1977), "Elderly Con- sumer Problems: Actions, Sources of Information and At- tributions of Blame," paper presented at the annual meet- ing of the American Psychological Association, San Francisco.
Warland, Rex H., Robert O. Herrmann and Jane Willitts (1975), "Dissatisfied Consumers: Who Gets Upset and Who Takes Action," Journal of Consumer Affairs, 9 (Win- ter), 148-163.
Weinberger, Marc G., Chris T. Allen and William R. Dillon
Negative Word-of-Mouth by Dissatisfied Consumers: A Pilot Study / 77
(1981), "Negative Information: Perspectives and Research Directions," in Advances in Consumer Research, 8, K. B. Monroe, ed., Ann Arbor, MI: Association for Consumer Research, 398-404.
Westbrook, Robert A. (1980), "A Rating Scale for Measuring Product/Service Satisfaction," Journal of Marketing, 44 (Fall), 68-72.
Wright, Peter (1974), "The Harrassed Decision Maker: Time
What's MARKETING new in
POLITICAL MARKETING MARKETI] MARKETING IN THE TO CHAN( AN APPROACH TOTHD ONSUME CAMPAIGN STRATEGY WORLD ENVIRON- Gary A. Mauser, Simon Erdener Kaynak, Mount r EN Fraser University, Canada Saint Vincent University V ll EN How can marketing principles Answers an outstanding need MENTAL SCAN] and research techniques be ex- for a timely overview of market Ronald D. M hm tended into the arena of research and market activity in tnm political campaigning? the developing nations of the Shippensburg State College, In this important new book, Third World. Gathering and in- Pennsylvania Gary Mauser explains how-by terpreting data from numerous Provdes marketing exec providing political campaigners countries, Kaynak illuminates a starting point for unde with a practical method for such areas as product planning the socioeconomic chant determining campaign strategy; the use of available marketing fect spending patterns ar illustrating how this method has channels, and effective market on the organization. Thi been used to identify campaign research techniques. In addi- framework for future plai strategy for political candidates tion, he describes the trends focuses on six interactin in both the U.S. and France; that will shape the future of Demography; Economic and by providing an empirical marketing in the developing tions; Social and Cultura examination of the validity and nations. Political and Legal Force reliability of this method. 240 pp. 1982 $29.95 nology; and competition. Focuses on the 1968 U.S. Pres- 0-03-062179-8 an analysis of demograpi idential election, the 1970 con- to the year 2000 and tecl test for Governor of California, analyzing future market the 1973 French Legislative opportunities. elections, and the 1974 French ca. 192 pp. 1983 ca. $19.9 Presidential contest.0-030594294 ca. 304 pp. 1983 ca. $21.95 0-03-052591-8
Available through your local bookseller or order directly from: P RA E G E I PUBLISHERS
Pressures, Distractions, and the Use of Evidence," Journal of Applied Psychology, 59 (October), 555-561.
Zaichkowsky, Judy and John Liefeld (1977), "Personality Profiles of Consumer Complaint Letter Writers," in Con- sumer Satisfaction, Dissatisfaction and Complaining Be- havior, R. L. Day, ed., Bloomington, IN: Indiana Uni- versity Press, 124-129.
for the 80's? qG ING R
fIRON- NING lan,
utives with rstanding ges that af- id impact s dynamic nning variables:
Condi- 1 Forces; es; Tech- Includes
iic trends hniques for
5
And these titles in the Praeger Series in Public and Nonprofit Sector Marketing...
THE MARKEI'ING OF IDEAS AND SOCIAL ISSUES Seymour H. Fine Rutgers University 240pp. 1981 $26.95 0-03-059277-1
GOVERNMENT MARKETING THEORY AND PRACTICE edited by Michael Mokwa, Arizona State University, and Steven E. Permut, Yale University 400 pp. 1981 $33.95 0-03-058316-0
MARKETING THE ARTS edited by Michael P. Mokwa, University of Wisconsin, William M. Dawson, ACUCAA, and E. Arthur Prieve, University of Wisconsin 304 pp. 1980 $29.95 0-03-052141-6
R 521 Fifth Avenue R Attn: Ms. Sonya Harroo
New York, N.Y. 10175
78 / Journal of Marketing, Winter 1983
-1 I