Embed Size (px)
Citation preview
ENVIRONMENTAL CORRIDOR MANAGEMENT
NCHRP 2525/63
June 2010
Requested by:
American Association of State Highway and Transportation Officials (AASHTO)
Standing Committee on the Environment
The information contained in this report was prepared as part of NCHRP Project 25‐25, Task 63, National Cooperative Highway Research Program, Transportation Research Board. SPECIAL NOTE: This report IS NOT an official publication of the National Cooperative Highway Research Program, Transportation Research Board, National Research Council, or The National Academies.


ENVIRONMENTAL CORRIDOR MANAGEMENT
NCHRP 2525/63
June 2010
Requested by:
American Association of State Highway and Transportation Officials (AASHTO)
Standing Committee on the Environment
Prepared by:
Marie Venner Venner Consulting
Denver, CO
with assistance from
Antonio Santalucia ICF International Lexington, MA
Acknowledgements This study was requested by the American Association of State Highway and Transportation Officials (AASHTO), and conducted as part of the National Cooperative Highway Research Program (NCHRP) Project 25‐25. The NCHRP is supported by annual voluntary contributions from the state Departments of Transportation. Project 25‐25 is intended to fund quick response studies on behalf of the AASHTO Standing Committee on the Environment. The report was prepared by Marie Venner, with support from Antonio Santalucia, all the DOTs who participated, and the panel: Gary McVoy (Chair), Debra Nelson, Paul Anderson, Frannie Brindle, Steven Miller, and Shari Schaftlein. The project was managed by Nanda Srinivasan, NCHRP Senior Program Officer. Disclaimer The opinions and conclusions expressed or implied are those of the research agency that performed the research and are not necessarily those of the Transportation Research Board or its sponsors. The information contained in this document was taken directly from the submission of the author(s). This document is not a report of the Transportation Research Board or of the National Research Council.
i
Table of Contents
Executive Summary ............................................................................................ 1
1 Managing Existing Corridors for Environmental Benefits ........................... 3 1.1 Incentives for Corridor‐Based Environmental Management .................................................... 4
1.1.1 Current Management of Maintenance Activities is Rarely Organized by Corridor ................... 4
1.1.2 Corridors Are a Reference Point for Others .............................................................................. 5
1.2 Possible Directions for Corridor Environmental Management ................................................. 6
1.2.1 Improving Capabilities to Depict Environmental and Management Information by Region and Corridor .................................................................................................................................... 6
1.2.2 Evaluating Progress toward Sustainability on a Corridor Basis ................................................. 7
1.2.3 Existing Systems for Corridor Environmental Management ................................................... 10
2 Sustainable Use of Resources .................................................................. 13 2.1 An Ounce of Prevention is Worth a Pound of Cure ................................................................. 13
2.2 How Green is Our Pavement Work? ....................................................................................... 14
2.2.1 Materials Consumption in Roadway Rehabilitation ................................................................ 14
2.2.2 Reuse, Recycling, and Life Cycle Assessment in Road Construction ....................................... 14
2.2.3 Making LCA Evaluations Part of Corridor Environmental Management ................................. 17
2.2.4 Recycling and Resource Minimization in Other Aspects of Corridor Maintenance ................ 18
2.2.5 Minimizing the Need for New Construction with Operational Improvements ....................... 18
2.2.6 Transportation Planning and Livability .................................................................................... 20
3 Are We Keeping Water Clean? ................................................................ 22 3.1 Advances in Stormwater Management Along Corridors ........................................................ 23
3.2 Culture of Transparency and Stewardship Eases Compliance with Stormwater Regulations 24
3.3 Discussing Costs & Benefits of BMPs, MS4 Approaches, & Retrofits ...................................... 26
3.4 DOT Culvert and Outfall Retrofit Programs ............................................................................. 27
3.4.1 Outfall Categorization & Improvement – Florida and Washington State DOTs ...................... 27
3.4.2 MDSHA’s Water Quality Improvement and BMP Retrofit Program ....................................... 28
3.4.3 Oregon DOT’s Data Management for Drainage Facilities ....................................................... 29
3.4.4 Maintenance Activities by Type, Linked to Regulations, and BMP Selection Systems ........... 29
3.5 Winter Operations Practices for Water Quality ...................................................................... 30
3.5.1 Maximizing Efficiencies of Anti‐Icing Programs ...................................................................... 31
ii
4 Roadside Environmental Management ................................................... 35 4.1 Vegetation Management ........................................................................................................ 35
4.1.1 Unifying Aesthetic and Functional Purposes for Landscaping ................................................ 38
4.2 State DOT Best Practices in Managing ROW for Species & Habitat ........................................ 38
4.3 Evaluating, Prioritizing, Budgeting, to Enhance Assets and Reduce Environmental Deficiencies in the Right‐of‐Way ........................................................................................................................... 41
4.3.1 Developing a Process of Regulatory Inventory and Documentation of Maintenance Activities for Continuous Improvement ...................................................................................................... 41
4.3.2 Virginia DOT’s Approach to Performance‐Based Contracting ................................................. 42
4.3.3 NCDOT’s Maintenance Management and Quality Assurance System .................................... 47
4.3.4 Washington State DOT’s Environmental Maintenance Accountability Process ..................... 47
4.3.5 Applicability of Pennsylvania’s System for Identifying Roadside Problem Areas ................... 50
4.3.6 NYSDOT’s Maintenance Environmental Roadside Worksheet for the Green and Blue Highways Initiative ................................................................................................................................. 50
4.3.7 Improving Habitat for People: Can DOTs Contribute to Walkability? .................................... 52
4.3.8 Improving Habitat for Fish and Wildlife Along Highway Corridors ......................................... 56
5 The Energy Efficient Highway: How Efficient Are Our Corridors? ............. 65 5.1 Solar Arrays in/on DOT Right‐of‐Way ...................................................................................... 65
5.1.1 Partnerships with and Easements for Municipalities .............................................................. 67
5.1.2 Utility Pole Upgrades with Solar Panels .................................................................................. 67
5.1.3 DOT Solar Array Provides Energy for Interchange Illumination .............................................. 68
5.1.4 “Lessons Learned” for DOTs Implementing Solar Projects in the ROW .................................. 72
5.2 Finding Good Sites for Wind .................................................................................................... 77
5.2.1 Maintaining Wind Power on DOT ROW .................................................................................. 80
5.2.2 Feasibility of Using Solar or Wind Power for Transportation Infrastructure .......................... 80
5.3 Providing Guidance to the Private Sector: A Plan for West‐Wide Upgrade of Transmission Corridors 83
5.4 Powering Roadside Appurtenances with Renewable Energy .................................................. 82
5.4.1 Shifting to LED and Solar‐Powered Lighting for Signs ............................................................. 82
5.4.2 LED Luminaires ........................................................................................................................ 83
5.4.3 Replacing Signals with LEDs ..................................................................................................... 86
5.4.4 Highly Retroreflective Sheeting Eliminates Need for Sign Lighting ......................................... 86
5.4.5 Experiments with Decreased Lighting, Better Luminaire Placement ...................................... 88

iii
5.4.6 Ecoluminance: A Systems Approach to Design for Roadway Visibility .................................. 89
5.4.7 Exploring Growth of Biomass in the ROW ............................................................................... 94
5.4.8 Carbon Sequestration .............................................................................................................. 95
5.5 Increased Energy Efficiencies from Operations ...................................................................... 96
5.5.1 Signal Timing ........................................................................................................................... 97
5.5.2 Using Technology to Minimize Trips & Increasing Driving Efficiency ...................................... 99
5.6 Shifting to More Efficient Fleets ............................................................................................ 100
6 Putting the Pieces Together ................................................................... 102 6.1 A Framework for Corridor Environmental Management ...................................................... 102
6.1.1 Deciding to Work or Present Work on a Corridor Basis ........................................................ 102
6.1.2 Continuing to Structure Environmental Management by Existing Units .............................. 102
6.1.3 Structuring for Feedback and Continuous Improvement ..................................................... 103
6.2 Environmental Management Plans: A Potential, Simple EMS Application for Transportation Corridors ................................................................................................................................ 105
6.3 A More Detailed EMS Approach to Corridor Environmental Management .......................... 109
PLANNING ........................................................................................................................................... 110
6.3.1 Overall Goal / Policy .............................................................................................................. 110
6.3.2 What Do We Have and Manage? .......................................................................................... 111
6.3.3 What Are the Environmental Aspects of Maintenance Work? ............................................. 112
6.3.4 Build Awareness of the Issues & Recruit Champions and Partners ...................................... 113
6.3.5 What Should We Be Managing? ............................................................................................ 115
DO IT! – IMPLEMENTATION and PROCEDURES .................................................................................. 120
6.3.6 Management Decision‐making and Support ......................................................................... 120
6.3.7 Developing Procedures ......................................................................................................... 121
6.3.8 Communicating Roles and Responsibilities ........................................................................... 122
6.3.9 Conduct Training ................................................................................................................... 125
CHECK/REVIEW and ACT .................................................................................................................... 125
6.3.10 Evaluation and Reporting ...................................................................................................... 126
6.3.11 Analyzing and Reporting on Results, Planning for the Next Cycle ........................................ 128
6.3.12 Quality Assurance and Updates ............................................................................................ 128
6.3.13 Discuss Results with Decisionmakers & Stakeholders and Refine the Plan .......................... 129
6.3.14 Evaluate the Process ............................................................................................................. 129
iv
6.3.15 Identify Program Adjustments and Lessons Learned ............................................................ 129
6.4 Next Steps for DOTs .............................................................................................................. 130
6.4.1 Develop Environmental Management Plans by Corridor ...................................................... 130
6.4.2 Extending the Adopt‐a‐Highway Concept to Environmental Opportunities and Volunteer Service Areas .................................................................................................................................... 130
6.4.3 Potential Agency Roles .......................................................................................................... 131
6.4.4 Advances in Field Monitoring and Tracking .......................................................................... 131
6.5 Taking on New Roles ............................................................................................................. 131
7 APPENDIX .............................................................................................. 132 7.1 Highlights and Summary of Findings From DOT Outreach: DOTs’ Reality and Recommendations for
the Future .............................................................................................................................. 132
7.2 NCDOT Environmental Maintenance Evaluations Inform Individual Performance Review .. 136
7.3 D.C. DOT EMS Tracks Environmental Commitments in Maintenance .................................. 139
8 References ............................................................................................. 141
NCHRP 25‐25/63 Environmental Corridor Management
1
Executive Summary Transportation agencies across the U.S. own and manage approximately 12 million acres of land alongside state and local roads. In the normal course of maintaining and operating these roadways and adjacent lands, Departments of Transportation (DOTs) do much to protect the natural environment and reduce the use of energy and other resources. Often these activities are not managed or documented by corridor. Even work such as mowing and snow plowing, which appears to be performed on a corridor basis, is usually managed or organized by maintenance district, county, or other geographic basis. This trend stands in sharp contrast to the widespread use of corridors in transportation planning and project development to analyze and mitigate potential environmental impacts.
This report presents a framework for conducting and documenting environmental management activities by corridor, focusing on the core maintenance practices of roadside management and the primary areas of attention for environmental performance measurement identified by AASHTO and FHWA: resource use and recycling; water quality; roadside environmental management; and energy. The focus of the report is on what may be tackled and accomplished on a corridor basis, based on an examination of the current state of practice and leveraging existing systems for organizing and prioritizing environmental work in maintenance. Through presentation of practices for extending, measuring, and prioritizing environmental stewardship efforts in each of these core areas, this document outlines a framework for DOTs to manage transportation corridors for environmental benefit in an approachable, feasible, and relatively cost‐effective way in today’s tight budgetary times. This report also explores how DOTs can use data and decision‐support systems to implement, track, and report on corridor‐based environmental management.
A first decision for DOTs is whether they want to use corridors to organize their environmental management activities or to present the results of those activities. As detailed in Chapter 1, DOTs reported in 2009 that, in general, they do not use a corridor approach to managing or documenting maintenance activities that relate to the environment; however, the chapter explores reasons why DOTs should consider doing so. First, many environmental stakeholders are accustomed to viewing and evaluating a DOT’s work by corridor. Second, information systems are likely to enable DOTs to present the work they do in a corridor context, as DOT Geographic Information System (GIS) services, web tools, and public websites increase in capacity.
Chapters 2 to 5 describe notable and exemplary practices by DOTs to measure and improve the performance of roadway and roadside maintenance in the following environmental areas:
Chapter 2 discusses resource use and recycling, predominantly in road maintenance and renewal. In addition, it touches briefly on energy use, particularly the topic of livability and how planning and re‐evaluation of our corridors can help lower energy consumption and greenhouse gas (GHG) emissions by reducing vehicle miles traveled (VMT), on a corridor basis.
Chapter 3 describes notable DOT practices to protect and improve water quality along corridors. The two primary topics that are covered are stormwater management and snow and ice operations.
Chapter 4 covers a wide range of topics under the label of “roadside environmental management.” These include the traditional topics of vegetation management and wildlife habitat. However, this chapter also discusses practices that improve roadside “habitat” for people by making it easier for them to walk and bike along and across roadways.

NCHRP 25‐25/63 Environmental Corridor Management
2
Chapter 5 documents cutting‐edge DOT practices in the area of energy efficiency and the development of renewable energy. First, the chapter delves into recent DOT experience and lessons learned regarding the placement of wind and solar power projects in highway rights of way (ROWs). It then turns to energy efficiency opportunities in the areas of traffic signals and roadway and sign lighting. Other energy‐efficiency opportunities along transportation corridors are also discussed.
Chapter 6 describes how DOT maintenance departments can apply the principles and features of Environmental Management Systems (EMSs) to improve environmental management of roadway and roadside maintenance. DOTs may not be interested in fully adopting an EMS approach; however, they can accomplish much simply by adopting components of an EMS that will provide helpful feedback, information about outcomes, and opportunities to improve maintenance practices.
NCHRP 25‐25/63 Environmental Corridor Management
3
1 Managing Existing Corridors for Environmental Benefits Transportation agencies across the U.S. own and manage approximately 12 million acres of land alongside state and local roads. While DOTs invest much time and study to avoid environmental impacts and conduct enhancements for new transportation development, less attention is typically devoted to how existing corridors can be managed for environmental benefits.
DOTs do much to steward the environment in the normal course of their maintenance and operations work. They are less accustomed to taking the time to document or promote the environmental management they undertake. Already stretched maintenance departments, some of which have experienced budget and staff reductions of one‐third or more in the last decade, may feel they don’t have time to think about how to communicate with the public about the environmental management they are or could be doing.
This report examines the state of the practice in corridor environmental management and how DOTs can manage the corridors that they own and operate for greater environmental benefit. DOTs are aiming to operate and maintain our transportation system in support of a sustainable society, specifically in a manner that does not deplete, and if possible, enhances resources for future generations, supports the economy, and enhances quality of life for everyone. The report describes how DOTs contribute to that end, with a particular focus on application of environmental stewardship on a corridor basis in four key emerging areas of environmental performance measurement and tracking:
• Resource use and recycling
• Water quality
• Energy
• Roadside environmental management
Through presentation of practices for extending, measuring, and prioritizing environmental stewardship efforts in each of these core areas, this document outlines a framework for DOTs to manage transportation corridors for environmental benefit. This framework also seeks to help “integrate different pieces of the environmental puzzle by addressing ecological, water, resources, raw materials, waste, and climate change issues and exploring how those relate to corridor management and maintenance practices at DOTs.”1
This report also explores the integration of data and decision‐support systems into corridor‐based environmental management. The framework presented here identifies the current and most promising environmental management systems for corridor‐based operations and maintenance activities, taking a broad approach to what these systems might include. The emphasis here is not on formal EMSs or ISO 14001, although we do review the application of these types of systems to corridor‐based environmental management. Rather, this report focuses on existing management and prioritization approaches so that DOTs can leverage what they are already doing and have found practical.
As we look at corridor‐applicable practices in each of the four core areas above, we present methodologies for prioritizing and tracking maintenance actions with regard to the environment. As NCHRP 25‐25/51, Asset Management of Environmental Mitigation Features, documented, DOTs

NCHRP 25‐25/63 Environmental Corridor Management
4
do not have extensive databases of what exists in their ROWs. Environmental asset management is a very new field, and ROW management via geographic information systems (GIS) is still emerging as well. Maintenance Management Systems usually are unlinked to GIS. At the state and federal levels, GIS‐based management of habitats and ecosystems is also still in its infancy. The state of the practice in government is revealed by the fact that decade‐old ecoregional conservation plans by a non‐governmental organization, The Nature Conservancy, are still the best available compiled and mapped data on conservation priorities in many areas.
About half of the states have mapped conservation priorities for their State Wildlife Action Plans, but many have shied away from mapping and some use indistinct “bubble areas” to avoid raising landowner concerns about regulation. Many states have yet to invest in substantial GIS databases, linked to other systems internally and shared with other agencies. Within transportation work, GIS is extensively used in project development, especially by consultants; however, consultants do not consistently turn over the GIS layers they develop for projects to the DOTs that pay for the work. The Strategic Highway Research Program (SHRP) Capacity 06 (C06) project has discovered that even some of the more progressive DOTs do not specify that such information should be delivered, and in a common, easily uploadable format.2 Meanwhile, maintenance departments have been struggling with increasing demands with fewer people to help meet them.
NCHRP 25‐25/04, AASHTO’s Compendium of Environmental Stewardship Practices, Policies, and Procedures in Construction and Maintenance (2004, updated 2005), may be viewed as a precursor and companion to this document.3 Much of the compendium relates to environmental management and can be applied on a corridor basis. Users of the framework presented here may want to consult the compendium’s detailed table of contents. This document focuses on developments since the 2005 update of that publication, highlighting those that are particularly amenable to application to corridors, and in particular, those in the key categories of sustainable resource use, water quality, energy, and roadside management.
1.1 Incentives for Corridor-Based Environmental Management
1.1.1 Current Management of Maintenance Activities is Rarely Organized by Corridor
In the summer of 2009, we surveyed 60% of state DOTs on corridor environmental management, followed by presentations and interviews via focus group at the AASHTO/TRB Maintenance Management Conference. Collectively, we were in contact with representatives at nearly 75% of DOTs over the course of the research effort.
The input we received indicated that corridors were not, on the face of it, a particularly useful construct for DOT maintenance managers. Even work like mowing and snow plowing, which appear to be performed on a corridor basis, in fact occur on more of a regional, district, or county‐wide basis. Scheduling occurs on a practical level by regional or area‐wide work units. We heard that it would take “re‐culturization” over many years to shift to a corridor approach and there would have to be better reasons to do so.
Still, environmental management of corridors is already occurring across the U.S. Infrastructure corridor managers are mowing grass, calibrating salt spreaders in winter, trying to control invasive species while limiting herbicide use, and trimming trees and shrubs to prevent them from endangering utility lines or encroaching on roads, signs, or recovery zones. Managers, maintenance workers, and environmental specialists are trying to minimize negative environmental impacts from
NCHRP 25‐25/63 Environmental Corridor Management
5
chemicals and inadvertent habitat destruction, and are attending to the visual qualities of the road and ROW. However, to streamline instruction‐giving, much of this work is organized using statewide standards or is directed by county or by DOT maintenance region. For example, statewide herbicide application rules protect workers and prevent poisons from being over‐applied. As another example, mowing‐width standards may be uniform statewide, or they may vary by region or by roadway type.
Most readers of this research report, panelists, and others on the research team have worked in central management at state DOTs, where broader‐scale approaches and statewide direction is the norm. Almost all of the project respondents and focus group participants serve at agency headquarters as well. For state DOTs, maintenance districts/regions or other region‐wide programs may be one of the most convenient ways to distribute information and think about implementing sustainability and environmental management. The costs of shifting to or utilizing a corridor approach could be considered too high when practices, standards, and environmental management are currently organized and conducted in some other way. DOTs told us that they need a compelling reason to structure their work differently, and that they strongly prefer to leverage existing mechanisms, structures, and approaches. However, the increasing ability to download and present information in different formats effectively reduces the cost of being able to present data by corridor, even if maintenance work is not being managed and conducted on that basis. Thus, in the future, DOTs may have more flexibility to consider and implement corridor approaches to environmental management.
1.1.2 Corridors Are a Reference Point for Others
While there are some inherent practicalities and simplicities with applying standards and tracking activities on a broad scale (e.g., statewide, by roadway type, or by maintenance region), a DOT’s work still “plays out” on geographically specific corridors. In addition, corridors are valuable reference points for other audiences and in planning and project development. For these reasons, DOTs may wish to organize and present information about the maintenance and operations work they do on a corridor basis.
Even though DOTs said they lack the resources to extend their environmental work, especially in today’s budget environment, DOTs could consider using a corridor framework to analyze the environmental work they are already doing. DOTs could also use a corridor framework to examine trade‐offs, with or without stakeholder involvement. The corridor context can provide a frame of reference for constructive exchange about the relative costs and benefits of attending to different environmental concerns.
Using websites that provide current and comprehensive information about a project or approach enable an agency to proactively engage with the public about environmental considerations and the identification of priorities on a corridor. This type of outreach approach could be a starting place for constructive dialogue and for forging strong partnerships among various stakeholders. At the same time, discussing needs, opportunities, and priorities on a corridor basis could help to establish common ground around shared sensitivities and help establish an agreed set of actions or priorities to preserve and achieve a healthy environment and greater sustainability.
As information systems begin to facilitate consideration of maintenance work and environmental needs and priorities on different scales, including corridors, they will help DOTs share their environmental work and priorities with others, gather input, and in some cases, re‐negotiate
NCHRP 25‐25/63 Environmental Corridor Management
6
priorities. Although concerns about how additional work can be accomplished are often at the fore, DOTs and the public, as well as the environment, are likely to benefit from such an exchange. Positive repercussions for planning and new project development are likely to occur as well, with benefits flowing both ways. For example, conservation planning and broader‐scale planning for asset management may inform environmental management in road and ROW maintenance.
1.2 Possible Directions for Corridor Environmental Management In the planning and project development stages for corridor solutions, stakeholders sometimes ask the following questions about environmental management issues:
• Are you going to do this on the whole (rest of the) corridor?
• What if we took the management prescriptions being proposed or discussed and applied them to the whole corridor?
Given the extreme shortfalls that maintenance budgets are facing, these questions can raise DOT concerns about the department’s ability to respond or do anything “extra.” However, opening the discussion with what is already being done can get stakeholders involved in making tough choices about what environmental management or enhancements might be feasible within existing budgets.
It can also be useful to tailor work by corridors when examining more place‐specific aspects. These geographic‐specific suggestions can be shared with or examined by DOTs for consideration of how they might be able to help implement some of these improvements in the course of their existing work, or with a feasible increase in level of effort. Some DOTs have identified Special Areas for management of rare plants in the ROW, or areas that should receive particular treatments due to the presence of water, wetlands, or endangered species. For example, New York State DOT (NYSDOT) maintenance staff have taken the initiative to identify environmental improvements that could be made on a selection of Blue and Green Highways across the state and are now implementing those place‐specific ideas.4
1.2.1 Improving Capabilities to Depict Environmental and Management Information by Region and Corridor
As DOT data and capabilities for presentation of information expand, it should become increasingly practical to manage and depict environmental and management information for highways and ROW by corridor. Much of the landscape information that DOTs are already collecting can be utilized for corridor‐level analyses and displays. For example, DOTs are collecting information on outfalls and permanent water quality features for NPDES compliance. In addition, around 30 state wildlife action plans have a geographic expression of those plans’ conservation priorities, which could be overlaid with and fed into corridor management plans. Also, we may be within just a few years of having high‐quality, nationwide data on wetlands.
Automating download of existing information into corridor formats, perhaps into a standard web page template or corridor management plan, could be a new means of communicating with partnering organizations and public stakeholders. It would allow reporting on or showcasing of DOT environmental management by corridor. It could also present a simple corridor environmental management plan, of sorts, identifying items such as:

NCHRP 25‐25/63 Environmental Corridor Management
7
• Geographic and environmental features of the corridor. Such a system could function as a thematic viewer for the area or help citizens see environmental aspects of the area (and demonstrate a DOT’s awareness of them).
• What the DOT is managing and details (or links to details) on how the DOT is conducting that management. The public may have little idea of the scope of a DOT’s current environmental protection and enhancement activities in maintenance and operations.
• Desired improvements. Opportunity for the public to view and comment or agency staff to go to that site/corridor, if they have a particular interest. Such a “push/pull” information tool might also facilitate comment and analysis by stakeholder groups or resource agencies. The DOT’s corridor environmental management plans could be used as a point of dialogue on partners’ priorities for enhancing the environment in the area or for improving area sustainability. If stakeholders or the public want the DOT to undertake additional activities, additional funding may need to be secured.
• Levels of Service (LOS), inspection schedules, or most recent rankings for other assets such as stormwater infrastructure, with indications when retrofits or upgrades may occur. This may occur as part of a larger asset management program.
1.2.2 Evaluating Progress toward Sustainability on a Corridor Basis
“Taking care of what we have” is a concept that links infrastructure maintenance, environmental stewardship, and sustainability. A number of performance measurement frameworks offer perspective on how to assess the sustainability of transportation. AASHTO and the National Surface Transportation Policy and Revenue Commission, California DOT (Caltrans), and others have utilized a Triple Bottom Line approach, which can be used in a multi‐criteria decision‐making context. These organizations have found that measures of progress related to sustainability:5
• Help to identify integrated indicators of sustainability, benchmark progress, and identify areas to make course corrections.
• Provide information and context for data‐driven public policy decisions and investments on shared priorities and goals, to help all parties improve.
• Increase understanding of complexity and interdependence of large‐scale issues, and better engage the public in long‐term processes for improvement.
• Promote transparency through accountability for progress at various scales.
DOTs have more influence over some areas than others, such as: how they plan and work with others, and the incentives they advertently or inadvertently provide; how they construct their roads and the amount of recycled materials they use; and how they operate and maintain those roads and corridors. The latter are sometimes considered operational indicators, as opposed to behavioral indicators relating to the action of those outside the agency, which aren’t easily controlled, or state and system‐level indicators. Realistic and achievable indicators are needed at each level of influence; therefore, this report highlights potential indicators and tracking mechanisms in each of the primary areas: resource use and recycling, water, energy, and roadside management.
“Taking care of what we have” offers links to fiscal sustainability as well, by addressing what DOTs are able to accomplish and to continue performing sustainably. Financial and environmental constraints are both acute issues for DOTs, and corridor‐based environmental management can help decision‐makers make reasonable tradeoffs and clear choices.

NCHRP 25‐25/63 Environmental Corridor Management
8
Two key drivers in DOTs’ decisions regarding how to improve sustainability and execute environmental management are:
1. Natural and cultural resources and their sustainability needs, and
2. The way DOT staff take ownership for or structure work.
Many areas of maintenance and operations work clearly extend beyond corridors and often are considered on other scales (e.g., programmatically, regionally, or statewide). Nevertheless, a DOT’s work in these areas could be displayed or shared with the public on a corridor basis. Some of the areas where DOTs could evaluate progress toward sustainability on a corridor basis include the following:
Sustainable Use of Resources, Including Waste Reduction and Recycling
• Increasing use of recycled materials in construction and maintenance projects.
• Conducting waste management or recycling of waste, thus avoiding landfill costs.
• Minimizing resource use through preventative maintenance for all corridor assets (particularly pavements).
• Achieving life‐cycle cost savings through design and construction of long‐lasting roads and bridges. Facilities that require less maintenance and have a longer life‐cycle through improved design techniques and the use of durable products and recycled materials.
• Documenting solutions that produce efficiency improvements for any resource input (labor, energy, process water, materials).
• Setting a target recycling rate (e.g. 80%) for waste streams from any work on DOT facilities in the corridor.
• Adopting sustainable vegetation solutions or use of native vegetation, minimizing need for trimming, burning, and disposal.
• Using carcass composting material for re‐vegetation efforts.
Water Quality
• Conducting stormwater management in accordance with DOT policy and federal and state regulations.
• Using Systems/condition rating assessments to evaluate outfalls and permanent BMPs and needs for retrofits or repairs.
• Reducing use of herbicides through:
o Placing limitations on product use (e.g., reducing herbicide‐maintained edge zone to 3 feet from the road, plus spot treatments).
o Maintaining records on all herbicide applications and analyzing use patterns.
o Tracking the number or extent of invasive species infestations.
• Using environmentally preferable products (e.g., cleaning products, herbicides, snow and ice control substances).6
• Winter maintenance:
o Managing snow and ice control activities in accordance with standards and environmental regulations.
NCHRP 25‐25/63 Environmental Corridor Management
9
o Employing anti‐icing to reduce salt use and improve safety.
o Planting living snow fences to reduce plowing and need for salt and abrasives.
o Regularly calibrating salt spreaders and monitoring salt usage patterns to detect potential overuse and need for training.
o Upgrading electronic equipment to minimize salt usage.
o Protecting from the elements all salt storage piles on corridor.
• Reducing the extent of impervious surface in a watershed and/or restoring wetlands.
• Using vegetated areas for filtering and slowing storm water runoff, thus reducing maintenance requirements and promoting low impact development (LID)
• Replacing signs with those using reflective sheeting with more sustainable manufacturing, less water use, and pollution.
Other Roadside Management to Promote Sustainability of Natural Resources in the ROW
• Increasing the percentage of culverts that facilitate fish passage.
• Cleaning mowing equipment at each mowing site to reduce the spread of invasive species.
• Identifying, protecting and enhancing viewsheds, thus retaining the scenic, cultural, archaeological, and historic qualities of highways.
• Identifying opportunities for enhancement in the corridor (e.g., via an evaluation by maintenance and/or environmental staff, incorporation of habitat conservation or wildlife corridor management suggestions from State Wildlife Action Plan or other plan or initiative).
o Number or percent of needs/opportunities addressed.
o Demonstration of progress toward achieving joint DNR/DOT goals.
o Progress toward achieving FWS goals of landscape level corridors to increase species resilience in the face of climate change. Mitigate environmental impacts such as wetlands on a watershed/larger ecosystem basis as appropriate (this last issue is likely to be more relevant in planning than in operations and maintenance).
o Potential impacts or opportunities related to waters/wetlands in the corridor identified and addressed.
Energy, Fuel Savings, and GHG Reductions
• Installing renewable energy facilities in corridors.
• Using LEDs and other high‐efficiency lighting.
• Installing renewable‐powered signs, luminaires, and other appurtenances.
• Replacing signs with those using retroreflective sheeting that requires less or even no illumination.
• Adopting anti‐icing practices to achieve environmental and efficiency benefits (e.g., decreased labor hours).
• Revising mowing guidelines, for certain corridors or on larger, programmatic scales.
• Using service vehicles that are as energy‐efficient and clean‐burning as possible, or that use alternative fuel sources.

NCHRP 25‐25/63 Environmental Corridor Management
10
General and Asset‐Management‐Related
• Taking a systematic approach to environmental management, focused on continuous improvement.
• Developing easy‐to‐use environmental guidance for use in corridors.
• Increasing use of electronic documentation for work and reporting on work that occurs in the corridor.
• Including contract language that requires all consultants and contractors to collect environmental data and provide reports that demonstrate contributions to meeting DOT sustainability goals.
• Establishing green standards for any facility construction in the corridor.
• Meeting all environmental commitments with no violations, and promptly taking corrective action when there is a problem.
• Coordinating with resource agencies when making plans for environmental corridor management.
• Designating a maintenance environmental coordinator to serve as a resource for environmental issues or work planning on the corridor.
To assist DOTs in managing corridors for environmental benefits, this document discusses the existing ways DOTs are tracking, assessing, or measuring progress in the areas of resource use and recycling, energy, water quality, and roadside management, and also highlights notable practices in these areas.
1.2.3 Existing Systems for Corridor Environmental Management
Two of the better existing systems for corridor environmental management are the Greenroads system at Washington State DOT (WSDOT)and NYSDOT’s GreenLITES for Operations. Other approaches by DOTs are covered in discussions of individual resource or program areas, but because of their comprehensiveness, these two systems are described here separately.
Greenroads is a performance metric for quantifying sustainable practices associated with roadway design and construction. Greenroads Version 1.0 consists of 11 Project Requirements, 7 Voluntary Credits (worth 108 points), and up to 10 points worth of Custom Credits. Greenroads also sets “achievement levels” at different point values in order to provide recommended scoring levels. Greenroads is compatible with other existing systems that can and have been applied to roadways and can be adopted in a number of ways; however, the most likely are: (1) as an external standard, (2) as a project accounting standard, and (3) as a tool for competitive advantage for both private industry and public agencies.7 The system incentivizes users to conserve resources, reduce waste, and make longer‐term choices. Its developers say it is designed to:
1. Encourage more sustainable practices in roadway design and construction.
2. Provide a standard quantitative means of roadway sustainability assessment.
3. Allow informed decisions and trade‐offs regarding roadway sustainability.
4. Enable owner organizations to confer benefits on sustainable road projects.
5. Establish an implementable baseline requirement for roadway sustainability.

NCHRP 25‐25/63 Environmental Corridor Management
11
While the Greenroads system is primarily geared toward construction, the makers acknowledge that “maintenance and preservation actions have a large impact on overall roadway sustainability. Greenroads considers them in Life Cycle Assessment (LCA), and awards points for having formal procedures in place to ensure their execution; however, since they necessarily occur after certification, they are not judged at the time they are actually performed. Such an idea could be incorporated into a future Greenroads version.”8 For more information see: www.greenroads.us.
The next system, NYSDOT’s GreenLITES, is geared explicitly for maintenance and operations. GreenLITES utilizes an annual Maintenance and Operations Plan (MOP) as a basis for “allocating environmental stewardship activities that go above and beyond the environmental practices already incorporated into the daily work.”9 The MOP is a comprehensive management system that is used to plan, fund, track, and rate operations activities.
NYSDOT references a sustainable transportation definition developed at the University of Winnipeg’s Centre for Sustainable Transportation. This definition is one of the most commonly used in Canada and Europe; it takes into account the needs of current and future generations with particular attention to social, economic, and environmental areas. Sustainable transportation is defined as transportation that:
1. Allows basic access needs of individuals and societies to be met safely and in a manner consistent with human and ecosystem health, and with equity within and between generations (social).
2. Is affordable, operates efficiently, offers choice of transport mode, and supports a vibrant economy (economic).
3. Limits emissions and waste within the planet’s ability to absorb them, minimizes consumption of non‐renewable resources to the sustainable yield level, reuses and recycles its components, and minimizes the use of land and the production of noise (environmental).
NYSDOT applies this more particularly to its operations philosophy, which is to ensure that staff do the following in the course of their work supporting safe mobility around the state: 10
• Protect and enhance the environment.
• Conserve energy and natural resources at all aspects of our work including our facilities.
• Participate in new and innovative approaches to sustainable operations and maintenance.
• Support a sustainable fleet and alternative fuel use.
• Improve access to public sites and protect historic resources.
• Support multi‐modal transportation and Smart Growth.
• Preserve and enhance scenic and aesthetic roadside characteristics.
NYSDOT developed the GreenLITES certification program to better integrate these principles by:
1. Recognizing and increasing the awareness of the sustainable methods and practices we already incorporate into our daily operations.
2. Expanding the use of these and other innovative alternatives which will contribute to improving transportation sustainability.

NCHRP 25‐25/63 Environmental Corridor Management
12
The GreenLITES MOP system helps maintenance managers balance their options, considering “what is beneficial to people, while considering what is economically sound, and environmentally compatible. This may or may not necessarily increase operations and maintenance costs. Where costs are increased, it may be warranted when all external and future cost are considered including environmental benefits.” 11
While GreenLITES is “primarily an internal management program for NYSDOT to measure its performance, recognize good practices, and identify and improve practices where needed,” it also provides NYSDOT with “a way to demonstrate to the public how it is advancing sustainable practices.” With GreenLITES, NYSDOT has gone further than any other DOT in incorporating the environment into evaluation and feedback systems in maintenance, creating true incentives for staff and communicating agency priorities and management seriousness. Further information on GreenLITES for Operations is available at: http://www.nysdot.gov/programs/greenlites/operations‐cert.

NCHRP 25‐25/63 Environmental Corridor Management
13
The Benefit of Preventative Maintenance Caltrans saves $3-$20 for every $1 spent on Preventative Maintenance or Capital Preventative Maintenance (CAPM), if the treatment is applied at the right time, before the pavement deteriorates into a major rehabilitation or reconstruction project. Reconstruction in urban areas is even more. Instead of the estimated $200,000 per lane-mile, the costs may exceed $1 million per lane-mile. In contrast, a PM strategy will typically cost $50,000 to $100,000 per lane-mile, covering many more miles for the equivalent dollar. A significant savings for PM comes from a reduction in time spent in design and construction. Prior to Preventative Maintenance, Caltrans did as much Corrective Major Maintenance as the limited budget allowed until full rehabilitation, or, in the worst-case, reconstruction was needed. Time spent waiting until the pavement can be fully rehabilitated allows time for the pavement condition to deteriorate further. Since PM projects are pavement only, they require less design time and can be delivered faster. Thinner treatments also contribute to faster production rates, and fewer working days reduces the disruption to the traveling public and entails less disturbance to roadside environments. Caltrans, State of the Pavement Rpt.
2 Sustainable Use of Resources The concept of sustainable use of resources is most often used with regard to the physical inputs to roads and DOTs’ transportation work, including bitumen, aggregate, and, increasingly, recycled materials. However, the concept can also be applied to the array of other inputs (especially funds and staff time), as well as the wider environment — aquatic and terrestrial habitat and the communities that provide the context for our roads. As public stewards, DOT staff want to ensure that public resources are spent wisely, producing the greatest benefit for both the transportation and environmental systems in their care. As agency priorities allow, DOTs can begin to document solutions that allow more efficient use of any resource input, from materials to labor, energy, and water.
2.1 An Ounce of Prevention is Worth a Pound of Cure
DOT staff across all specialty areas tend to share a profound concern with the sound expenditure of public funds. They understand that the old adage “an ounce of prevention is worth a pound of cure” applies to virtually all aspects of environmental management, as well as to economic and financial sustainability considerations.
DOTs may consider cost‐effectiveness and outcomes achieved when deciding where to direct DOT mitigation dollars and conservation investments, which kinds of maintenance actions might be trimmed or should be expanded, which water quality and habitat fragmentation improvements to pursue first, and last but not least, how to manage the road itself. A dollar saved in one area provides an additional dollar to address the endless lists of needs and priorities elsewhere.
DOTs and members of the public interested in sustainability can ask, “Are our roads being maintained sustainably? Are the most timely, cost‐effective, and environmentally sound choices being made to minimize overall material use and the amount of time needed for maintenance or repaving (and its associated environmental incursions and public disruptions)?” Many methods of answering these types of questions have emerged, and DOTs have their pick of good options. Nearly all DOTs now use pavement management systems (PMSs) to provide a systematic, objective evaluation of pavement condition for identification of maintenance and rehabilitation needs and projects, and then prioritization of those projects based on cost‐effectiveness. Asset management systems can help a DOT track

NCHRP 25‐25/63 Environmental Corridor Management
14
AASHTO’s Compendium Offers Stewardship & Sustainability Practices Relating to Pavement, Materials, and Recycling in the Following Areas: • Preventative Maintenance and
Pavement Management Systems • Stormwater Management in Paving
Operations, Grinding, and Pavement Maintenance – plus links to other stormwater and aquatic resource-related sections of the Compendium
• Flexible Pavement/Asphalt • Concrete Installation and Repair • Pavement Marking • Curb and Sidewalk Repair • Recycling in Pavement and Roadside
Appurtenances • Maintenance of Dirt & Gravel Roads
progress toward reducing total pavement needs to specified target levels, as well as toward improving pavement conditions overall.
2.2 How Green is Our Pavement Work? Recent research and several DOT rating systems are now available to help DOTs and stakeholders answer the question, “How green is our paving work?”
2.2.1 Materials Consumption in Roadway Rehabilitation
Because rehabilitation of roadways consumes large amounts of natural materials and energy, produces wastes, and generates greenhouse gas emissions,12 sustainability plans within DOTs, states, or regions should account for roadway construction and rehabilitation. Avoiding the need for construction of new roads by maximizing use of existing public infrastructure, increasing roadway connectivity, and spreading traffic to reduce congestion can all decrease the need for road materials, but these possibilities are most appropriately considered on a planning level.
Production and transport of materials cause the most significant environmental burdens in road construction. Production of bitumen and cement, crushing of materials, and transport of materials are the most energy‐consuming, single life‐cycle stages of construction, contributing approximately half of all environmental impacts in the road construction life cycle.13
A sustainable approach to material consumption begins with design and planning that reuses and incorporates suitable byproducts that would otherwise be disposed. Ideally, products can be designed so that recycling and reuse occur at all stages of the life cycle, resulting in limited waste generation.
2.2.2 Reuse, Recycling, and Life Cycle Assessment in Road Construction
Reuse and recycling can significantly contribute to more sustainable road construction practices.14 However, as Lee, et al., note, “the lack of comparative analysis methods, examples, and protocols for actual construction projects hinders the ability to quantify tangible environmental and economic benefits that can be achieved through reuse and recycling in pavement design and construction.” 15
Life Cycle Assessment (LCA) contributes to public purchasing by facilitating:
• Learning about the environmental aspects of products.
• Fulfillment of customer requirements.
• Definition of environmental requirements.
• Choices between alternatives.
NCHRP 25‐25/63 Environmental Corridor Management
15
Incorporating LCA information in the process can spur innovations, new technical solutions, methods, and systems where the performance requirements can foster competition in how to accomplish environmental benefits.
Parikka‐Alhola cites several LCAs that have been done to assess the environmental impacts related to road construction.16 While the LCA approach has been used to quantify the environmental impacts of using recycled materials in lieu of conventional construction materials, some analyses fail to include rehabilitation activities, which are some of the most energy‐ intensive phases in the roadway life cycle, and miss quantifying the economic benefits from using recycled materials.
Recently, Lee et al., (TRB, 2010) quantified many of the benefits of using recycled materials in highway pavements by conducting life cycle analysis and life cycle cost analysis on pavements consisting of conventional and recycled materials, mainly in Wisconsin. They found that using recycled materials just in the base and subbase layers of a pavement can result in reductions in global warming potential (20%), energy consumption (16%), water consumption (11%), and hazardous waste generation (11%), while extending the service life of the pavement and producing overall life cycle cost savings of 21%.17 The savings are even larger if landfill avoidance costs are considered for the recycled materials incorporated into the pavement. The authors explicitly included rehabilitation activities in the life‐cycle analysis, using the international roughness index (IRI) as a metric to define when rehabilitation would be required, as suggested by FHWA.
The analysis compared a conventional pavement design proposed by Wisconsin (WisDOT) with an alternative pavement design employing recycled pavement material (RPM) stabilized with fly ash as the base course and foundry sand as the subbase. Recycled materials can also be used in hot mix asphalt (HMA) and in other elements in the ROW (e.g., pipes, guard rails, barriers) as well, but in this case those possibilities and benefits were not included. The analysis predicted the service life of both designs, identifying rehabilitation strategies, and conducting LCA and life‐cycle cost analysis. LCA is similar to a life‐cycle cost analysis, except environmental impact is considered over the analysis period. In this and other analyses, the LCA tends to include energy consumption, emissions generation, and natural resource consumption in addition to the price of the activity. The analysis by Lee, et al., also included water consumption and generation of hazardous wastes, as defined by the Resource Conservation and Recovery Act (RCRA).18
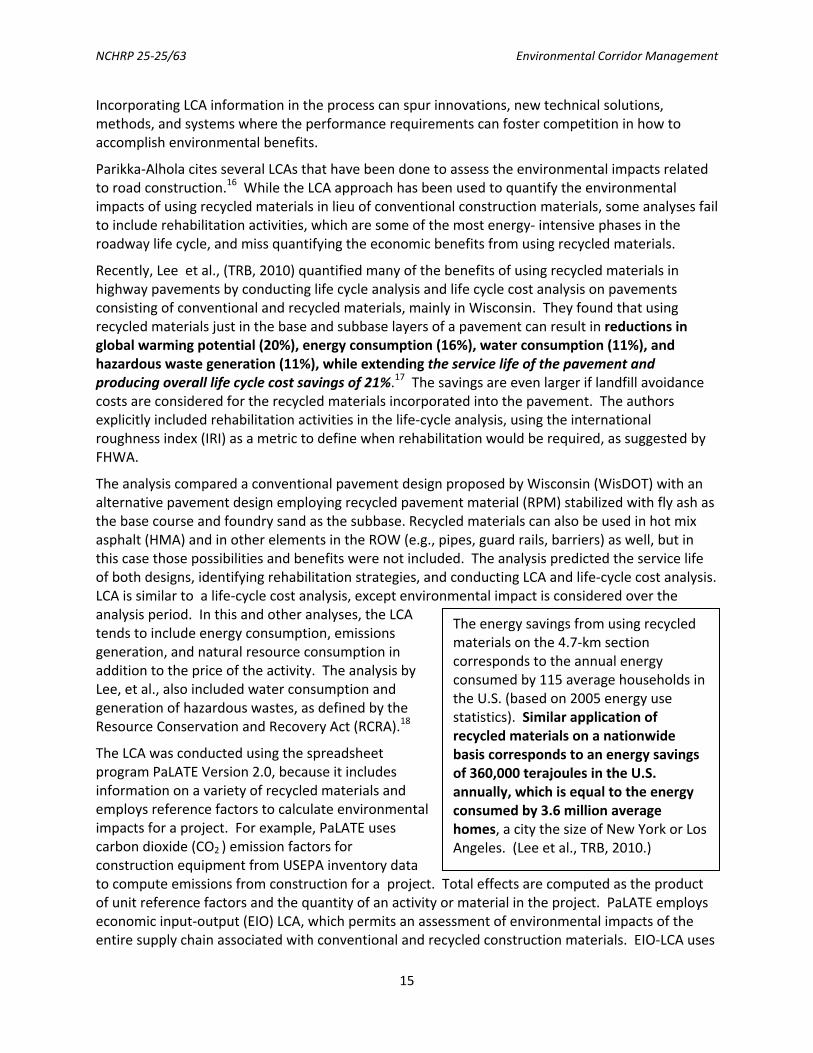
The LCA was conducted using the spreadsheet program PaLATE Version 2.0, because it includes information on a variety of recycled materials and employs reference factors to calculate environmental impacts for a project. For example, PaLATE uses carbon dioxide (CO2 ) emission factors for construction equipment from USEPA inventory data to compute emissions from construction for a project. Total effects are computed as the product of unit reference factors and the quantity of an activity or material in the project. PaLATE employs economic input‐output (EIO) LCA, which permits an assessment of environmental impacts of the entire supply chain associated with conventional and recycled construction materials. EIO‐LCA uses
The energy savings from using recycled materials on the 4.7‐km section corresponds to the annual energy consumed by 115 average households in the U.S. (based on 2005 energy use statistics). Similar application of recycled materials on a nationwide basis corresponds to an energy savings of 360,000 terajoules in the U.S. annually, which is equal to the energy consumed by 3.6 million average homes, a city the size of New York or Los Angeles. (Lee et al., TRB, 2010.)
NCHRP 25‐25/63 Environmental Corridor Management
16
economic input‐output data (e.g., data from the U.S. Department of Commerce) as well as resource input data and environmental output data to analyze both the direct impact and supply chain effects. The LCA and associated cost assessment were conducted for a 50‐year period, which is the standard practice employed by WisDOT. This analysis included one rehabilitation of the pavement at 29 or 32 years, based on the anticipated durability of the materials. The life‐cycle cost analysis was conducted using the spreadsheet program RealCost. Agency costs and work zone user costs were included in the life‐cycle cost analysis. The user costs included delay costs (cost of delay time spent in work zones) and crash costs associated with construction and rehabilitation.19
For both cases, the surface hot mix asphalt (HMA) component dominated in energy and water usage, CO2 emissions, and hazardous waste generated; the overall benefits of using recycled materials in the base and subbase course were modest. 20 Using recycled materials in the HMA (or an alternative asphalt construction process) and in other elements of the ROW (e.g., pipes, guard rails, barriers, signage) in the alternative design would further enhance the environmental benefits. Still, using recycled materials only in the base and subbase layers results in significant environmental and economic benefits, especially when extrapolated over a larger geographical area. The energy savings from using recycled materials on the 4.7‐km section corresponds to the annual energy consumed by 115 average households in the U.S. (based on 2005 energy use statistics). 21 Similar application of recycled materials on a nationwide basis corresponds to an energy savings of 360,000 terajoules (TJ) in the U.S. annually, which is equal to the energy consumed by 3.6 million average homes (e.g., a city the size of New York or Los Angeles). 22 Most of the 20% reduction in global warming potential (CO2‐equivalent, or CO2e) from using recycled materials is from reduced emissions during material production. 23 Heavy equipment operation is the main source of CO2e emissions during material production. Since most recycled materials are available as a byproduct from another operation (e.g., fly ash is a byproduct of electric power production), the involvement of heavy equipment is reduced or eliminated, along with an associated reduction in CO2e emissions.
Famously, Socolow and Pacala have calculated that to stabilize greenhouse gas emissions at current levels, the construction industry worldwide must reduce emissions by 22.7 billion Mg‐CO2e over the next 50 years.24 Because highway construction accounts for 6.8% of total construction, Lee, et al., calculate that the highway construction industry would need to reduce emissions by 1.54 billion Mg‐CO2e over 50 years.
25 Based on the amount reduced for this study and the projection by Carpenter, et al., that 6 million km of roadway will be constructed in the U.S. over the next 40 years,26 Lee, et al., figure that just using recycled materials in roadway construction could achieve an emissions reduction of 1.30 billion Mg‐CO2e over 50 years. This estimates is based on the relatively modest changes in pavement design illustrated in their example, making the 50‐year target appear practical with other modest changes to pavement designs. 27
Approximately 13% of the total energy savings obtained using recycled materials is associated with material production, primarily with the heavy equipment used to mine and process conventional construction materials. Use of recycled pavement materials in situ also reduces the energy associated with transportation (e.g., transport to a landfill for disposal and transport of new materials to the construction site). Using recycled materials in the pavement design also reduces the amount of hazardous waste produced and the amount of water consumed. The reduction in hazardous wastes results in lower management costs.28 In addition, water savings are substantial: using recycled materials results in a savings of 1.9 million liters of water (11% or 0.4 million L/km)

NCHRP 25‐25/63 Environmental Corridor Management
17
for the 4.7‐km section considered in the analysis.29 Similar application of recycled materials on a nationwide basis (assuming 150,000 km of construction annually) could potentially result in an annual reduction of 1.2 million Mg of hazardous waste and a savings of 60 billion L of water nationwide.30 The life‐cycle costs and the cost savings using recycled materials also include avoidance of landfill disposal of the recycled materials based on an average landfill tipping fee of $40/Mg , helping to produce a 21% reduction in total life‐cycle costs by using recycled materials in lieu of conventional materials, along with a longer service life.31
Robinette and Epps performed a life‐cycle cost estimate of materials specific to hot mix asphalt, including reclaimed asphalt pavement, asphalt shingles, and warm mix asphalt, as well as aggregate base stabilization and subgrade treatments, and rehabilitation/maintenance activities that focus on in‐place recycling such as hot in‐place and cold in‐place recycling.32 In most instances, these activities can reduce energy consumption, emissions generation, and conserve natural resources (aggregate and asphalt binder), with the added benefit of reducing the price of construction. These materials and technologies show great promise in helping agencies cope with rising construction prices, while at the same time addressing environmental stewardship concerns shared by DOTs and the public.33
A recent study in Finland discusses the additional dimension of the transport distances for materials and the environmental impacts of transport. Parikka‐Alhola noted that the effect of the transport distance on emissions and on fuel and energy consumption is considerable, especially when large quantities of material are transported, but other factors cause variation as well:34
Lengthening the transport distance from 10 to 50 km can affect the level of individual loadings by as much as 30% (Mroueh et al., 2000). For example, in the production of concrete, there is a linear ratio between transport distances and environmental impacts; when the transport distances are reduced by 40%, the environmental loads from transport operations decreases at approximately the same level as for raw material production (Sjunnesson, 2005). In addition to the transport distance, the loading rates of the trucks also have considerable effects on the impacts (Mroueh et al., 2000). There is also considerable variation in the age and type of trucks used by different contractors in the road sector, which inevitably affects the environmental load (Birgisdóttir et al., 2006; Stripple, 2001). This shows the importance of precise information on the transport distance, transport mode and the type of trucks and machinery in order to model the energy consumption and different emissions of any rehabilitation work. (Birgisdóttir et al., 2006)
The Technical Research Centre of Finland (VTT) developed a computer program called Meli to assess the life‐cycle impacts of road construction, and to define the environmental award criteria for road construction procurement. When they tested the methodology, major differences between the tenders occurred in the environmental loads of energy, CO2, NOx, SO2, VOC, particles, CO, dust and natural materials, primarily caused by major differences in the thickness of the pavement and in the transport distances between the bids. The researchers emphasized the if CO2 emissions were a criterion, it would capture transport, and the idle time of trucks and machinery could also be included in the assessment.
2.2.3 Making LCA Evaluations Part of Corridor Environmental Management
There are decisive cost and environmental advantages to utilizing recycled materials and re‐using materials to cut down on the need for transport. Many LCAs have been done to assess the

NCHRP 25‐25/63 Environmental Corridor Management
18
environmental impacts related to road construction in Europe over the last 15 years, and the approach has increased dramatically in the U.S. in the past few years. Translating costs in this way also allows DOTs and stakeholders to weight the environmental benefits of various classes of DOT actions, both among road and pavement rehabilitation choices, and across sectors, in terms of impacts on not only traditional resource inputs, but also energy consumption, GHG emissions, water consumption, waste, and hazardous materials.
The use of life‐cycle assessment at the early stage of the design phase prior to the tender competition and decision‐making can be an efficient way to direct the environmental performance of the supplier, and the selection of materials for construction work, i.e., planning the construction work more on the basis of the availability and environmental impacts of different materials, as well as taking into technical and cost considerations. Finally, performance can be catalogued as roadway characteristics, compared to performance on other corridors (or to other districts or regions), rolled up to statewide performance indicators, or used to understand relation to other choices and trade‐offs.
2.2.4 Recycling and Resource Minimization in Other Aspects of Corridor Maintenance
DOTs can strive to minimize use of resources in a number of other aspects of corridor operations and maintenance. For the sake of brevity, these ideas are discussed only briefly here:
• Low‐input and easy maintenance solutions. For example, vegetated areas for filtering and slowing storm water runoff provide benefits on many levels, from water quality, to habitat, to reduced maintenance (with reduced vehicle mileage, labor hours, materials), and potentially better long‐term functioning.
• Sustainable vegetation solutions and use of native vegetation. Use of native vegetation and minimization of mowing reduces labor, fuel, and other inputs and is likely to result in a more sustainable system. Environmental benefits are reduced emissions from service vehicles and potentially less nitrogen in runoff from mowed areas. If grasses and shrub choices minimize need for trimming, burning, and disposal, waste is minimized there as well.
• Making and use of compost. Well‐aged compost soil amendments have been found to improve water pollution reduction efficiencies on slopes and in swales as well as facilitate revegetation. Such compost can be used in swales, filter strips, and bioretention cells to improve water retention and pollutant removals. WSDOT’s Ecology Embankment design has shown very good performance.35 Texas DOT uses compost to prevent roadway erosion by allowing vegetation to grow more quickly, thus stabilizing the surrounding soil.36
2.2.5 Minimizing the Need for New Construction with Operational Improvements
Optimizing corridor operations can reduce the need for construction of additional lanes. Intelligent transportation systems (ITS) such as coordinating traffic lights and metering on‐ramps increase roadway capacity. For intersections of a certain size, additional reductions accrue with more efficient types such as changing signalized intersections to roundabouts. A study on opportunities for modern roundabouts to address climate change concluded that 25 roundabouts replacing existing traffic signals in the City of Burlington, Vermont would meet more than 20% of the city’s
NCHRP 25‐25/63 Environmental Corridor Management
19
Affordably Promoting Community, Economic, and Environmental Sustainability Along Route 332, NYSDOT avoided adding lanes and found operations and management solutions by working with the community to rezone to reduce strip mall development; optimize traffic signal spacing to absorb new development effectively; include restrictive medians to reduce conflict points and to reduce congestion at turning points; and improve access control for traveling in and out of businesses. Within three years, $30 million dollars of development and $120 million in investments and appreciation in land values were realized. In Saratoga Springs, the city adopted “form-based zoning” in its downtown, providing flexibility to mix land uses (but no residential uses on the first floor), which was successful in promoting economic growth and downtown development, while limiting traffic growth. Clifton Park has pursued multiple strategies. It realized that a full build-out of its existing plan had unacceptable costs. In response, it developed a new land conservation plan, with density restrictions, amenity fees on new development, access management, parcels targeted for permanent protection, a system of tradable development rights and new design guidelines. Clifton Park now has 40-60 businesses along the state highway, none of which has its own driveway. Most businesses are fully accessible by local roads. There also is a growing town-wide bicycle and pedestrian system intended to serve the entire community. In Virgil, New York, near the Greek Peak Ski Area, NYSDOT was about to launch a corridor study, but it discovered that the town was embarking on a rezoning effort at the same time. NYSDOT realized that it could accomplish more by working with the community on its new zoning policy than it could through a conventional corridor study, so it decided to put its efforts there. NYSDOT, the community and the regional planning board met for more than a year to review the draft zoning ordinance, and to develop suggestions for improvement. They started by defining what the community hoped and expected to see in 10-15 years, and reflecting on what they hoped to achieve through zoning that was worth the pain of regulating. They wanted to establish conditions to attract economic development while protecting landowners’ ability to sell property. Yet there was a consensus that preserving amenities would produce a greater value for the community, in terms of property values and quality of life. Specifically, there was agreement on four basic objectives: protect the groundwater, reduce accidents, limit frontage road development and minimize the visual impacts of development. Specific requirements related to transportation were kept minimal. Instead, there was a decision to allow the zoning regulations to do the work of protecting the transportation system. The new code provided incentives for small lots and commercial and residential clustering in certain areas, as well as incentives for open space and farmland protections in others. It included “clearance zones” to keep development away from the roadways. The ordinance allowed five-acre lots with 450-foot frontages over most of the area. The idea was that large lots here are a simple way to protect resources, and they provide an opportunity to distribute the benefits of property sales more widely. The ordinance does not mandate compact growth, but it does provide an opportunity to create a village over time if done right. (NYSDOT Planner, Steve Munson) All examples from New York State Forum on Healthy Communities, 2006.
overall goal of reducing GHGs to 10% below 1990 levels.37
Due to both short‐term and long‐term budget constraints, some DOTs and interest groups are advocating and implementing “Fix it First” policies. While some capacity additions will always be necessary and a part of a DOT’s business, induced travel impacts and creative alternatives are receiving more attention (see text box below with examples from a New York State Forum on Healthy Communities). The added capacity from additional Single‐Occupancy Vehicle (SOV) or High‐Occupancy‐Vehicle (HOV) lanes reduces travel times and costs, resulting in attracting trips from other routes and modes, and encouraging longer and more frequent travel,38 such that a 10% increase in lane‐miles is associated with up to a 4% increase in VMT in the short term and a 10%

NCHRP 25‐25/63 Environmental Corridor Management
20
increase in the long‐term.39 Economically, a “Fix it First” policy is significantly less expensive and less resource‐intensive than creating new lanes. While studies show there can be short‐term GHG reduction from added roadway capacity and bottleneck relief, a recent report titled Moving Cooler argues that cumulative nature of GHG impacts require analyzing additional capacity beyond a 40‐year horizon, in which the GHG reduction benefit is limited.40
2.2.6 Transportation Planning and Livability
In his July 14, 2009, testimony to the U.S. Senate Committee on Environment and Public Works, USDOT Secretary Ray LaHood stated:
Even if vehicle fuel efficiency were to reach 55 miles per gallon by 2030, we would still see only modest decreases in transportation carbon dioxide emissions without a decrease in vehicle miles traveled. Addressing VMT growth plays a key role in decreasing transportation related greenhouse emissions and should be included in overall efforts to prevent climate change. One way to achieve significant reductions in VMT is to develop more livable communities.41
Secretary LaHood went on to explain that in the next surface transportation reauthorization, U.S. DOT will prioritize reducing VMT and GHG emissions through smart community planning and by enacting measures that provide added economic benefit to all Americans. Two days later, USDOT, EPA, and the U.S. Department of Housing and Urban Development (HUD) announced the creation of a new interagency Partnership for Sustainable Communities. Through a set of guiding livability principles and a partnership agreement that will guide the agencies' efforts, the partnership aims to coordinate federal housing, transportation, and other infrastructure investments to protect the environment, promote equitable development, and help to address the challenges of climate change. Some of the livability principles it espouses are applicable on a corridor level, although others are more relevant to planning than to operations:
• Provide more transportation choices. Develop safe, reliable, and economical transportation choices to decrease household transportation costs, reduce our nation’s dependence on foreign oil, improve air quality, reduce greenhouse gas emissions, and promote public health.
• Promote equitable, affordable housing. Expand location‐ and energy‐efficient housing choices for people of all ages, incomes, races, and ethnicities to increase mobility and lower the combined cost of housing and transportation.
• Enhance economic competitiveness. Improve economic competitiveness through reliable and timely access to employment centers, educational opportunities, services and other basic needs by workers, as well as expanded business access to markets.
• Support existing communities. Target federal funding toward existing communities—through strategies like transit oriented, mixed‐use development, and land recycling—to increase community revitalization and the efficiency of public works investments and safeguard rural landscapes.
• Coordinate and leverage federal policies and investment. Align federal policies and funding to remove barriers to collaboration, leverage funding, and increase the

NCHRP 25‐25/63 Environmental Corridor Management
21
accountability and effectiveness of all levels of government to plan for future growth, including making smart energy choices such as locally generated renewable energy
• Value communities and neighborhoods. Enhance the unique characteristics of all communities by investing in healthy, safe, and walkable neighborhoods—rural, urban, or suburban.
• Value communities and neighborhoods. Enhance the unique characteristics of all communities by investing in healthy, safe, and walkable neighborhoods—rural, urban, or suburban.
The federal Partnership for Sustainable Communities is working to achieve environmental justice and other environmental goals by targeting development (and enhancements, such as those noted above) to locations that already have infrastructure and offer transportation choices. The partnership is also developing livability measures and tools that indicate the livability of communities, neighborhoods, and metropolitan areas, a primary one of which is likely to be safe, affordable access. These measures could be adopted in subsequent integrated planning efforts to benchmark existing conditions, measure progress toward achieving community visions, and increase accountability. U.S. DOT outlines its main goals in the effort, which it aims to accomplish through integrated planning on corridors and across regions:42
• More choices for affordable housing near employment opportunities.
• More transportation options, to lower transportation costs, shorten travel times, and improve the environment.
• The ability for travelers to combine several errands into one trip through better coordination of transportation and land uses.
• Safe, livable, healthy communities.
U.S. DOT is aiming to develop better tools to track transportation options and expenditures, along with developing standardized and efficient performance measures.43 A number of DOTs are moving ahead on their own and have identified ways that DOTs and communities can improve corridors for all users. For example, the Oregon DOT (ODOT) handbook, Main Street…When a Highway Runs Through It, has been a resource for DOTs and communities for over a decade now.44 Similarly, Massachusetts DOT’s (MassDOT’s) 2006 Project Development & Design Guide is another national model for enhancement or retrofitting of corridors to serve all people and modes.45
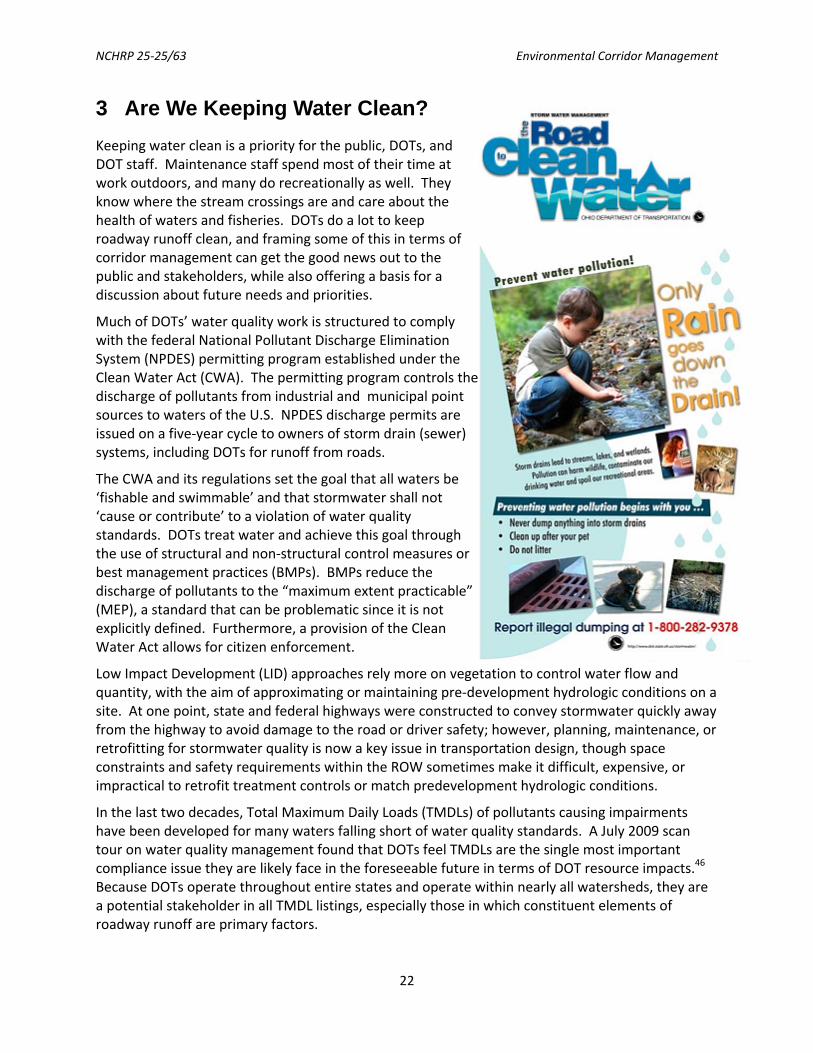
NCHRP 25‐25/63 Environmental Corridor Management
22
3 Are We Keeping Water Clean? Keeping water clean is a priority for the public, DOTs, and DOT staff. Maintenance staff spend most of their time at work outdoors, and many do recreationally as well. They know where the stream crossings are and care about the health of waters and fisheries. DOTs do a lot to keep roadway runoff clean, and framing some of this in terms of corridor management can get the good news out to the public and stakeholders, while also offering a basis for a discussion about future needs and priorities.
Much of DOTs’ water quality work is structured to comply with the federal National Pollutant Discharge Elimination System (NPDES) permitting program established under the Clean Water Act (CWA). The permitting program controls the discharge of pollutants from industrial and municipal point sources to waters of the U.S. NPDES discharge permits are issued on a five‐year cycle to owners of storm drain (sewer) systems, including DOTs for runoff from roads.
The CWA and its regulations set the goal that all waters be ‘fishable and swimmable’ and that stormwater shall not ‘cause or contribute’ to a violation of water quality standards. DOTs treat water and achieve this goal through the use of structural and non‐structural control measures or best management practices (BMPs). BMPs reduce the discharge of pollutants to the “maximum extent practicable” (MEP), a standard that can be problematic since it is not explicitly defined. Furthermore, a provision of the Clean Water Act allows for citizen enforcement.
Low Impact Development (LID) approaches rely more on vegetation to control water flow and quantity, with the aim of approximating or maintaining pre‐development hydrologic conditions on a site. At one point, state and federal highways were constructed to convey stormwater quickly away from the highway to avoid damage to the road or driver safety; however, planning, maintenance, or retrofitting for stormwater quality is now a key issue in transportation design, though space constraints and safety requirements within the ROW sometimes make it difficult, expensive, or impractical to retrofit treatment controls or match predevelopment hydrologic conditions.
In the last two decades, Total Maximum Daily Loads (TMDLs) of pollutants causing impairments have been developed for many waters falling short of water quality standards. A July 2009 scan tour on water quality management found that DOTs feel TMDLs are the single most important compliance issue they are likely face in the foreseeable future in terms of DOT resource impacts.46 Because DOTs operate throughout entire states and operate within nearly all watersheds, they are a potential stakeholder in all TMDL listings, especially those in which constituent elements of roadway runoff are primary factors.

NCHRP 25‐25/63 Environmental Corridor Management
23
3.1 Advances in Stormwater Management Along Corridors A number of recent developments may assist DOTs in long‐term environmental management for water quality along their corridors, via pavements as well as management of filtration capability and structures in the ROW. Source‐control applications include:
1. The elimination of mowing for environmental (NY), aesthetic (Quebec), safety (TX), or budgetary reasons (many states), potentially reducing a source of organic nitrogen in runoff.
2. Reduction in use of salt and deicers by using better calibration; procedures, training, and feedback systems; and more sophisticated application technology (many states).
3. Reduction in herbicide and pesticide application (notably WSDOT, Texas DOT, and North Carolina (NCDOT)).
4. Advanced practices in public education such as reporting of illegal dumping by adopt‐a‐highway and DOT crews (NCDOT).
Maryland SHA is piloting a design‐build capital program for retrofit treatment BMPs, assisting maintenance in addressing an area that can be difficult, given stretched maintenance budgets and staff. The program (“Design, Build, Operate, Maintain,” or DBOM), administers a performance‐ based contract for a BMP with a 3‐year maintenance period. The maintenance portion of the contract can be extended at the option of the SHA for additional 3‐year increments.
Other notable practices from the recent stormwater management scan tour include: 47
• Permeable Friction Course Overlay. Researchers at the Universities of North Carolina and Texas at Austin have determined that an open‐graded friction course applied over a conventional pavement section can dramatically improve highway runoff water quality. This practice is especially appealing in light of the associated benefits (enhanced safety, reduced noise) and broad applicability for retrofit of existing highways.
• Condition assessments of stormwater quality outfalls and other infrastructure and prioritization of maintenance and improvements. Maryland’s system is a national model. NYSDOT has developed an Access database to track attribute data and maintenance activities for permanent BMPs, including project and practice information, inspection information, and maintenance. The system can generate inspection forms detailing the maintenance history for a particular location. Location‐specific maintenance schedules are in the works.
• Batch Detention. UT‐Austin also developed a low‐cost retrofit application for wet or dry detention basins that significantly improves removal efficiency for particulate constituents. An active pond outlet (requiring no human operator) detains stormwater runoff in quiescent conditions, improving removal compared to conventional basins with passive outlets. The system also allows the possibility of creating a network of basins linked by telemetry and operated by a rainfall‐runoff model for even greater system efficiency gains.
• Stormwater Harvesting. The University of Central Florida is engaged in developing approaches for harvesting of stormwater runoff for landscape irrigation. In addition to being a sustainable approach, stormwater harvesting may become an important application to meet hydromodification mitigation requirements and is an important LID application, although work remains on how to apply this to highway systems.
NCHRP 25‐25/63 Environmental Corridor Management
24
3.2 Culture of Transparency and Stewardship Eases Compliance with Stormwater Regulations
NCDOT has reduced the contents of its annual report significantly by establishing regular communication with its regulator. NCDOT holds monthly coordination meetings with DNR NPDES coordinators and quarterly meetings with the state Division of Water Quality. This continuous communication has increased regulators’ comfort levels to the extent that the DOT has been able to eliminate a large portion of the annual reporting formerly required as a part of the NPDES permit. NCDOT has also found that avoiding centralization of environmental responsibilities (i.e., breaking down silos) has also promoted ownership, compliance, and stewardship within the organization, in the context of commitment from the highest levels of the organization.
The Maryland State Highway Administration (MDSHA) utilizes multiple, interfacing tracking systems to facilitate management of aquatic resources along their corridors. MDSHA tracks water quality and wetland related requirements on all projects, both major and minor, to help achieve an agency business plan goal to meet or exceed all environmental commitments made during the NEPA and permitting processes, including all terms and conditions. Reporting and tracking systems have helped build comfort levels within and across agencies and enabled MDSHA to operate within more efficient, trusting relationships. MDSHA’s system is unique in that it provides 24‐hour access to an environmental monitoring reporting system for interagency partners at the U.S. Army Corps of Engineers and the state Department of Environment.
• Environmental Monitor’s Toolkit (EM Toolkit). MDSHA uses an independent environmental monitor (IEM) to represent all regulatory agencies involved at a project site. The EM Toolkit is mainly used for projects that require IEMs, namely those with CWA 404 permits, Maryland Department of the Environment (MDE) wetland permits, and design‐build projects. The EM Toolkit is applied statewide, is available via the web, and has been used on all projects requiring IEMs since Fall 2006. The EM Toolkit allows the IEM to keep key stakeholders informed by updating the following information for each applicable project:
o Daily inspection reports – details daily activities on‐site
o View inspection status ‐ provides a mechanism to notify stakeholders manually or automatically through assignment of an inspection status.
o Track project issues – if issues arise, tracks issue review notes from daily inspections, and how issues are resolved.
o Track permit conditions ‐ ensure each permit condition is met.
o Track project impacts – ensure that previously unapproved impacts have not occurred.
o Upload any supporting documents ‐ project photos, construction plans, GIS layers, etc.
o Document management functions: all project supportive data are available in one central location, creating effective quality assurance/quality control.
• MDSHA Environmental Programs Division (EPD) Toolkit is utilized by the agency’s Environmental Program Division (EPD) staff and consultant staff to ensure compliance on all MDSHA construction and maintenance projects with wetland impacts. The program

NCHRP 25‐25/63 Environmental Corridor Management
25
establishes timelines, identifies when things need to be done, and has the ability to provide notifications for permit conditions. As it is Oracle‐based, it can interface easily with other systems to produce reports. It can track permit determinations, including that a permit is not required, and allows only qualified people to have the capability to make determinations. EPD staff have been using the Toolkit for all projects since October 2007. The system contains standard permit conditions and the ability to add/tailor conditions. The system also tracks estimated, permitted, and actual impacts for capital and maintenance projects.
• MDE Toolkit tracks the permitting process of MDSHA projects that require authorization by Maryland Department of the Environment’s Non‐Tidal Wetlands and Waterway Division. Consultant reviewers enter some project information.
The Toolkits are all based on the same framework, which allows data to be easily shared between the different applications. They provide:
1. A web‐based, versatile method of distributing information in a timely fashion.
2. One centralized project review document for easy reference and data retrieval.
3. Search ability by keyword.
4. The ability for permitting/regulatory agencies to assess impacts quickly and provide comments and recommendations, as required.
MDSHA has typically accommodated differences in systems by building interfaces and by creating transfer points between systems so they can import and export to one another. Integration of disparate workflows, such as MDE permit reviews and project creation, into a single data repository reduces redundant data management and improves process collaboration.
MDSHA continues to enhance use of the toolkit systems for interagency communication. That module has the ability to further facilitate issue resolution by storing all the communication related to the project in one central location and offering an area for dialogue by the different agencies. MDSHA is also adding a GIS platform and an activities calendar to track project activities relating to permit compliance, including document submittal reviews, meetings, and other associated activities. This will function as a workflow management tool, providing a calendar, milestones, and reminders on a daily, weekly, or monthly basis.
MDSHA is making progress toward its agency‐wide strategy of having GIS serve as an information systems integrator, but like other agencies attempting this, work is proceeding somewhat slowly and seems to integrate with maintenance last.
MDSHA noted that “one of the reasons this (the EM Toolkit) has worked so well is that it was built by (with extensive input from) an Environmental Monitor.” It provides:
• A way for Environmental Monitors to report in real time. Real‐time issue resolution has been a lot quicker and eliminates confusion. Everyone arrives with the same information.
• Immediate notification of stakeholders and action when there is a risk of an environmental violation.
The system has standardized the reporting for environmental monitors assigned to MDSHA projects statewide and led to a more standard inspection and reporting process on all MDSHA projects,
NCHRP 25‐25/63 Environmental Corridor Management
26
facilitating quality improvement overall. No one wants to waste time entering data if there is an easier or automatic way to do it, and staff may not enter information if they are not required to do so and ensure that the system contains a reliable minimum set of data. MDSHA attends to this by assigning responsibilities for data entry, maximizing the ability of systems to talk with each other, and even using data entered by other agencies when it is applicable.
Use of the EM and EPD Toolkits results in accurate documentation of project compliance, actively helping MDSHA realize its goal of 100% compliance on projects. A 2008 FHWA National Performance Review benchmarking study found that “MDSHA’s system is superior in its ability to document completion of commitments through a system of regular inspections, either daily by Independent Environmental Monitors on Design‐Build and Section 404/wetlands/waterways projects or through a regular series of monthly visits by Environmental Program staff. Connecticut, New Hampshire, North Carolina, Pennsylvania, and Virginia have all examined MDSHA systems for potential application.”48 Meanwhile, MDSHA has gone far toward virtual elimination of interagency controversies in certain areas, such as wetland and waterway authorizations and erosion and sedimentation control compliance.
3.3 Discussing Costs & Benefits of BMPs, MS4 Approaches, & Retrofits Most DOTs have developed or utilize design manuals for runoff control and stormwater quality along corridors. Increasingly, DOTs have to decide where stormwater quality retrofits may be sufficiently valuable to implement and in what order these investments should be prioritized. In addition to extensive design guidance available in both manual and on‐line formats, a number of BMP selection and evaluation systems are emerging.
As mentioned earlier, a constructive dialogue with regulatory agencies should include program costs to assess the balance with benefit. However, many of the DOT programs do not accurately assess and record implementation costs, figuring this in itself is an additional cost. In recent years, DOTs have begun performing research on and exploring alternatives to the most expensive systems and MS4 permitting approaches that are sometimes requested and are very difficult to maintain. Comparative research has been occurring on the effectiveness of vegetated biofilters, grassy swales, and the use of compost layers on reconstructed slopes. NCHRP 25‐25/04, Environmental Stewardship Practices, Procedures, and Policies for Highway Construction and Maintenance, has a section on the highly cost‐effective pollutant reduction benefits of compost usage. More recent information on vegetated biofilters includes multiple research projects by Geosyntec, including the national BMP database, and university‐DOT research partnership efforts.49
The Water Environment Research Foundation (WERF) report by Black and Veatch titled “Performance and Whole Life Costs of Best Management Practices (BMPs) and Sustainable Urban Drainage Systems (SUDS)” is the most comprehensive available report on the cost‐effectiveness of BMPs. WERF has also produced some cost spreadsheet templates where users can put in their site‐specific information to help them estimate costs (see www.werf.org/bmpcost).
Analysis of trade‐offs and scenarios, including costs and benefits, can be facilitated by Maintenance Quality Assurance information and decision‐support systems. Benefits are reflected by the predicted change in highway and environmental conditions that will result from performing maintenance activities to the specified levels of service. Goals or level‐of‐service targets relative to current performance can be used in a feedback loop to assess how the maintenance program has performed and to adjust the program and funding accordingly. Environmental or service level goals

NCHRP 25‐25/63 Environmental Corridor Management
27
thus facilitate management accountability and provide a means of communicating program accomplishments and value provided. This approach is in keeping with international standards for monitoring and measurement set out by ISO 14001.
A number of examples of such systems exist. Oregon DOT started out with stand‐alone systems tracking environmental assets for archaeological sites, wetland mitigation areas, material sources, and environmentally sensitive areas along the ROW. ODOT is nationally recognized for the latter system, which completely inventoried sensitive resources along nearly 6,000 miles of state highway as part of its Salmon Resources and Sensitive Area Mapping Project, described elsewhere in this report. This effort and MDSHA’s statewide culvert and drainage system inventory are described below. More often, conditions are tracked through periodic inspection surveys and estimates of environmental deficiencies. Since complete surveys encompassing all highway features are difficult and expensive to conduct, DOTs often employ statistical sampling, as in the case of NCDOT and WSDOT, or even an implicit/GIS inventory of outfalls, with explicit inventory occurring only as needed and/or at potential retrofit sites, as along North Carolina’s over 75,000 miles of roads.50 Even when legacy maintenance management systems have an inventory of maintained highway features, they often lack provisions to record feature condition over time or to incorporate environmental data that can be used to create baselines and track progress to target level of service or environmental condition.
3.4 DOT Culvert and Outfall Retrofit Programs As the TRB Culverts and Hydraulic Structures Committee notes, many miles of American highways were completed prior to 1970 and thus a significant number of highway culverts have now experienced service lives in excess of 35 years. Unlike bridge assets, which are relatively few in number and follow a federally mandated inspection frequency, a typical DOT owns tens of thousands of culverts, many without specified maintenance procedures.51 DOTs are increasingly using developing their own tracking and decision‐support systems to assess all culverts in their inventory, track their service history, manage their maintenance, and use condition assessment data resulting from inspections to budget for maintenance, repair, and replacement work. MDSHA, Caltrans, ODOT, and WSDOT are some of the DOTs that have worked with their state resource agencies to survey culverts statewide and develop systems to identify and prioritize those that need improvement. MDSHA’s system is briefly described below in section 3.4.2.
3.4.1 Outfall Categorization & Improvement – Florida and Washington State DOTs
In the late 1990s WSDOT and FDOT were among the first to develop electronic systems for categorizing and improving outfalls.52 In the case of WSDOT, the purpose of the system is to assess which projects provide the best return on investment in terms of environmental effectiveness and pollution reduction. WSDOT’s system includes a condition indexing methodology and support program that enables users to quickly evaluate and compare projects and generate benefit‐cost ratios for projects.53 FDOT’s initial investment in outfall mapping was the agency’s initial
Figure 1. Stormwater monitoring location to evaluate treatment facility
effectiveness. (WSDOT)

NCHRP 25‐25/63 Environmental Corridor Management
28
funding of the Florida Geographic Data Library and, ultimately, the Efficient Transportation Decision‐making (ETDM) effort.
3.4.2 MDSHA’s Water Quality Improvement and BMP Retrofit Program
As part of the agency’s environmental quality improvement efforts, MDSHA has implemented a very structured improvement program for the 1,500 stormwater management facilities that it owns, with inspection teams of trained staff who identify further environmental improvements that can be made. MDSHA has complemented this work by mapping the entire state for opportunities for retrofitting BMPs, for pollution prevention and stream restoration that go beyond requirements, and for development of a plan for systematic implementation of those improvements.
The grade‐based rating system for stormwater management facilities include an inventory, database, and photo record of all facilities statewide and their maintenance status. This data is kept within a GIS. Under the rating system, those graded A or B are considered functionally adequate. By 2009, MDSHA had reached 95% functional adequacy for their system, leaving only 5% needing maintenance or retrofitting to achieve functional adequacy. MDSHA has also partnered with many local jurisdictions in their watershed assessments and restoration efforts.
MDSHA’s drainage system GIS is designed to be used for planning‐level computations and operations‐level activities, rather than for design or simulation modeling. The database is used to determine the general location of systems and drainage areas, to track maintenance activities, and address public complaints. Information in the database is intended to be sufficient to identify, locate, and evaluate every BMP to provide an overall assessment of MDSHA’s BMP inventory. The information in MDSHA’s drainage management system assists the agency with decisions on inspection, maintenance, repair, and retrofit of BMP facilities, in addition to supporting compliance with MDSHA’s NPDES MS4 permit. The decision‐support system can perform the following types of queries within a graphic environment :54
• By individual structure, system, or BMP and its associated data attributes;
• By outfall (e.g., size, type, etc.);
• Within a drainage area;
• Within a watershed;
• Within a jurisdiction;
• Statewide; and
• By roadway contract
The system has evolved to also support hydrologic analysis of the drainage systems for the preparation of estimates of the quantity and quality of storm water runoff from MDSHA ROWs and the effects of changes in stormwater management (SWM) practices. More recently, MDSHA has added visual impact assessment components to its evaluation and remediation.
MDSHA also developed a work delivery system using operating and capital programs, a flow chart for SWM facility remediation action along with cash flow estimates, and a budgetary cash‐flow estimation system with the help of pilot projects. MDSHA developed training for designers on stormwater management based on data found in the inspection program and performed discharge characterization of stormwater to analyze quality of highway runoff.
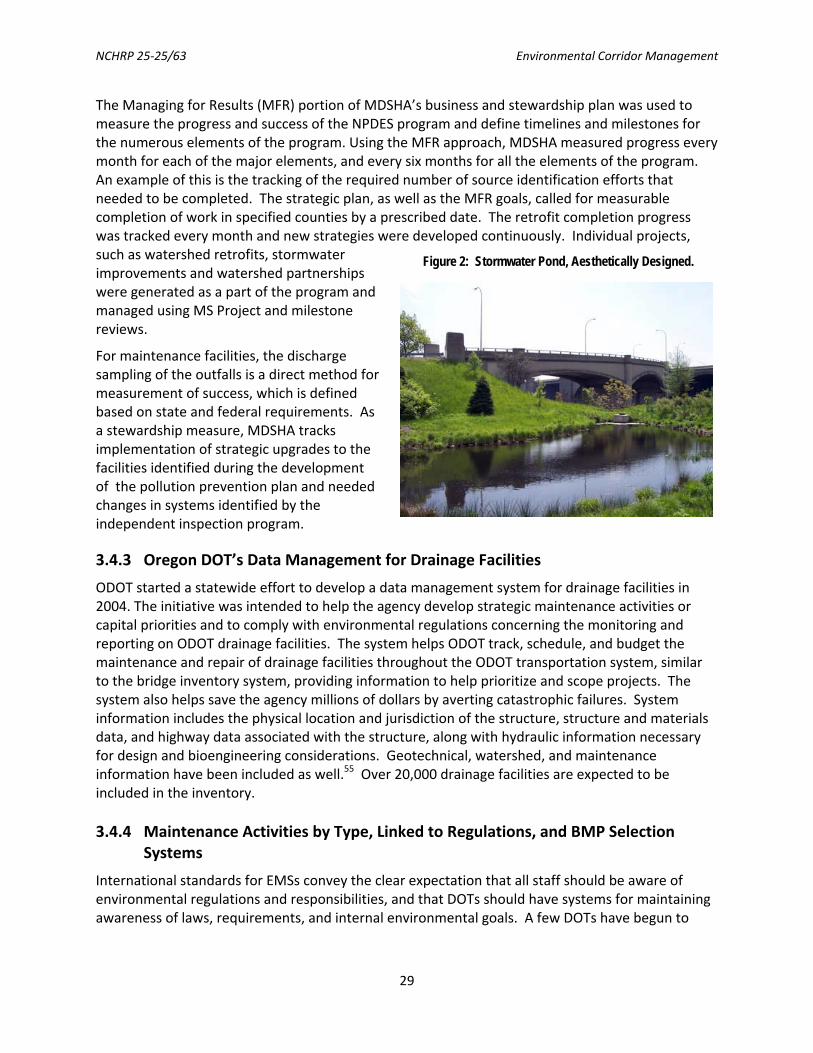
NCHRP 25‐25/63 Environmental Corridor Management
29
The Managing for Results (MFR) portion of MDSHA’s business and stewardship plan was used to measure the progress and success of the NPDES program and define timelines and milestones for the numerous elements of the program. Using the MFR approach, MDSHA measured progress every month for each of the major elements, and every six months for all the elements of the program. An example of this is the tracking of the required number of source identification efforts that needed to be completed. The strategic plan, as well as the MFR goals, called for measurable completion of work in specified counties by a prescribed date. The retrofit completion progress was tracked every month and new strategies were developed continuously. Individual projects, such as watershed retrofits, stormwater improvements and watershed partnerships were generated as a part of the program and managed using MS Project and milestone reviews.
For maintenance facilities, the discharge sampling of the outfalls is a direct method for measurement of success, which is defined based on state and federal requirements. As a stewardship measure, MDSHA tracks implementation of strategic upgrades to the facilities identified during the development of the pollution prevention plan and needed changes in systems identified by the independent inspection program.
3.4.3 Oregon DOT’s Data Management for Drainage Facilities
ODOT started a statewide effort to develop a data management system for drainage facilities in 2004. The initiative was intended to help the agency develop strategic maintenance activities or capital priorities and to comply with environmental regulations concerning the monitoring and reporting on ODOT drainage facilities. The system helps ODOT track, schedule, and budget the maintenance and repair of drainage facilities throughout the ODOT transportation system, similar to the bridge inventory system, providing information to help prioritize and scope projects. The system also helps save the agency millions of dollars by averting catastrophic failures. System information includes the physical location and jurisdiction of the structure, structure and materials data, and highway data associated with the structure, along with hydraulic information necessary for design and bioengineering considerations. Geotechnical, watershed, and maintenance information have been included as well.55 Over 20,000 drainage facilities are expected to be included in the inventory.
3.4.4 Maintenance Activities by Type, Linked to Regulations, and BMP Selection Systems
International standards for EMSs convey the clear expectation that all staff should be aware of environmental regulations and responsibilities, and that DOTs should have systems for maintaining awareness of laws, requirements, and internal environmental goals. A few DOTs have begun to
Figure 2: Stormwater Pond, Aesthetically Designed.

NCHRP 25‐25/63 Environmental Corridor Management
30
develop information and decision‐support systems that link maintenance activities to environmental requirements, measures, and necessary components:
• Environmental aspects and potential sources of pollution
• Regulations and thresholds for applicability
• Thresholds for implementation of other actions, activities
• BMPs or environmental stewardship practices
• BMP alternatives and selection support (appropriate application)
• Materials needed for BMP implementation
• Supplies of such materials available at different maintenance facilities/depots
• BMP installation guidance
• BMP inspection guidance
• BMP inspection schedule
To date, the Caltrans system most effectively links and accomplishes the above in an integrated fashion.
3.5 Winter Operations Practices for Water Quality Winter operations is an environmental management aspect that occurs along all highway corridors in snowy climes. Environmental best practices in this field are covered in detail in NCHRP 25‐25/04, Compendium of Environmental Stewardship Practices, Policies, and Procedures in Construction and Maintenance. A variety of electronic operational support equipment can now assist DOTs in tracking appropriate materials usage, with information able to be downloaded automatically so departments can work on continuous improvement.
The effect of de‐icing on water quality is a concern.56 Sand clogs streams and buries fish eggs, and salt poisons wells and vegetation. DOTs often track the amount of sand and abrasives they use, in addition to tracking vehicle calibration and usage by vehicle and driver. Other practices include:
• Equipping fleets with electronic spreader controls;
• Noting locations of salt‐vulnerable areas; and
• Describing alternate treatment practices in the vicinity of salt‐vulnerable areas.
The Transportation Association of Canada’s Recommended Practices for Developing Salt Management Plans provides excellent practice resources for salt management and usage in particular. This information can be used to establish a baseline and metrics for salt management practice and progress. Caltrans has developed a series of stormwater educational bulletins for staff in design, development, construction, and maintenance, including a maintenance bulletin dealing with stormwater quality in
Figure 3: Proper snow storage and runoff of abrasives and de-icing materials are water quality issues for DOTs (Photo: Caltrans)

NCHRP 25‐25/63 Environmental Corridor Management
31
winter maintenance.57 Ultimately, DOT could use a corridor basis to track and report all water quality management practices, including those for winter maintenance.
3.5.1 Maximizing Efficiencies of Anti‐Icing Programs
Anti‐icing programs have become increasingly common at DOTs due to their efficiencies and to de‐icing’s effects on water quality.58 A 2006 Connecticut study reviewed alternatives for winter maintenance operations, noting the benefits of anti‐icing and discussing alternatives to using salt. The Western Transportation Institute also examined the advantages and disadvantages of anti‐icing in a 2005 study. Constraints identified in the study include training and management, reliance on accurate weather forecasts, and public perception.
In Idaho, to assess the effectiveness of anti‐icing operations, winter road maintenance activities were analyzed for 5 years prior to the anti‐icing program and for 3 years after implementation. Mobility, productivity, and safety enhancements resulted from the anti‐icing treatment strategy. Comparing a 5‐year period without anti‐icing to a 3‐year period with anti‐icing, labor hours dropped by 62% and use of abrasives dropped by 83%, while the number of crashes also dropped by 83%. Mobility improved, as a single application of magnesium chloride was typically effective at improving traction for 3 to 7 days, depending on precipitation, pavement temperature, and humidity. Faster clearing of snow and ice reduced operation costs and enhanced productivity. Safety improvements were also realized by reducing the frequency of wintertime crashes. In a similar test in Montana, environmental outcomes were improved by minimizing abrasive usage, which contributes to poor air quality, drainage facility damage, and negative impacts on wildlife habitats. By applying anti‐icing chemicals before or at the beginning of a storm event, compacted snow was avoided or more easily removed. Reactive treatment required multiple material applications and only temporarily improved traction on snow‐covered roads.
3.5.1.1 Best Practices for Increasing Efficiencies in Anti‐Icing along Highway Corridors A number of DOTs have developed best practices to increase efficiencies in anti‐icing along highway corridors. Two studies conducted for the Ohio DOT sought to optimize the use of salt brine as an anti‐icing protocol. Researchers examined the decay of salt brine subjected to traffic and developed a decision tree that can be used to determine when and how to anti‐ice.
A 2008 paper titled “Using Real‐Time Road Condition Measurements for Automated Winter Road Maintenance,” describes a measurement system that, when mounted on snowplows, produces real‐time measurements of the tire‐road friction coefficient. These measurements are used to automatically adjust the application of deicing chemicals, which allows deicing materials to be used more efficiently and reduces environmental damage from chemical runoff.59
Previous national guidance includes a 2007 NCHRP report that provides a decision tool to assist anti‐icing program managers in selecting materials based on their cost, performance, and impacts on the environment and infrastructure. Further strategies and tactics for developing an effective anti‐icing program are presented in two 2004 NCHRP reports, which include a step‐by‐step procedure for determining an appropriate treatment strategy and recommended practices to minimize the use of anti‐icing materials to mitigate environmental impacts. The guides provide some update of a 1999 FHWA report provides guidance for six types of winter weather events and recommendations for selecting and applying materials; however, all include some common
NCHRP 25‐25/63 Environmental Corridor Management
32
recommended anti‐icing strategies, with which DOTs could potentially illustrate compliance, on a corridor basis:
• Application of anti‐icing treatments in advance of the precipitation, when pavement temperatures above 20° F to 23° F. Pavement temperature is critical to determining the appropriate treatment.
• Use of the minimum effective amount of salt. A 23% (or 23.3%) solution of liquid sodium chloride has been proven effective.
• Pre‐wetting of dry materials if sufficient moisture is not present on the pavement. For liquid chemicals, streamer or pencil nozzles are used, rather than fan nozzles. Shields also help retain and point liquid where it needs to go.
• Avoidance of anti‐icing in windy conditions, or when pavement temperatures fall below or rise above threshold temperatures.
Research done in Michigan in the 1970s indicates that 26% more salt stays on the road when pre‐wetted. This should mean that DOTs can make fewer trips to clear roads; however, adding a brine tank and liquids to a truck often requires reducing the vehicle’s dry capacity, potentially resulting in roughly the same number of trips overall. Thus, anti‐icing hasn’t been applied as a fuel‐saving strategy, but rather as a way to improve service by getting the roads back to normal sooner.60 An Oregon State University study showed that adding a simple spray skirt on the rear of a de‐icer truck’s spray bar improved application rates for the de‐icer/anti‐icer chemicals by more than 30%, reducing the number of passes needed.61 Iowa DOT has used spray skirts in the past but has moved more toward lowering spray bars and/or attaching small rubber hoses to the ends to keep the material closer to the roadway. The spray skirts were deemed too costly, so operators devised these lower‐cost solutions. These systems allow the operator to either spray liquids directly onto the roadway for anti‐icing operations, or, with the flip of the switch, redirect the liquids onto the dual spinners to pre‐wet the dry materials as they leave the truck. This truck is capable of carrying both liquid and dry materials which makes it easy to transition from anti‐icing (liquid application to the roadway before a storm) to deicing (application of dry material to a snow‐ or ice‐covered roadway during a storm). 62
Some cities and states have naturally occurring salt/brine aquifers underneath them. By using such an aquifer under the City of Syracuse, the City, the State, and County will reduce the amount of salt purchased and shipped across the state this winter. Utilizing the natural salt aquifer to reduce the amount of salt purchased and shipped to the area also saves energy that would have been used to produce and ship it.63
3.5.1.2 Product Selection, including Green Products in Snowfighting An approved product list provided by the Pacific Northwest Snowfighters Association includes products that have passed a variety of tests and meet environmental and health standards. NCHRP 25‐25/60, Increased Use of Environmentally Preferable, Non‐Toxic Products to Reduce Costs, Liabilities, and Pollution at DOT Offices, Maintenance Facilities and Rest Stops, is also identifying green materials. Methods to assist in material selection are also addressed in NCHRP Report 577, Guidelines for the Selection of Snow and Ice Control Materials to Mitigate Environmental Impacts. University of Iowa researchers proposed a method for selecting chemicals for specific anti‐icing needs in a 2001 report; products are scored by weighting seven categories and assigning grades to

NCHRP 25‐25/63 Environmental Corridor Management
33
each category. A 2009 Colorado study evaluated alternative anti‐icing chemicals and proposed a composite index to assist in product evaluation. In 2009, Virginia evaluated Cargill’s SafeLane surface overlay, which is designed to absorb and store liquid deicing chemicals that are applied to the roadway surface. A 2008 TRB Annual Meeting paper presented the results of experiments to determine the lifetime of salt brine residue from anti‐icing applications on asphalt concrete and Portland cement concrete.
Fixed automated spray technology is examined in a variety of studies and reports. Findings from these studies include:64
• Problems have been identified with regard to system maintenance. Most sites receive no preventative maintenance, except for an annual draining and flushing of the system at the start of the summer.
• Installation is a challenge, and difficulties appear to be expected in areas related to software and system activation.
• Careful selection of appropriate sites is recommended; all facilities should be above‐ground.
• Active sensors produce a more accurate determination of brine freezing point than do passive sensors.
• Achieving full system automation is challenging.
3.5.1.3 Green Benefits of Snow Fences
Blowing and drifting snow cause major problems for roadways and DOTs that manage them. Snowdrifts can cause safety hazards, reducing sight distance around curves and at intersections, reducing effective roadway width and reducing the effectiveness of safety barriers. Traditionally, snow fences create a barrier causing snow to accumulate upwind of the snow fence. Living snow fences employ trees or shrubbery to create a natural berm around which snow can aggregate instead of drifting onto the roadway.
Benefit‐to‐cost ratios for permanent snow fences, based only on reduced costs for snow removal range from 10:1 to 35:1, depending on the quantity of blowing snow, according to the National Research Council.65 It costs 3 cents to intercept and divert a ton of snow with a snow fence over the life of the fence, and $3 to plow the same amount of snow. 66 In an examination of results over a 10‐ year period, Wyoming DOT reported that with the installation of snow fences along Interstate 80, snow removal costs dropped as much as 50%, and the accident rate during snowy, windy conditions fell by up to 70%. The studies also indicated that 25% of all crashes occurred during blowing snow conditions in areas without snow fences, compared to 11% in areas with snow fences.
Minnesota DOT utilizes living snow fences throughout the state to minimize snow drifts and keep roads open that would otherwise be closed due to blowing and drifting snow. Mn/DOT encourages landowners to use one of the following methods to create living snow fences:67
• Twin shrub rows. Shrubs are lower to the ground than trees and trap more snow. They also serve as wildlife habitat.
• Community shelterbelt. This is a line of trees or shrubs designed to protect buildings and roads from being inundated with drifting snow.

NCHRP 25‐25/63 Environmental Corridor Management
34
• Deciduous tree windbreak. A windbreak distributes the snow uniformly across a field, protecting roads and preventing topsoil erosion from wind.
• Grassland nesting bird component. This approach involves planting native grasses next to roadways in a strip at least 150 feet wide. The grasses stop the snow and provide a habitat for nesting birds.
Iowa DOT also employs living snow fences, particularly corn rows that farmers are paid to leave at the edges of their fields. Typically, eight to 16 rows of corn are left standing near the roadway. The standing corn rows provide wildlife habitat and also promote no‐till agriculture, which prevents or slows soil erosion. Iowa’s Conservation Reserve Program allows landowners to be paid for up to 15 years for planting two rows of trees or shrubs and 75 to 100 feet of natural grasses to act as a buffer between the trees and the roadway.68

NCHRP 25‐25/63 Environmental Corridor Management
35
4 Roadside Environmental Management Roadside environmental management encompasses a wide range of activities. Maintenance personnel are responsible for addressing deficiencies in the ROW area, ranging from slope failures to noxious weed control to timely removal of deer carcasses. Vegetation management is a particularly notable category and will be discussed first, followed by a review of DOT systems for evaluating and prioritizing this work along highway corridors.
4.1 Vegetation Management Vegetation on roadsides is managed to provide adequate site visibility for drivers, prevent deadly fixed objects (e.g., trees), and maintain pavement by controlling drainage problems and pavement breakage caused by adjacent vegetation. Mowing is commonly used along areas away from the road; herbicides are used along roadway edges and under guard rails and near signage where mowing is not feasible.
Most roadsides are mowed and can be characterized as “grassy.” Grassy verges are not conducive to supporting animal habitats. Deadwood, a characteristic of shrubland and woody vegetation, is necessary to support vertebrate and invertebrate biodiversity. Roadside vegetation or habitat management systems deal with management of mowing and spraying schedules and environmental considerations in the ROW, including populations of rare plant communities and use of the ROW as habitat by ground‐nesting birds and other species. Roadside management at DOTs may include the following, though few are tracked:
• Roadside classification system – management regime category and targets by parcel or roadway mile
• Noxious/invasive species communities Size/extent (current and past)
• Species
• Treatment options by species (plus costs and benefits)
• Treatment (current and past)
• Herbicide use
• Alternative evaluation
• Sensitive environments
• Species
• Environmental element (e.g. wetland, stream, rare plant community or remnant native population, ground‐nesting birds)
• Enhancement tracking
• Treatment prescriptions and proscriptions (tied to color‐coded maps or other mapped resource easily and accessibly referenced by maintenance staff)
• Signage or field marking (description, maintenance schedule, etc.)
• Permit tracking module geo‐referenced to areas where such permits are required
• Commitment tracking and performance
• Vegetation communities and management regimes by roadway mile
• Current condition assessment
• Treatment options, costs, and benefits
• Mowing regime (current and past)
• Herbicide use
• Alternative evaluation
NCHRP 25‐25/63 Environmental Corridor Management
36
Maintenance and construction crews are making greater use of environmental GIS data for vegetation management. Inventories of rare or other desirable species in the ROW are now being used to support Integrated Roadside Vegetation Management (IRVM) planning as well. California, Colorado, Delaware, Iowa, Missouri, Minnesota, and Wisconsin are among the DOTs that identify and preserve high‐quality roadside remnant habitats.69 These initiatives typically have several common elements:
• Mapped information is combined from multiple agencies. State wildlife action plans (SWAPs) are built on habitat/vegetative community associations and can be an excellent source, especially in states where conservation science entities like State Natural Heritage Programs or The Nature Conservancy played lead roles. Nebraska’s plan and the application of that plan by the state’s Department of Roads are good examples. Other potential contributing agencies may include the state natural resources agency (typically the lead on SWAPs) or forest agency, U.S. Fish and Wildlife Service, Bureau of Land Management, U.S. Forest Service, native plant societies, state or federal Department of Agriculture, knowledgeable individuals, and local counties.
• Special Management Areas are set up in the ROW, and appropriate management practices are selected.
• Maintenance forces are educated regarding the special maintenance needs of these areas.
• Species condition and progress are tracked, in at least some cases.
We hypothesized that vegetation management plans might be some of the most amenable to corridor‐based environmental management, especially given the importance of this in another linear corridor management area: utilities. However, our research found that DOTs typically do not design vegetation management plans on a corridor basis. More than half of those responding said they do not design vegetation management on a corridor basis. It is even more infrequent that vegetation management plans are expressed in GIS; only three states said they do this. More commonly, (integrated) vegetation management plans are linked to maintenance management systems (MMSs); four times as many states said their Integrated Vegetation Management (IVM) plan was linked to MMS than were linked to GIS. As one state noted, “GIS and MMS components are in place although they have not all been connected into a functioning application for use.” One state had gone so far as to use GIS to map vegetation control plans by fiscal year. Others said their IVMs are based on roadside management zones and that mile markers were used to track invasive species locations, but there was no GIS data.
States have begun to map stands of invasive species and noxious weeds with a Global Positioning system (GPS) , although less than half of those are using GIS and GPS to track treatment progress or success from year to year. One is tracking weeds with GIS on a pilot basis, and another has used GPS to do some limited mapping of invasive species and the release of biological controls. Only a couple of states have their IVM plans available publicly or online, but about twice that number (about 10% of DOTs) say they coordinate their IVM plans with wildlife or federal agencies or with landowners who are registered for notification. Partnerships with other agencies to map invasive species with GPS are emerging.
GIS environmental data are being used in a wider array of activities in roadway and roadside maintenance. Over half of the respondents to the 2009 survey said that GIS environmental data is being used in EMS, maintenance operations, or in asset management at their DOTs. In nine states,
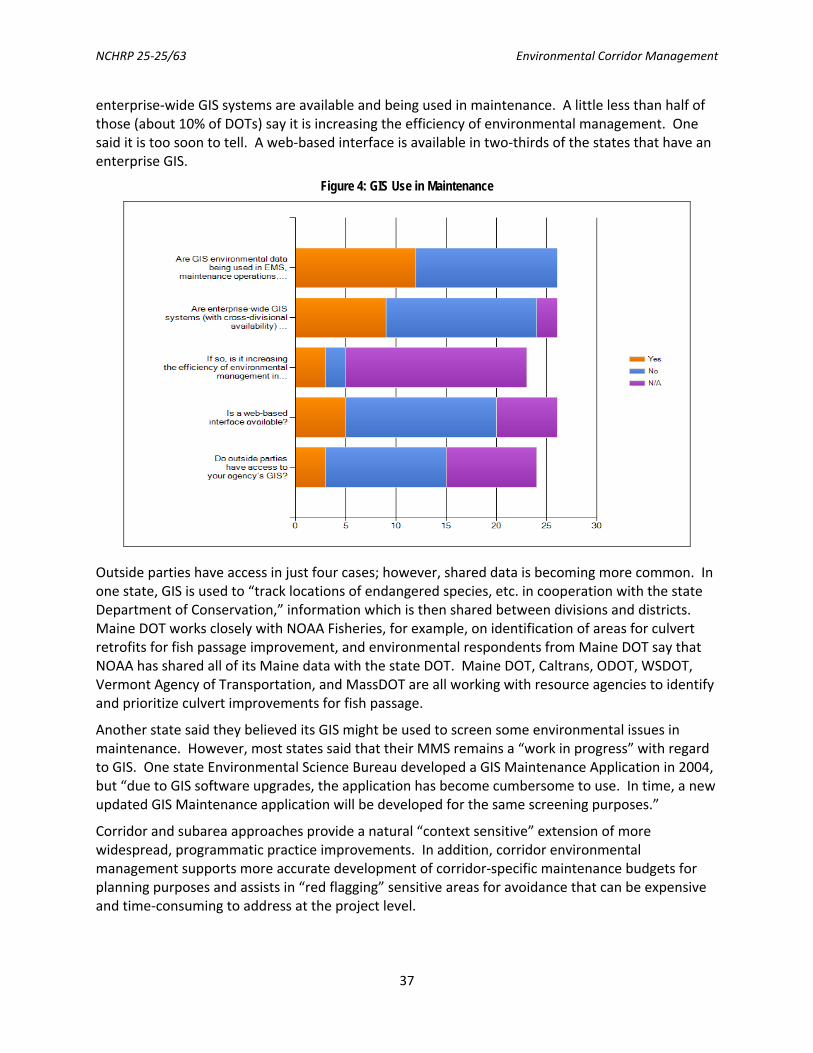
NCHRP 25‐25/63 Environmental Corridor Management
37
enterprise‐wide GIS systems are available and being used in maintenance. A little less than half of those (about 10% of DOTs) say it is increasing the efficiency of environmental management. One said it is too soon to tell. A web‐based interface is available in two‐thirds of the states that have an enterprise GIS.
Figure 4: GIS Use in Maintenance
Outside parties have access in just four cases; however, shared data is becoming more common. In one state, GIS is used to “track locations of endangered species, etc. in cooperation with the state Department of Conservation,” information which is then shared between divisions and districts. Maine DOT works closely with NOAA Fisheries, for example, on identification of areas for culvert retrofits for fish passage improvement, and environmental respondents from Maine DOT say that NOAA has shared all of its Maine data with the state DOT. Maine DOT, Caltrans, ODOT, WSDOT, Vermont Agency of Transportation, and MassDOT are all working with resource agencies to identify and prioritize culvert improvements for fish passage.
Another state said they believed its GIS might be used to screen some environmental issues in maintenance. However, most states said that their MMS remains a “work in progress” with regard to GIS. One state Environmental Science Bureau developed a GIS Maintenance Application in 2004, but “due to GIS software upgrades, the application has become cumbersome to use. In time, a new updated GIS Maintenance application will be developed for the same screening purposes.”
Corridor and subarea approaches provide a natural “context sensitive” extension of more widespread, programmatic practice improvements. In addition, corridor environmental management supports more accurate development of corridor‐specific maintenance budgets for planning purposes and assists in “red flagging” sensitive areas for avoidance that can be expensive and time‐consuming to address at the project level.

NCHRP 25‐25/63 Environmental Corridor Management
38
For various resource conservation purposes, many states are exploring reduced mowing practices. Michigan and Minnesota both legislated that along rural highways, grasses would be mowed only once a year beyond 8 to 10 feet from the road edge. These states have not noted an increase in deer‐car collisions. Over half the states have policies limiting mowing so as not to maintain the traditional 30‐foot clear zone. Currently, five states are participating in the first large‐scale study of planting native grasses along highways, involving planting of 100 acres of native grass along I‐35.70
4.1.1 Unifying Aesthetic and Functional Purposes for Landscaping
Research from Wisconsin and New York DOTs has shown that creating an enclosed environment around streets can convey a feeling of narrowness to drivers and might induce them to slow down and drive more carefully. In urban areas, street trees can protect pedestrians and limit noise as well as delineate the roadway width, while creating a narrower space.71 Wisconsin DOT’s Facilities Development Manual has information about using landscaping to provide a functional purpose, not just an aesthetic one. Its recommendations include:72
Mitigation of Glare. Visual screens may partially or totally block oncoming headlight glare; however, designers needs to balance drivers' needs to see and not hinder important information. Partial screens may be better as they limit the amount of glare to flickering of light, which lets drivers know that the screen divides the roadway. Evergreens are recommended as good visual screens.
Visual Buffering. Visual buffers use smaller plantings to create a psychological separation between the roadway and the surrounding environment.
Noise Attenuation. Plantings are not effective as noise attenuators unless they are tall and very dense. However, they can reduce the noise and sometimes create a perceived impression that the noise problem has been reduced. It is important that the plants be high enough to exceed an imaginary line between the noise source and the people affected.
Impact Attenuation. Multi‐stemmed shrubs can be used as supplemental impact attenuators, but the Manual recommends they be used only in conjunction with other systems. Individual stems should not exceed 4 inches, and plants should be spaced as densely as possible.
Delineation. Plantings should be used as delineators where horizontal and vertical curvature might confuse drivers (such as at the outside curve located at the top of a hill) or for T‐intersections or cul‐de‐sacs, where the road may end abruptly.
Traffic calming, defined as transportation techniques of slowing down traffic and decreasing traffic volumes, is used to reduce vehicle speeds, as well as to make residents feel safer. The City of Seattle has used traffic circles (which are larger than roundabouts) and associated vegetation as traffic calming devices. Landscaping is key in calming traffic as it shortens the viewable vista and makes the space more attractive to residents. Bushes and shrubs are limited to 30 inches in height, and trees have their limbs trimmed to 6 feet above ground. In Seattle, residents are responsible for maintenance of the landscaping and must commit to maintaining it before it is constructed.73
4.2 State DOT Best Practices in Managing ROW for Species & Habitat This section describes best practices in managing the right‐of‐way for other species and habitat. Most focus on guiding activity in the field, but not necessarily continuous evaluation and

NCHRP 25‐25/63 Environmental Corridor Management
39
improvement of outcomes in the field. Such a documentation and analysis process is often considered overly time‐consuming, given that just implementing practice or guidance is a major step. The federal interagency Eco‐Logical guide has encouraged a multi‐resource, ecosystem enhancement approach.
Nebraska Department of Roads (NDOR)’s Plan for the Roadside Environment promotes the increased use of native plantings and vegetation management to provide a sustainable roadside. The plan emphasizes the use of native plantings adapted specifically to the varying climate zones across the state. The plan contains sections for each of the six landscape regions across Nebraska. Each individual landscape section contains regional maps and summarizes ecosystem information for the region, including hydrology, climate, and soil and plant communities, as well as regional history, land‐use, and economic features. The plan is applicable to the entire state, and notably, includes landscaping objectives for integration into transportation planning, safety, design, and operations. The informational base benefits NDOR and natural resource agencies by envisioning and then implementing a common vision for the roadside environment. The plan outlines how to achieve good stewardship and maintain a unique and sustainable “Nebraska‐style” landscape.74
Oregon DOT GIS‐Based Sensitive Resource Inventory. The primary purpose of ODOT’s Sensitive Area Mapping Project is to provide accurate resource protection maps to roadway maintenance crews so that mowing, pesticide application, and other activities do not harm listed salmon species and other sensitive resources. The project also aims to focus attention on streams and banks in poor condition. Color infrared digital imagery with 2‐foot resolution was used, and other sensitive resource features were recorded from current knowledge bases and limited roadside surveying, and from modeling of interactions between multiple resources and data layers. GIS maps were tied into ODOT’s linear referencing system, which enabled ODOT to identify the locations of sensitive natural resources features within a hundredth of a mile.75
From this GIS resource, ODOT’s Transportation Inventory and Mapping Unit and its Information Systems Branch developed a series of detailed resource maps in 0.01‐mile segments, which indicate where sensitive resources are present, including which side of the road. Based on the potential for environmental harm, restrictions were developed and mapped for each mile of highway, to alert ODOT staff when performing routine maintenance practices, such as slope maintenance, snow removal, and vegetation management. ODOT supplied these maps to all districts, for use by biologists, planners, and maintenance managers. Laminated Restricted Activity Zone Maps for maintenance use a simple color‐coding scheme of green and red for each major class of maintenance activity (e.g., surface and shoulder work, vegetation management, snow and ice removal, etc). For approximately the same cost as field surveys, ODOT produced better quality data that was less subject to individual interpretation, covered a much larger analysis area, and resulted in significant time savings. ODOT is also exploring real‐time geographic positioning system (GPS) connection to maintenance vehicles, as well as to herbicide application spray booms to automatically activate and deactivate applicators as needed to avoid impacting sensitive resources including streams, wetlands, or rare plant populations.
As part of Wisconsin’s Statewide Habitat Conservation Plan (HCP) for the Karner blue butterfly, the Wisconsin DOT (WisDOT) conducted an initial inventory of high‐ potential corridors for the presence of lupine along state highway ROW, using soil types as a simple key indicator. WisDOT’s primary strategy for maintaining butterfly habitat is to manage ROW to provide for corridors of

NCHRP 25‐25/63 Environmental Corridor Management
40
dispersal between larger butterfly population centers via habitat in the ROW along corridors controlled by DOT. WisDOT employs:
• Selective mowing that avoids the growing season except immediately adjacent to travel lanes,
• Lupine seeding after construction projects in appropriate soils and locations,
• Removal of brush and trees during the non‐growing season to assure continued lupine habitat (2‐5 year basis for mowing),
• Mitigation for permanent take or removal,
• Monitoring KBB/lupine populations through annual surveys, and
• Public education.
WisDOT corridors meeting the following criteria were included in the agreement: 1) those within high potential range of KBB, typically upland sandy soil areas in central and northwestern Wisconsin, 2) corridors that already contain significant wild lupine populations or KBB, and 3) those close to or connected with other KBB HCP lands that have potential for similar management.
North Carolina Rare Species Management. NCDOT has a long history of protecting roadside populations of rare plants, focusing on over 90 sites with federally listed species and a number of other sites with state‐listed species. NCDOT’s initial efforts emphasized marking these rare plant populations in order to prevent them from being mowed. NCDOT signed a Memorandum of Understanding (MOU) with the North Carolina Department of Environment and Natural Resources that committed NCDOT to protect populations of threatened and endangered species that occur on NCDOT ROW. Similarly NCDOT signed an MOU with the NC Department of Agriculture, agreeing to work cooperatively on a variety of plant conservation issues, including protecting roadside populations of federal‐ and state‐listed endangered and threatened species. For simplicity, NCDOT has established some general statewide management guidelines for areas marked for rare species. Species locations are tracked via GPS.
Oregon DOT Special Management Areas for Rare Plants. Sign management and rare plant management are integrated activities at ODOT, where rare plants are concerned. In 1994, ODOT introduced a voluntary Special Management Area (SMA) program designed to protect threatened and endangered plant species occurring on its lands, drawing on information from the Oregon Natural Heritage Program and multiple agencies, individuals, and counties. The system helps ODOT apply the appropriate levels of protection within SMAs, and enables ODOT to maintain or increase population numbers and assist long‐term conservation of these resources on public lands. SMAs have special signs, and activities are restricted. SMA signs installed at the edge of buffer areas for sensitive species are coded so maintenance forces understand which activities are and are not allowed. Maintenance personnel carry a “decoder card” that allows them to decipher the code on the sign. The code provides information that tells which types of maintenance activities are allowed (such as ditch cleaning, mowing, spraying, etc.) and when they are allowed (season). ODOT also developed an educational video and implemented training that was presented to ODOT maintenance crews when sign installation was initiated.
Noxious Weed Control and Tracking. Many states are undertaking efforts to map stands of invasive species and noxious weeds with GPS and then track progress of treatment in GIS. Iowa,
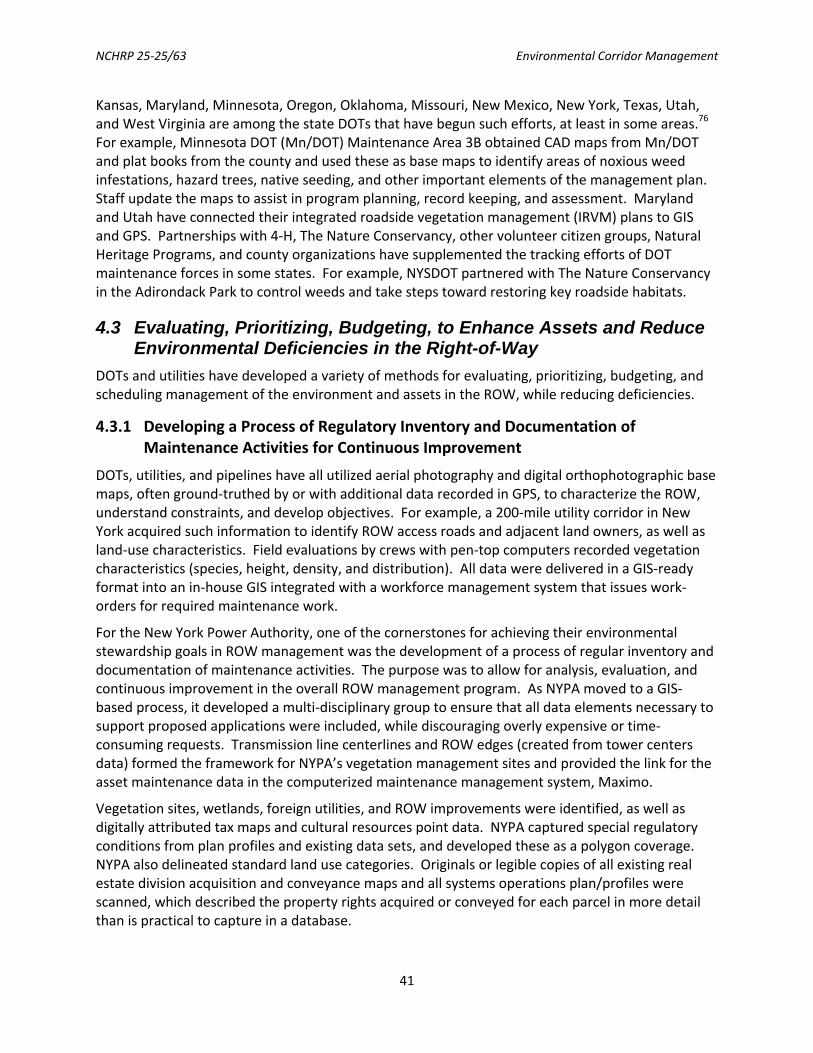
NCHRP 25‐25/63 Environmental Corridor Management
41
Kansas, Maryland, Minnesota, Oregon, Oklahoma, Missouri, New Mexico, New York, Texas, Utah, and West Virginia are among the state DOTs that have begun such efforts, at least in some areas.76 For example, Minnesota DOT (Mn/DOT) Maintenance Area 3B obtained CAD maps from Mn/DOT and plat books from the county and used these as base maps to identify areas of noxious weed infestations, hazard trees, native seeding, and other important elements of the management plan. Staff update the maps to assist in program planning, record keeping, and assessment. Maryland and Utah have connected their integrated roadside vegetation management (IRVM) plans to GIS and GPS. Partnerships with 4‐H, The Nature Conservancy, other volunteer citizen groups, Natural Heritage Programs, and county organizations have supplemented the tracking efforts of DOT maintenance forces in some states. For example, NYSDOT partnered with The Nature Conservancy in the Adirondack Park to control weeds and take steps toward restoring key roadside habitats.
4.3 Evaluating, Prioritizing, Budgeting, to Enhance Assets and Reduce Environmental Deficiencies in the Right-of-Way
DOTs and utilities have developed a variety of methods for evaluating, prioritizing, budgeting, and scheduling management of the environment and assets in the ROW, while reducing deficiencies.
4.3.1 Developing a Process of Regulatory Inventory and Documentation of Maintenance Activities for Continuous Improvement
DOTs, utilities, and pipelines have all utilized aerial photography and digital orthophotographic base maps, often ground‐truthed by or with additional data recorded in GPS, to characterize the ROW, understand constraints, and develop objectives. For example, a 200‐mile utility corridor in New York acquired such information to identify ROW access roads and adjacent land owners, as well as land‐use characteristics. Field evaluations by crews with pen‐top computers recorded vegetation characteristics (species, height, density, and distribution). All data were delivered in a GIS‐ready format into an in‐house GIS integrated with a workforce management system that issues work‐orders for required maintenance work.
For the New York Power Authority, one of the cornerstones for achieving their environmental stewardship goals in ROW management was the development of a process of regular inventory and documentation of maintenance activities. The purpose was to allow for analysis, evaluation, and continuous improvement in the overall ROW management program. As NYPA moved to a GIS‐based process, it developed a multi‐disciplinary group to ensure that all data elements necessary to support proposed applications were included, while discouraging overly expensive or time‐consuming requests. Transmission line centerlines and ROW edges (created from tower centers data) formed the framework for NYPA’s vegetation management sites and provided the link for the asset maintenance data in the computerized maintenance management system, Maximo.
Vegetation sites, wetlands, foreign utilities, and ROW improvements were identified, as well as digitally attributed tax maps and cultural resources point data. NYPA captured special regulatory conditions from plan profiles and existing data sets, and developed these as a polygon coverage. NYPA also delineated standard land use categories. Originals or legible copies of all existing real estate division acquisition and conveyance maps and all systems operations plan/profiles were scanned, which described the property rights acquired or conveyed for each parcel in more detail than is practical to capture in a database.

NCHRP 25‐25/63 Environmental Corridor Management
42
While the primary objective for the GIS was to provide detailed mapping of vegetation sites and features both on and off the ROW, the GIS also provided ROW inventory crews with an efficient tool for collecting field data on pen‐top computers and GPS. The system greatly reduced the amount of maps and materials staff needed to take into the field for inventories and sped data collection.
The NYPA used its Maximo‐based Maintenance Resource Management (MRM) work order system to track the status of any particular site through the process of proposal for treatment, scheduling, and actual treatment. Treatment plans are entered into the MRM so that work progress and costs can be monitored and tracked. The work order system drives the collection of treatment information, a portion of which is used to meet regulatory requirements related to pesticide use. Treatment records also tie the work back into the MRM work order system and add to the overall inventory system so that follow‐up work can be planned and effectiveness of treatment can be assessed. Corridor planning data is delivered in GIS‐ready format to a workforce management system.
4.3.2 Virginia DOT’s Approach to Performance‐Based Contracting
DOTs are increasingly outsourcing and having to manage through performance‐based contracting. Researchers agree that outsourcing should be accompanied by a well‐structured system of performance measurement. 77 As Missouri DOT (MoDOT) Director Pete Rahn has stated, “The will to innovate must be matched by a willingness to evaluate.”
In 2007, the Virginia DOT implemented the following performance measurement framework to monitor all of its performance‐based road maintenance contracts. The approach was tested 8 times in 2008 and 13 times in 2009. The framework consists of five components:78
• Level‐of‐Service Effectiveness indicates the extent to which the performance criteria and performance targets defined in the contract are being met.
• Cost‐Efficiency — assesses the cost savings, if any, accrued
Figure 5: Asset Groups and Asset Items Used by Virginia DOT

NCHRP 25‐25/63 Environmental Corridor Management
43
by the agency as a result of engaging a contractor to perform performance‐based road maintenance services.
• Timeliness of Response — evaluates the response time of the contractor to service requests related to events or deficient elements in the roadway that need to be attended in a timely manner.
• Safety Procedures — evaluates if a safety program is properly implemented.
• Quality of Services — assesses the customer perceptions with respect to the condition of the assets and contractor performance.
First, performance criteria and an acceptable condition/quality level for each asset item need to be defined, along with performance targets. A performance criterion should be easily measurable and quantifiable (e.g. “more than 80% of pipe diameter needs to be open”). As Ozbek notes, transportation agencies define realistic targets for two reasons: (i) the payment to the contractor will be based on the compliance to the targets, and (ii) the overall condition of the assets will be affected by the effort made by the contractor to meet or exceed the targets.
Some systems also establish the relative importance of asset items and asset groups by assigning relative weights to them. Such weights can be used in the calculation of the overall performance of the contractor or the overall performance of a given corridor (if analysis occurs at that scale). It is also necessary to know whether an asset item exists in a particular corridor segment. Especially for contracting, but for all proactive (rather than emergency) management, a complete inventory of assets under management should be created.
Baseline condition from sampling and/or field inspections helps in assessment of procedures, efficiencies, and work performed and assists contractors in making bids. Field Inspections typically divide the highway into 0.1 mile long segments and report condition data with respect to selected asset items. Training, manuals, and a QA/QC program helps maintain inter‐rater reliability so that condition assessments are meaningful and not unduly subjective. Increasingly tablet PCs with restricted pick lists and GPS can help reduce errors and improve accurate location and categorization of collected data, like “reason for failure” in a comment field. As Ozbek shows, calculation of actual ratings for each asset item, asset group, and stratum (i.e., different section of the highway) is necessary to transform the data collected in the field into meaningful information; furthermore, the required ratings at the asset group and stratum level should be calculated.
As discussed by de la Garza et al. (2008), it is common to divide the population into groups based on geographical location, weather, urban and rural settings, and traffic volumes to be able to generate different strata in an effort to account for exposure to different conditions. Increasingly, it may be possible to parse data by corridor as well.

NCHRP 25‐25/63 Environmental Corridor Management
44
Figure 6: Example of the Approach VDOT Used to Calculate Actual Ratings and Ratings Required by Contract
Figure 7: Level of Service Rating example by Asset Group (Ozbek et al., 2010)

NCHRP 25‐25/63 Environmental Corridor Management
45
Figure 8: Example Trend Analyses at the Asset Group Level (Ozbek et al., 2010)
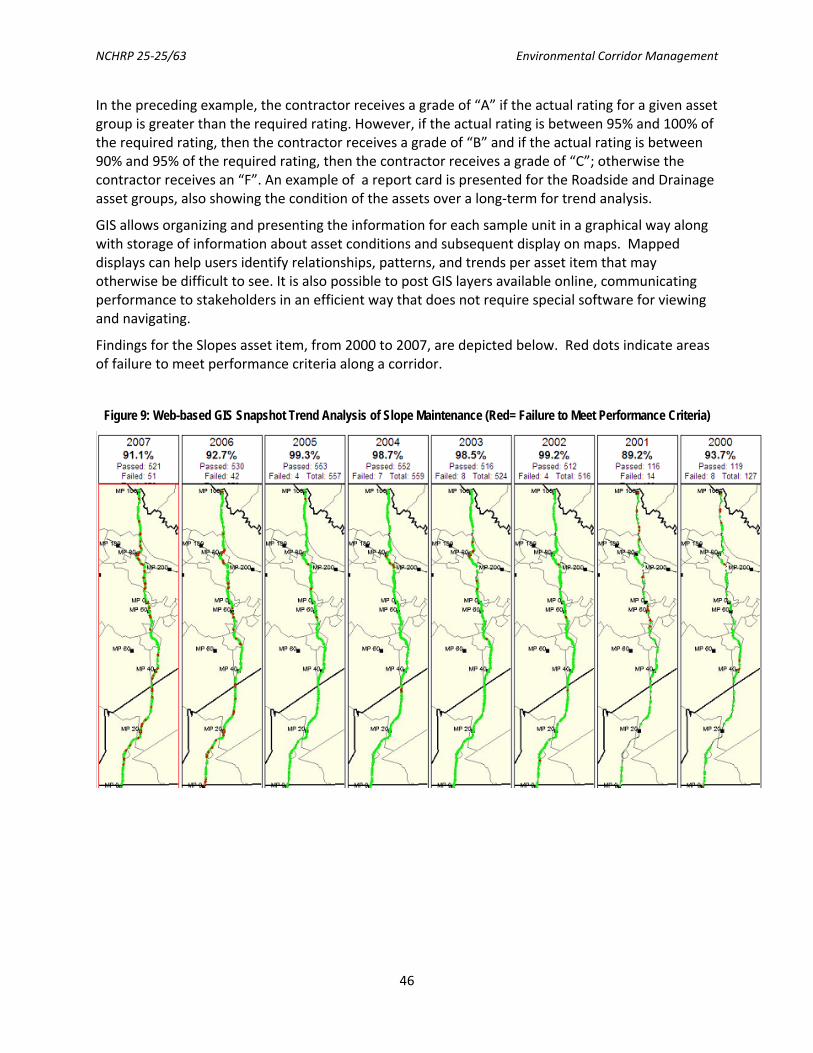
NCHRP 25‐25/63 Environmental Corridor Management
46
In the preceding example, the contractor receives a grade of “A” if the actual rating for a given asset group is greater than the required rating. However, if the actual rating is between 95% and 100% of the required rating, then the contractor receives a grade of “B” and if the actual rating is between 90% and 95% of the required rating, then the contractor receives a grade of “C”; otherwise the contractor receives an “F”. An example of a report card is presented for the Roadside and Drainage asset groups, also showing the condition of the assets over a long‐term for trend analysis.
GIS allows organizing and presenting the information for each sample unit in a graphical way along with storage of information about asset conditions and subsequent display on maps. Mapped displays can help users identify relationships, patterns, and trends per asset item that may otherwise be difficult to see. It is also possible to post GIS layers available online, communicating performance to stakeholders in an efficient way that does not require special software for viewing and navigating.
Findings for the Slopes asset item, from 2000 to 2007, are depicted below. Red dots indicate areas of failure to meet performance criteria along a corridor.
Figure 9: Web-based GIS Snapshot Trend Analysis of Slope Maintenance (Red= Failure to Meet Performance Criteria)
NCHRP 25‐25/63 Environmental Corridor Management
47
4.3.3 NCDOT’s Maintenance Management and Quality Assurance System
North Carolina DOT’s Maintenance Management System (MMS) is cataloging maintenance history of the road network and inventories of sample sections of the roadway where engineers can view condition ratings and maintenance needs. Condition assessments are performed randomly every two years on sample sections. All assets in the section including signs, lighting, supports and structures for signs, guardrails, markings, and detectors receive pass/fail rating, with the extent of failure being measured. For example, for slopes, failures over 1 foot wide are noted for repair. Lateral ditches eroded in excess of 1 ft. were also noted. Drainage features and thresholds were as follows:
• Crossline Pipe Blocked >= 50% or Damaged
• Driveway Pipe Blocked >= 50% or Damaged
• Curb & Gutter Blocked >=2 in x 2 ft, or Damaged
• Catch Basin and Drop Inlet Blocked >= 25% or Damaged or Grate Problem
• Other Drainage Features‐Not functioning as designed
Information on each sample section of roadway is included so that engineers are able to call up sections of roadway and view condition ratings and maintenance needs. The systems is used to:
• Create an inventory of assets and facilitate accounting processes.
• Describe the condition of assets based on extrapolations from random sampling.
• Relate funding to improved conditions and predict funding levels needed to achieve an acceptable level of maintenance, including both an “ideal” and “constrained” annual plan.
• Develop priorities when funding levels are less than the calculated needs.
• Facilitate accounting processes.
• Plan, schedule, execute and manage individual maintenance programs.
• Identify areas requiring additional employee skills and equipment.
• Achieve a more uniform level of service throughout the state.
NCDOT is now tying together all of their management systems in one, utilizing SAP.
4.3.4 Washington State DOT’s Environmental Maintenance Accountability Process
WSDOT has developed a Maintenance Accountability Process (MAP) tool and field manual to measure and communicate the outcomes of maintenance activities and to link strategic planning, the budget, and maintenance service delivery. Twice a year, field inspections are made of randomly selected sections of highway. The results are measured, recorded and compared to the MAP criteria to determine the level of service (LOS) delivered. Results are summarized annually, such as in the September 2003 Field Data Collection Manual, which includes the following A (blue) through F (red, none) grades for drainage maintenance and slope repair and roadside vegetation management.
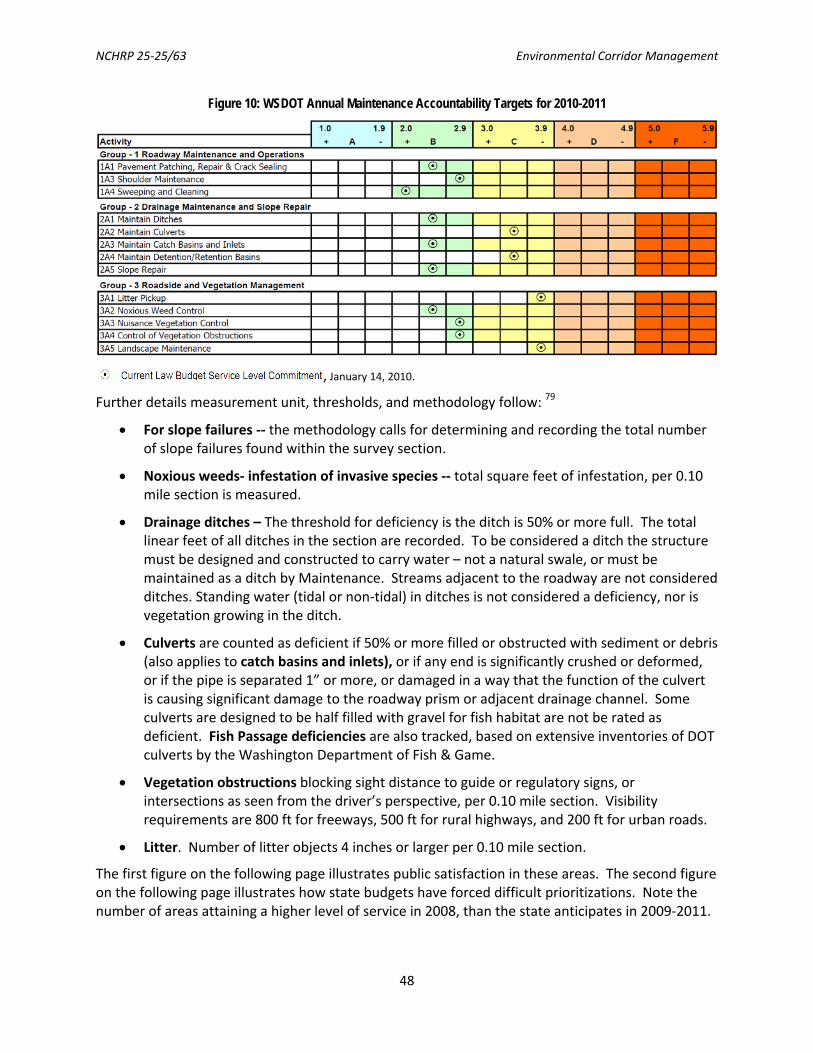
NCHRP 25‐25/63 Environmental Corridor Management
48
Figure 10: WSDOT Annual Maintenance Accountability Targets for 2010-2011
, January 14, 2010.
Further details measurement unit, thresholds, and methodology follow: 79
• For slope failures ‐‐ the methodology calls for determining and recording the total number of slope failures found within the survey section.
• Noxious weeds‐ infestation of invasive species ‐‐ total square feet of infestation, per 0.10 mile section is measured.
• Drainage ditches – The threshold for deficiency is the ditch is 50% or more full. The total linear feet of all ditches in the section are recorded. To be considered a ditch the structure must be designed and constructed to carry water – not a natural swale, or must be maintained as a ditch by Maintenance. Streams adjacent to the roadway are not considered ditches. Standing water (tidal or non‐tidal) in ditches is not considered a deficiency, nor is vegetation growing in the ditch.
• Culverts are counted as deficient if 50% or more filled or obstructed with sediment or debris (also applies to catch basins and inlets), or if any end is significantly crushed or deformed, or if the pipe is separated 1” or more, or damaged in a way that the function of the culvert is causing significant damage to the roadway prism or adjacent drainage channel. Some culverts are designed to be half filled with gravel for fish habitat are not be rated as deficient. Fish Passage deficiencies are also tracked, based on extensive inventories of DOT culverts by the Washington Department of Fish & Game.
• Vegetation obstructions blocking sight distance to guide or regulatory signs, or intersections as seen from the driver’s perspective, per 0.10 mile section. Visibility requirements are 800 ft for freeways, 500 ft for rural highways, and 200 ft for urban roads.
• Litter. Number of litter objects 4 inches or larger per 0.10 mile section.
The first figure on the following page illustrates public satisfaction in these areas. The second figure on the following page illustrates how state budgets have forced difficult prioritizations. Note the number of areas attaining a higher level of service in 2008, than the state anticipates in 2009‐2011.
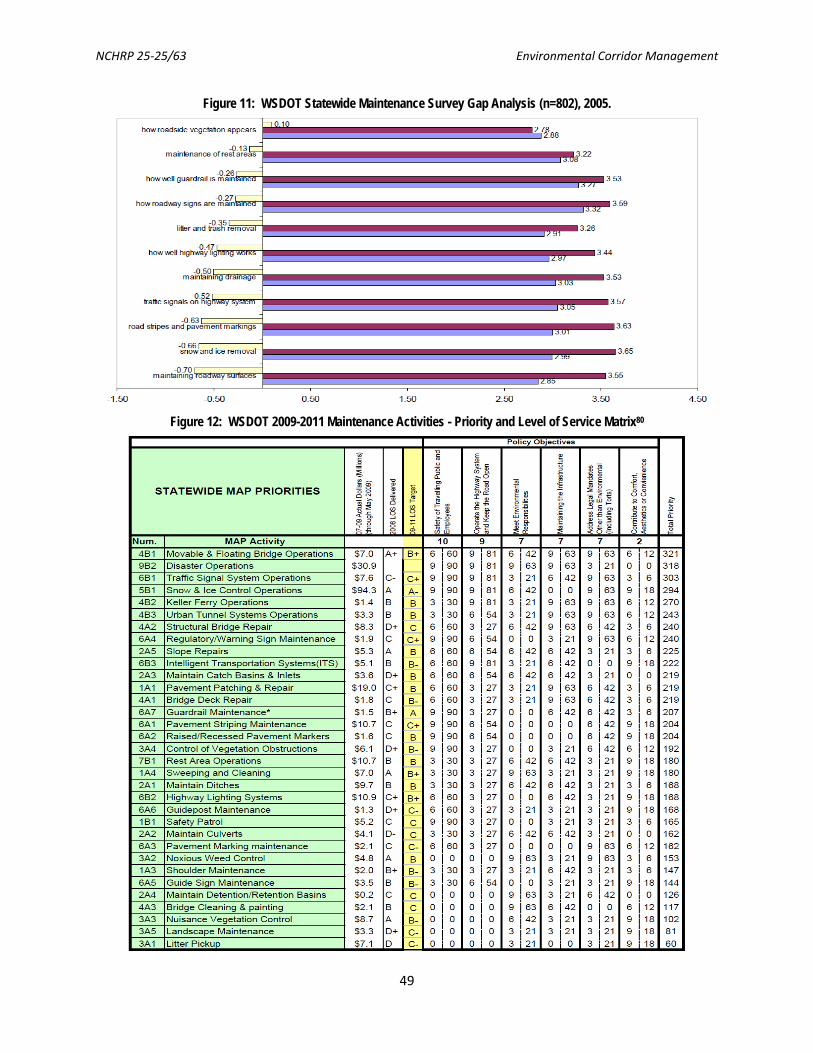
NCHRP 25‐25/63 Environmental Corridor Management
49
Figure 11: WSDOT Statewide Maintenance Survey Gap Analysis (n=802), 2005.
Figure 12: WSDOT 2009-2011 Maintenance Activities - Priority and Level of Service Matrix80

NCHRP 25‐25/63 Environmental Corridor Management
50
4.3.5 Applicability of Pennsylvania’s System for Identifying Roadside Problem Areas
Ninety percent of the system developed below, via a partnership between Pennsylvania DOT (PennDOT) and Penn State University’s Center for Dirt & Gravel Roads, is relevant in evaluation and management or roadsides, regardless of whether the road is paved:
• Ranking of road sediment in stream: None, Slight, Moderate, or Severe/Stream Encroachment
• Wet site conditions: Dry, Saturated Ditches, Roadside Springs, Flow in Ditches, Saturated Base
• Road surface material: Hard Gravel, Mixed Stone, Soft Stone/Dust, Stone/Dirt/Dust, Severe Dust
• Road slope/grade: <10%, 10‐30%, or >30%
• Road shape: Good, Fair, or Poor
• Distance to stream: >100 ft., 50‐100 ft., <50 ft. crossing
• Slope to stream: <30%, 30‐60%, >60%
• Outlet to stream: None, Near Stream, Directly into Stream
• Outlet bleeder stability: Stable, Moderate, Unstable
• Road ditch stability: Stable, Fair, Poor, Unstable
• Road bank stability: Stable, Fair, Poor, Unstable
• Average canopy cover: Moderate, Minimal, Heavy
4.3.6 NYSDOT’s Maintenance Environmental Roadside Worksheet for the Green and Blue Highways Initiative
NYSDOT’s Maintenance Office started Green and Blue Highways in 2005 as a grassroots effort to capitalize on maintenance field staff insights and capabilities. When staff or managers address an issue that may appear on first view to have conflicts among operational, safety and environmental concerns, Green and Blue Highways offers a process and resources to help develop a solution that minimizes the conflict and leads to an outcome that better balances these concerns.
The Green and Blue Highways initiative includes the following steps: 1) Region/Residency selects a highway segment, based on environmental and cultural features and/or operational needs; 2) Region/Residency staff conduct a windshield survey of each segment that need not last more than one or two hours. Prepare a stewardship plan and then carry out the plan; and 3) Main Office/Region/Residency staff evaluate accomplishments regularly.
NYSDOT noted that this sort of initiative works well after a stewardship ideal is established. It is voluntary (regions/residencies choose segment), simple, and uses a checklist. It is a survey tool that lists all possible stewardship opportunities. Location information is supplemented with mile markers or GPS. An example of the sheet NYSDOT employs for the Blue and Green Highways Initiative follows, along with a mapped depiction of needed work, such as that more easily shared with other staff and stakeholders.
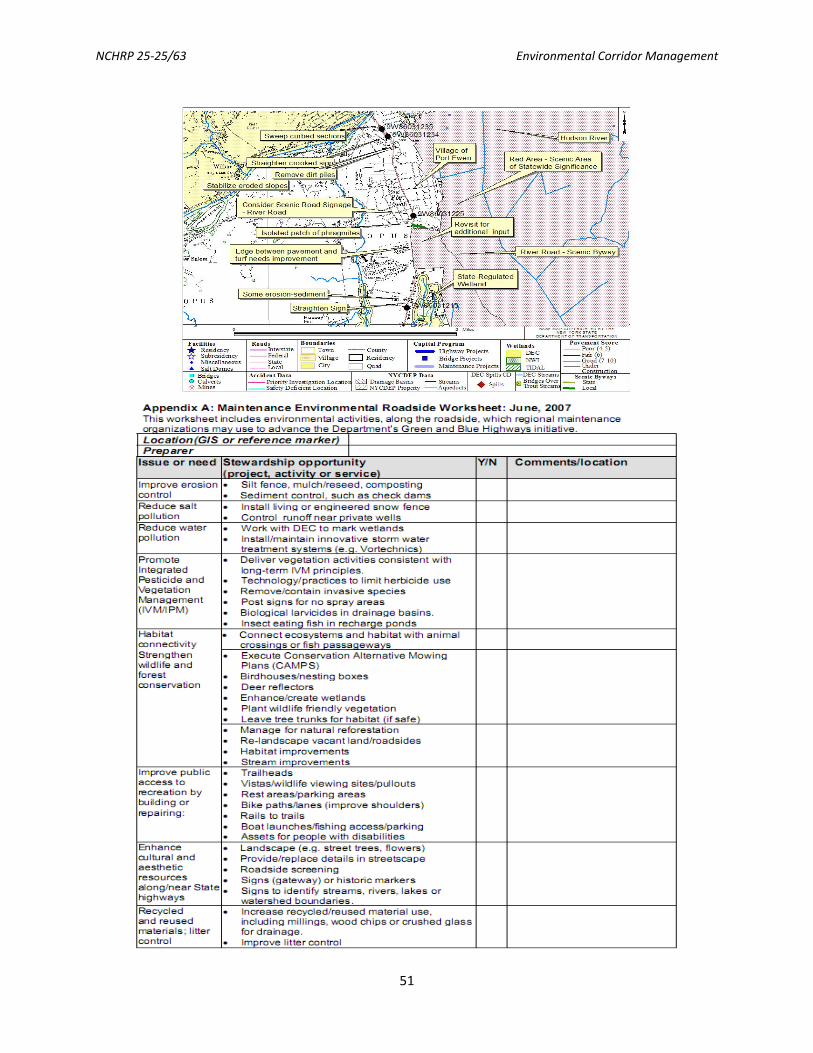
NCHRP 25‐25/63 Environmental Corridor Management
51
NCHRP 25‐25/63 Environmental Corridor Management
52
4.3.7 Improving Habitat for People: Can DOTs Contribute to Walkability?
DOTs contribute to walkability by designing intersections for pedestrians as well as vehicles, installing or upgrading sidewalks and bikeways in the course of repair work, and installing bike and pedestrian amenities, like benches, racks, or shelters. Opportunities to expand walkability may be limited in maintenance and corridor management, but if DOTs can find improvements they can make, they tend to produce social equity benefits. Children and elders of all incomes and races are among those least served by transportation systems for cars only; those who cannot afford automobiles are especially dependent on the infrastructure for walking, bicycling, and transit. The health of the larger populace is also dependent on this infrastructure; the U.S. Surgeon General recommends 30 minutes of walking or other moderate activity for all people. In the course of operations, DOTs may find they can cooperate with cities and MPOs on environmental corridor management and fostering multimodal functionality, in a way that diminishes the need for travel and fosters other benefits too.
Walkability is defined by the Walk Score algorithm (www.walkscore.com), which works by calculating the closest amenities – restaurants, coffee shops, schools, parks, stores, libraries, etc. – to any U.S. address. The algorithm then assigns a “Walk Score” from 0‐100, with 100 being the most walkable and 0 being totally car‐dependent. Walk Scores of 70+ indicate neighborhoods where it is possible to get by without a car.
Although the real estate market has been slow to regain momentum, location near trails, sidewalks, and open space increases home values. A report, “Walking the Walk: How Walkability Raises Housing Values in U.S. Cities,” by Joseph Cortright, analyzed data from 94,000 real estate transactions in 15 major markets and found that in 13 of the 15 markets, higher levels of walkability were directly linked to higher home values.81 “Even in a turbulent economy, we know that walkability adds value to residential property just as additional square footage, bedrooms, bathrooms and other amenities do,” said Cortright. “It’s clear that consumers assign a tangible value to the convenience factor of living in more walkable places with access to a variety of destinations.”
The study included 15 metropolitan areas, finding a statistically significant positive relationship between walkability and home values in 13 areas: Arlington, Virginia; Austin, Texas; Charlotte, North Carolina; Chicago, Illinois; Dallas, Texas; Fresno, California; Jacksonville, Florida; Phoenix, Arizona; Sacramento, California; San Francisco, California; Seattle, Washington; Stockton, California, and Tucson, Arizona. The study found that in the typical metropolitan area, a one‐point increase in Walk Score was associated with an increase in value ranging from $700 to $3,000 depending on the market. The gains were larger in denser, urban areas like Chicago and San Francisco and smaller in less dense markets like Tucson and Fresno.
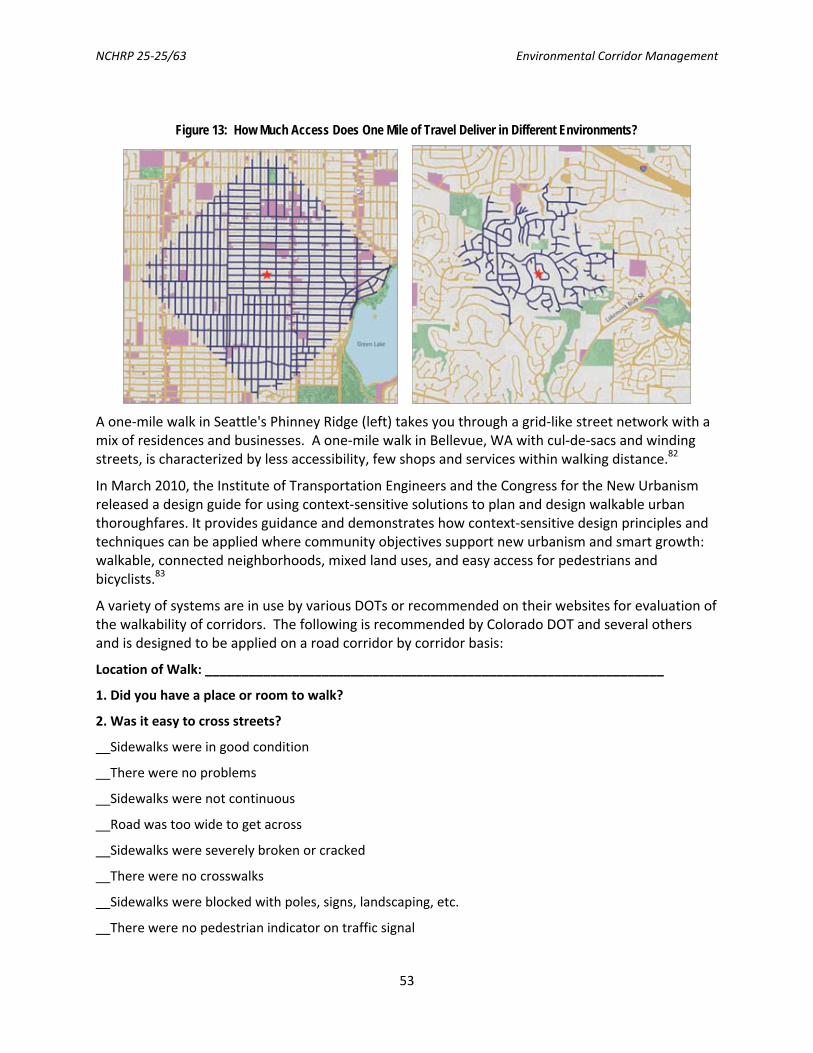
NCHRP 25‐25/63 Environmental Corridor Management
53
Figure 13: How Much Access Does One Mile of Travel Deliver in Different Environments?
A one‐mile walk in Seattle's Phinney Ridge (left) takes you through a grid‐like street network with a mix of residences and businesses. A one‐mile walk in Bellevue, WA with cul‐de‐sacs and winding streets, is characterized by less accessibility, few shops and services within walking distance.82
In March 2010, the Institute of Transportation Engineers and the Congress for the New Urbanism released a design guide for using context‐sensitive solutions to plan and design walkable urban thoroughfares. It provides guidance and demonstrates how context‐sensitive design principles and techniques can be applied where community objectives support new urbanism and smart growth: walkable, connected neighborhoods, mixed land uses, and easy access for pedestrians and bicyclists.83
A variety of systems are in use by various DOTs or recommended on their websites for evaluation of the walkability of corridors. The following is recommended by Colorado DOT and several others and is designed to be applied on a road corridor by corridor basis:
Location of Walk: _______________________________________________________________
1. Did you have a place or room to walk?
2. Was it easy to cross streets?
__Sidewalks were in good condition
__There were no problems
__Sidewalks were not continuous
__Road was too wide to get across
__Sidewalks were severely broken or cracked
__There were no crosswalks
__Sidewalks were blocked with poles, signs, landscaping, etc.
__There were no pedestrian indicator on traffic signal

NCHRP 25‐25/63 Environmental Corridor Management
54
__There were no sidewalks, paths or shoulders
__View of traffic was blocked
Other__________________________________
3. Did drivers behave well? 4. Was your walk pleasant? Try to answer this question both during the day and the night.
__There were no problems
__Drivers did not yield to pedestrians crossing street
__Drivers turned right into pedestrian traffic crossing street
__Needs more landscaping
__Drove too fast
__There was suspicious activity/feeling of unsafe
__Not well lit
__Dirty, lots of litter or trash
__No transit shelters
__Construction or other impediment
Other__________________________________
What is your overall rating for this area? ______
1 = A great area for walking
2 = A good area for walking
3 = Needs improvement
4 = Needs a lot of work
5 = Very unsafe/unpleasant
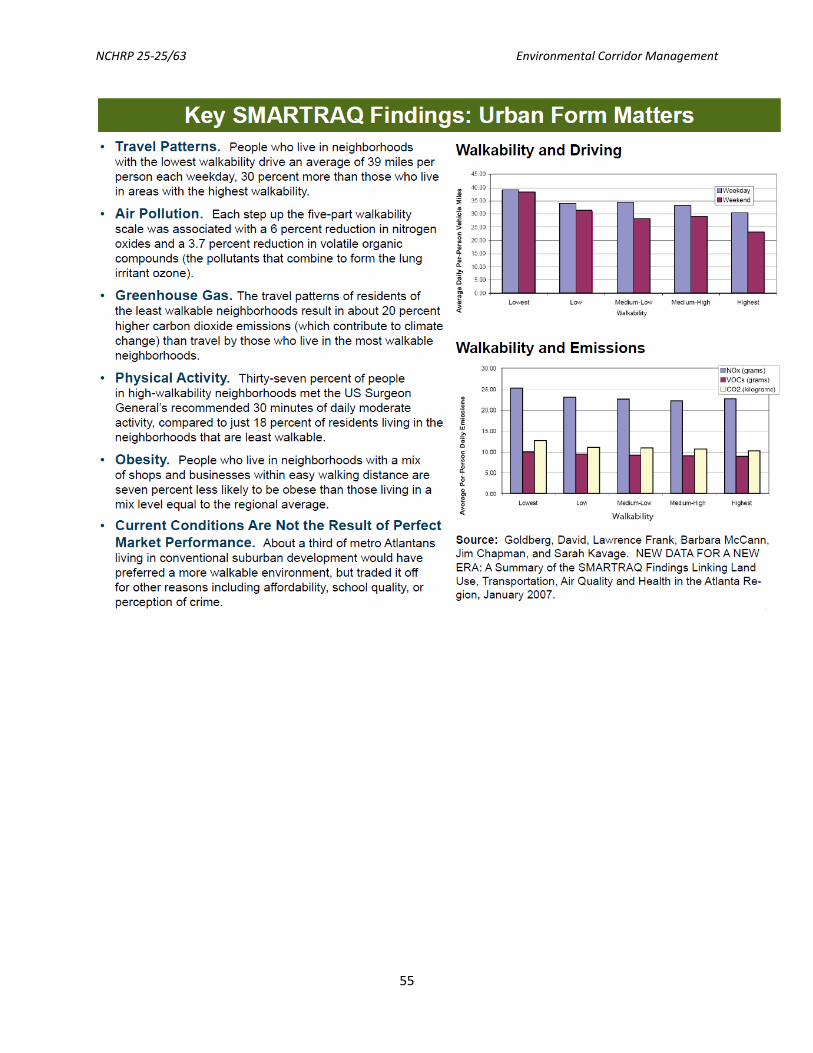
NCHRP 25‐25/63 Environmental Corridor Management
55
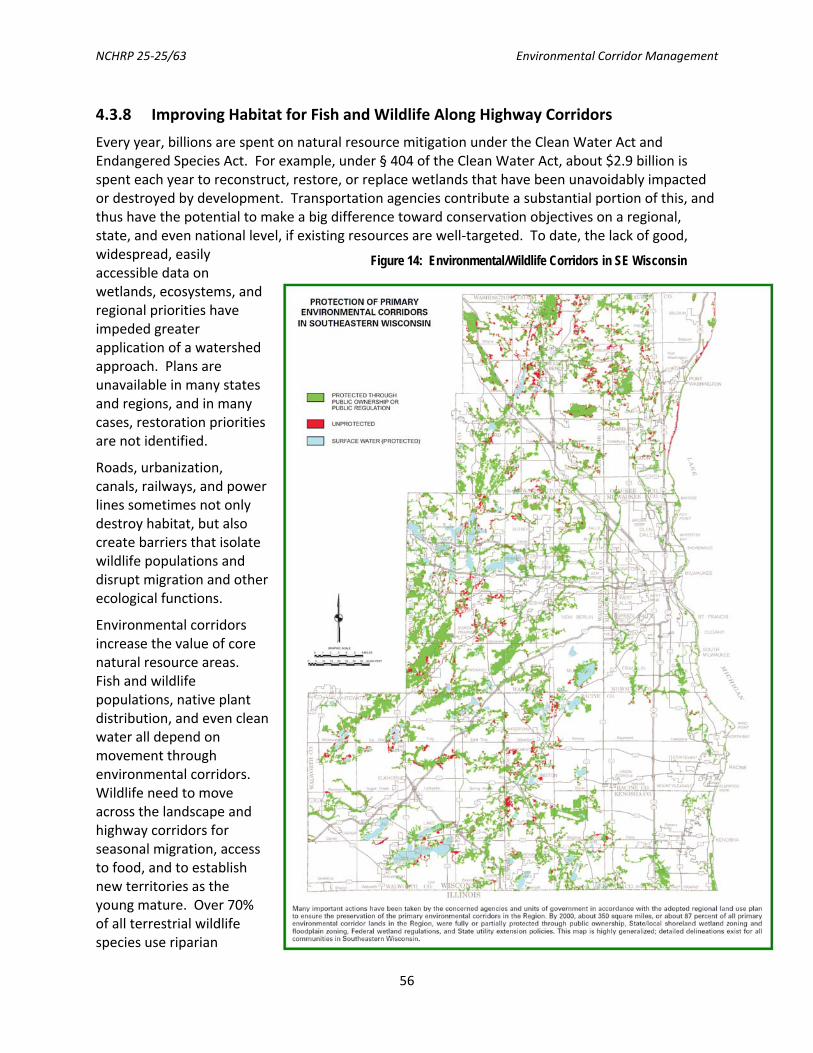
NCHRP 25‐25/63 Environmental Corridor Management
56
4.3.8 Improving Habitat for Fish and Wildlife Along Highway Corridors
Every year, billions are spent on natural resource mitigation under the Clean Water Act and Endangered Species Act. For example, under § 404 of the Clean Water Act, about $2.9 billion is spent each year to reconstruct, restore, or replace wetlands that have been unavoidably impacted or destroyed by development. Transportation agencies contribute a substantial portion of this, and thus have the potential to make a big difference toward conservation objectives on a regional, state, and even national level, if existing resources are well‐targeted. To date, the lack of good, widespread, easily accessible data on wetlands, ecosystems, and regional priorities have impeded greater application of a watershed approach. Plans are unavailable in many states and regions, and in many cases, restoration priorities are not identified.
Roads, urbanization, canals, railways, and power lines sometimes not only destroy habitat, but also create barriers that isolate wildlife populations and disrupt migration and other ecological functions.
Environmental corridors increase the value of core natural resource areas. Fish and wildlife populations, native plant distribution, and even clean water all depend on movement through environmental corridors. Wildlife need to move across the landscape and highway corridors for seasonal migration, access to food, and to establish new territories as the young mature. Over 70% of all terrestrial wildlife species use riparian
Figure 14: Environmental/Wildlife Corridors in SE Wisconsin

NCHRP 25‐25/63 Environmental Corridor Management
57
corridors, according to NRCS.84
States or regional planning entities may use different systems of categorization. For example, Southeastern Wisconsin Regional Planning Commission (SEWRPC) defines corridors as primary and secondary: primary corridors contain concentrations of significant natural resources and are at least 400 acres and 2 miles long, and 200 feet wide; secondary corridors have smaller concentrations of significant natural resources and are at least 100 acres and 1 mile long. 85 See figure 9.
Regardless of the specific definition, a common feature of all these corridors is that they cross human‐determined boundaries. Corridors vary in the animals that use them and the amount of biodiversity they support, but they all contribute to the functionality and diversity of the larger system. NRCS suggests several basic principles:
• Continuous corridors are better than fragmented corridors.
• Wide natural corridors are better than narrow corridors.
• Natural linkages should be maintained or restored.
• Two or more corridor linkages are better than one.
• Structurally diverse corridors (that is, those with diverse plants, height of plants, natural features, etc.) are better than corridors with simpler structure, like highway ROW.
All states have now developed State Wildlife Action Plans noting priority conservation areas. Many of these identify primary movement corridors as well. Nearly half identify actionable areas on maps, which DOTs can then use. Even without improved SWAPs with easily identifiable or official “consensus” action areas, DNR or Fish and Wildlife staff who work in the areas surrounding the corridor in question can often quickly and efficiently provide “best professional judgment” that DOTs environmental and maintenance staff can use in identifying environmental objectives and management opportunities in an environmental corridor and where those intersect with roads. The International Coference on Ecology and Transportation’s September 2009 meeting revealed two major research gaps – the need to study the benefits of variable fencing strategies around animal crossings and getting reptile passages mainstreamed like large mammal crossings.
4.3.8.1 Cost–Benefit Analyses of Mitigation Measures for Wildlife‐Vehicle Crashes
Wildlife–vehicle collisions affect human safety, property and wildlife. The number of large mammal–vehicle crashes has been estimated at between 1‐2 million in the U.S. annually, an increase over the last decade.86 These collisions cause over 200 human deaths, almost 30,000 human injuries and over $1 billion in property damage annually, not to mention the animals that usually die immediately or shortly after collision.87 A larger number of amphibians, reptiles, birds, and mammals die on roads every year,88 but larger ungulates generate higher human costs.
Huijser et al., calculated the costs associated with the average deer, elk, and moose–vehicle collisions, including vehicle repair costs, human injuries and fatalities, towing, accident attendance and investigation, monetary value to hunters of the animal killed in the collision, and cost of disposal of animal carcass. Conducting cost–benefit analyses over a 75‐year period using discount rates of 1%, 3%, and 7% to identify the threshold values (in 2007 U.S. dollars) above which individual mitigation measures start generating benefits in excess of costs, they determined the number of deer–, elk–, or moose–vehicle collisions that would need to occur per kilometer per year

NCHRP 25‐25/63 Environmental Corridor Management
58
for a mitigation measure to start generating economic benefits in excess of costs. They then applied this to 10 road sections in the U.S. and Canada. The cost–benefit model they developed can be a valuable decision‐support tool for determining mitigation measures to reduce collisions between vehicles and large animals.

NCHRP 25‐25/63 Environmental Corridor Management
59
DOT Habitat Connectivity Efforts in the Course of Corridor Management and Improvements Washington State DOT works with the Department of Fish and Wildlife to identify wildlife corridors where there is significant wildlife movement. These corridors are considered during transportation planning, project development, and maintenance operations. In the I-90 Snoqualmie Pass corridor, partners determined that “regardless of the build alternative” the project must connect habitat across I-90 for fish and wildlife. Such an ecological commitment as part of a project purpose and need statement was a first for WSDOT. Consistent with ecosystem approach and the interagency Eco-Logical guide, the partners looked for “the locations within the project area that provide the highest benefit-to-cost ratio and long-term solutions to the issue of ecological connectivity” (Smith &Sullivan, January 2010). Arizona DOT counted 3,000 collisions occur yearly with deer and elk on state highways, with an unknown number of serious injuries and fatalities. This drover Arizona DOT and partners to pursue wildlife fencing and also a landscape approach to successfully maintain and restore habitat linkages and conserve natural ecosystems. The Arizona Wildlife Linkages Workgroup (AWLW) made up of ADOT, the state Game & Fish Dept., BLM, FHWA, USDA FS, USFWS, university researchers, and the Wildlands Project, guided the development of a technically defensible system for integrating wildlife protection into transportation planning. A series of statewide "Missing Linkages" workshops were conducted to enable buy-in and to gather information from local experts about large blocks of protected habitat, potential linkage zones, and threats to such zones. The Assessment tool developed from the expert input defines existing linkage conditions, records biotic communities, lists species that depend on particular linkages, identifies land ownership within these linkages, and details known and anticipated threats. A GIS graphically displays areas of concern. So far, AWLW has identified more than 150 potential linkage zones throughout the state, and it is anticipated that this number will double in the future. ADOT uses the system to prioritize where action would be the most beneficial. Florida DOT. The Florida black bear utilizes habitat at the landscape level and also serves as an umbrella species for numerous other mammals, amphibians, and reptiles that occur in similar plant community types. Forested land in Florida, the black bear’s prime habitat, disappeared at a rate of 200,000 acres per year as the state experienced growth over the last decade. Adult male bears typically roam around 42,000 acres, and Defenders of Wildlife documented 88 roadway bear kills in one year. Over the past decade, Florida DOT initiated a cooperative effort with the Florida Fish & Game Commission to prioritize and begin to address black bear roadkill problem areas on a statewide basis, to focus and direct investments in habitat conservation and connectivity improvements, and to streamline project approvals. Using bear roadkill data from the previous decade, the two agencies analyzed and ranked road segments by the percent of total statewide road kills and percentage of kills and then combined that with habitat information, including percent of buffer encompassed by conservation lands and strategic habitat conservation areas. The interagency cooperative analysis revealed that while underpasses at strategic locations are sometimes necessary to reduce roadkills and maintain habitat connectivity of natural systems bisected by highways, public land acquisition, habitat protection, and proper land management are also of paramount importance to enhance the black bear’s potential for long-term survival in Florida. The results were shared with the state’s Conservation and Recreational Lands program to help justify the purchase of a 22,260-acre tract associated with the Aucilla River Project in the Big Bend area of north Florida, ranked third on the priority list. The effort also prioritized 15 black bear roadkill problem areas, ranging from 2.4 to 34.4 miles each, which comprise about 40 percent of the total transportation-related bear mortality in the state. Caltrans. A 2007 ICOET paper discusses how effective mesh size (Girvetz et al. these proceedings), or wildlife connectivity models (e.g., Penrod et al. 2000, Thorne et al. 2006, Shilling et al 2002, Noss et al. 1999) could be spatially integrated into the California advance mitigation planning database they developed, so that planners would know when terrestrial connectivity was an issue in a particular watershed. This would build on the state’s earlier Missing Linkages connectivity planning effort.

NCHRP 25‐25/63 Environmental Corridor Management
60
4.3.8.2 Oregon DOT Culvert Retrofit and Replacement Program
In 2001, the Oregon Department of Transportation (ODOT) and the state Department of Fish and Wildlife (ODFW) signed a Memorandum of Understanding (MOU) that repairing or modifying ODOT‐maintained culverts is a priority for the agencies that will take decades to resolve. The Oregon Department of Fish and Wildlife completed culvert inventories for the entire state of Oregon in 1999 and found that 96% of the barriers identified were culverts associated with road crossings. The project also identified high priority culverts for fish passage remediation.
As illustrated in the figure on this
page, Oregon DOT has been tackling the 200 highest priority culverts for fish passage retrofits. This corresponds to an agency livability and economic prosperity goal for the state and a key performance measure.89
ODOT has an ongoing program of culvert installation and maintenance, with the goal of making all ODOT culverts passable to fish. After research monitoring results demonstrated the effectiveness of baffle and weir designs in culverts, ODOT modified their culvert replacement programs to use these designs, significantly reducing the cost of improving fish passage at ODOT culverts. The designs improve fish passage by slowing water velocity and raising stream elevations to reduce entry jump heights or backwater culvert outlets. Use of retrofit designs are allowing culverts that are otherwise in good physical condition to be retrofitted until their service integrity is compromised, at which time they will be replaced with designs that more fully meet fish passage criteria and standards. Use of retrofits will thus allow many more culverts to be remediated each year, increasing the scope and pace of ODOT’s contribution to salmon recovery in Oregon. The baffle and weir retrofits also provide ODOT an alternative to fish ladders, which have become increasingly problematic for ODOT from a maintenance standpoint.
ODOT continues internal education regarding the needs and requirement of fish passage, and prioritizes its resources and culvert modification needs on an annual basis. On replacement culvert projects, ODOT strives to simulate a natural stream and determine if changes in culverts result in flows detrimental to fish passage. ODFW has provided some technical support, in addition to a master inventory of culverts that do not provide adequate passage.
4.3.8.3 Washington State DOT Inventory and Prioritization of Fish Passage Problems
WSDOT began a program to remove barriers to fish almost 20 years ago, since which time WSDOT has evaluated culverts on the 7,045 miles of the highway system to check for barriers to fish passage and prioritize which improvements would be of the most benefit. According to WSDOT’s July 2009 report, over 225 fish passage barriers have been studied, prioritized, and remedied in
Figure 15: ODOT Progress Toward Remediating Priority Fish Passage
NCHRP 25‐25/63 Environmental Corridor Management
61
Washington streams since the program began in 1991. WSDOT regularly fixes barriers on the sites of capital projects, but for ongoing corridor management and barrier remediation, WSDOT operates an Environmental Retrofit program that funds stand‐alone fish barrier removal projects that targets correction of the highest priority culverts that would otherwise not be fixed by a highway construction project anytime in the near future. Some limited work on fish passage barrier correction and repair is done as part of routine road maintenance or road preservation projects.
A primary objective of WSDOT’s watershed approach is to direct transportation mitigation dollars towards high‐priority watershed needs, including recovery of salmonid species. Access to good quality habitat is a key factor in the recovery of listed salmon stocks. Culverts can create fish passage barriers that fragment habitat. Common problems with older culverts include high water velocity, inadequate water depth, and large culvert outfall drops. Once these problems are corrected, the benefits to fish habitat are real and immediate; in many cases fish have been observed upstream of improved culverts within weeks of restoring access.
As a result of WSDOT’s efforts through 2009, access has been restored to over 2,431,269 square meters of potential salmonid habitat, or, over 1,125 linear kilometers (699 miles) once blocked by fish passage barriers.90 The potential salmonid habitat implies the habitat that would be available to salmonids provided that no other man‐made fish passage barriers existed in a given watershed. The amount of habitat once blocked by barriers was determined during habitat surveys or estimated using GIS software for sites that were lacking habitat surveys.91 WSDOT and the Washington Department of Fish and Wildlife jointly manage a statewide database for this inventory with over 900 identified culvert barriers, many of which have been added under more stringent criteria adopted in the past few years.
4.3.8.4 ODOT Routine Roadside Maintenance Guide
Routine road maintenance is a valuable conservation measure for protected salmon, steelhead, and other fish. Ensuring that the transportation system is stable and operating efficiently through routine and regular maintenance minimizes and avoids the potential for mass failure and subsequent impact to receiving water bodies. To minimizing the impacts of roadside maintenance on protected fish species and habitat, ODOT has prepared and periodically revised a guide for its employees, contractors, and partners. The agency’s Routine Road Maintenance Water Quality and Habitat Guide (a.k.a., “Blue Book”) provides direction, best management practices (BMPs), and technical guidance for routine road maintenance activities.
The National Oceanic and Atmospheric Administration, Fisheries Division (NOAA Fisheries) recognized the ODOT Routine Road Maintenance program as adequate to protect and conserve listed salmon and steelhead species, and thus gave ODOT an exemption to the Section 9 prohibition of ‘take’ in the final rules. In addition, by following the BMPs in the Guide, ODOT maintenance employees also comply with the ODOT National Pollutant Discharge Elimination System (NPDES) Municipal Separated Storm Sewer System (MS4) permit, which was issued by the Oregon Department of Environmental Quality (DEQ) under the Clean Water Act.
The Oregon Department of Fish and Wildlife (ODFW) was actively involved in reviews of the Guide and has recognized the Guide as a tool for ODOT maintenance personnel to minimize impacts to fish and wildlife habitat across the state. ODFW is referenced throughout the Guide as a technical advisor to ODOT maintenance personnel; local ODFW biologists contribute their expertise on local conditions for fish species and other habitat issues.
NCHRP 25‐25/63 Environmental Corridor Management
62
4.3.8.5 Oregon DOT GIS‐Based Sensitive Resource Inventory ODOT developed a geographic information system (GIS)‐based inventory of sensitive resources and erosion control problem areas along nearly 6,000 miles of state highway as part of its Salmon Resources and Sensitive Area Mapping Project. The primary purpose of the project is to provide accurate resource protection maps to roadway maintenance crews so that mowing, pesticide application, and other activities do not harm listed salmon species and other sensitive resources and so that streams and banks in poor condition might begin to be addressed.
The comprehensive resource inventory was developed by using color infrared digital imagery with 2‐foot resolution. Other sensitive resource features were recorded from current knowledge bases and limited roadside surveying, and from modeling of interactions between multiple resources and data layers. After distance to water, stream and bank characteristics, known threatened and endangered species locations and the overall condition of the salmon and trout habitats were identified. ODOT compared the imagery to previous data collected from other sources, such as wetland information from the National Wetland Inventory and hydrographic data from the U.S. Geological Survey to update and validate these findings.
GIS maps were tied into ODOT’s linear referencing system, which enables ODOT to identify the locations of sensitive natural resources features within a hundredth of a mile.92 From this GIS resource, ODOT’s Transportation Inventory and Mapping Unit and the Information Systems Branch developed a series of detailed resource maps in 0.01‐mile segments, which indicate where sensitive resources are present including which side of the road. Based on the potential for environmental harm, certain restrictions were developed for each mile of highway. This information was then placed on restricted activity zone maps. These maps were designed to alert ODOT staff to specific locations of sensitive natural resource features in order to avoid inadvertently harming wildlife or wetlands when performing routine maintenance practices, such as slope maintenance, snow removal, and vegetation management. They also served to help minimize the potential for violations of the Federal Endangered Species Act and the Clean Water Act. ODOT supplied these maps to all districts, for use by biologists, planners, and maintenance managers. Laminated Restricted Activity Zone Maps for maintenance use a simple color‐coding scheme of green and red to indicate, for each major class of maintenance activity (e.g., surface and shoulder work, vegetation management, snow and ice removal, etc.), whether or not that activity should be restricted along the left or right side of a given 0.01‐mile segment of highway.
For approximately the same cost as field surveys, ODOT produced better‐quality data that was less subject to individual interpretation, and covered over a much larger analysis area— 1,000 feet from the roadway centerline, without concern for access/trespass issues. By using remote sensing techniques to collect and map data, ODOT recognized significant savings, both in cost and time. Before turning to advanced imaging technology to help implement this project, ODOT had been sending three two‐person crews into the field for three and a half months to physically capture data. Once the digital imagery provided a base map to work from, the field crews were able to focus their energies on data validation instead of data capture. It also reduced the amount of time and resources needed to one two‐person crew for two months, allowing for a quicker solution to the increasing problem of deteriorating wildlife habitats. Had ODOT chosen not to use digital imagery to map these sensitive areas, the results may have been significantly less accurate and outdated within a short period of time. In fact, some natural features may not have been inventoried at all as they would have been inaccessible to the field crews or too expensive to map
NCHRP 25‐25/63 Environmental Corridor Management
63
across the entire state. The methodology developed by this project is easily adaptable for other state projects.
The library of GIS data resulting from the project has given ODOT’s regional staff a detailed environmental inventory of ecological resources, facilitating consideration of sensitive natural resource features when planning and designing transportation system improvements. The maps have proven to be a reliable, desktop scoping tool. The GIS system, data layers, and existing modeling routines facilitate easy updating as new information and aerial photography becomes available. ODOT is now developing an internet‐based application to enable wider desktop access to the information. Because the inventory data is digital and easily transferable between agencies, ODOT can also easily share this data and streamline communication processes with the National Marine Fisheries Service, the Oregon Department of Fish and Wildlife, the USFWS, and the U.S. Army Corps of Engineers. ODOT is also exploring real‐time geographic positioning system (GPS) connection to maintenance vehicles, as well as herbicide application spray booms to automatically activate and deactivate applicators as needed to avoid impacting sensitive resources including streams, wetlands, or rare plant populations.
4.3.8.6 Special Management Area Program, Signing, & Maintenance De‐Coder Cards
ODOT’s Blue Book builds on some other roadside management efforts, including a voluntary Special Management Area (SMA) program designed to protect threatened and endangered (T&E) plant species occurring on its lands, drawing on information from the Oregon Natural Heritage Program and multiple agencies, individuals, and counties. This system helps ODOT apply the appropriate levels of protection within SMAs, and enables ODOT to maintain or increase population numbers and assist long‐term conservation of these resources on public lands. SMAs have special signs, and activities are restricted. SMA signs installed at the edge of buffer areas for sensitive species are coded so maintenance forces understand which activities are and are not allowed. Maintenance personnel carry a “decoder card” that allows them to decipher the code on the sign. The code provides information that tells what type of maintenance activity is allowed (e.g., ditch cleaning, mowing, spraying) and when it is allowed. ODOT also developed an educational video and implemented training that was presented to ODOT maintenance crews, and sign installation was initiated.
Field Signing has the benefit of giving ODOT maintenance crews information on correct management requirements for each SMA, defining the field limits of the SMAs, provides a clear optical reference so inappropriate management is not applied, and establishes continuity around the state. All SMAs in the state follow the same signing format, leading to less confusion and fewer impacts.

NCHRP 25‐25/63 Environmental Corridor Management
64
Special Management Area Sign
ODOT Special Management AreaSign and instruction card issuedto maintenance crews
Thus far, 40 SMAs have been established for 14 different threatened and endangered plant species in 15 ODOT Maintenance Districts. Proactive late fall mowing has benefited two Willamette Valley species. The ODOT model is being adopted by Oregon counties and WSDOT, to manage rare species. Currently the SMA program is focused almost exclusively on flora (plants), however, other disciplines such as wetlands, fisheries, and possibly archaeology may benefit from the use of Special Management Area Signage. ODOT has noted that long‐term departmental commitment and a good working relationship between Environmental Services, district maintenance crews, and state and federal regulators have been essential components in the effort’s success in protecting and enhancing populations of rare plants.
Figure 16: ODOT Special Management Area Maintenance Sign

NCHRP 25‐25/63 Environmental Corridor Management
65
5 The Energy Efficient Highway: How Efficient Are Our Corridors?
The world dumps 90 million tons of global‐warming pollution into the atmosphere every 24 hours and a quarter of that is from the U.S., where transportation is a significant contributor.93 There are many ways DOTs can become part of the solution, through consideration of energy usage and emissions on highway corridors. Operational efficiencies are increasingly available. We are also entering an era of significant expansion in wind and solar technology and implementation. About half of the DOTs we spoke with or surveyed are exploring use of the right‐of‐way for energy and greenhouse gas (GHG) reduction opportunities.
5.1 Solar Arrays in/on DOT Right-of-Way After the generating hardware has been developed, solar electricity generation produces zero greenhouse gas emissions. When solar electricity (or renewable energy) is produced in on a DOT ROW, it displaces electricity in regional energy grids that would otherwise be produced by coal, natural gas, and in some places, hydropower. Electricity produced from coal and natural gas produces 2.10 and 1.32 pounds of global warming emissions per kilowatt‐hour respectively. (30 gallons, 3.5 lbs per kilowatt hour). Small renewable energy installations (REIs /micro solar or wind power sites) are now a widely promoted technological option for use in both remote locations and for use as part of broader energy supply configurations at DOTs, transportation authorities and other public sector entities.
Figure 17. Solar arrays along German and English highways above, and Dutch and Swiss highways, below.
Solar arrays have been generating electricity for 20 years on highway rights of way in Europe, and now DOTs in the U.S. are beginning to get in on the strategy. In England, solar energy was captured
NCHRP 25‐25/63 Environmental Corridor Management
66
by using photovoltaic noise barriers installed on a major interstate, the M27. In addition to the electrical performance of the system, whole life costs studies were undertaken to assess the benefits of a wider implementation of the technology. Any impact on driver behavior due to the presence of a visible technology adjacent to the highway was also investigated, as were the implications on reflected noise levels of using a photovoltaic barrier as opposed to a conventional noise barrier. Two barriers 54m long and about 2m high were installed and their performance is being monitored. The trial is providing the Highways Agency with experience in the use of such systems and grid‐connection problems.94
The trial was carefully monitored and showed that south‐facing land alongside highways can successfully be used for solar barriers. In terms of maintenance, rainfall was effective in washing the panels; however, vegetation needs to be cut back at least annually unless the barrier is installed in a paved area. Video techniques indicated no observed change in driver braking behavior due to the presence of the solar array distracting drivers. Findings from the noise survey found that changes in reflected noise levels on the opposite side of the motorway were hardly discernible from road traffic noise.95
At the time of the 2004 study, whole life cost studies suggested that the initial cost of the installation would need to be considerably lower, or the price of electricity would need to be significantly higher to achieve a payback period of 30 years.96 If the costs of the photovoltaic barrier are defrayed against those of a conventional noise barrier, the situation was better. The cost of panels has dropped by over half since this time, but installation costs are about the same.
Growing incentives are likely to stimulate more solar development. Beginning August 1, 2009, renewable‐energy companies can get cash grants from the federal government, instead of a credit against taxable income, for 30% of project costs, making it easier to finance projects. Partnerships are helping DOTs and towns secure clean, renewable energy — without paying a premium — from assets DOTs already own. And even in the six month period over which this report was written, the costs of photovoltaic (PV) system components have dropped dramatically.
While solar energy is becoming more affordable and new developments suggest it may reach parity with grid rates, DOTs may be able to explain its value beyond the economics. As a utility owner installing PV mini‐systems on power poles in New Jersey said, "It (solar power) is going to increase the cost (for now), and people have got to understand why it's worth more,” said PSEG's Mr. Izzo, who went on to list pollutants produced by coal or gas incineration that don't occur with solar technology.97
In its communications, Caltrans describes improvements in terms of long term energy cost savings. The agency announced plans to install $20 million in new solar energy systems at 70 of its facilities throughout the state, “providing California taxpayers an estimated $52.5 million in avoided energy costs over 25 years. Instead of burning fossil fuels to produce electricity, the panels will harvest energy from the sun, producing more than three million kilowatt‐hours of electricity each year and eliminating 2.8 million pounds of greenhouse gases annually ‐ at no cost to the California taxpayer.” The Caltrans solar projects are being financed through the sale of congressionally approved Clean Renewable Energy Bonds (CREB), which will be paid back in annual payments over 15 years.

NCHRP 25‐25/63 Environmental Corridor Management
67
5.1.1 Partnerships with and Easements for Municipalities
DOTs are also partnering with local governments. MassDOT approved a town’s request for a 25‐year easement over 1.26 acres of land in the ROW to allow the town to erect a 112 kilowatt photovoltaic array along the state highway to power town water supply wells. The array is part of an overall water supply development project intended to promote economic development on land near a new interchange. The system will consist of about 11,200 square feet of silicon panels, in rows covering about 25,000 square feet of the embankment along the highway. The remainder of the easement area is designated for future expansion of generating capacity. The system will generate about 140,000 kilowatt hours per year. In exchange for the easement, the town of Carver agreed to perform landscape maintenance as well as litter and vegetation control from the easement area to the interchange. The town will also install security fencing to protect the area from encroachment by dirt bikes and vandalism. The town agreed to share the system if it is expanded or if a review of revenue or power generation shows a capacity beyond the initial estimates. In agreeing to the request, the DOT Secretary said, “We want our highways and roads to be as green as they can be. Our transportation system should be acting responsibly to promote clean energy and reduce greenhouse gas emissions wherever possible.”98
MassDOT also selected a test site for their solar covered park‐and‐ride area in Rockland and is currently awaiting proposals. MassDOT is also constructing a wind turbine at their Blandford Rest Area on the Route 90 Turnpike.
5.1.2 Utility Pole Upgrades with Solar Panels
New Jersey's biggest utility is outfitting with solar panels 200,000 utility poles in and along road rights‐of‐way. “Instead of bemoaning what it doesn't have ‐‐ bright sunshine, high winds, empty
Figure 18: Utility Pole Retrofits with Solar Panels in NJ (AP)

NCHRP 25‐25/63 Environmental Corridor Management
68
land ‐‐ New Jersey has looked for places where solar capacity can be squirreled away inconspicuously. In addition to utility poles, the state is pushing solar panels for industrial locations with many flat roofs.”99 For example, FedEx installed solar panels across the top of its distribution hub in Woodbridge, New Jersey, in August and September 2009. New Jersey’s Public Service Enterprise Group has plans and approvals to install 40 megawatts of solar panels on utility poles and another 40 megawatts at its industrial yards and on rooftops.
The pole‐mounted systems cost about $1,000 apiece and will become part of a smart grid network with radio capability to alert the utility to outages and relay other grid data. New Jersey's $514 million program will double its solar capacity to 160 megawatts by 2013 and will be funded by utility customers. 100
New Jersey’s 4,000+ solar installations to date comes to “more per square mile than California.” 101 New Jersey's goal is to garner 3% of its electricity from the sun and 12% from offshore wind by 2020, part of a larger effort to meet 30% of the state's electricity needs through clean sources.
5.1.3 DOT Solar Array Provides Energy for Interchange Illumination
While solar photovoltaic arrays have been installed along highways in Europe and Australia over the past two decades, it was not until 2008 that they were first installed in the operating right of way along a U.S. highway. In that year, ODOT completed the nation’s first such solar project, a 104‐kilowatt solar photovoltaic system that produces about 112,000 kilowatt hours a year, or 28% of the 400,000 kilowatt hours used to light a nearby interchange. The project, which covers about 8,000 square feet and is roughly the length of two football fields, cost $1.3 million to construct.
This project was the first stage in ODOT’s Solar Highway Initiative, which will allow the agency to meet an increasing proportion of its electricity needs from solar arrays deployed on its own property. This initiative was prompted by the Governor’s directive that all state agencies secure 100% of their electricity from renewable resources, as well as the state’s “25% by 2025” Renewable Portfolio Standard. Oregon may seem like a strange location for solar arrays, but Solar Oregon reports that Germany is installing more new solar energy systems per capita than any other country, yet its capital, Berlin, receives less sun than the cloudiest location in Oregon.102
Figure 19. Oregon's Commercial Retail Electricity Prices

NCHRP 25‐25/63 Environmental Corridor Management
69
It takes 47 million kilowatt‐hours annually to light Oregon’s highways and support the transportation system, at a cost last year of more than $4 million. Historically, that electricity is supplied from the grid with a substantial mix of non‐renewable resources. The increasing cost of electricity results in less money being available to maintain and operate the transportation system. In 2008, the Oregon Transportation Commission directed ODOT’s Office of Innovative Partnerships to procure up to two megawatts of solar energy on ODOT properties, including along the state highway right of way and the interstate system. ODOT estimates that arrays on 120 miles of their 16,000 lane‐miles of right‐of‐way could supply all of the electricity that the agency uses annually.
As established in solar site license and power purchase agreements, ODOT is providing the land for the installation at no cost to its private partners, PGE and PacifiCorp, which are Oregon’s investor‐owned utilities. The agency will purchase the energy generated for at least 20 years at no greater than grid cost. ODOT will buy power from subsequent installations at below‐grid rates, resulting in more funding being available for mission‐critical needs of the transportation system. The public‐private partnership used the 50% state business energy tax credit, the 30% federal investment tax credit, and utility incentives to finance the project. As a state agency, ODOT would not have been available to utilize these tax incentives on its own.
These partnerships with Oregon’s investor‐owned utilities, which supply almost two‐thirds of the electricity used by ODOT, could make it possible to develop economic‐scale projects on ODOT‐owned land using essentially the same third‐party financing model. The utilities would contract with solar developers to design, build, and install the arrays, which they – the utilities or limited liability companies involving the utilities – would own, operate, and maintain. These solar arrays could count toward statutory requirements to develop renewable energy resources. The utilities would also be responsible for maintenance and successful operation of the arrays, including any damage due to vandalism or crashes. ODOT would purchase all electricity generated by the systems under a power purchase agreement, for a term from six to 20 years or longer.
One hundred percent of solar electricity generated is emissions‐free. Factoring in the emissions from production and installation of the solar panels, 87 to 97% of the energy produced by the solar arrays will be free of pollution and greenhouse gas emissions. When solar electricity is produced in on a DOT ROW, it displaces electricity in regional energy grids that would otherwise be produced by coal, natural gas, and in some places, hydropower. This initial solar highway project will avoid about
Figure 20: Preparing footings for solar panels and setting up the racks.

NCHRP 25‐25/63 Environmental Corridor Management
70
43.5 metric tons of carbon dioxide equivalent (MT CO2e) each year that it is in operation, based on the power source mix of the Pacific Northwest Regional Energy Grid. Over the 20‐year period of the power purchase agreement, the replacement of non‐renewable energy sources with solar electricity will result in approximately 870 MT of avoided emissions (CO2e). Over the panels’ estimated thirty‐year useful life, the amount of avoided emissions increases to around 1,305 MT CO2e. The estimated carbon payback period (the time until the project is carbon‐neutral) is less than 5 years.
Policy Support Policies and strategies adopted in the Oregon Transportation Plan support this renewable energy project. Policy 4.2 — Energy Supply states that it is the policy of the State of Oregon to support efforts to move to a diversified and cleaner energy supply, promote fuel efficiencies, and prepare for possible fuel shortages. Strategy 4.2.1 directs ODOT to support efforts to move toward a diversified and cleaner energy supply.
Following the success of the demonstration project, in June of 2009, the OTC approved investigating additional solar highway project development opportunities, including:
• Adding 150 kilowatts to the demonstration project site (maximizing the available space);
• Installing 1.5 Megawatts at the I‐5 northbound Baldock Safety Rest Area north of Wilsonville;
• Installing 3 Megawatts on the north side of I‐205 at the ODOT Maintenance storage facility in West Linn; and
• Developing a project with PacifiCorp in the Medford area.
Figure 21: A 104 kilowatt ground-mounted solar array, situated at the interchange of Interstate 5, a federally designated Corridor of the Future, and Interstate 205, supplies about one-third of the energy needed for illumination at the site.
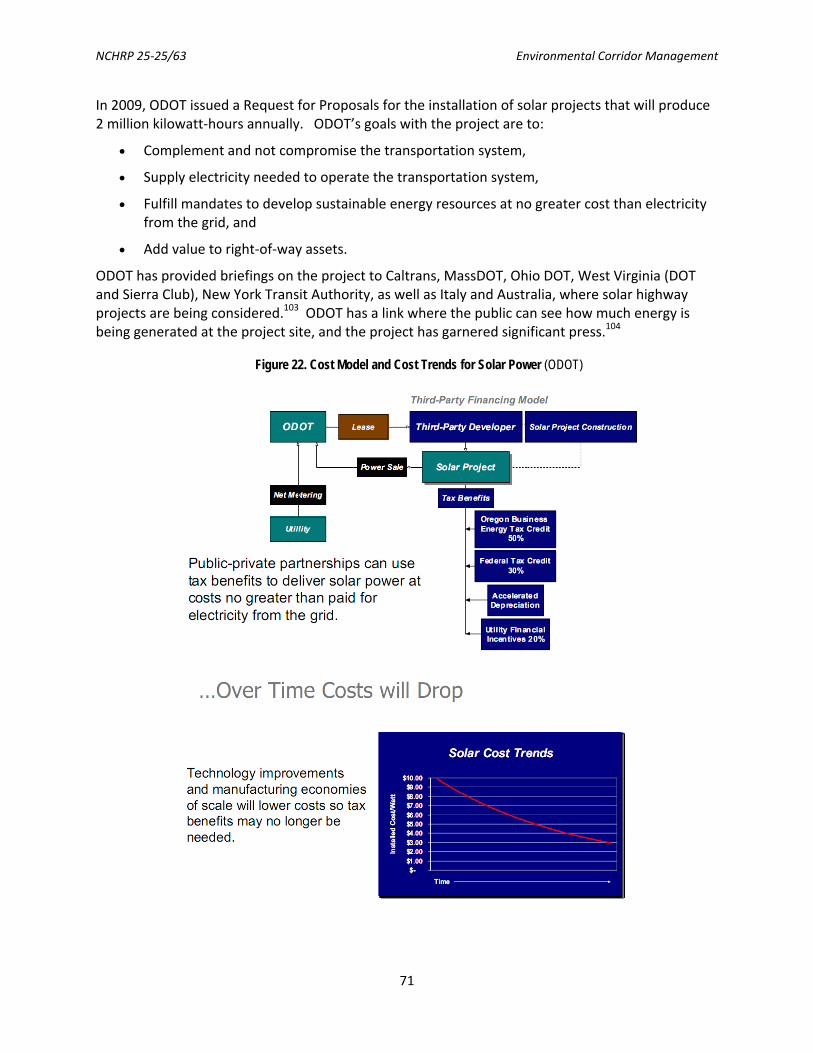
NCHRP 25‐25/63 Environmental Corridor Management
71
In 2009, ODOT issued a Request for Proposals for the installation of solar projects that will produce 2 million kilowatt‐hours annually. ODOT’s goals with the project are to:
• Complement and not compromise the transportation system,
• Supply electricity needed to operate the transportation system,
• Fulfill mandates to develop sustainable energy resources at no greater cost than electricity from the grid, and
• Add value to right‐of‐way assets.
ODOT has provided briefings on the project to Caltrans, MassDOT, Ohio DOT, West Virginia (DOT and Sierra Club), New York Transit Authority, as well as Italy and Australia, where solar highway projects are being considered.103 ODOT has a link where the public can see how much energy is being generated at the project site, and the project has garnered significant press.104
Figure 22. Cost Model and Cost Trends for Solar Power (ODOT)

NCHRP 25‐25/63 Environmental Corridor Management
72
5.1.4 “Lessons Learned” for DOTs Implementing Solar Projects in the ROW
DOTs, primarily Oregon, share the following “lessons learned” for implementing solar projects in the ROW:
• Siting a prototypical solar resource project on the transportation system requires addressing concerns and requirements specific to transportation systems, including permitting. Addressing those concerns and requirements requires additional analyses and may require additional investments to mitigate issues that arise.
Public safety was of paramount concern in siting the Oregon solar photovoltaic project. Specific issues addressed in the demonstration project included:
o Clear Zone ‐ Nothing immovable can be located inside a highway facility’s “clear zone,” or errant vehicle pathway. Solar installations must be located outside the clear zone or behind a barrier such as guardrail. The clear zone is site‐specific and takes into account facility type, topography, and design speed, among other considerations. ODOT’s roadway design engineering section was consulted to determine appropriate clear zone boundaries.
o Reflection – Reflection or glint and its potential impact on traffic safety was a concern. That concern was addressed by describing how solar panels are designed to absorb sunlight and how the Federal Aeronautics Administration (FAA) considered such issues in allowing solar arrays to be sited at airports. The issue was also addressed by a study in England that evaluated changes in driver behavior by measuring brake light durations before and after a solar project was installed in the right‐of‐way.
o Utility Permit – Through review by ODOT, the Oregon Department of Justice (DOJ) and FHWA, it was determined that since the demonstration project supplies electricity for ODOT’s own use, it was permitted on ODOT Right‐of‐Way (ROW) through the normal Oregon Administrative Rules Division 55 (OAR 734‐055) Utility Permit process, which follows the Federal Utility Accommodation Plan. The Federal Utility Accommodation Plan is required of all states and describes the process that each state transportation agency uses to work with utilities for siting, relocating, and maintaining utility infrastructure on State ROW. ODOT District offices issue and manage the permits as a normal course of business. Due to the unique nature of the solar installation, FHWA requested and completed review of the Permit before it was issued; however, FHWA has been an enthusiastic and consistent supporter of solar projects in the ROW when consulted by the states.
• Access – Because interchanges otherwise have limited access, site access for construction, operations, and maintenance will require new procedures and possibly additional facilities, such as graveled access roads. Such access will need to be thoughtfully developed, controlled, and managed to avoid potential safety and security issues associated with access by the general public. Access concerns and requirements encountered in the development and construction of the Oregon demonstration project included:
NCHRP 25‐25/63 Environmental Corridor Management
73
o Traffic Control. A traffic control plan was submitted to the ODOT District office as a prerequisite to the Utility Permit. It was of great benefit to the interchange demonstration project that the EPC (Engineer, Procure and Construct) Contractor had extensive experience working on and alongside the Interstate highway. However, even with an approved traffic control plan, there was an instance in which a subcontractor relocated a traffic control barrier in order to exit the freeway more easily. The EPC Contractor appointed an ODOT‐certified Traffic Control Supervisor (TCS) to monitor the installation and operation of the traffic control system, in accordance with ODOT policy. Working together, ODOT District staff and the TCS corrected the problem and prevented any reoccurrence.
o Maintenance Access. Stipulations governing the access, ingress, and egress of the site were incorporated into the Utility Permit, providing control over the time(s) and condition(s) under which access is permitted. This provides the access needed for maintenance functions while mitigating risk to the traveling public.
o Gravel Access Road. ODOT’s existing point of maintenance ingress and egress from the Interstate highway has functioned adequately for many years. Therefore, the maintenance access point was maintained and only a small segment of gravel access road was constructed entirely on site from ODOT’s existing access road to the array. By making use of ODOT’s existing infrastructure, there was no increase in risk to the traveling public, and project costs were minimized.
• Interconnection – Interconnection requirements are far more challenging when the utility interconnection point is on the other side of an interchange of interstate highways. How and where that interconnection can be completed most cost‐effectively can be a critical issue. For the ODOT project, an economical means of connection across the highways was provided by mounting the electrical conduit to the underside of an existing bridge crossing I‐205 and by installing the conduit beneath I‐5 using directional boring. In addition to providing significant cost benefits, these two construction techniques achieved three additional aims: (1) eliminating risk to the traveling public, (2) preventing impacts to the flow of traffic, and (3) preventing damage to existing infrastructure.
• Security – Security of the investment is a practical concern. Roadside equipment is easily subject to theft and vandalism. Potential security measures include: fencing, continuous security monitoring, surveillance cameras and communications equipment, hardening installation (such as the use of one‐way screws), embedding locator devices in equipment and other similar measures. Security concerns and requirements encountered in the development and construction of the Oregon demonstration project included:
o Site Location and Configuration can be chosen to discourage vehicle and pedestrian access.
o Fencing and Access Control. ODOT’s $1.3 million PV array and support equipment are located in a secure compound surrounded by a full height security fence, hardened with triple‐strand barbed wire, razor wire coil, and 3” barbed security tape. An electronic security system monitors the perimeter fence and is capable of detecting when the fence is scaled, cut, or damaged. Sensors monitor the opening and closing of the gate,
NCHRP 25‐25/63 Environmental Corridor Management
74
and security cameras provide remote visual monitoring and motion detection within the compound.
o 24/7 Notification and Protocols. ODOT maintenance personnel will be notified 24/7 if any breach of security is detected, and ODOT will notify PGE if it becomes aware of site security issues. Under the established security protocols, ODOT will notify State Police of site security issues.
o Stop‐Theft Technology. PGE has implemented the use of Stop‐Theft technology, a proprietary theft deterrent product that PGE has used widely to safeguard, identify, and recover electronic equipment such as laptop computers, cameras and other moveable items. Placards are prominently displayed to further deter theft.
o Tamper‐Resistant Hardware. Tamper‐resistant bolts were used to make the removal of mounted hardware more difficult and time‐consuming.
o ODOT Access. If necessary to gain access inside the fence for security or any other reason, appropriate ODOT maintenance and district personnel have keys to the project site.
o Lighting. The interchange lighting served by the solar array also illuminates the demonstration project site. With that nighttime illumination, the nearly 145,000 vehicles passing by each day ensure a high level of public observation of the site.
o Public Liability. The Solar Power Purchase and Site License agreements clearly assign security responsibility for the solar project to PGE, and there is no public liability for security of the solar array.
• Maintenance – There is the potential for significant maintenance costs given the proximity to highway traffic. The array may be subject to oily road spray and airborne dust, resulting in efficiency losses. Flying rocks or other debris could damage the array. ODOT and PGE sought to assess and mitigate those risks. Maintenance concerns and requirements encountered in the development and construction of this demonstration project included:
o Public Liability. The Solar Power Purchase and Site License agreements clearly assign maintenance responsibility for the solar project to PGE, and there is no public liability for maintenance. ODOT will continue to maintain the interchange area outside of the array just as it has in the past.
o Set Back From Roadway. ODOT and PGE positioned the photovoltaic array as far from the roadway as possible to minimize the risk of roadway debris affecting the safety and functionality of the array. DOTs could consult with European agencies that have installed PV arrays on top of guardrails and roadside barriers.
o Scheduled Maintenance. Operation and Maintenance manuals for this project provide guidance on the proper processes and frequencies for inspecting, cleaning, and maintaining the photovoltaic array, given the site and environmental conditions. This maintenance is performed by PGE on regularly scheduled basis.
o Low Maintenance Construction. Barring damage from external factors, the photovoltaic system should require very little maintenance during its service life. In addition, the compound itself incorporates low‐maintenance construction options such as the use of

NCHRP 25‐25/63 Environmental Corridor Management
75
a low‐growing grass species that eliminates the need for regular mowing and a stoutly constructed access road designed to minimize the need for repair.
• Public Involvement – A key objective is to enhance public understanding about the potential contribution of solar energy to meeting the state’s energy needs and the opportunity for solar resource development on the state transportation system. Public support of solar resource development on the transportation system will be a determinative factor in future solar resource development on the system. Public involvement measures included:
o Communications Plan. ODOT and PGE developed a Communications Plan that identified who was responsible for contacting and/or responding to media, press release protocols, Governor’s Office liaise protocols, and groundbreaking ceremony activities. It specified the need to liaison with local jurisdiction and state elected officials whose districts the project is in. These officials appreciated the orientation the project team provided.
o Groundbreaking Ceremony. An on‐site groundbreaking ceremony was jointly hosted by ODOT and PGE and was attended by high‐level leaders. A press packet was prepared that included a Frequently Asked Questions piece, history of the project’s development, artist renderings of the array, pictures of the site, identification of all the Oregon companies involved in the project, and more. The groundbreaking event was a great success. Coverage was provided by the major Portland television and newspaper media, including the local ABC, NBC, and CBS news stations; Oregon Public Broadcasting radio; the Portland Monthly Magazine, the Sustainable Industries Journal, and The Oregonian. The press was all very positive and Oregon DOT continues to conduct follow‐up interviews.
o Green Media List. To further engage the public, media releases and briefing papers were prepared and sent to a national audience that included mainstream media as well as specific “green media.” This action was deemed a success based on the number of contacts the ODOT Project Director received (and continues to receive) from across the nation, as well as from international audiences. The public and media response has been overwhelmingly positive.
o Oregon Solar Highway Website. A website now helps ODOT manage and proactively respond to the interest. The Oregon Solar Highway website (www.oregonsolarhighway.com) has turned out to be one of ODOT’s most popular websites, getting around 250 hits per week. The YouTube video of the groundbreaking ceremony holds the record for the most hits of any ODOT video. The Solar Highway photo set on Flickr are among ODOT’s most popular in terms of viewership. The website contains technical and historical information about the project, including fact sheets that discuss the carbon footprint of a solar panel, how long this project will take to become carbon‐neutral, and how solar energy compares to grid energy in terms of carbon impacts. The website also provides information to solar energy providers about ODOT’s future plans.
o Site Signage. Two “motorist information” signs identify the demonstration project. Approval for these non‐standard signs was given by ODOT’s Sign Design Engineer. Due

NCHRP 25‐25/63 Environmental Corridor Management
76
to the unusual nature of the project, ODOT determined that traffic safety would be improved by identifying the facility to the driving public. The signage identifies the site as an ODOT‐PGE Solar Highway Demonstration Project.
• System Performance Monitoring and Presentation – Inherent in gaining public support will be affirming the value of the solar resource installation. System performance monitoring and presentation will lend substantive information on the contribution of the system. Sharing that information with the public in terms it can understand will be important as will presenting it in easily accessible venues, such as web sites and public presentations. At the same time, this public focus will make it even more critical that the system performs well and having real‐time monitoring of system component will facilitate managing system performance. The provider and ODOT both wanted to monitor and display, via the web, graphical representation of the energy generated by the demonstration project, both in real‐time and cumulatively. It was quite challenging to develop data‐sharing protocols acceptable to each parties’ IT departments, while also considering cost, firewall and confidential information issues, hardware (conduit, fiber) and software sharing, and data formatting. It is expected that protocols developed for this first project will carry over to other projects sited in PGE territory.
• Statutory or Regulatory Constraints – Siting solar photovoltaic arrays in the ROW will offer insights into statutory or regulatory issues that may inadvertently limit opportunities for renewable resource development. For example, net metering tariffs did not necessarily contemplate installations on a service area‐wide transportation system, rather than on a customer’s specific site. Identifying statutory or regulatory constraints that preclude resource development and resolutions that would instead foster such development will have value. Regulatory constraints encountered during the development of the demonstration project included:
o Utility Permit. As noted earlier, ODOT, DOJ, and FHWA determined that the appropriate permitting for the project was through the Utility Permit process because the electricity will be for ODOT’s own use on the transportation system. This “nexus,” tying the solar installation to ODOT’s need for electricity, complies with constitutional constraints on the use of highway funds and with the utility permitting process. The Solar Power Purchase and Site License Agreements include provisions enabling PGE to assume ownership of the project, but it was also critical to demonstrate that electricity produced by the project would continue to be for ODOT’s own use, while benefiting PGE’s ratepayers to meet regulatory requirements associated with a generating plant owned by PGE. These complex legal and regulatory requirements were carefully considered and thoughtfully addressed through the permitting process.
o Net Metering Artificially Restricts the Most Promising Sites. Because of Oregon Public Utility Commission rules, customers, including ODOT, can only offset load aggregated by meter and feeder, across contiguously owned property, and on the same rate schedule.
o Net Metering is Also Limited to 2 Megawatts Per Site. These restrictions will result in more, smaller projects; a longer timeline to develop renewable energy resources (or a “solar highway” system); and higher cost‐per‐kilowatt‐installed. Development of an “Administrative Net Metering” tariff or process – allowing an agency to offset all its load in a given utility’s service area by utilizing the most promising ROW locations to their full

NCHRP 25‐25/63 Environmental Corridor Management
77
capacity – would greatly facilitate development of the Solar Highway, and would result in lower costs to the public.
o Legal Issues. Legal issues associated with the demonstration project were significant hurdles if only because neither DOJ transaction attorneys nor Special Assistant Attorneys General had expertise in Solar Power Purchase and Site License Agreements. There was an inherent learning curve associated with these agreements and the application of related state transportation law. An intervening declaratory ruling process by the Oregon Public Utility Commission required further review of the application of net metering and energy supplier laws and rules and how the application of those rules might adversely affect ODOT’s interests in the demonstration project and future solar resource development. All issues associated with the demonstration project were resolved affirmatively. In the summer of 2008, an article written by Virginia Tsu, FHWA Oregon Division, was published in the FHWA Office of Real Estate Services Newsletter titled, “Focus On The Future: Accommodation of Renewable Energy Resources in the Right‐of‐Way.”
5.2 Finding Good Sites for Wind Some DOTs have scouted for good sites for wind in the ROW. In other cases, DOTs have been approached by potential developers. In considering whether they may be approached, DOTs may want to consult the National Renewable Energy Laboratory (NREL) investigation of currently profitable areas for wind development around the continental U.S. After screening over 25 million sites, 84% of the nearly 60,000 final winning sites were located in Massachusetts, New York, and Vermont. These states are characterized by high retail electric rates and high REC values. For locations with lower electric rates, some combination of large project size and strong wind resource is necessary for success.105
In its Assessment of the Distributed Wind Market in the United States for U.S. Department of Energy (DOE) 2007 to 2008, NREL analyzed the potential for widespread development of distributed wind in the 10‐5,000 kW range. The project included:
• A market survey to determine the availability of technology in this range;
• A review of the drivers and restrainers of distributed wind; and
• An analysis of the technical and economic market potential for distributed wind in the continental U.S.
To conduct the market potential phase of the study, NREL used GIS and financial analysis techniques to estimate the potential market in the residential, commercial/industrial, and community wind customer classes. The analysis began with over 25 million actual sites in the continental U.S. and eliminated unsuitable sites from further analysis due to elevation, slope, lack of suitable space, or poor wind resources. Remaining sites were individually evaluated for the profitability of installing a distributed wind system, considering the local wind resource and electricity rate, wholesale electricity rates and REC values, turbine size and performance at each site, host electrical load, supportive state and federal policy, and other factors. Those sites with profitable installations were totaled to determine the technical and economic potential for distributed wind nationwide. In addition to evaluating the potential for existing mid‐scale turbine technology, the study also evaluated the potential of two conceptual advanced turbines. This phase of the analysis demonstrated that the market for distributed wind would expand with lower‐cost, higher‐

NCHRP 25‐25/63 Environmental Corridor Management
78
productivity turbines.106 To maintain a controllable amount of data, the model applied utility‐ and regional‐level factors such as net metering rules, utility‐specific incentives, and wholesale power prices statewide.
Incentives established in 2008 in California boosted the set of economically viable sites by nearly 10%. The Tennessee Valley Authority provides a generous uncapped incentive which brought many Tennessee projects close to a positive NPV. Delaware had an additional 246 winning sites as a result of its Green Energy Program incentives; the program provides a grant of up to 50% of a project’s cost with a limit of $100,000. Georgia offers a Clean Energy Tax Credit for commercial and industrial customers only, providing a 35% tax credit over 5 years up to a maximum of $500,000. This tax credit brought 65 projects to success. North Carolina had an additional 122 winners as a result of its Green Business Fund, which offers grants in amounts up to $100,000. Pennsylvania had 15 additional winners due to its Energy Harvest Grant Program, which offers a grant of 50% of a project’s cost up to a limit of $500,000. This Pennsylvania grant program is open to public facilities only, including DOTs.
Emerging policy and technological developments will only increase the practicality and feasibility for DOTs. A national renewable power standard or cap‐and‐trade program would dramatically expand the number of sites meeting the profitability threshold. Also, technological changes that have been implemented in the bigger and higher‐capacity turbines are ripe to be included in small‐ and medium‐scale turbines. The distributed wind turbines of 2008, technologically speaking, are the same turbines that were used for central‐station projects in the early 1990s. Improvements have been made more rapidly to utility‐scale turbines, which now boast capital costs several multiples lower on a $/kW basis than small‐ and medium‐scale distributed wind turbines. Decision‐makers may need to consider the incremental virtues of distributed resources—local ownership, local benefits, and reduced demand on the electrical grid or reduced need to connect in remote areas—to get a broader picture of the practicality of the technology.

NCHRP 25‐25/63 Environmental Corridor Management
79
Figure 25. Excluded and Analyzed Lands (Source: NREL)
Figure 23. Wind Power Classes (Class 3 is 18%, 4-7 are 12% of total) (Source: NREL)
Figure 24. Economically Successful Locations for Midscale Distributed Wind Generation (Source: NREL)

NCHRP 25‐25/63 Environmental Corridor Management
80
5.2.1 Maintaining Wind Power on DOT ROW
Maintaining wind power in the ROW has its own set of issues. Large mobile cranes are used to assemble wind turbine components at the top of lofty towers and, later, to service these turbines. Blown generators, misbehaving gearboxes and damaged rotors keep turbines from maximizing the wind’s energy, requiring repairs up to 300 feet and more off the ground. Given the recent demand, “sometimes, even though spare parts are available to repair a turbine, it may take months to secure a crane to do the repair work,” said a product manager for Vestas Wind Systems, A/S’s Technology Product Management R&D division. Where the winds are strong, the heaviest cranes are required to do repair work. Unfortunately, such cranes are also the most difficult to move from place to place. Some wind system suppliers are developing their own crane technology to avoid such problems.107
5.2.2 Feasibility of Using Solar or Wind Power for Transportation Infrastructure
NCHRP 25‐25/Task 64, Feasibility Study of Using Solar or Wind Power for Transportation Infrastructure, will provide research into the technical and economic feasibility of DOT use of REIs for transportation infrastructure (including: grid connected applications in remote locations such as lighting and signage at intersections and interchanges, rest areas, illuminated ROW / bridges).
Before a DOT may choose to install solar or wind power facility as a matter of policy, or as part of an effort to green operations, they also need to fully understand feasibility of those installations. DOTs need information on the types of REIs currently in use, or about to become commercially viable and which could potentially be applied in transportation settings, and to be able to assess options for potential application in a variety of settings (excluding design or energy efficiencies of buildings). Decision making requires information on the generation capacity of systems, energy storage capacity options for remote applications, and full life cycle costs and the expected return on investment. In the case of solar and wind power, weather and seasonal patterns effect power generation capacity and must be taken into consideration in decisions to apply these technologies.
NCHRP 25‐25/64 will help DOTs understand what factors to consider when evaluating application of these technologies, and provide direction on how to assess the feasibility of use, answering questions such as:
• When used in an application tied with the electricity grid, what are the key factors that drive economic viability?
• When used in a remote application, where the electricity grid can cost more to tie into, are these systems more economically justified?
• Should the assessment of the viability of an application also look at more energy efficient use (LEDs for example).
Figure 26. A prototype of the Vestas Tower Crane.

NCHRP 25‐25/63 Environmental Corridor Management
81
Figure 27: Wind Turbines Near Interstate 10, Palm Springs, CA (first set) and near Weatherford, OK (bottom).
NCHRP 25‐25/63 Environmental Corridor Management
82
The project will conduct a comprehensive survey of the various types of solar and wind power systems available and potentially applicable in a transportation setting, their ability to provide sufficient or excess power for transportation infrastructure, and the general feasibility of installing solar/wind generated powered systems. Applications such as highway lighting, overhead sign lighting, overhead signs with LED lettering, traffic signals, and variable message signs including mobile operations, portable arrow boards and similar message systems will be covered. The project will also identify sources of information available that will need to be accessed when evaluating viability of possible solar or wind applications (e.g., geographic location, associated solar or wind energy profile for a location). A review state and local government practices regarding the use of alternative power for their highways will assess:
• Available information on systems and components in use (or under consideration)
• Why / how selected and lessons learned (when has it worked, how was it done, what factors were considered and drove the decision to proceed,
• What cost factors were part of the decision process?).
• Identification of barriers to implementation including, but not limited to, (a) net metering; (b) zoning; and (c) state statutes and laws.
Finally, a general design approach for each alternatively powered system (e.g., roadway design standards like break‐away posts within the clear zone and minimum illumination levels, location considerations on the right of way for solar versus wind applications) will be identified, to provide for the safe and efficient flow of traffic along the transportation facility. Accompanying this will be a life‐cycle cost analyses comparing grid‐powered systems to alternatively powered systems, using unit costs from the data source (e.g. capital, operating and maintenance cost and cost savings data, state and local government sources such as a DOT's Cost Estimating Office or Maintenance Management System‐MMS data). An accessible and user‐friendly tool will be developed for state DOT practitioners to assess the potential feasibility and life‐cycle costs for REIs on state facilities and outlines the practical steps for REI implementation and installation.
Between 500 and 600 megawatts of solar power will be built this year across the United States — about double the figure of last year — according to Larry Sherwood, who compiles and studies such data as a consultant to the Interstate Renewable Energy Council, a nonprofit industry group. He said some analysts were projecting even higher figures. “There will be quite a wider number of states than in the past,’’ Mr. Sherwood said. Falling costs of photovoltaic cells are also propelling the market this year after a period in late 2008 and early 2009 when prices were rising.108
As mentioned, about half of DOTs we spoke with told us they are exploring use of the right‐of‐way for energy and greenhouse gas (GHG) reduction opportunities. One DOT mentioned they are also looking at our rest areas, weight stations and maintenance yards for wind turbines and solar installation. Some rest areas already have solar panels to produce hot water or on‐site electricity production. Solar is also increasingly used for sign lighting. Tennessee DOT is working with Oak Ridge National Labs and the University of Tennessee on a pilot effort to plant switchgrass plots along Interstate right‐of‐way. One DOT noted that while they are investigating opportunities in this area, “it seems clear we lack funds and that these investments are not cost effective compared with alternative energy saving measures.”
NCHRP 25‐25/63 Environmental Corridor Management
83
5.3 Providing Guidance to the Private Sector: A Plan for West-Wide Upgrade of Transmission Corridors
Energy from renewable resources is a growing trend in the U.S., and from a climate change perspective, an urgent need. Given the age of the transmission infrastructure, the federal government has been examining how to facilitate upgrade of the system, especially in the west where much land is federally owned, and where new transmission corridors would be most appropriate or least damaging, environmentally. In late 2008, four federal agencies (DOI BLM, DOE, DOA, and DOD) released a Final PEIS for a West‐wide Energy Corridor, designating energy transport corridors on federal lands in 11 Western States, Arizona, California, Colorado, Idaho, Montana, Nevada, New Mexico, Oregon, Utah, Washington, and Wyoming. To avoid intersecting or approaching sensitive lands and resources, many proposed transmission corridors follow existing infrastructure such as highways, transmission lines, or pipelines to avoid placing corridors in “greenfield” (undeveloped) locations. 109
Energy transport corridors are agency‐preferred locations where pipelines and transmission lines may be sited and built in the future. Having a network of corridors that could accommodate transportation systems for multiple energy types potentially minimizes the proliferation of energy utility rights‐of‐way on the Federal landscape. Eighty‐two percent of the corridors analyzed in the Final PEIS are located on BLM‐managed lands, while 16% are on USDA Forest Service lands. When considering where to locate proposed corridors, the agencies considered the possible future delivery of electricity generated from new renewable resources, including wind, geothermal, and solar energy.
Corridors were sited using a four‐step process that identified a number of important lands and resources to be avoided to the fullest extent possible. The Agencies examined factors that constrain where a network of energy transport corridors could be located – including topographical, environmental and regulatory constraints – as well as the overall suitability of particular lands to support development and operation of energy transport infrastructure. In some cases, corridors intersect or approach sensitive lands or resources. Most often these intersections follow existing infrastructure such as highways, transmission lines, or pipelines to avoid placing corridors in “greenfield” (undeveloped) locations.110
The agencies considered simply designating existing energy corridors and rights‐of‐way as corridors under Section 368, but eliminated that option because many of the existing energy corridors and utility rights‐of‐way (ROWs) are sized for relatively small transport systems (both in terms of capacity and distance) and could neither support added systems nor be expanded to accommodate additional energy transport facilities. These limitations make them too fragmentary or localized to serve the need for long‐distance energy transport across the West and effectively address electricity transmission congestion, reliability, or delivery‐enhancement issues. Where existing corridors and ROWs could be expanded or upgraded, they were incorporated into the Proposed Action; about 70% of the proposed corridors incorporate existing locally designated energy corridors and/or utility ROWs. That information is not available on one large map, but rather on separate base maps for each state, showing where designated corridors overlap with transportation and utility corridors.111

NCHRP 25‐25/63 Environmental Corridor Management
81
The 368 process provides a model for DOTs that might want to provide similar guidance for the private sector, to help utilities and private sector applicants more efficiently target where renewable energy projects and might be located. The 368 advance site identification and west‐wide PEIS:
• Provides applicants with a clear set of actions required by each agency to build projects in designated corridors
• Provides siting options for compatible projects in designated corridors
In contrast to the west‐wide energy corridor programmatic EIS, the national interest corridor designations involve county‐specific geographic areas in the mid‐Atlantic and Southwestern United States rather than the narrow, linear areas proposed in the 11 contiguous western states under the west‐wide PEIS.
• Coordinates corridor designations across agency administrative barriers
• Coordinates agency administrative processes within corridors
• Applies Interagency Operating Procedures that would assist in preparing and evaluating ROW applications
• Offers a single point of contact for each ROW application
• Enables "tiering" from the PEIS for project‐specific environmental review
• Focuses project planning data collection and project‐specific engineering on issues specific to the proposed project and the associated within‐corridor ROW and not on alternative locations
These benefits could expedite the application, authorization, and construction of energy transport projects. DOTs would also want to learn from/coordinate with a similar investigation underway,
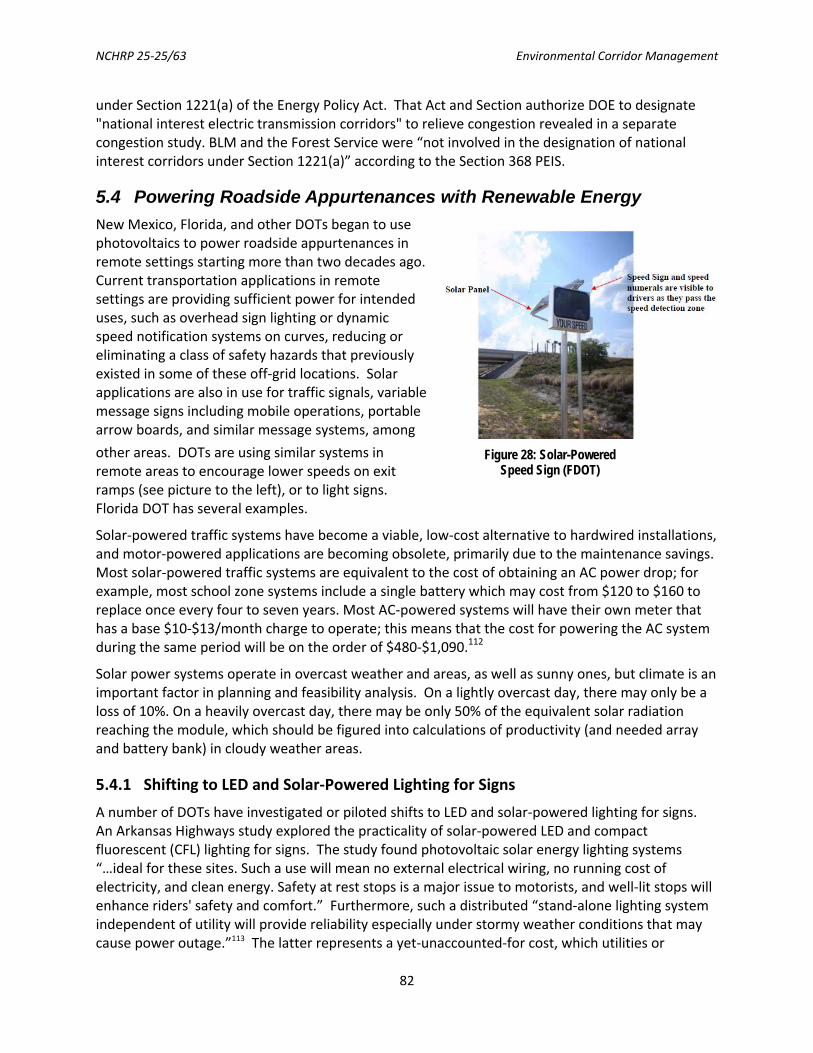
NCHRP 25‐25/63 Environmental Corridor Management
82
under Section 1221(a) of the Energy Policy Act. That Act and Section authorize DOE to designate "national interest electric transmission corridors" to relieve congestion revealed in a separate congestion study. BLM and the Forest Service were “not involved in the designation of national interest corridors under Section 1221(a)” according to the Section 368 PEIS.
5.4 Powering Roadside Appurtenances with Renewable Energy New Mexico, Florida, and other DOTs began to use photovoltaics to power roadside appurtenances in remote settings starting more than two decades ago. Current transportation applications in remote settings are providing sufficient power for intended uses, such as overhead sign lighting or dynamic speed notification systems on curves, reducing or eliminating a class of safety hazards that previously existed in some of these off‐grid locations. Solar applications are also in use for traffic signals, variable message signs including mobile operations, portable arrow boards, and similar message systems, among
other areas. DOTs are using similar systems in remote areas to encourage lower speeds on exit ramps (see picture to the left), or to light signs. Florida DOT has several examples.
Solar‐powered traffic systems have become a viable, low‐cost alternative to hardwired installations, and motor‐powered applications are becoming obsolete, primarily due to the maintenance savings. Most solar‐powered traffic systems are equivalent to the cost of obtaining an AC power drop; for example, most school zone systems include a single battery which may cost from $120 to $160 to replace once every four to seven years. Most AC‐powered systems will have their own meter that has a base $10‐$13/month charge to operate; this means that the cost for powering the AC system during the same period will be on the order of $480‐$1,090.112
Solar power systems operate in overcast weather and areas, as well as sunny ones, but climate is an important factor in planning and feasibility analysis. On a lightly overcast day, there may only be a loss of 10%. On a heavily overcast day, there may be only 50% of the equivalent solar radiation reaching the module, which should be figured into calculations of productivity (and needed array and battery bank) in cloudy weather areas.
5.4.1 Shifting to LED and Solar‐Powered Lighting for Signs
A number of DOTs have investigated or piloted shifts to LED and solar‐powered lighting for signs. An Arkansas Highways study explored the practicality of solar‐powered LED and compact fluorescent (CFL) lighting for signs. The study found photovoltaic solar energy lighting systems “…ideal for these sites. Such a use will mean no external electrical wiring, no running cost of electricity, and clean energy. Safety at rest stops is a major issue to motorists, and well‐lit stops will enhance riders' safety and comfort.” Furthermore, such a distributed “stand‐alone lighting system independent of utility will provide reliability especially under stormy weather conditions that may cause power outage.”113 The latter represents a yet‐unaccounted‐for cost, which utilities or
Figure 28: Solar-Powered Speed Sign (FDOT)

NCHRP 25‐25/63 Environmental Corridor Management
83
insurance companies may be able to help estimate. While safety is the most critical to the DOT’s mission, costs of these urgent repairs also rise and utility poles have been known to be in scarce supply after major and widespread storm events. Given that storm events are increasing in frequency due to climate change, solar‐ and wind‐powered lighting systems may be an adaptation solution for DOTs, assuming they can be made adequately storm‐proof.
The Arkansas Highways study compared solar‐powered CFL and LED lighting. Commercial CFL lights are AC‐powered. For DC operation with photovoltaic energy, a new inverter design was implemented that has better than 95% efficiency and total harmonic distortion (THD) less than 15%. The design incorporates Sealed Lead Acid batteries for energy storage. The inverter is essential when hybrid operation (AC line as well as solar) is desired. When stand‐alone solar power is used, the CFL lights can be directly operated from a DC source, thus eliminating the need for an inverter.114 CFL lighting for overhead signs has the advantage that light is uniformly distributed, while LED lights are directional
Some leading states are eliminating the need for linking to the grid altogether, for sign lighting. For stand‐alone solar application, the implementation hardware is simpler for LED compared to CFL.115 The researcher concluded that LED systems may have additional efficiencies illuminating smaller signs, while the more uniform light distribution of CFLs could be an advantage with illuminating larger signs.
A spreadsheet‐based Solar Calculator program can be used to determine whether or not a particular internally illuminated, photovoltaic device, programmed for night application, is likely to posses the power management needs of a given location. The Solar Calculator synthesizes weather and sunlight patterns for any given location, determines how well a particular device will perform under the simulated weather conditions, and displays the results in interactive figures. When used in coordination with a GIS, device performance can be displayed over a region, allowing the user to determine exactly where a particular device should and should not be applied.116
5.4.2 LED Luminaires
Continuing improvements in solar module and LED technology are decreasing system costs, which already produce savings in labor costs and travel expenses for DOT maintenance. Batteries cost substantially more yet appreciably reduce maintenance during the life of the system. LED lamps have become less expensive over the years and have replaced incandescent light sources for most solar beacon systems. Individual LED elements have a rated life of 75,000‐100,000 hours which translates into 8‐11 years of continuous, generally reliable operation. Most DC lamps use a simple regulator circuit to maintain the optical output of the lamps and have lower failure rates for their circuitry than far more complex AC lamps.
DOT lighting experts in the U.S. are currently split over LED lighting and performance. First, LED bulbs are not lasting as long as they should in some cases, not only raising questions about bulb

NCHRP 25‐25/63 Environmental Corridor Management
84
defects, but also casting aspersion on the technology as well. And while LED white light may require less intensity to provide adequate illumination for the roadway user, there are questions whether the current LED technology can provide the required intensity per fixture or what the consequences may be in terms of driver performance. Gibbons et al (2009) showed in an Anchorage, Alaska, study that drivers prefer and feel they see better in broader spectrum light, even when it is actually dimmer (Gibbons, 2009). 117 Roadway lighting and its importance are influenced by lamp color, road surface luminance, glare and observer age, among other factors. Several LED designs have come under scrutiny for failing to provide claimed illuminating ability; one finding of a DOE test is that light output dropped by over 20% as the fixtures warmed up after about two hours.118 Various LED related standards are being developed to guide fixture manufacturers to better quantify the characteristics of new fixtures.
Nevertheless, some transportation agencies have forged ahead; Caltrans developed LED roadway lighting system performance specs and is anticipating energy reductions in the range of 30%, based on 2 years of LED fixture testing on State‐owned bridges and intersections.
Allan (2007) cites DOE research that use of LEDs and/or other solid state sources across the U.S., where it has been shown to be profitable, would cut the nation's demand for electricity by more than 10%, translating into a $17 billion savings in energy costs and pollution reduction of 202 million metric tons of carbon dioxide‐the equivalent of taking 15 million cars off the road.119 Efficiency improvements are continuing, both for solar and LED technology. Induction roadway sign lighting systems have replaced mercury vapor fixtures, improving the quality of light and reducing energy consumption around 40%.
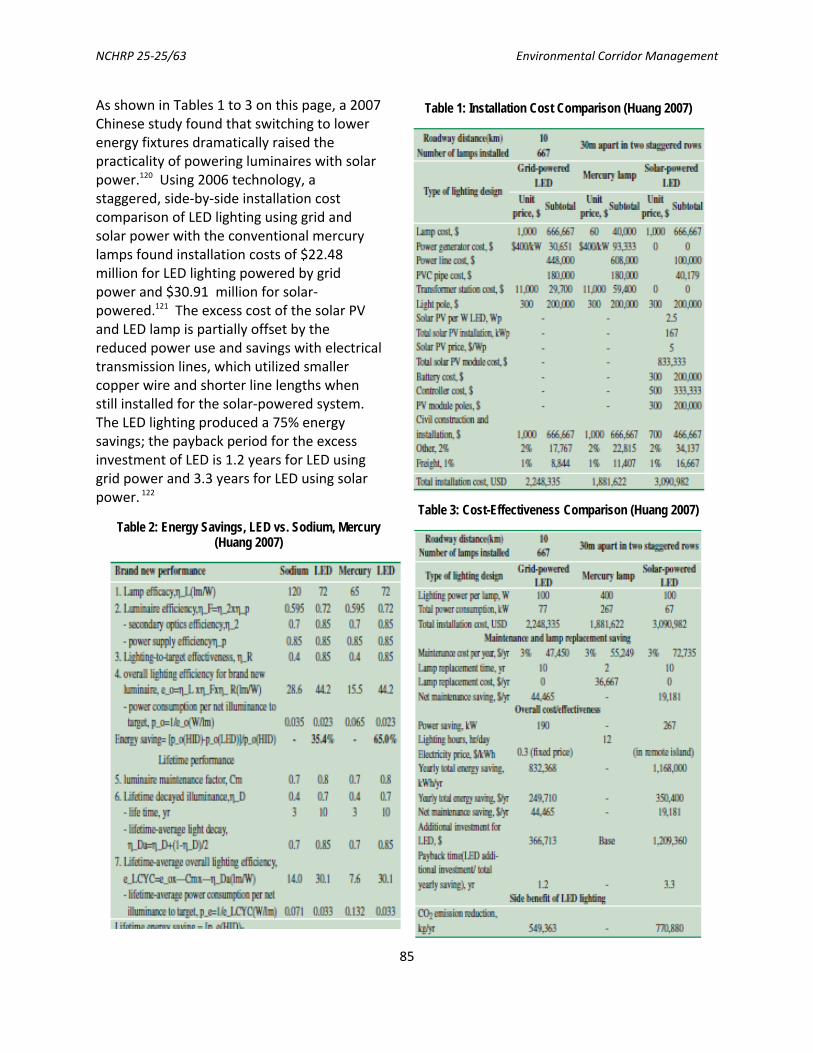
NCHRP 25‐25/63 Environmental Corridor Management
85
Table 1: Installation Cost Comparison (Huang 2007)
Table 3: Cost-Effectiveness Comparison (Huang 2007)
Table 2: Energy Savings, LED vs. Sodium, Mercury (Huang 2007)
As shown in Tables 1 to 3 on this page, a 2007 Chinese study found that switching to lower energy fixtures dramatically raised the practicality of powering luminaires with solar power.120 Using 2006 technology, a staggered, side‐by‐side installation cost comparison of LED lighting using grid and solar power with the conventional mercury lamps found installation costs of $22.48 million for LED lighting powered by grid power and $30.91 million for solar‐powered.121 The excess cost of the solar PV and LED lamp is partially offset by the reduced power use and savings with electrical transmission lines, which utilized smaller copper wire and shorter line lengths when still installed for the solar‐powered system. The LED lighting produced a 75% energy savings; the payback period for the excess investment of LED is 1.2 years for LED using grid power and 3.3 years for LED using solar power. 122

NCHRP 25‐25/63 Environmental Corridor Management
86
DOTs have also accomplished lighting efficiency increases in other ways. Metal halide discharge lamps with ceramic arc tubes led to a new generation of efficient light sources with high color rendering indices (CRI) and predicted drops in energy utilization by a factor of two, accompanied by lower overall maintenance costs.123 NJDOT engaged a research team to provide the DOT with the field verification on two key issues: visibility and color rendering, which are implemented on sodium and white light sources, and the life cycle cost analysis (LCCA) on newer technologies, the introduced technologies and compared to current lamps used in street lighting (High Pressure Sodium). Based on the research, white light sources demonstrated superior light quality. QL, Icetron, Restrike HPS, and LEDs were all shown to be equivalent or superior in light quality based on Lumen Effective Multiplier (LEM). Also, based on the LCCA the QL, Icetron, Restrike HPS, and LEDs had superior cost savings. At the time of the study, light distribution specifications were being revised on a national level, which led the research team to hold off on recommending some technologies.124
New York City is testing LED luminaires with lower maintenance costs, lower waste disposal, low UV‐radiation effects, low power consumption, and better color rendition. LED drivers are mounted within a compartment at the base of the pole, which offers time, cost, and maintenance saving advantages.125
The City estimates that for each pole and light source that is replaced, the payback period for the city will be two to three years. Not only will the city reduce its power usage 25 to 30%, but the bulbs will last 50,000 to 70,000 hours compared to 24,000 for today’s sodium lamps.126 The LED life rating actually means that the bulb will drop below 70% of its original brightness after 50,000 hours or so.
5.4.3 Replacing Signals with LEDs
WSDOT has already converted 90% of the signals they maintain (approximately 1000 signals) to LEDs. Caltrans is also switching existing 12‐inch signal head lights from incandescent to LED. Caltrans estimates that their LED installations as of 2004 were saving 78 million KWh per year.127 Caltrans LED traffic signal upgrade effort will reduce signal grid demands by 92%. Caltrans found that LEDs in traffic signal lamps offered an important side benefit; upgrading traffic signal lamps from high wattage incandescent lamps to extremely low wattage LED fixtures allowed for battery backup systems to be installed for intersection operation during power disruptions, thus reducing interruptions to the flow of the State’s roadway system and producing ancillary safety, mobility, fuel, GHG emissions, and air toxic reduction benefits.
5.4.4 Highly Retroreflective Sheeting Eliminates Need for Sign Lighting
For overhead sign lighting, compact fluorescents have the advantage of uniform distribution of light while LED emitted lights are directional (as shown with the NYC luminaire on preceding page). But
Figure 29: Directional Lighting with LEDs
Figure 30: New York City is Testing LED Lights
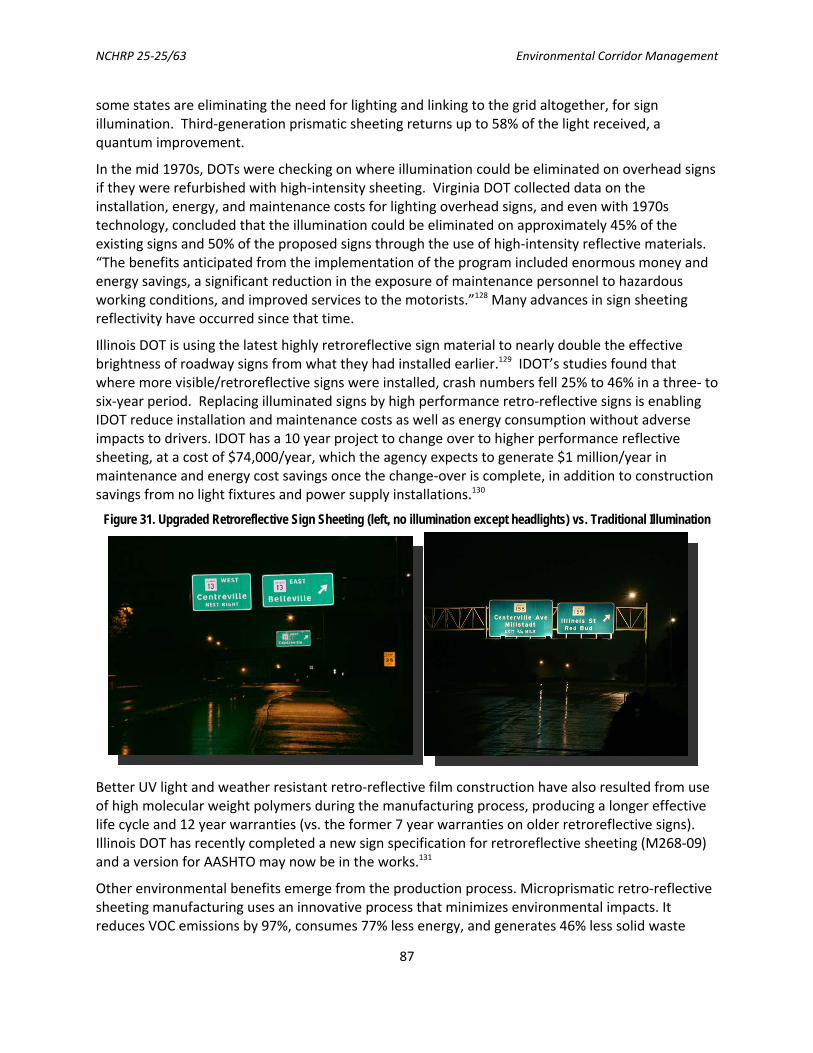
NCHRP 25‐25/63 Environmental Corridor Management
87
some states are eliminating the need for lighting and linking to the grid altogether, for sign illumination. Third‐generation prismatic sheeting returns up to 58% of the light received, a quantum improvement.
In the mid 1970s, DOTs were checking on where illumination could be eliminated on overhead signs if they were refurbished with high‐intensity sheeting. Virginia DOT collected data on the installation, energy, and maintenance costs for lighting overhead signs, and even with 1970s technology, concluded that the illumination could be eliminated on approximately 45% of the existing signs and 50% of the proposed signs through the use of high‐intensity reflective materials. “The benefits anticipated from the implementation of the program included enormous money and energy savings, a significant reduction in the exposure of maintenance personnel to hazardous working conditions, and improved services to the motorists.”128 Many advances in sign sheeting reflectivity have occurred since that time.
Illinois DOT is using the latest highly retroreflective sign material to nearly double the effective brightness of roadway signs from what they had installed earlier.129 IDOT’s studies found that where more visible/retroreflective signs were installed, crash numbers fell 25% to 46% in a three‐ to six‐year period. Replacing illuminated signs by high performance retro‐reflective signs is enabling IDOT reduce installation and maintenance costs as well as energy consumption without adverse impacts to drivers. IDOT has a 10 year project to change over to higher performance reflective sheeting, at a cost of $74,000/year, which the agency expects to generate $1 million/year in maintenance and energy cost savings once the change‐over is complete, in addition to construction savings from no light fixtures and power supply installations.130
Figure 31. Upgraded Retroreflective Sign Sheeting (left, no illumination except headlights) vs. Traditional Illumination
Better UV light and weather resistant retro‐reflective film construction have also resulted from use of high molecular weight polymers during the manufacturing process, producing a longer effective life cycle and 12 year warranties (vs. the former 7 year warranties on older retroreflective signs). Illinois DOT has recently completed a new sign specification for retroreflective sheeting (M268‐09) and a version for AASHTO may now be in the works.131
Other environmental benefits emerge from the production process. Microprismatic retro‐reflective sheeting manufacturing uses an innovative process that minimizes environmental impacts. It reduces VOC emissions by 97%, consumes 77% less energy, and generates 46% less solid waste
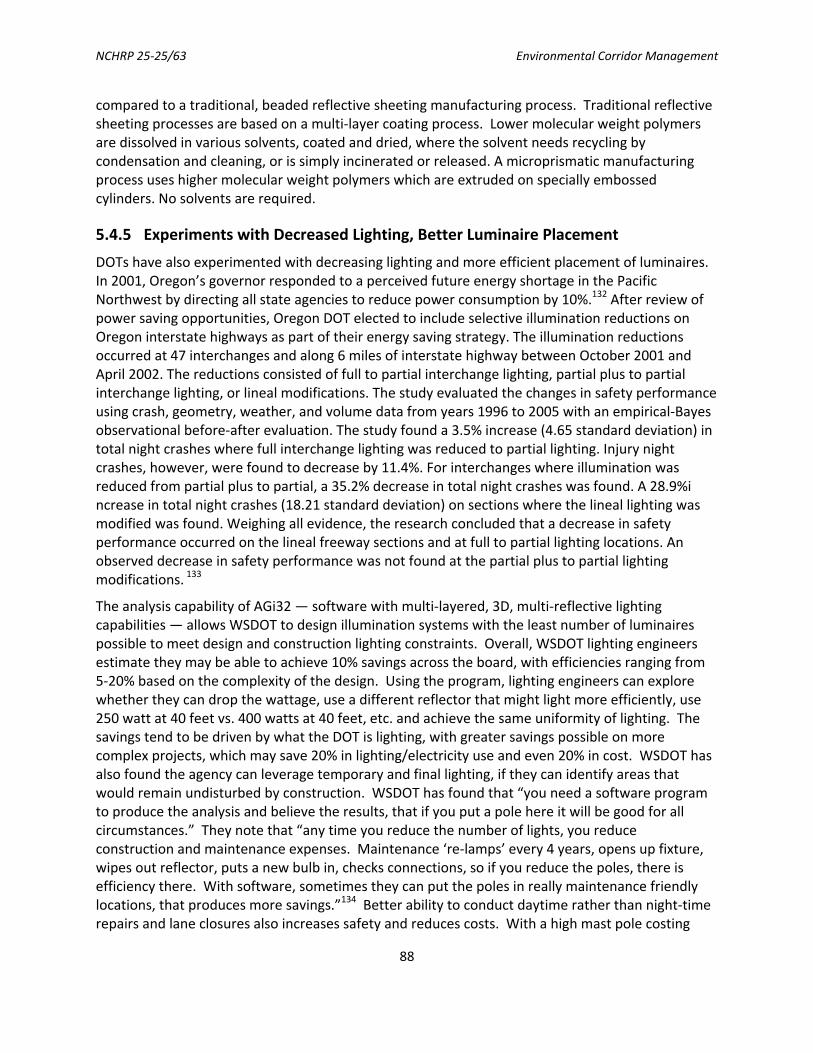
NCHRP 25‐25/63 Environmental Corridor Management
88
compared to a traditional, beaded reflective sheeting manufacturing process. Traditional reflective sheeting processes are based on a multi‐layer coating process. Lower molecular weight polymers are dissolved in various solvents, coated and dried, where the solvent needs recycling by condensation and cleaning, or is simply incinerated or released. A microprismatic manufacturing process uses higher molecular weight polymers which are extruded on specially embossed cylinders. No solvents are required.
5.4.5 Experiments with Decreased Lighting, Better Luminaire Placement
DOTs have also experimented with decreasing lighting and more efficient placement of luminaires. In 2001, Oregon’s governor responded to a perceived future energy shortage in the Pacific Northwest by directing all state agencies to reduce power consumption by 10%.132 After review of power saving opportunities, Oregon DOT elected to include selective illumination reductions on Oregon interstate highways as part of their energy saving strategy. The illumination reductions occurred at 47 interchanges and along 6 miles of interstate highway between October 2001 and April 2002. The reductions consisted of full to partial interchange lighting, partial plus to partial interchange lighting, or lineal modifications. The study evaluated the changes in safety performance using crash, geometry, weather, and volume data from years 1996 to 2005 with an empirical‐Bayes observational before‐after evaluation. The study found a 3.5% increase (4.65 standard deviation) in total night crashes where full interchange lighting was reduced to partial lighting. Injury night crashes, however, were found to decrease by 11.4%. For interchanges where illumination was reduced from partial plus to partial, a 35.2% decrease in total night crashes was found. A 28.9%i ncrease in total night crashes (18.21 standard deviation) on sections where the lineal lighting was modified was found. Weighing all evidence, the research concluded that a decrease in safety performance occurred on the lineal freeway sections and at full to partial lighting locations. An observed decrease in safety performance was not found at the partial plus to partial lighting modifications. 133
The analysis capability of AGi32 — software with multi‐layered, 3D, multi‐reflective lighting capabilities — allows WSDOT to design illumination systems with the least number of luminaires possible to meet design and construction lighting constraints. Overall, WSDOT lighting engineers estimate they may be able to achieve 10% savings across the board, with efficiencies ranging from 5‐20% based on the complexity of the design. Using the program, lighting engineers can explore whether they can drop the wattage, use a different reflector that might light more efficiently, use 250 watt at 40 feet vs. 400 watts at 40 feet, etc. and achieve the same uniformity of lighting. The savings tend to be driven by what the DOT is lighting, with greater savings possible on more complex projects, which may save 20% in lighting/electricity use and even 20% in cost. WSDOT has also found the agency can leverage temporary and final lighting, if they can identify areas that would remain undisturbed by construction. WSDOT has found that “you need a software program to produce the analysis and believe the results, that if you put a pole here it will be good for all circumstances.” They note that “any time you reduce the number of lights, you reduce construction and maintenance expenses. Maintenance ‘re‐lamps’ every 4 years, opens up fixture, wipes out reflector, puts a new bulb in, checks connections, so if you reduce the poles, there is efficiency there. With software, sometimes they can put the poles in really maintenance friendly locations, that produces more savings.”134 Better ability to conduct daytime rather than night‐time repairs and lane closures also increases safety and reduces costs. With a high mast pole costing
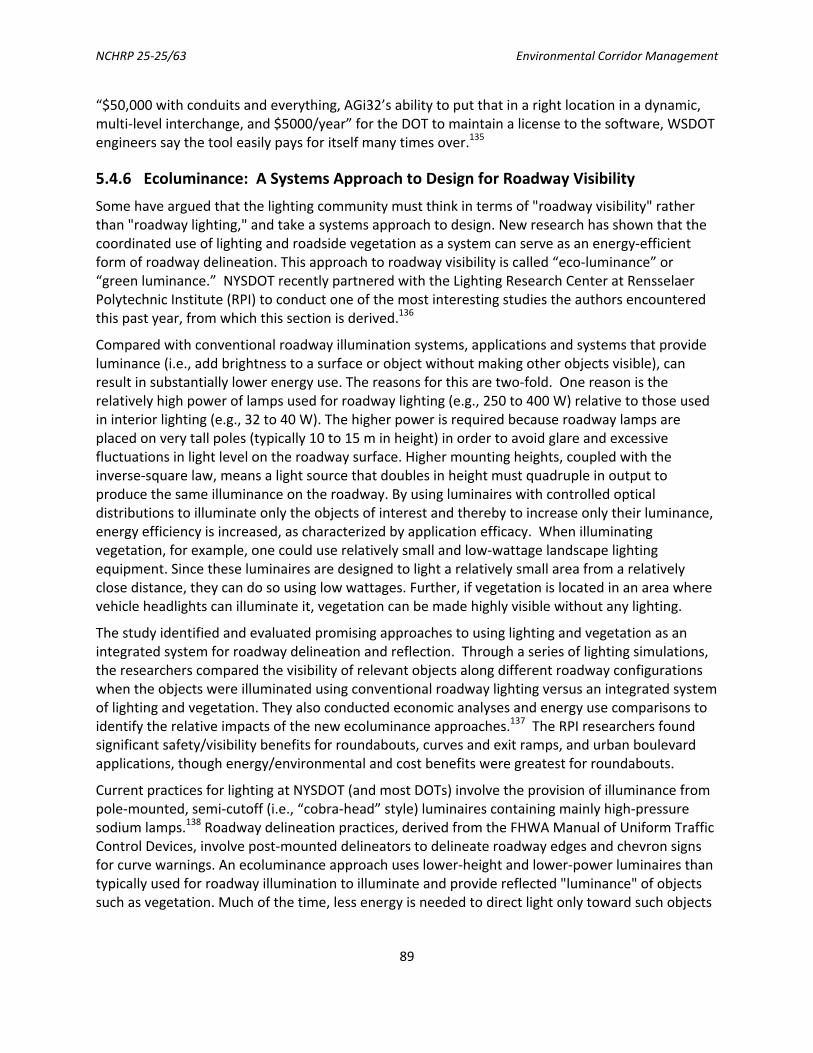
NCHRP 25‐25/63 Environmental Corridor Management
89
“$50,000 with conduits and everything, AGi32’s ability to put that in a right location in a dynamic, multi‐level interchange, and $5000/year” for the DOT to maintain a license to the software, WSDOT engineers say the tool easily pays for itself many times over.135
5.4.6 Ecoluminance: A Systems Approach to Design for Roadway Visibility
Some have argued that the lighting community must think in terms of "roadway visibility" rather than "roadway lighting," and take a systems approach to design. New research has shown that the coordinated use of lighting and roadside vegetation as a system can serve as an energy‐efficient form of roadway delineation. This approach to roadway visibility is called “eco‐luminance” or “green luminance.” NYSDOT recently partnered with the Lighting Research Center at Rensselaer Polytechnic Institute (RPI) to conduct one of the most interesting studies the authors encountered this past year, from which this section is derived.136
Compared with conventional roadway illumination systems, applications and systems that provide luminance (i.e., add brightness to a surface or object without making other objects visible), can result in substantially lower energy use. The reasons for this are two‐fold. One reason is the relatively high power of lamps used for roadway lighting (e.g., 250 to 400 W) relative to those used in interior lighting (e.g., 32 to 40 W). The higher power is required because roadway lamps are placed on very tall poles (typically 10 to 15 m in height) in order to avoid glare and excessive fluctuations in light level on the roadway surface. Higher mounting heights, coupled with the inverse‐square law, means a light source that doubles in height must quadruple in output to produce the same illuminance on the roadway. By using luminaires with controlled optical distributions to illuminate only the objects of interest and thereby to increase only their luminance, energy efficiency is increased, as characterized by application efficacy. When illuminating vegetation, for example, one could use relatively small and low‐wattage landscape lighting equipment. Since these luminaires are designed to light a relatively small area from a relatively close distance, they can do so using low wattages. Further, if vegetation is located in an area where vehicle headlights can illuminate it, vegetation can be made highly visible without any lighting.
The study identified and evaluated promising approaches to using lighting and vegetation as an integrated system for roadway delineation and reflection. Through a series of lighting simulations, the researchers compared the visibility of relevant objects along different roadway configurations when the objects were illuminated using conventional roadway lighting versus an integrated system of lighting and vegetation. They also conducted economic analyses and energy use comparisons to identify the relative impacts of the new ecoluminance approaches.137 The RPI researchers found significant safety/visibility benefits for roundabouts, curves and exit ramps, and urban boulevard applications, though energy/environmental and cost benefits were greatest for roundabouts.
Current practices for lighting at NYSDOT (and most DOTs) involve the provision of illuminance from pole‐mounted, semi‐cutoff (i.e., “cobra‐head” style) luminaires containing mainly high‐pressure sodium lamps.138 Roadway delineation practices, derived from the FHWA Manual of Uniform Traffic Control Devices, involve post‐mounted delineators to delineate roadway edges and chevron signs for curve warnings. An ecoluminance approach uses lower‐height and lower‐power luminaires than typically used for roadway illumination to illuminate and provide reflected "luminance" of objects such as vegetation. Much of the time, less energy is needed to direct light only toward such objects
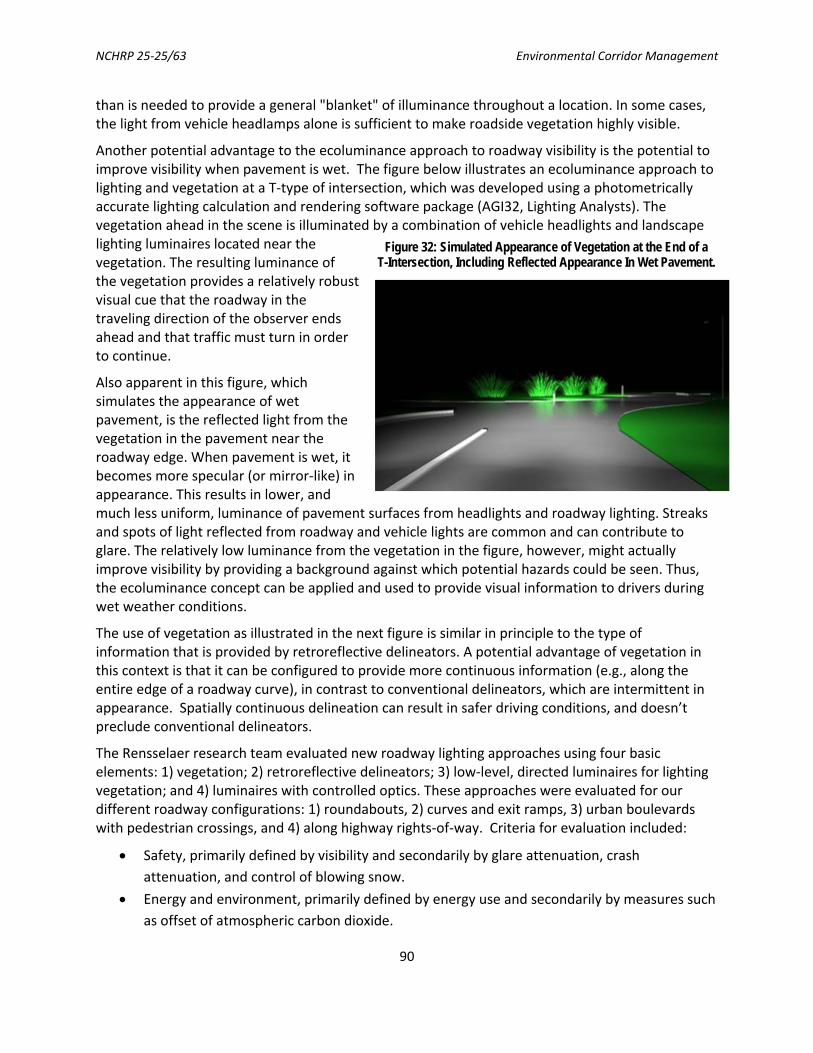
NCHRP 25‐25/63 Environmental Corridor Management
90
than is needed to provide a general "blanket" of illuminance throughout a location. In some cases, the light from vehicle headlamps alone is sufficient to make roadside vegetation highly visible.
Another potential advantage to the ecoluminance approach to roadway visibility is the potential to improve visibility when pavement is wet. The figure below illustrates an ecoluminance approach to lighting and vegetation at a T‐type of intersection, which was developed using a photometrically accurate lighting calculation and rendering software package (AGI32, Lighting Analysts). The vegetation ahead in the scene is illuminated by a combination of vehicle headlights and landscape lighting luminaires located near the vegetation. The resulting luminance of the vegetation provides a relatively robust visual cue that the roadway in the traveling direction of the observer ends ahead and that traffic must turn in order to continue.
Also apparent in this figure, which simulates the appearance of wet pavement, is the reflected light from the vegetation in the pavement near the roadway edge. When pavement is wet, it becomes more specular (or mirror‐like) in appearance. This results in lower, and much less uniform, luminance of pavement surfaces from headlights and roadway lighting. Streaks and spots of light reflected from roadway and vehicle lights are common and can contribute to glare. The relatively low luminance from the vegetation in the figure, however, might actually improve visibility by providing a background against which potential hazards could be seen. Thus, the ecoluminance concept can be applied and used to provide visual information to drivers during wet weather conditions.
The use of vegetation as illustrated in the next figure is similar in principle to the type of information that is provided by retroreflective delineators. A potential advantage of vegetation in this context is that it can be configured to provide more continuous information (e.g., along the entire edge of a roadway curve), in contrast to conventional delineators, which are intermittent in appearance. Spatially continuous delineation can result in safer driving conditions, and doesn’t preclude conventional delineators.
The Rensselaer research team evaluated new roadway lighting approaches using four basic elements: 1) vegetation; 2) retroreflective delineators; 3) low‐level, directed luminaires for lighting vegetation; and 4) luminaires with controlled optics. These approaches were evaluated for our different roadway configurations: 1) roundabouts, 2) curves and exit ramps, 3) urban boulevards with pedestrian crossings, and 4) along highway rights‐of‐way. Criteria for evaluation included:
• Safety, primarily defined by visibility and secondarily by glare attenuation, crash attenuation, and control of blowing snow.
• Energy and environment, primarily defined by energy use and secondarily by measures such as offset of atmospheric carbon dioxide.
Figure 32: Simulated Appearance of Vegetation at the End of a T-Intersection, Including Reflected Appearance In Wet Pavement.

NCHRP 25‐25/63 Environmental Corridor Management
91
• Economics, primarily defined by operating and maintenance costs.
• Appearance, defined by aesthetics and by communicating environmental priority to drivers.
Figure 33: Curved Exit Ramp Appearance with Vegetation (left) vs. Landscape Lighting (5 W) (right)
Regarding both the energy/environmental criteria and the economics/cost criteria, the results of the evaluation suggested that, for roundabouts, the ecoluminance approach can result in lower energy use (and less associated carbon emissions) and have a lower initial cost, operation cost, and maintenance cost than conventional lighting.
As curves and exit ramps often do not have lighting, the net result of an ecoluminance approach could be an increase in electricity use and operating costs. Using an ecoluminance approach for urban boulevards would entail similar electricity use and operating costs as the conventional approach. However, research is occurring in other states, by New Jersey DOT for example, on the use of bollard‐level lights along crosswalks, which could provide a daytime visual element as well as efficient production of vertical illuminance on pedestrians in crosswalks, appropriate for ecoluminance applications. Such systems tended to reduce operating costs because of smaller luminaires and reduced wattages.
Present NYSDOT requirements for lighting roundabouts call for a large number of pole‐mounted luminaires to provide illuminance throughout the location. In contrast, an ecoluminance approach would feature vegetation in combination with optically controlled, low‐mounted luminaires for providing light along the roundabout and pedestrian crosswalks. The contrast (and resulting RVP values) of vegetation and of a pedestrian target in an adjacent crosswalk was higher under the ecoluminance lighting system even though the overall energy use was reduced by more than two‐thirds. Operational costs were also about 30% lower.
Along an exit ramp curve, merely planting vegetation along the outer edge of the curve provided a substantial and highly visible visual barrier. Lighting of vegetation had small visual performance improvements. Such vegetation barriers were estimated to provide an increased maximum safe approach angle (the angle at which a vehicle leaving the road might be able to be deflected back onto the road, rather than continuing off the roadway edge) by about 1 degree. Vegetation alone might reduce mowing if low‐maintenance plant materials can be identified. However, as most of these types of curves are currently unlighted, any addition of electric lighting would increase maintenance and operating costs.

NCHRP 25‐25/63 Environmental Corridor Management
92
The primary tool for evaluating safety/visibility was through photometrically accurate simulations of lighting and light levels in and along a roadway scene. Such simulations can also provide "photorealistic" images of roadway scenes that can provide some sense of appearance (e.g., during conditions of wet pavement) in addition to containing accurate underlying data on light levels. From photometric simulations, it is possible to calculate the visibility using the Relative Visual Performance (RVP) model, which expresses visibility of an object as a function of its luminance (brightness), contrast against its background, and size. Once an object is highly visible, increasing light level, or increasing its contrast or size will not improve visibility much further, providing a basis for upper limits on light levels (and resulting energy use).
There is little direct evidence linking improved visibility to reduced crashes at night, despite the logical connection between them. However, ongoing research at RPI’s Lighting Research Center for NCHRP has found that there are strong correlations between visibility improvements (characterized through RVP) and crash reductions. Statistical modeling from the NCHRP study has shown that the nighttime crash reduction associated with lighting may be closer to 10% than to the value of 30% that is often associated with roadway lighting. This finding has implications for benefit‐cost analyses supporting the use of lighting, including lighting schemes based on ecoluminance.
Implementing Ecoluminance Solutions
Cognizant that a nearly infinite number of combinations of lighting equipment could be used to create visual effects, the RPI researchers proposed a limited set of equipment and materials for use in ecoluminance solutions. These include:
• Vegetation species suitable for use in the local region.
• Retroreflective delineators.
• Small, low‐wattage luminaires designed to focus light toward vegetation to produce luminance.
• Luminaires with controlled optical systems for providing localized illuminance at locations such as crosswalks or vehicle merge/diverge areas where visibility of possible hazards is important.
Use and performance of these elements are discussed in the following overview. Ecoluminance solutions have the potential to increase visibility, reduce energy usage, and even trap snow.
Retroreflective delineators are represented in orange, luminance‐producing lighting systems are shown in bright green, illuminance‐producing lighting systems are in cyan.
For (a) roundabout application vegetation in the central portion of the roundabout can serve a delineation function to identify the inner edge of the roadway beyond which traffic should not proceed, and might also serve to reduce glare from oncoming traffic at the opposite end of the roundabout. Low level landscape luminaires could illuminate the vegetation to increase its luminance if vehicle headlights were not sufficient, and illumination of the travel lanes within the roundabout would be accomplished using cutoff‐type luminaires, providing directional illumination that makes objects in the travel lanes appear brighter than their surrounding backgrounds. Cutoff optics for these luminaires would be important in order to avoid glare.
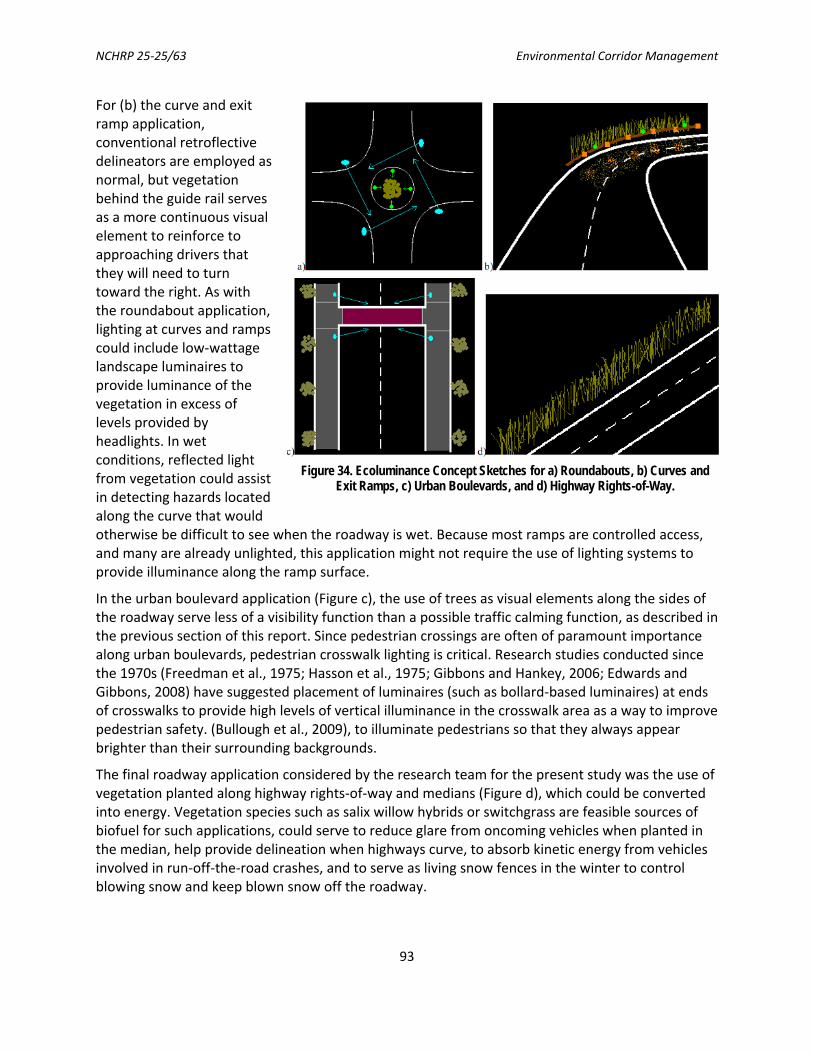
NCHRP 25‐25/63 Environmental Corridor Management
93
For (b) the curve and exit ramp application, conventional retroflective delineators are employed as normal, but vegetation behind the guide rail serves as a more continuous visual element to reinforce to approaching drivers that they will need to turn toward the right. As with the roundabout application, lighting at curves and ramps could include low‐wattage landscape luminaires to provide luminance of the vegetation in excess of levels provided by headlights. In wet conditions, reflected light from vegetation could assist in detecting hazards located along the curve that would otherwise be difficult to see when the roadway is wet. Because most ramps are controlled access, and many are already unlighted, this application might not require the use of lighting systems to provide illuminance along the ramp surface.
In the urban boulevard application (Figure c), the use of trees as visual elements along the sides of the roadway serve less of a visibility function than a possible traffic calming function, as described in the previous section of this report. Since pedestrian crossings are often of paramount importance along urban boulevards, pedestrian crosswalk lighting is critical. Research studies conducted since the 1970s (Freedman et al., 1975; Hasson et al., 1975; Gibbons and Hankey, 2006; Edwards and Gibbons, 2008) have suggested placement of luminaires (such as bollard‐based luminaires) at ends of crosswalks to provide high levels of vertical illuminance in the crosswalk area as a way to improve pedestrian safety. (Bullough et al., 2009), to illuminate pedestrians so that they always appear brighter than their surrounding backgrounds.
The final roadway application considered by the research team for the present study was the use of vegetation planted along highway rights‐of‐way and medians (Figure d), which could be converted into energy. Vegetation species such as salix willow hybrids or switchgrass are feasible sources of biofuel for such applications, could serve to reduce glare from oncoming vehicles when planted in the median, help provide delineation when highways curve, to absorb kinetic energy from vehicles involved in run‐off‐the‐road crashes, and to serve as living snow fences in the winter to control blowing snow and keep blown snow off the roadway.
Figure 34. Ecoluminance Concept Sketches for a) Roundabouts, b) Curves and Exit Ramps, c) Urban Boulevards, and d) Highway Rights-of-Way.
NCHRP 25‐25/63 Environmental Corridor Management
94
5.4.7 Exploring Growth of Biomass in the ROW
Some DOTs are exploring biomass production in the ROW. Biomass refers to using plant material to make electricity or fuels. The primary ways to use biomass for energy are: 139
• Corn Ethanol. Food crops such as corn and sugar cane are used to produce ethanol. More generally, microorganisms and enzymes are used to ferment sugars or starches to produce alcohols.
• Cellulosic Ethanol. Non‐food crops such as switchgrass and wood are used to produce ethanol. Microorganisms or enzymes convert cellulose into alcohols. Cellulosic ethanol will be able to use switchgrass (Burden, 2008) and miscanthus, two crops that are probably well suited for median strips, as feedstock.
• Biodiesel. Oily seeds such as soybean or sunflower are used to produce “transesterified lipids” which can be used in the same engines and boilers as diesel fuel. On a smaller scale, used vegetable oil from restaurants can be the feedstock.
• Electricity and/or Heat. Woody crops are burned in power plants or combined heat and power (CHP) plants, alone or co‐fired with coal. Combined Heat and Power and Boilers. CHP equipment is used to provide electricity on site. Waste heat is used for space or water heating. Currently, gasification CHP and direct‐combustion boilers are viable end use for willows or other woody biomass. Commercially available CHP equipment includes Community Power Corporation’s BioMax system. In another application, boilers are used to capture only the heat, but they can still be up to 90% efficient.
• Crops. Biomass crops are often divided by “generation,” but there are different systems in use, which creates some confusion. The system used by the federal government is (R. Rausch, NYS Department of Agriculture & Markets, personal communication, October 2008):
o First Generation. Biomass crops that can also be used as food for people or animals, e.g., corn for ethanol or soybean or sunflower seeds for biodiesel.
o Second Generation. Agricultural byproducts, e.g., low grade timber left from logging.
o Third Generation. Dedicated energy crops, e.g., fast growing salix willow hybrids, switchgrass, and miscanthus.
Viable end uses for roadside crops are co‐firing at power plants, cellulosic ethanol, on‐site combined heat and power (CHP), space or water heating, and pyrolysis. Other end uses such as biodiesel and corn ethanol are not viable for the crops that could grow along roads.
• Pyrolysis and Biochar. Pyrolysis is the process of heating biomass without oxygen. This process produces syngas and biochar. The syngas is then used for CHP or heating. Biochar is then buried for use as an agricultural fertilizer. Because most of the carbon in the biomass ends up in the biochar (rather than being released to the atmosphere as in combustion), this end use is carbon negative; the more energy harnessed using pyrolysis, the less carbon dioxide will be in the atmosphere.
As NYSDOT reports, first‐generation crops probably cannot be grown at highway medians. They require intensive farming practices such as irrigation, pesticides, and regular use of farm machinery, all of which are difficult to implement on highway medians. They are more sensitive to the polluted
NCHRP 25‐25/63 Environmental Corridor Management
95
runoff from the roads and require good soil to grow.140 In contrast, highway medians are designed to double as road drainage areas and are engineered for their structural strength, typically constructed of hard packed material that are then covered with a thin layer of soil and planted for erosion control. This creates one of the “poorest conditions possible to grow anything in,” and it is unlikely that corn or other first‐generation crops would grow well in these conditions.141 Third‐generation crops, on the other hand, could be grown at highway medians and might serve as ecoluminance and snow fences, as well as energy feedstocks. Nevertheless, a number of obstacles would need to be overcome including:
• Lack of irrigation.
• Exhaust and runoff pollution from roadways.
• Difficult access for farm machinery. (It would not be possible to safely drive harvesting equipment across a typical highway.)
• Safety and Regulations. Fast growing willow can grow to over 20 feet high and switchgrass can grow to over five feet high, which could restrict drivers’ views across the median strip. Potential concerns include:
o Reduced visibility of road signs.
o Reduced visibility for traffic crossing median (i.e. emergency vehicles).
o Increased risk of debris on the road after storms.
o Increased risk of wildlife/vehicle encounters.
NYSDOT figured it could demonstrate the use of biomass along roadways in two ways. First, a for‐profit business could be hired to plant and harvest switchgrass along roadways at no cost to the state in exchange for owning the biomass crop. The biomass would be sold to a co‐firing power plant. This would reduce New York’s mowing expenses (beyond 10 feet from the road). One company had already expressed a willingness to enter into such an arrangement. Second, a similar for‐profit business could be hired to plant and harvest switchgrass along highways. A New York State agency or authority could then use this biomass in a pyrolysis unit at a building facility or rest stop. The syngas produced could be used for heating or CHP. The resulting bio‐char could be used for fertilizer, such as in wetland creation. Of the techniques explored, NYSDOT found biochar to be the most promising in the short term. Forest growth was deemed unrealistic on a highway median, and it acts as a carbon sink only during the initial growth phase. Soil sequestration was thought to be more appropriate for farms than highway medians.
5.4.8 Carbon Sequestration
In July 2008, FHWA initiated a program to explore the feasibility of state DOTs reducing and sequestering greenhouse gas (GHG) emissions in vegetation within highway ROW. Under the pilot program, NMDOT is undertaking a four‐year, $2 million research project to quantify the amount of atmospheric carbon that grasslands along highway ROW can sequester. The protocol that will result should be applicable to DOTs nationwide, an important consideration since part of the pilot program’s success centers on the DOT’s ability to measure then divest the carbon captured. Options for divestiture are: (1) selling carbon credits on an appropriate GHG market or registry for revenue, (2) using carbon credits to offset the DOT’s emissions, or (3) using the credits toward meeting statewide objectives. The university partner’s foray into the area revealed that information thought

NCHRP 25‐25/63 Environmental Corridor Management
96
to exist on carbon sequestration protocols for grasslands that are not grazed are not available and that it would be necessary to determine how to supplement the maintenance and operations records that are currently kept. Furthermore, reducing emissions through modified management practices could contribute more to meeting GHG goals than carbon sequestration. It is important to implement ecologically‐sound land management practices holistically (e.g., planting climate‐ and season‐appropriate seed species statewide), as sequestering carbon in one region does not permit deficient land management practices in another. Also, improved vegetation management can result in benefits independent of carbon sequestration. Examples include reduced soil erosion due to increased vegetation, and lessened fuel consumption and emissions releases resulting from reduced mowing frequency and intensity. Finally, there are questions as to what rights a DOT has within the easements it has with federal partners when the DOT does not own the land.142
NYSDOT figured that PV panels would provide an alternative method of harvesting energy on median strips that would avoid all the farming, market, safety, and environmental issues faced by biomass. If a 4 m wide array of PV panels were installed along the entire length of the NY Thruway system, it would generate about 500 million kWh per year, based on a length of 798 km, solar radiation of about 3.6 kWh/m2 /day, and PV efficiency of 12% ‐ about 0.3% of the state's annual electricity use. Carbon sinks were also explored. Salix Willow Hybrid (fast growing willow) would serve as the most effective carbon sink because it makes available the most carbon for sequestering.
5.5 Increased Energy Efficiencies from Operations Operating efficiently means taking steps to smooth‐out traffic flow and avoid or reduce situations that constrict road capacity. Collisions account for at least 25% of traffic backups, so making roads safer goes a long way toward easing congestion, which in turn can reduce fuel usage, if the more open road doesn’t attract more drivers to the corridor. Technology, such as driver information signs, enables DOTs to react quickly to unforeseen traffic fluctuations. Among the tools that provide this efficiency are metered freeway on‐ramps, incident response teams, variable speed‐limit systems, variable tolling and integrated traffic signals. NCHRP 25‐25/58, Methods to Address Greenhouse Gas Emissions from Transportation Construction/Maintenance/Operations Activities, developed a calculator to estimate the impact of operational strategies on CO2 emissions. The main input variables are before and after travel speeds, from which energy emission impacts may be calculated for such operations strategies.
States and municipalities have discovered that operations can yield substantial improvements that ultimately save resources (avoided capital investments) as well as energy. A number of these operational efficiencies are discussed starting on p. 21 of this guide; however, signal timing is one that is notable for the energy it saves and will be discussed here.
FHWA’s Recommendations for Regional Transportation Operations Collaboration
• Resource integration, allocation, and management.
• Information documentation and exchange.
• Equipment sharing.
• Pooled funding.
• Personnel training, development, and integration.
• Systems integration.
• Institutional integration.
NCHRP 25‐25/63 Environmental Corridor Management
97
5.5.1 Signal Timing
Traffic signals are an ubiquitous part of the transportation system that garner little attention when compared to the congestion and operational issues that surround freeways and highways. Traffic signals have significant impacts on mobility, congestion, fuel consumption and climate change, and the “D” grade on the 2007 National Traffic Signal Report Card indicates that there is much room for improvement.143 About 80% of signals are managed on the local level, with a significant percentage of these responsible for fewer than 50 traffic signals and unlikely to have staff with a proficient level of technical expertise to effectively manage and operate traffic signals.144 This becomes even more problematic in an environment where little documentation and training resources exist to guide these activities. However, approximately 20% are managed on the state level, and DOTs are finding that they can extract some major efficiencies from improvements in this area. City, metro, and state agencies are recommended to pool resources on a regional level, as indicated in the box to the right.
Signal timing, in which traffic light signals are timed and phased to reduce congestion, has been shown to generate a 40:1 benefit cost ratio on improved signal timing projects, in addition to reductions in emissions and fuel usage. Studies of fuel savings estimates range from 1 to 9%. MoDOT reported averaging over 10,000 kg/year in pollutant reductions per urban signal retiming. WSDOT reported on a before and after analysis of signal timing; two representative signal coordination projects on SR 525 and SR 104 reduced vehicle hours of delay by 130 hours a day and 121 hours a day respectively.145 When WSDOT converted existing traffic signal systems to 2070 controllers and coordinated traffic signal systems in congested areas, they reduced average vehicle delays by 1 second and saved 12,261 metric tons of CO2.146
Like many other areas of transportation work, active signal management is the outcome of supporting the people, process, and programs that manage, operate, and maintain the system. This requires establishing specific and measurable objectives, which can often address the environment, mobility, and safety in integrated fashion.
• The Maryland State Highway Administration (SHA) has created a business‐style model for maintaining their traffic signal operations, setting yearly goals for the number of retimed traffic signals and corridors. The SHA's focus objective of "mobility" across the transportation system allowed for a focus on reducing delay on the state arterials. Additionally, it quantified environmental measures such as reduction in fuel consumption and emissions, arterial through‐put, and evaluated crash histories along the corridor. Currently, SHA sets an annual goal of retiming 400 intersections to reduce delay. With this annual goal, SHA can gauge how effective it was on completing the scheduled corridors. SHA also realize that the goal is relative and cannot always be met since the percent of delay reduction will have diminishing returns as corridors continue to be re‐timed over time. Due to the diminishing returns, a future goal for the agency is to collect data on select corridors each year within the state to monitor the change in traffic patterns and volumes in order to better prioritize resource allocation to areas of significant growth. With this type of data, SHA staff will be able to determine if a corridor or intersection in the area requires updates. Understanding that it would not make sense to update signal timing in an area if there has not been much change, SHA could reallocate resources to other corridors. 147

NCHRP 25‐25/63 Environmental Corridor Management
98
• Caltrans Adaptive Traffic Control Systems ‐ Traffic signal systems that respond in real‐time to changes in traffic patterns are known as “adaptive.” They belong to the latest generation of signalized intersection control. Caltrans recently implemented Adaptive Traffic Control Systems (ATCSs) in Los Angeles County, where ATCSs have been installed on seven corridors. ATCSs continuously detect vehicular traffic volume, compute “optimal” signal timings based on this detected volume and simultaneously implement them. Reacting to these volume variations generally results in reduced delays, shorter queues and decreased travel times. ATCSs are designed to overcome the limitations of pre‐timed control and respond to changes in traffic flow by adjusting signal timings in accordance with fluctuations in traffic demand. Caltrans’ demonstration project is evaluating the effectiveness of the future ATCS on the State arterial street network that experiences both everyday and unpredictable changes in traffic flow. The ATCS system was shown to reduce travel time by 12.7%, reduce average stops by 31%, and decrease average delays by 21.4%.148
• Portland Metro region. The American Recovery and Reinvestment Act of 2009 provided an opportunity for agencies to receive federal funding to provide a stimulus to the U.S. economy. By combining the requests across multiple agencies, the Portland‐metropolitan region submitted an application for a regional arterial traffic control enhancement project to improve 277 intersections with upgrades to the signal controller hardware and software, communication, and signal timing. The project was a significant joint effort from the region to improve traffic signal management and operations. The project was an outcome of a regional Transportation System Maintenance and Operations plan that identified strategic investments for improving traffic signal operations. 149
• Kansas City, MO/MARC. Twenty‐two partner cities and agencies worked together on Operation Greenlight, a multi‐year program managed by the Mid‐America Regional Council to upgrade traffic signal systems throughout their metropolitan area. The major projects included signal system integration, field communication upgrades, traffic signal controller modifications and operations, and signal retiming efforts to reduce incident response time and improve air quality. The funding for the program came from more than six different sources, which indicated a commitment to the project by the represented agencies and a regional focus for the project resulting in broad involvement. 150
• WSDOT variable speed facilities ‐ As part of WSDOT and Sound Transit’s I‐90 Two‐Way Transit and High Occupancy Vehicle (HOV) Operations project, crews installed 14 electronic speed limit signs, which will allow varying speed limits to be displayed. WSDOT expects these signs will increase safety, decrease collisions and keep traffic moving during construction on westbound I‐90 by alerting drivers to reduce their speed when backups or collisions are on the road ahead. WSDOT uses variable speed limit signs on US 2 at Steven Pass and on I‐90 at Snoqualmie Pass to alert drivers to slow down during icy, snowy and congested driving conditions. Similar signs installed on European urban roadways increased safety and decrease congestion‐related collisions by 30% or more, in turn saving energy and emissions. In the course of implementing operational improvements to detect and clear traffic incidents quickly and prevent/reduce incident‐related congestion on nine routes, WSDOT recorded a 7% reduction in length of long incidents, a significant energy, safety, and climate change benefit at a cost of only $346,000, between 2007‐09.151
NCHRP 25‐25/63 Environmental Corridor Management
99
• Model regions with practices DOTs may want to investigate include those above and: 152
o Denver, Colorado – Denver Regional Council of Governments (DRCOG)
o Las Vegas, Nevada – Regional Transportation Commission of Southern Nevada (RTC)
o Puget Sound, Washington – Puget Sound Regional Council (PSRC)
o Reno, Nevada – Washoe County Regional Transportation Commission (RTC)
o Tucson, Arizona – Pima Association of Governments (PAG)
o Los Angeles, California – Los Angeles County Metropolitan Transportation Authority (METRO)
In TEA‐21 and SAFETEA‐LU, the Federal‐aid Highway Program continued eligibility for federal funding of operating costs for traffic monitoring, management, and control systems from National Highway System and Surface Transportation Program funding. CMAQ provides funds and some innovative local models have emerged. For example, the "Transportation User Fee" (TUF) used by the City of Austin, Texas, suggests another model for per‐capita or per‐household fees collected by the MPO. Under Austin's TUF program, municipal utility bills include a TUF, which averages $30 to $40 annually for a typical household. This charge is based on the average number of daily motor vehicle trips made per property, reflecting its size and use. The city provides exemptions to residential properties with occupants that do not own or regularly use a private motor vehicle for transportation, or if the user is 65 years of age or older.
5.5.2 Using Technology to Minimize Trips & Increasing Driving Efficiency
Transportation agencies are using Global Positioning Systems (GPS) and other technologies to be more efficient with operations and maintenance activities. This efficiency not only minimizes time and dollars spent on maintenance, but also often minimizes the amount of driving needed, resulting in minimized tailpipe emissions.
• Hawaii DOT’s electronic Pavement Management Systems offers some additional functionalities to maintenance workers. The system helps maintenance workers to link trips and plan routes so that they save fuel (and money) by planning the shortest route. It also allows tracking so that utility and pavement overlay projects are coordinated and roads aren’t torn up shortly after they are laid down, minimizing maintenance cost and enhancing department image in the community.153
• Chicago DOT installed workforce management software (TimeTrack) on mobile phones used by road crew foremen. This changed how the foremen received assignments and reported progress on assignments, limiting paperwork and saving time. Time worked is recorded electronically, and job assignments are transmitted via cell phone.154
• New York State DOT Region 1 worked with their state headquarters office to give the state park agency in their area (in this case the Adirondack Park Agency) access to the DOT’s Visidata information and files to reduce the need for field trips for both Park Agency staff and personnel from Regions 1, 2 and 7. NYSDOT reduced miles driven on large dump fleet 11.6% from its three year average by changing their snow and ice patrol procedures.155 DOT have also located snow removal sites closer to roads or add more sites, to reduce distance.

NCHRP 25‐25/63 Environmental Corridor Management
100
• Arizona DOT Snow Plow Driver Training. Before and after training test runs (on a 168‐mile RT route between two maintenance yards on a winding route with many steep grades) showed a 4.5% reduction in fuel usage, in manual transmissions.
Carpooling is a lower tech way DOTs and other agencies have been working together to reduce trips to the field, to visit construction or proposed project sites. Increasing environmental analysis capabilities from GIS data can also minimize the need for some trips.
5.6 Shifting to More Efficient Fleets DOTs are shifting to more efficient vehicles and fleets, to reduce energy expenditures and contribute to fiscal and environmental sustainability, on a state level and nationally. One fleet program, the District of Columbia city government, engaged a Zipcar program of shared fleet vehicles, which users reserve and drive by the hour or by the day. Each shared fleet vehicles replaced 3 standard fleet vehicles; 70 shared fleet vehicles replaced 210 normal fleet vehicles. Each ZipCar vehicle costs about $5,000 annually to operate. A reduction of 140 vehicles equates to $700,000 annual savings. The DC FleetShare program serves the DOT and other city agencies.156
State and federal governments, as the largest consumer in the nation and a presence that extends throughout the economy, are positioned to help the national transition to more efficient vehicles, especially those with long‐term sustainability. The most recent executive order on the subject, Executive Order No. 13423, was issued by President Bush in 2007; it directed agencies with 20 or more vehicles to reduce their fleet fuel consumption by 2% annually from 2005 to 2015 (a 20% reduction). The U.S. has discovered substantial natural gas, presenting an alternative for more efficient fleets, and a wide range of plug‐in electric vehicles are also coming to market in 2010‐11.
University Transportation Centers are among those who are recently reporting and getting the word out about the efficiencies offered by electric vehicles (EVs), even as coal remains a substantial part of the electrical generation mix.157 The engines inside electric vehicles are 85‐90% efficient (only 10‐15% of energy lost to heat). In contrast, today’s cars and internal combustion engines use less than 20% of gasoline’s energy to drive the wheels of the car.158 Most of the rest is lost as waste heat. Internal combustion engines are much more powerful than required to drive the car at a constant speed, because extra power is needed for accelerating the car in a reasonable time. Since this power is not really used, except when accelerating, most of the time the engine operates inefficiently far below its capacity. Energy losses are especially acute while braking, idling, and driving at lower speeds. In a hybrid vehicle, the internal combustion engine is not connected to the wheels of the car. A smaller engine usually operates at its most efficient point and a constant speed and is used only to generate the average amount of electricity required by the vehicle ‐ powering the electric motor and feeding the battery at times when the car does not need all the energy produced. In a plug‐in or charge‐depleting hybrid vehicle, the car battery can be charged from the electrical grid, with lower environmental costs no matter how the energy is generated . The University of Minnesota UTC also notes that electric vehicles require much less service than traditional ones ‐ costing less than $200 per year on average.159
The U.S. Department of Energy (DOE)has estimated that enough excess generating capacity exists at night in the U.S. to charge 180 million EVs without adding any new capacity. Bioelectricity is even better and trumps ethanol for efficiency, delivering 80% more miles of transportation per acre of crops, while doubling the GHG offsets to mitigate climate change. The USDOT has indicated that

NCHRP 25‐25/63 Environmental Corridor Management
101
plug‐in cars capable of 50 miles per day would meet the needs of 80% of the American driving public. Meanwhile, battery technology has now expanded to take EVs 80‐300 miles on a single charge and manufacturers are exploring new types of batteries. The recent stimulus bill reflects a growing consensus on where investment is most efficient, allocating $14.4 billion for research and implementation related to plug‐in vehicles, while DOE has shifted investments away from hydrogen research, figuring the infrastructure will not exist in our lifetimes. EVs also provide DOTs a way to circumvent the growing air toxics issues that hinder projects. Energy trends, basic science on energy efficiency, time to market for new innovations (EVs are ahead of others), current investment patterns and marketability assessments are among the drivers pointing to a shift to EVs.
Hybrid heavy vehicles are already available, such as the new diesel‐electric “bucket” (utility) trucks) or all‐electric units that rely on a combination of battery and plug‐in energy access. The Department of Defense is pioneering research in the area to help forces avoid dependency on fossil fuels or “trucked in” fuel of any sort, due to the security needs and risks. According to DOE, each day more than 50% of the world’s oil supplies must transit one of six maritime chokepoints, narrow shipping channels like the Strait of Hormuz between Iran and Qatar.160 DOD and DOE have figured that even a failed attempt to close one of these strategic passages could cause global oil prices to skyrocket, while a successful closure to one of these chokepoints would be economic catastrophe. To mitigate this risk, U.S. armed forces expend enormous resources patrolling oil transit routes and protecting chronically vulnerable infrastructure in hostile corners of the globe. This engagement benefits all nations, but comes primarily at the expense of the American military and ultimately the American taxpayer. A 2009 study by the RAND Corporation placed the cost of this defense burden at between $67.5 billion and $83 billion annually.161 Again, DOTs can be a force for sustainability.
NCHRP 25‐25/63 Environmental Corridor Management
102
6 Putting the Pieces Together
6.1 A Framework for Corridor Environmental Management This report has presented a framework for corridor environmental management, focusing on primary areas of attention for environmental performance measurement by AASHTO and FHWA (water, energy, resources/recycling) and the core maintenance practice of roadside management. This framework is based on doable, accepted practices and leverages existing systems for organizing and prioritizing environmental work in maintenance.
6.1.1 Deciding to Work or Present Work on a Corridor Basis
The examples of corridor environmental management discussed in this report are consistent with the best practices DOTs already employ or aspire to employ. The primary difference is that, in these examples, DOTs are more systematic about documenting and demonstrating what they are accomplishing.
A first decision for DOTs is whether they want to work or to present work on a corridor basis. Chapter 1 advanced some arguments for doing so, particularly that some stakeholders are accustomed to viewing DOTs’ work on a corridor basis. Furthermore, information systems are likely to enable DOTs to present the work they do in a corridor context, as DOT GIS systems, web tools, and public websites increase in capacity.
6.1.2 Continuing to Structure Environmental Management by Existing Units
As described in Chapter 1 and in the results of the survey and focus group, DOTs have significant interest in and incentive to structure work according to existing work units, on a state, region/district/residency, or county basis. AASHTO Environmental Management Systems expert Mike DeWit advises working within existing management units to promote environmental management activities, which is how the organization normally structures its work:
[DOTs] need to manage via the same entity; i.e. by counties, or districts, by toll roads, etc. Otherwise you have one management element that doesn’t line up with the other ones. Either use the management structure that is already there and integrate what you need to, or say, no, we’re going to try to change the management structure. Management programs that aren’t integrated with how [DOTs] operate the roads or do their work,…it’s never going to succeed. Essentially you put this thing off to the side, and sooner or later it’s going to trip and fall.162
Most importantly, DOTs should focus on “getting systematic” in the areas they want to do well and be most accountable, including environmental stewardship and managing corridors for environmental benefits, and aligning those goals with existing management structures already in place to carry out operations. Systematic approaches are structured to provide feedback on how the process is working and to facilitate continuous improvement.
NCHRP 25‐25/63 Environmental Corridor Management
103
6.1.3 Structuring for Feedback and Continuous Improvement
As valuable as they are, many of the mechanisms reviewed earlier in this guide tend to fall short in their capacity to foster continuous improvement and learning. NYSDOT’s GreenLITES is the only comprehensive, global approach to environmental stewardship across all maintenance areas. To improve and extend the practice, we turn to Environmental Management Systems (EMS), known in the International Organization for Standardization lexicon as ISO 14001. EMS offers DOTs a model for systematization of roles and responsibilities, execution of procedures, checking or monitoring performance, and re‐planning and implementation, to effect continual improvement.
ISO 14001 defines EMS as “that part of the overall management system which includes organizational structure, planning activities, responsibilities, practices, procedures, processes and resources for developing, implementing, achieving, reviewing and maintaining environmental policy.”163 The EMS provides the structure by which specific activities related to environmental protection and compliance can be efficiently and effectively carried out, once they’ve been chosen.
Generally, the EMSs that have delivered benefits have had successful mechanisms for monitoring effectiveness, incorporating lessons learned, and managing continual improvement. DOTs in the vanguard have focused on the following:
• Increased compliance assurance and cost‐effectiveness.
• Adoption and development of BMPs and sustainability practices.
• Enhanced land and resource use planning and management.
• Accelerating and streamlining the project delivery processes.
• Improved intergovernmental relationships and stakeholder confidence.
Challenges commonly include coping with the demands of intensive up‐front effort with only limited staff time, realistically quantifying resource requirements, and establishing straightforward metrics for monitoring. Effective management has been enhanced in some cases by information IT tools that facilitate the flow of environmental information; tracking of metrics; tracking projects schedules, budgets, and personnel; communication of corporate knowledge; analysis of impacts; and the availability of geo‐referenced data for decision‐making at the planning stage.
In many cases, an EMS approach will be more than what a DOT wants to do in environmental management of corridors. In such cases, it should be recalled that much can be accomplished simply by incorporating more environmental planning and resource‐mapping information into maintenance planning. Such an effort could consist of informal assessments on a corridor basis such as with NYSDOT’s Blue and Green Highways Initiatives. Alternatively, it could entail bringing together resource agencies around corridor maps to draw on their best professional judgment, as the Colorado DOT did. It can also involve more sophisticated data‐sharing and environmental analysis techniques, still without implementing all aspects of an EMS. A tool such as Florida ETDM’s Environmental Screening Tool could be extended to all corridors and maintenance applications, with the commenting system and interagency Environmental Technical Assistance Team still used to provide input on corridor needs.
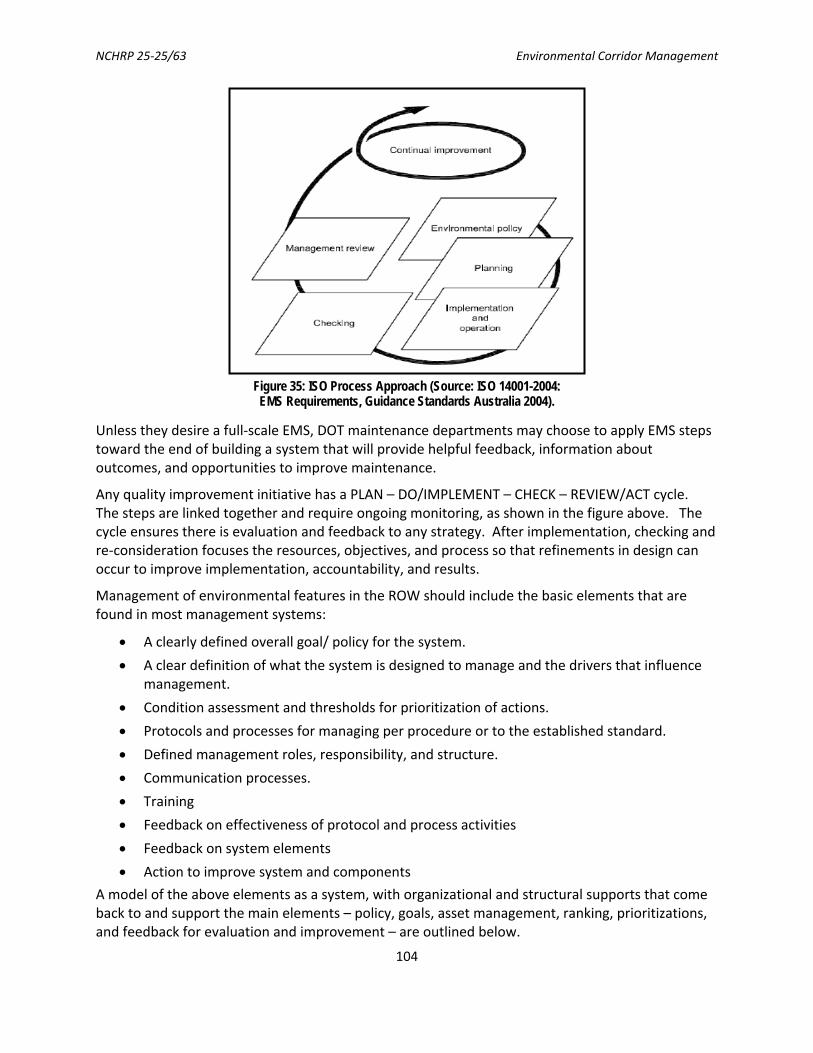
NCHRP 25‐25/63 Environmental Corridor Management
104
Figure 35: ISO Process Approach (Source: ISO 14001-2004: EMS Requirements, Guidance Standards Australia 2004).
Unless they desire a full‐scale EMS, DOT maintenance departments may choose to apply EMS steps toward the end of building a system that will provide helpful feedback, information about outcomes, and opportunities to improve maintenance.
Any quality improvement initiative has a PLAN – DO/IMPLEMENT – CHECK – REVIEW/ACT cycle. The steps are linked together and require ongoing monitoring, as shown in the figure above. The cycle ensures there is evaluation and feedback to any strategy. After implementation, checking and re‐consideration focuses the resources, objectives, and process so that refinements in design can occur to improve implementation, accountability, and results.
Management of environmental features in the ROW should include the basic elements that are found in most management systems:
• A clearly defined overall goal/ policy for the system.
• A clear definition of what the system is designed to manage and the drivers that influence management.
• Condition assessment and thresholds for prioritization of actions.
• Protocols and processes for managing per procedure or to the established standard.
• Defined management roles, responsibility, and structure.
• Communication processes.
• Training
• Feedback on effectiveness of protocol and process activities
• Feedback on system elements
• Action to improve system and components
A model of the above elements as a system, with organizational and structural supports that come back to and support the main elements – policy, goals, asset management, ranking, prioritizations, and feedback for evaluation and improvement – are outlined below.

NCHRP 25‐25/63 Environmental Corridor Management
105
OVERALL GOAL / POLICY
ASSET ASSESSMENT
RANKING /
PRIORITIZATION
PROTOCOLS AND PROCESSES FOR ASSET
MANAGEMENT
FEEDBACK EVALUATION AND
IMPROVEMENT
ORGANIZATIONAL SUPPORTS
-ORGANIZATION,
PERSONNEL AND OVERSIGHT
-ROLES,
RESPONSIBILITY AND STRUCTURE
- PLANNING AND ORGANIZTIONAL
DECISION MAKING
STRUCTURAL SUPPORTS
-COMMUNICATION
- TRAINING
-RECORDS AND
DOCUMENTATION
- TRACKING OF ASSETS,
REQUIREMENTS AND COMMITMENTS
MODEL OF ELEMENTS AS A SYSTEM
Figure 36: Diagram of EMS Elements as an Overall System (NCHRP 25-25/51)
A key part of a successful framework for environmental management, which fosters continual improvement, is to ensure integration among system elements and how the work is generally accomplished in the department. Because most DOTs operate in a project‐based culture, the continual improvement ‐ checking and reviewing process ‐‐‐doesn’t always come easily.164
6.2 Environmental Management Plans: A Potential, Simple EMS Application for Transportation Corridors
Environmental Management Plans are now being developed as a part of agency road plans, EAs, or EISs in many parts of the world. As part of our research, we examined Environmental Management Plans and specifically maintenance phase elements in corridor plans in Australia, meso‐America/Central America, Europe, and Georgia (former Soviet Union). In each case, we found that the environmental aspects and commitments in maintenance appeared to be much less than a state DOT in the U.S. would be doing. However, the EMP conveys to stakeholders that the lead agency or entity will attend to environmental responsibilities in a systematic way, raising public and resource agency confidence.
As stated in an Australian Environmental Management Plan for the Western Corridor Water Re‐Use Project, “the overall purpose of an EMP is to state a commitment to environmental management and detail how environmental values will be protected and enhanced.165 EMPs are drafted for all activities associated with the construction and operational stages of a project. EMPs: 166
NCHRP 25‐25/63 Environmental Corridor Management
106
• Identify (through risk assessment) all aspects of the project that may have a significant environmental impact.
• Set objectives and targets for environmental performance.
• Ensure that works are undertaken in accordance with environmental legislation and policy.
• Provide a framework for mitigating both expected and unexpected impacts during construction.
• Define environmental roles, responsibilities and accountabilities of project staff.
• Provide adequate information and instruction so all project staff can comply with the EMP.
• Ensure that senior management and all staff understand their environmental duty of care and implement, manage and continually review the EMP through training and awareness.
• Provide assurance to third parties that environmental performance requirements will be met.
• Provide a framework for compliance, auditing and inspection to help meet environmental performance targets and ensure continuous improvement.
• Ensure reporting and clear communication on environmental issues throughout the life of the project.
Topics covered in Australian BMPs include:167
• Pollution prevention and control and management of hazardous substances
• Erosion and sediment control (incorporating stormwater management)
• Contaminated land
• Dust, noise and vibration management
• Emergency response
• Water quality
• Waste management
• Acid sulfate soils
• Fire ants, weeds and other pests
• Traffic management
• Cultural heritage management
• Flora and fauna management
• Bushfire control
• Rehabilitation

NCHRP 25‐25/63 Environmental Corridor Management
107
A main purpose of the corridor environmental management plan is demonstration to environmental agencies that “there is in place an environmental management system which includes the following elements”168 familiar to DOTs and students of EMSs in the U.S.:
1. An environmental policy and corporate commitment to it.
2. Mechanisms and processes to ensure:
a. planning to meet environmental requirements.
b. implementation and operation of actions to meet environmental requirements.
c. measurement and evaluation of environmental performance.
3. Review and improvement of environmental outcomes.
The best example of a corridor environmental management plan that we found in our research in other industries and abroad was an pipeline/energy (linear natural gas LNG facility), road, and bridge project in Canada. That project’s Environmental Management Plan includes standards developed for the corporation in most EMS areas, while also including standards specific to a number of environmental aspect and impact areas. These standards are generally implementation of practices that DOTs would find familiar.
The Canadian pipeline environmental analysis and EMP was the most detailed, though still very brief by US EIS or EMS standards. This simple EMS for a corridor may be valuable for DOTs because it hits all the EMS elements relevant to DOTs’ current practices in a very brief fashion, as described below. Essentially, the EMP frames standard DOT practices within EMS language and elements. It would be fairly simple for DOTs to develop/have such environmental plans for corridors, and then be able to say or show they have an EMS in place. The latter may be valuable to different stakeholders.
• The assignment of roles, responsibilities, and accountability occurs in accordance with the pipeline company’s standard for “Responsibility and Accountability.” According to this standard, the Construction Manager assumes ultimate responsibility during construction and the LNG Facility Manager assumes responsibility during the operational phase. The EIS and EMP specify that an Environmental Manager will be appointed to be responsible for the day‐to‐day implementation of the operations phase of the EMP and will report on its implementation and performance to the LNG Facility Manager.
The EIS and EMP state that “staff and contractors will be responsible for implementing the final EMP in a manner that complies with all relevant environmental standards, adheres to all legislative requirements, and ensures that all environmental objectives associated with the work are achieved. Contract documents will include the necessary environmental specifications and commitments and require compliance with the EMP, construction specifications, technical drawings, and the general environmental duty.”
• Monitoring occurs in accordance with the monitoring standard and regulatory requirements. Routine environmental monitoring of the access road and bridge are conducted to ensure performance standards are met. In addition, monitoring, undertaken by the corporate operational personnel and specialist service providers, is periodically conducted in accordance with site‐specific monitoring plans. The EIS commits that “specialist studies to investigate particular aspects of the environment (e.g., flora and fauna,

NCHRP 25‐25/63 Environmental Corridor Management
108
weeds, hydrological risk) will be commissioned when a need is determined during environmental review and assessment.”
• Compliance audits are conducted in accordance with standards for “Monitoring, Measuring, and Reporting” and “Management System Audit and Assessment,” against the requirements of the EMP, the construction procedures, relevant legislation, license and permit conditions, and industry standards. This means that inspection and audit reports of environmental performance are stored in the Audit and Inspection Manager (AIM), an electronic database used to record, track, and close out corrective actions identified during the inspection/auditing process. The corporation makes this available to the relevant regulatory authorities “as required.” The EIS and EMP commit that, in addition to the monitoring and reporting requirements documented in the EMP, the corporation will also audit as follows:
o During construction, internal audits will be undertaken at regular intervals to verify that all work is proceeding in accordance with the EMP.
o A post‐construction audit of the access road and bridge ROW and other related infrastructure will be conducted annually for two years following construction to evaluate revegetation, erosion and soil stability, weed control, watercourse alteration prevention, and success of bed and bank re‐profiling.
o During the operational phase of the access road and bridge, internal audits of environmental compliance will be undertaken on a regular basis.
• Any environmental incident, hazard, near‐miss, non‐conformance, or third‐party complaint is managed in accordance with the company’s standard for “Incident and Non‐Conformance Investigation, Corrective and Preventative Action.” Unwanted events are recorded and managed using the corporate Incident Management System (IMS), a database. In the case of non‐conformances identified during an audit or inspection, the notification and rectification of the non‐conformance are managed through the AIM. Regulatory agencies are notified of any reportable environmental incident or non‐conformance with statutory approvals within the appropriate timeframe and as soon as practicable. Relevant records supporting inspections and audits, in addition to monitoring and other critical aspects of the management system, are generated and maintained.
• Per the “Training and Competency” management standard, all corporate personnel, contractors, and visitors are required to take appropriate environmental training and instructional programs. All managers and supervisors are responsible for ensuring that personnel under their control have the requisite competencies, skills, and training to carry out their assigned tasks in accordance with the requirements of the EMP, as well as responsibility for identifying additional training and competency requirements. All staff receive training and project induction including a comprehensive review of environmental requirements and standards, safety, and access protocols. In addition, all project supervisors and managers receive detailed training on the use and implementation of the EMP. Managers and supervisors are to hold regular “toolbox meetings” with personnel to discuss issues associated with their scheduled work, including highlighting and discussing relevant environmental issues.
NCHRP 25‐25/63 Environmental Corridor Management
109
The EMP is designed to be dynamic and modified as permit conditions are included and site‐specific elements occur. The EMP owner (LNG utility in this case) commits to responsibility for “regular review of the EMP to achieve of the EMP to achieve continuous improvement in environmental performance.”
For clearing and grading, earthworks, and the array of subsequent construction and operations activities, this EMP identified the following, again easy items DOTs could commit to do, generally.
• Environmental management objectives (e.g. topsoil quality is protected; prevent the introduction and spread of weed species associated with construction activities.)
• Performance criteria (e.g., soils and vegetation stored appropriately to allow for restoration of disturbed areas to equivalent to surrounding area after construction; installation and maintenance of erosion and siltation control and soil containment devices; no new weed infestation in construction areas; no spread of weeds from infested areas to weed free areas; compliance with weed control standard.)
• Implementation strategy (e.g. excavated spoil (subsoils) will be stockpiled separately from topsoil and vegetation; weed inspection prior to construction; vehicle washdowns.)
• Monitoring and auditing, (e.g., Construction sites will be regularly inspected to assess the effectiveness of protection measures, with particular attention to areas such as soils segregation, and erosion and siltation control devices; for weeds, the site, work areas and access tracks will be regularly inspected to assess the effectiveness of protection measures with particular attention to washdown activities and records and restoration activities.)
• Reporting and corrective action (e.g., to be conducted in accordance with management standards on monitoring, measuring, and reporting, and non‐conformance investigation and corrective and preventative action. A sample incident or failure to comply is: management controls not implemented or off‐site environmental impacts occur. In such cases, “a selection of the following actions will be taken: an investigation will be undertaken into why directives are not being carried out; employees will be re‐educated on desired practices; work policies and procedures will be reviewed and modified to improve the situation.”
Once again, such a corridor environmental management plan (EMP) frames standard DOT best management practices within EMS language and elements. It would be fairly simple for DOTs to develop/have such environmental plans for corridors. DOTs would then be able to say or show that they have an EMS in place, potentially for all corridors. The latter may be valuable to various regulatory stakeholders and members of the public. Regulatory agencies could always ask or state their preferences for more detail, but fundamentally an EMS or an EMP are voluntary. Unless a DOT is developing an EMS under a consent decree, the DOT can decide to proactively implement and EMP or EMS, the way the DOT wants to do it. A more detailed EMS approach follows.
6.3 A More Detailed EMS Approach to Corridor Environmental Management
A more detailed EMS approach to corridor environmental management could incorporate the full range of elements outlined in AASHTO’s EMS guide or in NCHRP 25‐25/51, Asset Management of Environmental Mitigation Features, where an EMS approach is tailored to environmental asset
NCHRP 25‐25/63 Environmental Corridor Management
110
management. DOT environmental specialists and maintenance managers are potential leaders in developing environmental enhancement and management plans for corridors.
In the beginning of this guide, we described how corridor environmental management offers a framework in which DOTs could coordinate with and reach out to other stakeholders, so we will go into greater detail here on the planning and collaborative dimensions of setting priorities and working with stakeholders on corridor environmental management. The procedure development and training parts of an EMS are more familiar and detailed parts of DOTs’ maintenance work and the AASHTO guide may present an adequate primer to these portions. That guide is available at: http://environment.transportation.org/center/products_programs/ems_products.aspx#ems_guide.
The sections that follow represent a number of different places DOTs can start to initiate internal explorations on how to manage transportation corridors for environmental benefits or how to partner with others in that exploration and plan development process. Note that these are not provided in sequence or meant to be a mandatory set of steps to be followed in a linear fashion.
PLANNING
6.3.1 Overall Goal / Policy
DOTs help themselves and front line staff by being clear about agency philosophy and direction. For example, an agency’s enviornmental policy could emphasize to stakeholders that it is desirable and worthwhile to invest thought, time, and effort in managing corridors for environmental benefits.
NYSDOT provides a strong example of how an agency aligns its goals and practices. The department has an overarching environmental policy and goal to improve environmental conditions in the course of the DOT’s work. In its GreenLITES Operations Certification Program, NYSDOT translates those goals more specifically for operations:
“As we provide safety and mobility in New York State, transportation sustainability at NYSDOT is an operations philosophy that ensures that staff:
• Protect and enhance the environment.
• Conserve energy and natural resources in all aspects of our work and operation of facilities.
• Participate in new and innovative approaches to sustainable operations and maintenance.
• Support a sustainable fleet and alternative fuel use.
• Improve access to public sites and protect historic resources.
• Support multi‐modal transportation and Smart Growth.
• Preserve and enhance scenic and aesthetic roadside characteristics.”
NYSDOT describes in layman’s terms what sustainability means as well: “sustainability is about balancing what is beneficial to people, while considering what is economically sound, and environmentally compatible. This may or may not necessarily increase operations and maintenance costs. Where costs are increased, it may be warranted when all external and future cost are considered including environmental benefits.” Environmental policies get the word out. Engineering Directives may convey expectations more explicitly. Furthermore, NYSDOT has

NCHRP 25‐25/63 Environmental Corridor Management
111
committed to and undertaken a sequence of actions to accomplish organizational change, a progression of increasing awareness, changing attitudes and policy, changing practice, and ultimately changed results. 169
The overall goals in an EMS or potentially an environmental management plan for a corridor express what the DOT hopes to achieve in its maintenance efforts. The EMS may incorporate or represent what the DOT and stakeholders have collaboratively identified as desirable or feasible aspirations for environmental enhancements or maintenance of environmental features in a corridor.
DOTs have their own environmental stewardship objectives as well as familiarity with federal, state, and local regulations, with which they comply. Though a DOT’s commitment to environmental stewardship and environmental enhancement may be clear at the policy level, the rubber meets the road when an objective is actually incorporated into the systems and expectations governing daily work. Such systems provide staff with the necessary information and clarity regarding how far the stated policy and expectations go and where environmental priorities fall in relation to other priorities.
6.3.2 What Do We Have and Manage?
Assessing the environmental needs and features existing in a corridor also present a potential starting point for corridor environmental management. Features of particular interest to maintenance staff and other stakeholders include:
• Fish habitat
• Wildlife habitat
• Roadside vegetation management, including sensitive areas of rare plants
• Constructed mitigation areas in the ROW
• Streams, wetlands, and conservation areas
• Wildlife crossings
• Historic and cultural resources, historic markers
• Archaeological resources
Other environmental features or assets exist in relation to the features above. For example, fishing access points may exist in relation to streams. Nests of ground‐nesting migratory birds may exist in relation to certain roadside vegetation and ecosystems. Culverts, outfalls, and sediment basins may need to be maintained and checked regularly, to ensure that pollution of streams is not occurring. All of these contribute to the list of environmental features DOTs maintain and manage in transportation corridors. This list and associated features exemplifies the possible breadth of maintenance that an agency must consider in its overall management approach.
Advance planning for mitigation or resource enhancement, where DOTs can afford it, can offer streamlining benefits down the road, for maintenance as well as capital programs. For example, by identifying early‐on which bridges are significant and deserve higher levels of rehabilitation and

NCHRP 25‐25/63 Environmental Corridor Management
112
maintenance, Mn/DOT has not only streamlined its own project delivery schedule, but it also has been able to invest in bridge preservation projects that use fewer resources and cost less than removing and replacing a structure. Mn/DOT developed individual management plans for the historic bridges selected for preservation, thereby helping the agency plan and prepare for the property specific needs of each of these unique structures. Mn/DOT also prepared a general bridge management plan for use by local agencies that own historic bridges, leveraging the resources that other agencies are able to apply. The plan outlines the steps by which the character‐defining features of a historic bridge can be identified and preserved, as well as providing guidance on funding options for historic bridges.
By demonstrating the Department’s commitment to preserving key historic bridges, the Minnesota State Historic Preservation Office (SHPO) formalized Mn/DOT’s various streamlining studies by entering into a Programmatic Agreement (PA) on the process by which Mn/DOT bridge projects would be reviewed. Under typical Section 106 reviews, each bridge would need to be individually evaluated, creating cost and project delivery delays. Under the PA, only the 200 historic bridges require any additional review, meaning work on the remaining 5,000 bridges is cleared without studies or delays. It is estimated that the implementation of the bridge management plan (i.e., reduced review and mitigation costs vs. higher preservation costs for the bridges selected for preservation) saves the Department over $2 million a year, and months on project delivery for each bridge. The program allows for statewide implementation of bridge replacement and programmatic maintenance solutions where possible, versus a case by case study and evaluation.
6.3.3 What Are the Environmental Aspects of Maintenance Work?
Identifying environmental aspects of one’s business is an early planning step in a traditional EMS and can also serve as a starting place for DOT environmental management in maintenance, either programmatically or on a corridor level. This step asks how DOT activities enhance or diminish the functioning of these environmental features. Maintenance staff engage in a wide variety of activities out in the field, with a variety of environmental aspects and potential impacts to the environment from how that work is done. For the inquiry with regard to maintenance of environmental features, questions on the environmental aspects of maintenance work center around the environmental resources identified earlier. For example:
• Materials management and disposal have environmental aspects to how this work is performed, with implications for runoff and the health and functioning of nearby streams, wetlands, and fish reproduction in streams.
• Environmental aspects of snowplowing include the potential to bury wildlife crossings under the road, and thus, to maintain functioning of such passages throughout the winter, plow operators should be made aware not to pile snow in such areas.
• Fence maintenance also impacts the function of wildlife crossings.
• Mowing can negatively impact the habitat of ground‐nesting birds, contributing to decisions to limit mowing to a roadside strip in some areas.
• Salt or sediment‐laden runoff is an aspect of various maintenance activities, and can impact nearby streams and wetlands if not adequately controlled.
NCHRP 25‐25/63 Environmental Corridor Management
113
A more expansive investigation of the environmental aspects of maintenance work is a step toward development of an environmental management system, if one is desired. Understanding environmental aspects of DOT maintenance work helps staff understand what to avoid doing, as well as what to positively do, in the corridor.
For example, PennDOT provides winter materials storage, runoff control, training and quality assurance, with a high emphasis on stockpile management. PennDOT’s Model Facilities Task Force (MFTF) ‐‐ comprised of various representatives from Facilities Management Division of the Bureau of Office Services, Bureau of Maintenance & Operations, Bureau of Environmental Quality, Engineering Districts and County Maintenance organizations ‐‐indicated a need for PennDOT to reemphasize stockpile management after finding safety deficiencies, improper handling and storage of materials, environmental remedial costs, building damage, and failure to update and implement Preparedness, Prevention & Contingency (PPC) plans.170 In the case of New York State DOT’s Operations, the Division identified environmental aspects of the department’s work by taking everything that Operations does in the Maintenance and Operation Plan and adding or highlighting environmental components.
6.3.4 Build Awareness of the Issues & Recruit Champions and Partners
DOT staff who plan to help design corridor environmental management approaches may need to build awareness of the issue and recruit champions and partners. A DOT’s environmental specialists can help answer questions about the features the DOT manages in the corridor and how those might be enhanced. Collectively, headquarters and regional staff can identify key sources of information, from historical experience at the agency, to individual lists, maintenance records or GIS, and construction as‐built plans.
Environmental specialists can also help coordinate with other agencies and entities to understand their interests, goals, and vision for the corridor. Maintenance staff members should be part of the process as active contributors as well as a reality check for what the DOT can accomplish.
6.3.4.1 Considering Others’ Goals, Objectives, Visions, and Values DOTs and partners should also consult state wildlife action plans, eco‐regional conservation plans developed by NGOs or other agencies, and recovery or restoration planning information and perspectives from regulatory agencies to see what other goals, objectives, visions, and values may be operational in the corridor area.
Increasingly, DOTs may be able to help agencies achieve multi‐resource stewardship objectives for non‐regulated as well as regulated resources. If DOTs have not developed an online consultation system for soliciting feedback on electronic/GIS information about the environment, as described in the first chapter, a good place to start is as follows:
1. Identify and contact other interested parties in (other) federal and state agencies and reach out to county, municipal, and tribal partners and conservation planning entities. Use this outreach to initiate relationships, lay the groundwork for cooperation, and build an understanding of the state, federal agency, or local jurisdiction’s conservation and sustainability objectives.

NCHRP 25‐25/63 Environmental Corridor Management
114
Most states have multiple agencies and NGOs working to advance and protect their natural resources (watersheds, natural habitat, etc.) which can provide plans and information to help identify conservation priorities. Identify the key players in the planning region in terms of conservation planning and implementation and resource stewardship.
The public and other stakeholders should also be included (or planning should occur for how the public and other stakeholders will be included in the process). Consideration should be given to including stakeholders in the region who are involved with significant projects requiring mitigation, as they may become potential partners. Other stakeholders can be identified by assessing current and anticipated future land uses (farming, recreation, energy corridors, etc.) outside of the transportation agency. When these other land uses are identified in conjunction with the corridor, it becomes possible to identify areas of conflict and opportunity in a more complete ecosystem context and leverage the environmental enhancements/investments of others.
2. Define and develop commonalities for the corridor and advance a shared vision. In this step, the players will get an idea of each of the players’ interests and what they may be able to contribute and/or leverage. If a pre‐existing interagency consultation group is available, such as Florida’s regional Environmental Technical Advisory Teams, such groups can contribute to development of a shared vision with regard to the ecosystem and resources in the corridor. The shared vision should be as specific and concrete as possible and considered “do‐able” by the team, including the maintenance staff involved. It is further recommended that the team establish and confirm goals, process, roles, and responsibilities, particular to the effort, along with a prospective timeline for the activities outlined.
3. Formalize agreements in writing, such as an interagency MOU/MOA. The team’s agreements provide a foundation for action. Formalized agreements help assure follow through on expectations and/or that commitments are kept.
Given the lack of this data from state or federal agency sources, DOTs contacted for this research effort were generally very positive about forming partnerships with relevant NGOs for planning and implementation. DOTs said they were interested in:
• Developing partnerships with funding and legal mechanisms to make it easier and more efficient to use data from these groups. DOTs were interested in having data provided to DOTs in a more usable format (e.g., GIS layers, prioritized areas for restoration, etc). DOTs reported they are much more likely to be able to help with enhancement needs if they have information on the best places for restoration or other activities and the templates or tools in place to allow it to happen.
• Forming partnerships and exploiting the opportunities that arise when maintenance is being performed in these areas. DOTs asked that they have a representative at the table with these other entities and agencies at every meeting, to plan and implement strategies together.
• Forming partnerships for the exchange of information and concerns that can later be developed into effective policies.

NCHRP 25‐25/63 Environmental Corridor Management
115
• Utilizing watershed, conservation, and environmental restoration plans that establish long term goals, as well as best practices that can be used to manage systems to further those goals. Few of these are fully developed in the state.
DOTs then thought that conservation/restoration plan information could be referenced in DOT manuals and procedures, including Standard Operating Procedures and Maintenance Manual Policy Documents. One called for implementation of statewide best management practices addressing each of these issues and their sub‐issues.
6.3.4.2 Understand and Address the Barriers Developing a realistic plan also requires understanding and addressing the barriers to successful maintenance. Examples of common barriers and potential solutions are included below.
Barriers Possible Approaches/Solutions
Neither the DOT nor the resource/regulatory agency feel that the agency has the skill set and structure to accomplish long‐term maintenance or management of environmental features.
• Develop the structure to support environmental maintenance at the DOT.
• Develop associated training, institutional backing, and feedback mechanisms for monitoring and improving new processes.
• Develop partnerships with other agencies and organizations who may be able to do what the DOT can’t.
The DOT or Maintenance don’t feel they have the funds to engage in environmental enhancement activities.
• Identify “low‐hanging fruit,” opportunities that tap into employee’s enthusiasms (e.g. fishing accesses, their kids at local schools), and require little time or cost.
• Identify what the DOT is already doing and may be able to extend.
6.3.5 What Should We Be Managing?
A corridor context can help DOT staff and partners 1) frame priorities; 2) identify where environmental benefits could be maximized; and, 3) identify costs or risks reduced by implementation of various enhancement strategies.
Some DOTs may want to systematically identify commitments made in terms of maintenance of the environmental features in question, in permits or other regulatory vehicles. The environmental specialists who negotiate these provisions as part of permits and interagency agreements often lead this step. Maintenance staff can help identify the regular gaps or downfalls that occur in meeting those commitments. Gaps can be identified through interviews or in a workshop setting with those most familiar with “how things really work on a daily basis.” Dialogue between environmental staff and maintenance (and potentially stakeholders) allows exploration and discovery of why desired conditions do not occur, have not been occurring, or cannot occur.

NCHRP 25‐25/63 Environmental Corridor Management
116
The question of what the DOT should be managing is likely to be revisited in multiple rounds of the improvement process. Given that it is necessary to start somewhere, DOTs often start with a few resources that are deemed necessary for doing a better job of managing. For some this has been water quality control BMPs. For others, immediate improvement opportunities have risen in the ROW, as DOTs see they could both save costs and enhance the environment by reducing the area they mow. In other cases, ameliorating fish passage is a priority, driven by the Endangered Species Act, the concerns of state agencies, or local communities.
Ultimately, decisions about what the DOT will manage come back to upper management and whether the needed resources will be made available. A major consideration in this process is determining whether the investment is going to incur additional costs.
6.3.5.1 What Are the Key Conditions to Maintain Environmental Features & Function?
Environmental specialists, maintenance staff, and stakeholders are likely to all have opinions about key environmental conditions to maintain. Sometimes, consistent principles and thresholds can be developed to manage a given resource. For example, “grade level” maintenance conditions for permanent stormwater infrastructure can be established, as well as simplified maxims such as:
• Don’t mow the birds!
• Don’t block the wildlife passage with a big pile of snow!
• Don’t smother the fish spawn by getting dirt in the stream!
• Don’t poison the fish or kill the well by using more herbicide or salt than you need or leaving in unprotected, in storage. Be aware of where salt or herbicides could run into streams or wetlands.
Environmental staff at the DOT usually know the thresholds of what the resource agencies are seeking with regard to satisfactory maintenance in order to protect the environmental resources in DOT custody or affected by DOT maintenance activities. Designers and resource agencies may provide supplementary input.
6.3.5.2 Define Characteristics or Indicators of Proper Functioning and Sketch Out a Range of Functionality in a Condition Assessment
Desired or required conditions should be described in detail and where possible, translated to a gradation of function for each resource and/or feature to be managed. A general model for setting up a condition‐rating scheme will provide a description of levels of function, with thresholds for action, for the various resource types the DOT is managing. These levels could be categorized as follows:
A. Good/very good condition or functioning
B. Adequate condition or functioning
C. Small maintenance action needed to restore to proper functioning
D. Not functioning: substantial maintenance needed
F. Not functioning: rebuild or replace
NCHRP 25‐25/63 Environmental Corridor Management
117
This step can require many rounds of review to develop a functional and replicable system. so that:
• Condition levels are meaningful and accurate.
• Achievement of “A” or “B” level condition ratings achieves a level of function that satisfies all environmental regulations and stewardship commitments the agency may have.
• Condition levels can be understood by anyone.
• Staff or interns can be trained to evaluate the condition of the feature and reliably produce the same rating, from the same conditions, when encountered.
Condition ratings should be defined for each environmental (mitigation) feature the DOT plans to manage as an asset. More informal systems can be developed or applied where one‐time enhancement actions are desired.
6.3.5.3 What Would It Take to Comprehensively Assess This Resource?
Comprehensively assessing resources takes a great deal of time and can be cost‐prohibitive for DOTs. Some DOTs have developed alternate systems that are working effectively for them. For example, North Carolina DOT, which manages over 75,000 miles of roads in the state, negotiated with the State Division of Water Quality to do an implicit survey of outfalls, very efficiently via GIS. The DOT looked at where roads intersected streams and creeks. NCDOT only performs explicit surveys, in the field, on request or as a follow up to further investigate priority retrofit sites (those on roads with high average daily traffic and proximity to sensitive or high resource waters).
Once a condition rating system has been developed, DOTs must consider how it can be efficiently implemented. The following questions may help DOTs go through this thought process:
• Are particular skills sets needed, for example rare plant identification?
• Can it be accomplished by interns or in conjunction with universities?
• In what timeframe could the survey be accomplished with maintenance and/or environmental staff in the course of their normal work on the corridor? Can other internal staff resources be marshaled?
• How much would it cost to contract out the work?
• Is a census (complete survey) necessary or would a sample be sufficient for estimating extent of the need, for programming and budgeting purposes?
• How is the data going to be used, and is it worth it to gather it?
It is important to consider whether the condition assessment rating system can be implemented with the DOT’s staff resources. Questions such as the following may be helpful: What could be accomplished with existing resources, on “rounds” when staff are already in the field? What could be accomplished with devoted resources? What could be accomplished with additional devoted resources?
• Identify what data is needed and what tools and skills will be needed to collect it; e.g. GPS receivers, pen computers, digital cameras, etc. and how this might be obtained.
• Identify what portion of the data collection and data assessment responsibility might be efficiently shared with others, especially sister agencies.

NCHRP 25‐25/63 Environmental Corridor Management
118
• Identify data collection that might potentially be automated.
• Identify an interim level of data that might be generated efficiently, through GIS, as a guide to further data collection or characterization.
• Identify where the information would go when it is collected.
o Who will identify and structure the information to be collected?
o Who will design the database for data storage?
o Where will the data be stored, who will manage it, and who will have what levels of access?
• How will the information be accessed and feed into decision making?
• How will the information connect to maintenance and the capital program?
• It is important to explore these questions before investing in a data collection program.
DOT participants in the survey effort stressed the following, with regard to stakeholder involvement:
• Carefully define the needs.
• Get stakeholder input.
• As long as there is strong local control over land use, enhancement or management initiatives should occur in cooperation with them.
With regard to data collection, analysis, and tools, DOTs commented:
• First, define what it is that needs measuring. We then need baseline information about existing measurements so we can then see and measure the results of the effort. The initial information takes time to gather.
• Corridors must be mapped, including landscaped areas, natural areas, and roadways.
• Share GIS data with all of the partners. GIS data layers with specific locations of significant areas to be managed are important. Likewise, staff time and interagency coordination to obtain data to include in the GIS layer are key.
• DOTs need good, broad, easily accessible and interpretable data or data layers for decision making (e.g., simple criteria for selecting restoration sites, GIS data layers at a broad, landscape level). SWAP data should be in a usable format that could be applied by non‐environmental staff. DOTs need to develop programmatic funding mechanisms and legal tools to enable collaboration between agencies and NGOs without having to create these mechanisms each and every time. Then DOTs need incentives, such as streamlined regulatory review (see AASHTO programmatic agreement library http://environment.transportation.org/pal_database/view_agreements.aspx) and federal funding for maintenance or at least environmental corridor management.
• Data (and/or tools) are needed for managers to evaluate and recognize a corridor appropriate for special management.
• MMS systems need to capture routine and special maintenance work as well as identify plans to restore or revegetate areas that need improvement.

NCHRP 25‐25/63 Environmental Corridor Management
119
With regard to federal funding, arguably, environmental corridor management is very important to meet the broad objectives of federal environmental laws, such as species and ecosystem recovery and implementation of a conservation program (the Endangered Species Act) or maintaining the physical, chemical, and biological integrity of the nation’s waters, and restoring fishability and swimmability (Clean Water Act). To date though, federal funding for maintenance has been small; construction has been the main focus. Meanwhile, DOTs relay that funding is a primary impediment in implementing more corridor environmental management. Ultimately, environmental corridor management is a way to increase public attention to the overall benefits of maintenance and how maintenance addresses and accomplishes what people care about. Discussions about increasing federal funding to maintenance will likely be taken up by Congress in conjunction with the next transportation bill, in early 2011.
6.3.5.4 Risk Assessment & Investment Rationale
DOTs manage a large amount of land. What are the risks of failing to adequately manage these lands? Left untreated, invasive species tend to spread rapidly, resulting in greater maintenance costs the longer lands are left untreated. Further, non‐compliance with required conditions for regulated resources can lead to fines and legal sanctions. Therefore, identifying the risks of inaction can help justify and generate the necessary action. This step identifies those environmental features that would benefit most from improved maintenance and what resources would benefit most from increased attention.
A variety of risk assessment techniques can be used, from informal lists to more involved evaluation. Risks can be ranked by probability and impact and evaluation of threats to operability, maintainability, or long‐term budget, including required reconstruction. Project risk management techniques, such as those outlined Caltrans’ Risk Management Manual (2007) or WSDOT’s risk assessment technique can be adapted to program purposes, as well.
To minimize risk at WSDOT, each region has an environmental compliance plan, through maintenance, to assure compliance with environmental requirements during construction. The basic elements include written procedures, training, tracking performance, conducting constructability reviews, and commitment tracking. WSDOT is implementing a comprehensive Environmental Management Program for Road Maintenance that includes a Regional Road Maintenance Program (RRMP) and several Regional Environmental Compliance Plans. The EMP also includes a Maintenance Violation Notification Process (as found in the WSDOT Environmental Procedures Manual), which constitutes an Environmental Compliance Assurance Procedure for maintenance. WSDOT reports on progress in reducing violations annually in its Gray Notebook.
Opportunity costs are less frequently assessed. These are often hidden costs, born by the public of what could be done, benefits that could be achieved, but are not, when parties fail to cooperate or come to agreement. Having a sense of these opportunity costs can help parties come together to decide what they can and should accomplish together.
In sum, management will want to have a sense of the risks and opportunities as they factor into cost‐benefit calculations and in deciding where to invest in corridor environmental enhancement and which resources to prioritize first. When the public and/or stakeholders can participate in these discussions or see the thought and consideration that went into a DOT’s decisions, support and collaboration may increase.

NCHRP 25‐25/63 Environmental Corridor Management
120
DO IT! – IMPLEMENTATION and PROCEDURES
6.3.6 Management Decision‐making and Support
Management support can be very helpful and even necessary, helping decision‐makers achieve agreement on the following:
• Selection of which environmental features will be evaluated and tracked
• Organizational commitment to data collection on environmental features
• Budget resources for implementation of condition assessment and analysis
• Goals and objectives of the program and how to evaluate progress
• Roles and responsibilities
• Communication of priorities
DOT participants in this research project said that management could further and integrate environmental management in corridor maintenance by directing (and funding) it to make it happen; by making a commitment of funds or withholding of funds if environmental factors are ignored; and by improving communications in conjunction with additional funding. One state noted that improvements need to be on the affordable and “best practice” end, as maintenance projects are very small scale and typically do not have the funding to include major improvements such as wildlife crossings or major hydrologic changes.
DOTs that become involved in condition assessments need to create a detailed plan for implementation of the condition assessment identifying necessary staff, roles, procedures, and training, and identifying what resources will be assessed by when, given the allocated budget, and when/how feedback points will work for planning remediation or retrofits. Asset management systems try to catch and improve elements of a system before they start to fail. Feedback systems should be designed to utilize the information collected in the condition assessments and plan appropriate maintenance action in a timely fashion. Environmental specialists and maintenance staff can help identify how frequently surveys are needed and practical for the resources in question.
Once the condition assessment system has been identified, it is necessary to ensure that the system is reliably duplicable and that the maintenance staff or others doing the rating will reliably produce the same rankings when they are looking at the same thing. This requires testing and remedial action both with regard to the test or ranking system and with the raters themselves. Asset management systems include a substantial amount of additional data, beside the condition rating itself. DOTs must decide how classes of features are named, located, and characterized and what additional information might be helpful and desirable in interpreting records in the future. For example, GPS locations and digital photos can be very helpful in recognizing the later and/or seeing that is needed, back at the office. Pull down menus on PEN computers in the field help standardize responses and prevent errors in the database. To hone meanings, understandings, and rater’s ability to use the system, it is necessary to design and perform training on the rating system and related protocols, from safe conduct on the roadside to equipment use and data entry. Finally, DOTs must identify how observational data will be incorporated into maintenance plans and

NCHRP 25‐25/63 Environmental Corridor Management
121
programs. There must be a practical need and use for the data from the start, as well as the commitment and staffing to use it, or data collection becomes a wasted activity.
6.3.7 Developing Procedures
Developing procedures responds to critical “what” and “how to” questions staff may have in their maintenance approach and activities. Many DOTs have developed manuals and procedures and a growing number have developed DOT‐specific environmental maintenance guides.
Procedures help to communicate expectations. For example, PENNDOT Maintenance District 10 developed Process Maps operations associated with each significant aspect of operations with a special focus on the District 10 Maintenance Facility, providing information to plan, conduct, assess, and complete activities according to “Plan‐Do‐Check‐Act” framework and principles. Process Maps identify responsibilities associated with each action.
PennDOT implemented procedures to enhance environmental performance, including annual calibration of spreaders before the onset of the winter services season, use of two‐way radios between operators during storms to communicate information about application rates and roadway temperatures, daily electronic leak detection tests in the morning hours before the day shift at garages with corrective action if necessary to prevent leaks, and completion of a Foreman’s Erosion and Sedimentation Checklist as part of planning for earth disturbance activities that require control measures.171
To deal with salt stockpiles, a District‐approved, stockpile‐specific Pollution Prevention and Control plan is displayed unobstructed in the staging building and is revised annually. PennDOT uses a 50‐ element QA review, each tied into a department policy or regulation or a PennDEQ regulation. PennDOT has developed a Stockpile Academy Training Program, which maintenance staff are required to attend on a 4‐year rotating basis. PennDOT inventories winter materials and transfers all environmentally sensitive materials to permanent material storage buildings should begin, starting with any stockpiles located within 500 feet of any wells or streams. Under PennDOT direction, counties now have all salt under roofed storage from May to October. Bins and storage buildings, collection basins, and storage pads are cleaned and repaired in the spring. Prompt spring clean up of anti‐skid materials prevents clogging of drains and impairment of surface waters and habitats.
PennDOT’s ISO‐based SEMP plan resulted in:172
• Development of information on contractor/supplier procedures and requirements related to significant aspects, which are consistent with department‐wide contract terms and conditions, requirements, and procedures.
• Establishment of procedures for emergency response and spill prevention.
• Development of procedures, checklists, and responsibilities in monitoring and measurement activities related to significant aspects.
• Internal development of auditing procedures for SEMP activities performed by trained staff from another district.
PennDOT requires ongoing evaluation stockpile housekeeping measures. The procedure for this checklist includes:173
NCHRP 25‐25/63 Environmental Corridor Management
122
• Completing the checklist for each stockpile by November 30, January 31, March 31 and June 30 of each year.
• The completed checklists are forwarded to the responsible Assistant Maintenance Manager for their review and signature.
• The Assistant Maintenance Manager forwards the signed checklist to the County Maintenance Manager.
• Within ten days of the completed checklist date the County Maintenance Manager forwards all Stockpile Checklists for his/her county to the Assistant District Engineer/Administrator‐Maintenance (ADEM/ADAM) and the District Facilities Administrator (FA).
• The FA will determine appropriate corrective action in cooperation with the ADE/A‐M, the County Maintenance Manager, Equipment Manager and Assistant Maintenance Managers.
PennDOT makes use of the following quality assurance evaluation indicators for solid winter materials stockpiles: 174
• Any salt, mixed or treated material not under roof or tarped and anchored with sand bags; or not on an impervious pad.
• Any bagged deicing chemicals not stored on pallets and either under roof or 100% covered by tarps and anchored with sand bags.
• All salt, mixed or treated material stored under roof or on an impervious pad, tarp covered and anchored with sand bags. Note: Tarp and sand bags are not required during general snow and ice control operations. Bagged deicing chemicals stored on pallets and 100% covered by tarps and anchored with sand bags.
• All salt, mixed or treated material stored under roof, on an impervious pad, below building fill line, and tarp covered and anchored with sand bags. Note: If face of material is more than ten feet from the building doorway, no tarp is required.
• Bagged deicing chemicals stored on pallets and 100% covered by tarps and anchored with sand bags.
• All salt, mixed or treated material is stored under roof, on an impervious pad, and below building fill line, and tarp covered and anchored with sand bags. Note: If face of material is more than ten feet from the building doorway no tarp is required. Bagged deicing chemicals stored under roof, on pallets.
As a result of their system, PennDOT has been able to work with PennDEP to have one permit per district with an EMS in place, rather than one permit per stockpile. PennDOT is not required to sample because an EMS and BMPs are in place and salt is stored under cover. Finding covered loading was not considered necessary because loading areas are paved, curbed, and contained.
6.3.8 Communicating Roles and Responsibilities
Communication of roles and responsibilities is key to a functioning system that is trying to produce a change in conditions, and can be particularly useful in the management of a corridor for environmental benefits. This is even more important when such a corridor spans a broad geographic and agency oversight area . Interdisciplinary approaches frequently require greater
NCHRP 25‐25/63 Environmental Corridor Management
123
communication among more people. EMSs require specification of roles and responsibilities for environmental work that is expected to be undertaken, to facilitate accountability.
While some DOTs have added staff to deal with the junction between environmental and maintenance matters, this is still an area of need at many DOTs. NCDOT is one that has hired a director of environmental operations, to guide roadside or maintenance environmental work and make sure standards and expectations are communicated all the way through to annual performance evaluations.175 North Carolina DOT has examples of both of the latter that may be useful for other DOTs. Examples of evaluation sheets are included in the appendix. Also included is a review of the District of Columbia’s EMS relating to maintenance environmental commitments.
Without clarity of responsibility, it is easy for confusion to arise or maintenance needs to fall through the cracks. For example, at one DOT attempting to locate all outfalls and permanent stormwater facilities, maintenance staff told the DOT environmental contact that “we were told not to touch these things.” Many DOTs noted that longer term maintenance planning for environmental features simply didn’t exist, and is very limited where it does exist.176

NCHRP 25‐25/63 Environmental Corridor Management
124
WSDOT’s Continuous Improvement Approach to Maintenance Environmental Management for Several Species of Salmon and Trout
In response to the listing of several species of salmon and trout under the Endangered Species Act (ESA), WSDOT's Maintenance and Operations Programs developed a Regional Road Maintenance Program (RRMP) to indicate how WSDOT will comply with some Regional Road Maintenance Endangered Species Act Program Guidelines agreed to by various local government agencies, WSDOT, the National Marine Fisheries Service, and other interested parties. The guidelines were adopted to comply with the specific requirements of the ESA and provide Best Management Practices for environmental compliance when conducting roadside maintenance. The RRMP consists of ten program elements, including one for training (which includes training in ESA, erosion and sediment control for compliance with various WDFW General Hydraulic Project Approvals and Ecology NPDES permits applicable to WSDOT, and compliance monitoring and reporting). These guidelines provide a set of road maintenance policies and practices that meet the dual goals of contributing to the conservation of ESA listed species, while meeting critical roadway safety and maintenance needs. The Guidelines were the product of a lengthy collaborative effort between local government agencies, WSDOT, NMFS, and other interested parties. The Regional Road Maintenance Program (RRMP) contributes to conservation through ten program elements, including road maintenance best management practices (BMPs), and an in-depth workforce training program, and emergency response provisions, along with research and adaptive management via a regional forum of participating agencies. The scientific research element serves to verify effectiveness of BMPs and update BMPs based on the latest technologies. Biological Data Collection and habitat location information within the ROW involved a process to train and alert staff where the Guidelines need to be utilized. Compliance monitoring takes place at several levels: local agency supervisory staff, local agency permitting authorities and state, and federal permitting authorities evaluating BMPs for use and implementation. Each local agency establishes a formal compliance monitoring program for monitoring BMP implementation and any monitoring that is part of various research projects. Conservation outcomes were identified as well. Rather than each agency individually conducting research and case studies, members of the Regional Forum recommend a regional scientific research committee. For example ditch maintenance BMPs, the effect of various non-herbicidal methods of roadside vegetation control, and effects of chip sealing on nearby water bodies have all received case study attention from various entities and levels of government. The Regional Forum and scientific committee are vehicles for sharing this information. To help assess the adequacy of BMPs, environmental staff accompany maintenance personnel in the field during selected maintenance activities. Activities for which environmental performance are assessed are selected during interagency regional forum planning meetings. Generally, the activities selected for review are those that have the highest level of risk for adversely impacting fish or aquatic habitat. Examples of such activities include in-water work, stream bank stabilization, and bridge pier scour repair. A BMP/Outcome Categories matrix was developed for specific maintenance activities (e.g. minimize erosion/sedimentation, contain pollutants, maximize habitat improvements) and circumstances in which BMPs should be implemented so that a menu of options are available to crews, supervisors, design engineers, and environmental staff the flexibility to select the most efficient BMPs based on site constraints. The potential for problems to occur during the course of maintenance activities is covered by an adaptive management process. The adaptive management process allows for local agencies as well as the Regional Forum to learn from experience in the field and scientific research to improve the program over time. Thus, conservation outcomes are achieved and the slight risk of adverse impacts avoided or minimized. Adaptive management provides a systematic process for gathering and analyzing information to develop and implement alternatives that correct unproductive BMPs, and evaluate progress toward achieving regional road maintenance outcome-based goals. Program review occurs on predetermined timelines to ensure continual progress toward program goals and objectives. Compliance monitoring, effectiveness monitoring and changes to the Regional Program are the three basic components of the Adaptive Management.
NCHRP 25‐25/63 Environmental Corridor Management
125
The Guidelines developed in Washington State add considerably more detail and assurance on roles and responsibilities, actions, process, training, and re‐evaluation/adaptive management than EMSs often do. For example, the District of Columbia DOT developed an EMS and plans to track environmental commitments in maintenance; however, how needed maintenance is to be identified, programmed, and scheduled is not addressed in the plan, though the plan lists as “Key Elements of Operation and Maintenance”177
• Develop maintenance plans and budgets that reflect environmental commitments and requirements.
• Maintain and monitor, as applicable, environmental features and requirements.
• Verify conformance.
• Take actions, as needed, to ensure conformance.
• Provide environmental assistance and support.
As in many other DOTs, compliance will rely on “spot checks” performed by environmental program staff, presumably as they are available. The project manager and environmental staff are supposed to identify commitments and requirements to be monitored – requiring periodic examination or sampling (e.g., assessment of vegetation); or maintained – features (e.g., catch basins or sediment control ponds) that require ongoing maintenance to function as intended. Determine associated actions and schedules. However, the “when” and “how” are more vague: “as identified during the course of a project” and “capture information as commitments are agreed upon.” Then “assigned staff” are to “fulfill requirements as identified in preceding action in accordance with schedule and assessment needs.”
6.3.9 Conduct Training
DOTs conduct both environmental and maintenance management training for their staff, but further training may be necessary to address the environmental priorities identified programmatically or on a corridor basis.
Survey respondents considered training an important factor as well. One said, “education of front‐line employees about the value of environmental efforts and instilling a philosophy that environmental concerns are a priority makes the biggest bang in getting these plans incorporated. Another advocated for “mandated training of our local managers to insure that conservation and environmental issues are addressed in accordance with our existing state requirements.”
With regard to new condition assessment systems, where these are implemented, data collectors should be trained on the necessary equipment and protocols, incorporating field tests and QA/QC to ensure duplicable ratings, evaluate patterns and where improvement is necessary, provide the resources to gain further training.
CHECK/REVIEW and ACT
Continual improvement needs to be designed into a planning, implementation, and re‐evaluation system and it has to be a continuous effort. The nature of a systematic management approach is that the system not only provides structure and process for management, but the system itself has defined points where the overall system and each element are as needed and regularly reviewed to identify ways for improvement.
NCHRP 25‐25/63 Environmental Corridor Management
126
To ACT, means to have processes in place to ensure that as required or desirable changes are identified, they are implemented. These improvements may require use of the Planning and Implementation elements of the system.
6.3.10 Evaluation and Reporting Evaluation and reporting is a critical step in any systematic approach to quality management and improvement. If staff are unaware of results of their actions or are unable to review how a process is working, effectiveness is lost. Arguably, the lack of attention also implies the low value that management places on the activities in question, creating a further distance between actions and subsequent evaluation and reporting.
Evaluation and reporting is connected to EMS steps on internal auditing and documentation. While audits can be done by third parties and would be done so for an ISO 14001 certified EMS, many of the most effective “checks” at DOTs are essentially self‐audits. For example, PennDOT staff developed Quality Assurance Evaluations for Maintenance Stockpiles (to prevent runoff polluted by salt and other contaminants) and Foreman’s 15‐Minute Stockpile Walkarounds. These examples are available in AASHTO’s on‐line Compendium of Environmental Stewardship Practices and Procedures.178 FDOT has developed a quality level‐of‐service guide for roads and roadsides across the state.179
The framework presented in this report includes multiple DOT examples of evaluation and tracking conditions in the ROW, from MDSHA’s culvert and BMP condition rating and maintenance prioritization system, to NYSDOT’s GreenLITES self‐certification program, distinguishing transportation Maintenance Residencies, Regional Bridge Maintenance Groups, Main Office and Regional Operations Program Areas based on the extent to which they incorporate or introduce sustainable operations projects and practices. This is primarily an internal management program for NYSDOT to measure its performance, recognize good practices, and identify and improve practices where needed. However, it also provides the DOT with a way to demonstrate to the public how it is advancing sustainable practices. The rating system is for Operations based on the GreenLITES portion of the annual Maintenance and Operations Plan (MOP).
The Office of Operations issues GreenLITES certificates to the regions shortly after the submission for Certified, Silver, Gold, and Evergreen levels after the conclusion of the fiscal year. Additionally, in an annual celebration to commemorate Earth Day, a representative from the Commissioner’s Office presents award plaques to the appropriate Regional Directors for Residencies and Bridge Crews attaining the Gold or Evergreen certification level in the previous year.
As part of this research effort, DOTs were asked if they had applied any of the following standards or systems on a corridor basis in maintenance:
• EMS or ISO 14001
• Environmental standards for maintenance activities
• Programmatic permitting or consultation commitments
• Environmental asset management
• Retrofit inventory/repair programs
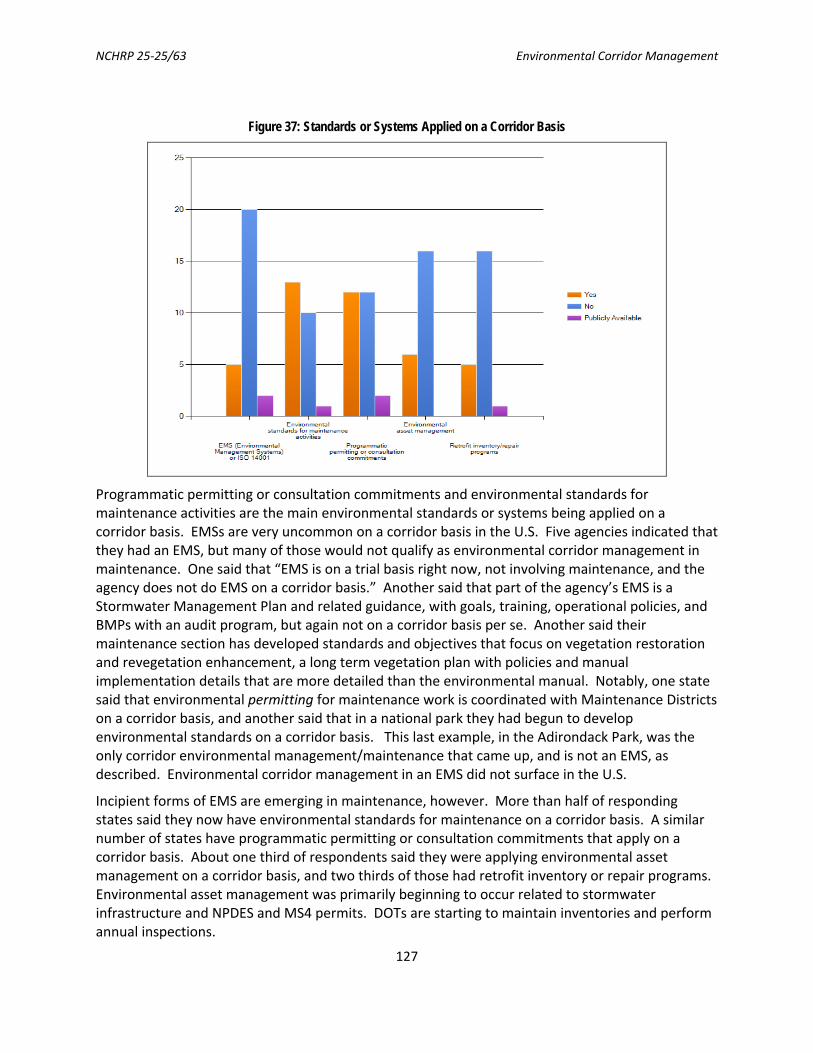
NCHRP 25‐25/63 Environmental Corridor Management
127
Figure 37: Standards or Systems Applied on a Corridor Basis
Programmatic permitting or consultation commitments and environmental standards for maintenance activities are the main environmental standards or systems being applied on a corridor basis. EMSs are very uncommon on a corridor basis in the U.S. Five agencies indicated that they had an EMS, but many of those would not qualify as environmental corridor management in maintenance. One said that “EMS is on a trial basis right now, not involving maintenance, and the agency does not do EMS on a corridor basis.” Another said that part of the agency’s EMS is a Stormwater Management Plan and related guidance, with goals, training, operational policies, and BMPs with an audit program, but again not on a corridor basis per se. Another said their maintenance section has developed standards and objectives that focus on vegetation restoration and revegetation enhancement, a long term vegetation plan with policies and manual implementation details that are more detailed than the environmental manual. Notably, one state said that environmental permitting for maintenance work is coordinated with Maintenance Districts on a corridor basis, and another said that in a national park they had begun to develop environmental standards on a corridor basis. This last example, in the Adirondack Park, was the only corridor environmental management/maintenance that came up, and is not an EMS, as described. Environmental corridor management in an EMS did not surface in the U.S.
Incipient forms of EMS are emerging in maintenance, however. More than half of responding states said they now have environmental standards for maintenance on a corridor basis. A similar number of states have programmatic permitting or consultation commitments that apply on a corridor basis. About one third of respondents said they were applying environmental asset management on a corridor basis, and two thirds of those had retrofit inventory or repair programs. Environmental asset management was primarily beginning to occur related to stormwater infrastructure and NPDES and MS4 permits. DOTs are starting to maintain inventories and perform annual inspections.

NCHRP 25‐25/63 Environmental Corridor Management
128
We also asked respondents about techniques they are using in maintenance to improve environmental performance. Few of these systems and standards are applied on corridors, specifically. Some noted that these techniques are used very informally. One clarified “we know how much environmental work is planning and accomplished and rate our residencies accordingly.” In another case, use of these systems was said to be based on land management planning. California conducts a self‐audit of activities and facilities, with a focus on BMP implementation and training. A variety of different feedback systems are in use. While audits are the most formal, representing one end of the spectrum, awards programs are less systematic but still involve evaluation, often linked with achievement of standards or illustration of better practice. DOTs have developed a variety of feedback, environmental asset management, and other continuous improvement systems in maintenance. These will be covered in detail in our next memo, which will incorporate the literature review and follow up.
Increasingly, DOTs are performing asset management for environmental considerations, especially for water quality control features, through agency NPDES permits. However, DOTs are also beginning to track sensitive areas in the ROW.
6.3.11 Analyzing and Reporting on Results, Planning for the Next Cycle Planning for the next cycle involves a review of performance indicators and program goals. For example, NYSDOT’s Office of Operations is establishing GreenLITES performance measurements, collecting data from GreenLITES MOP forms, and providing performance measurement statistics to appropriate NYSDOT managers. GreenLITES Operations will be rated for one year to develop a GreenLITES performance baseline. After the first year, with a baseline established, annual GreenLITES performance goals will be set by the Commissioner and the Director of Operations. The Office of Operations will develop and maintain a GreenLITES IntraDOT Web page that provides background and statistical information on the program. Operations prepares an annual report to the Commissioner on or before March 15. On Earth Day (April 22), the Office of Communications issues a press release highlighting the program results and announcing the complete report availability on the Web at NYSDOT.gov. The Engineering Division (or Office of Operations) is maintaining an external GreenLITES Web page highlighting the program’s purpose and accomplishments. This schedule allows approximately one month from the year’s end report until the report’s release.
Where DOTs are investing in condition assessments, it is important to analyze and report on results and convey overall performance indicators or maintenance adequacy. Summary condition information for each feature should be designed and presented, and the analysis should generate scenarios illustrating the options and implications of different investment levels, including timeframes for attainment of different condition levels. Ultimately, this feeds into develop and implementation of plans for the corridor, as well as identification of how evaluation will occur.
6.3.12 Quality Assurance and Updates Quality assurance and updating guidance are also part of the CHECK and REVIEW process. For example, at NYSDOT, the Office of Operations has committed to maintain the GreenLITES Operations Certification Program document, revise rating procedures as necessary, and conduct
NCHRP 25‐25/63 Environmental Corridor Management
129
random checks on GreenLITES certified Residencies and Bridge Crews as a quality assurance measure.
6.3.13 Discuss Results with Decisionmakers & Stakeholders and Refine the Plan
When maintenance has the results of the condition ratings and/or explorations of corridor conditions, a next step is to discuss those with management and interested stakeholders. A comparison of the results with the desired condition is a check on how well the system is meeting the stated objectives. This assessment can help management identify deficiencies and gaps, and identify what adjustments may be needed to the program and ideas for further efficiencies. The plan is then refined to take the needed corrective actions. The information can also help determine the priorities for use of limited resources.
6.3.14 Evaluate the Process How well is the process working? A continuous improvement process will build in opportunities for evaluation and learning. For example, as the re‐evaluation process proceeds, the DOT and stakeholders may decide additional data and approaches they want to use in the future or they want to drop, going forward.
Asset management systems are data intensive and include a substantial amount of additional data aside from condition ratings. DOTs must decide how classes of features are named, located, and characterized and what additional information might be helpful and desirable in interpreting records in the future.
Many DOTs said they see potential for incorporating environmental data gathering or environmental work in other corridor‐based efforts. Corridor safety audits were given as an example. As one DOT observed, “it seems it would be preferable if all worked together for maximum benefit.” Other DOTs recommended performing particular environmental related work in concert with other work, as follows:
• Fire suppression and integrated vegetation management.
• Site‐distance, sign obstructions, and tree canopy maintenance for winter maintenance (icy roads).
• Moose and elk distribution along state highways. We are beginning to use ArcReader/GIS for project reviews and corridor planning. The integration of multiple data layers (Endangered Species, significant Natural Communities, Coastal Zone Resources, etc.) assists us in analyzing habitat maintenance opportunities.
• Invasive species management, aquatic connectivity (e.g., culvert replacements), habitat enhancements (e.g., mowing regimes for grasslands, bird boxes in ROW), living snow fences, stream restoration, wildlife corridors, stormwater facility maintenance.
6.3.15 Identify Program Adjustments and Lessons Learned
As part of the system design, look for where in the system opportunities for improvement would be identified. Who and What are the sources of opportunities for improvement that can be anticipated in association with each element of the system that has been developed:
NCHRP 25‐25/63 Environmental Corridor Management
130
• Maintenance staff can identify ways to improve procedures and processes as they are often the most frequent users.
• Managers can note where intended results do not appear to be occurring.
As part of systemic, corridor environmental management there should be a regular review of the system, in order to assess if the agency is achieving its goals. For all areas where problems or areas of concern are identified, the root cause(s) of the problem need to be understood, so that when a corrective action is identified and implemented, the cause and not just the symptoms are remedied.
About a third of DOTs offered advice and input toward development of a conceptual approach for improving corridor environmental management, when asked. One emphasized a need to demonstrate benefits of the approach, with examples from other states. Cost information would also be helpful. Another noted that any such “system would need to place as little management burden on maintenance personnel as possible. Stretched budgets, limited staff, limited technology, and need to be able to respond to emergencies all place significant burdens on the maintenance workforce. Passive activities or work avoidance BMPs are probably better.” DOT staff emphasized the importance and value of management buy‐in, to pave the way, along with dedicated funding.
6.4 Next Steps for DOTs
6.4.1 Develop Environmental Management Plans by Corridor
Content management systems and more expansive GIS tools could help DOTs develop Environmental Management Plans by corridor. Such systems could develop and populate a regional Environmental Management Plan template to capture the many common elements and environmentally sensitive practice now a part of DOT maintenance work. Alternatively, the plans could be posted on‐line with links in each corridor plan which refer back to the programmatic activity.
Such plans would allow the interested public, local governments, and other agencies to see the extent of environmental work occurring in corridors and to make suggested additions, by corridor. While most of the plan might consist of links, greater space could be allocated to those elements of the plan that would be individualized by corridor. Space could be left, for example, for corridor specific suggestions arising from interagency consultation with natural heritage programs, wildlife agencies, or the State Historic Preservation Office.
6.4.2 Extending the Adopt‐a‐Highway Concept to Environmental Opportunities and Volunteer Service Areas
An agency’s Intranet homepage for Environmental Management Plans by corridor could also include a section extending the “adopt‐a‐highway” concept by corridor or to different environmental improvement categories, by sites, corridors, or broader areas. For example, some states have received volunteers from interest groups that would like to help maintain fencing in order to prevent wildlife deaths. Liability has been a concern in some cases, but DOTs stretched for resources are considering greater flexibility in broadening their maintenance options. In New York State, some volunteer groups help to maintain bird boxes in order to assist the agency with basic maintenance activities to prevent disrepair and more costly improvements later down the line.

NCHRP 25‐25/63 Environmental Corridor Management
131
6.4.3 Potential Agency Roles
Executing newer ideas with continually declining budgets and staff numbers takes creativity. Nebraska Department of Roads, NYSDOT, Oregon, Colorado, and Michigan are among the state DOTs that have reached out to their state Natural Heritage Programs, housed in universities or state DNRs, to accomplish what they would not have been able to do otherwise, creating positive new relationships and reinforcing older relationships, in the process.
6.4.4 Advances in Field Monitoring and Tracking
Increasingly, DOTs may be able to use corridors as the basis for collecting and tracking information on environmental and infrastructure conditions. For example, DOTs have used instruments for a number of years to help monitor bridge conditions, and sometimes to automatically spray anti‐icing compounds under specific weather conditions. Several DOTs are now investigating how to better monitor with instrumentation and add this approach to their permanent BMPs.
In the Charlotte area, NCDOT has tested a system of water sensors combined with statewide weather information systems to time sampling with runoff from storm events.180 The system uses the state’s Doppler radar. Colorado DOT (CDOT) used an automated system to monitor water quality during storm events and periods of snowmelt runoff. Monitoring stations at culverts measured the water quality of highway runoff including the effects of winter maintenance activities such as the application of sand and deicers that contribute pollutants to adjacent streams. The system also measured water quality changes in relation to sediment control measures implemented along the highway. CDOT used this information to design unique sediment traps in specific locations that were easy to maintain using existing equipment.
DOTs have also used cameras at wildlife crossings to monitor use by and effectiveness of for wildlife and road safety. Typically, monitoring data is collected by a university or wildlife organization and is not used to identify the need for maintenance of the crossing. Ideally, electronic sensors convey data back to a uniform database that can be used between agencies, which can also share management responsibilities. Under these circumstances, sensors can result in a cost savings to the DOT because they provide information without requiring field visits in most cases. Additionally, data captured in this way can be reviewed and analyzed to support decision making on needed action in maintenance.
6.5 Taking on New Roles Throughout this research effort, DOTs expressed concerns about declining staff levels and budgets and the challenge of taking on new work. At the same time, DOTs are also more committed than ever before to environmental stewardship and advancing toward sustainability. DOT staff are devoted public servants who want to see public dollars used wisely and productively for the environment and the larger public. As it turns out, there is much DOTs can do to advance stewardship and sustainability, in the context of managing transportation corridors for environmental benefit. The possibility of new data and information system advances will make environmental corridor management even more practical in the future.
NCHRP 25‐25/63 Environmental Corridor Management
132
7 APPENDIX
7.1 Highlights and Summary of Findings From DOT Outreach: DOTs’ Reality and Recommendations for the Future
Between the survey, focus groups and discussions at the Maintenance Management Conference, and phone interviews, the research team spoke with representatives from approximately 75% of all DOTs. The complete survey results are available as a Technical Memorandum on the NCHRP 25‐25/63 research. A summary follows.
Half of states are identifying environmental enhancements or developing environmental goals applied on corridors, though management on a corridor basis was not considered particularly practical. Management by corridors may be in the future though. One DOT said: “not yet”, but they’ve been thinking about environmental corridor management “for the last 15+years. We are early in the process of evaluating and integrating ecological resources programmatically. Our Redbook Protected Areas Program has been in place for 15 years and is being updated to include new sites where endangered species and/or their associated habitats are within the right‐of‐way and can be actively or passively managed and protected.” One state was conducting environmental assessments of all their maintenance programs, with a full programmatic EIS on their Pest Management Program. Another said yes because their state has “three projects with corridor vegetation management plans.” In another case, programmatic environmental goals or BMPs were designed for all maintenance activities affecting the roadside in a third of the state, in a particular ecoregion (CDOT Shortgrass Prairie Initiative). Tennessee DOT has recently developed a "Maintenance Management System" and a process to better track project commitments throughout the project development process so that long‐term maintenance needs can be better identified.
DOT environmental stewardship policies and commitments are the primary driver in DOTs’ enhancement work or management of land owned by the DOT for environmental benefits. Context sensitive solutions and Eco‐Logical and Green Infrastructure approaches were also mentioned as feeding in. Generally, there has yet to be much or any connection between maintenance plans and state wildlife conservation plans.
When asked why corridor approaches to environmental management are not being used, most DOTs gave reasons relating to how work is handled; e.g., on a district, region, county, or contract level, or via statewide approaches. DOTs said that services for the corridor, like mowing, are really handled in a wider area approach, branching highways are done at the same time. Maintenance crews do mowing on a county basis. Costs and available resources, or lack of staff and funds, were frequently mentioned as a limitation in doing any more with regard to the environment, though staff might want to do so. As one DOT said, “the money is used from the center line out.” Another said, To have responsibilities beyond the standard duties (more widespread approaches) would be prohibitive to the overall cost of maintenance. Treating all areas the same requires less planning and training. Participants said GIS and efforts to coordinate IT efforts have also been underfunded.
DOTs said a corridor approach to environmental management (and maintenance) would be a new paradigm. DOTs made comments such as “there is a big learning curve. Maintenance has no expertise in this area” or that the enhancement approach wasn’t feasible or on the radar; “we are
NCHRP 25‐25/63 Environmental Corridor Management
133
trying to keep our environmental impacts to a minimum – that’s our approach.” As one said, “Maintenance is used to dealing with the issues where and when they come up. Corridor plans have been slow to develop here; using a checklist/plan that applies to all property is a simpler approach.” Another said, “Maintenance staff tends to be focused on day‐to‐day activities and immediate needs. They are trying to take a broader look at environmental management, but this has been a slow process. We tend to look at it on a statewide or regional basis rather than smaller corridors.”
One DOT pointed out that environmental priorities are typically developed as part of NEPA documents. While commitments may “come in” on a corridor basis, that isn’t how Maintenance manages their work. DOTs said traffic levels were a corridor consideration in maintenance; however, most of the other drivers or considerations for environmental work or planning were area‐wide; e.g. geography and climate, Statewide Conservation Priorities, threatened and endangered species management or recovery plans, regulations, funding, and department policy and procedure.
The practicality of a corridor approach was questioned. DOTs generally thought it would be difficult to implement. DOTs said:
• “The corridor crosses too many jurisdictional lines, with different budgets managing the corridor.”
• “Corridors don’t form a cohesive unit. Corridors typically cross multiple ecosystems making cohesive environmental management difficult.”
• “There are too many corridors to manage this way. Treating all areas the same requires less planning and training.”
• And even from a very progressive, environmentally savvy state: “Few corridors maintained by the DOT are so environmentally distinct to make corridor‐based management widely feasible.”
• “Our agency (and probably many DOTs) still looks at projects rather than corridors. The focus is on the immediate action and the specific location of an activity or project. Also, the agency structure, wherein regions are expected to deliver their program (capital projects or maintenance) and are measured on their success, doesn’t facilitate looking beyond regional boundaries. Budgets and schedules are tight, so it is difficult to foster opportunities or incentives to collaborate with other regions that may have different approaches or priorities. Consequently, even if we were to look at ‘corridors,’ they may become truncated at regional lines. Also, DOTs tend to look at corridors from a travelling or road system perspective, whereas resource agencies may be more inclined to look from a landscape (e.g., watercourses, ecosystems, etc.) perspective.
Essentially the discussion and feedback pointed to DOTs not seeing the need for a corridor approach to environmental management. A particular barrier at the moment is also that “data on exact ecosystem needs and constraints is lacking.” If this information was present and available, it might be incorporated, on a corridor or regional basis. When we asked maintenance managers how existing state and NGO watershed, conservation, and environmental restoration plans could be incorporated into environmental corridor management, almost half skipped the question, said

NCHRP 25‐25/63 Environmental Corridor Management
134
they didn’t know, or that “it would take a change in mind‐set to incorporate any of these into maintenance, and then it may not be practical.” The upshot is that the other half thought it was possible or might be possible.
On the upside for corridor‐based approaches, one DOT said they were doing it. Another said that corridor environmental management is “in the beginning stages, but may not progress much more in the near future without additional staff.” Other positive responses were that:
• The highway beautification folks think corridors, for example Scenic Highways.
• Regarding invasive species and habitat management, slow progress is occurring (due to competing priorities department wide). However, our corridor planning tools for environmental management have become much more sophisticated with GIS use in the last year.
• Now efforts are being made to coordinate GIS resources and funding to bring transportation to the same level as the resource agencies.
We also asked what management factors, reasons, and/or opportunities might be relevant in deciding how and whether to extend environmental management on a corridor basis? Availability of staff and funding was mentioned by a third of respondents. Other important drivers included:
• Environmental factors, such as unique environmental features, listing of a species as threatened or endangered, action by a regulatory agency, or need to mitigate or otherwise address environmental impacts.
• Environmental planning information could make environmental corridor management more meaningful and practical, for example, if information was available on agency conservation and restoration priorities and environmentally sensitive areas in the corridor.
• Potential cost savings to the DOT, if it costs more not to manage on a corridor basis, then environmental corridor management could become a cost of doing business. Either by losing funds or gaining funds, once management buys into the idea and the workforce becomes familiar with the process then additional funding will not be needed. NEPA requirements might be grouped in more specialized areas, rather than regionally.
• Staff with knowledge in both environment and maintenance
• Conditions that impair safe highway operation
• Potential for major projects in Maintenance (and accompanying time and money)
Environmental priorities in Maintenance. Environmental priorities in maintenance are largely dictated by regulation. Stormwater, regulated under the Clean Water Act, has received the widest attention and funding. Most maintenance effort relating to clean water has focused on maintenance yards, not corridors. Larger, multi‐resource environmental plans are almost never developed; NYSDOT’s Blue and Green Highways and new GreenLITES program are departures. Mowing, litter, erosion and sedimentation remediation, protection of populations of rare plants, or culvert retrofits were occurring, typically as very separate initiatives, tracked differently. The literature review and framework provided in the NCHRP 25‐25/63 report provides a detailed review of existing systems for environmental tracking and priority setting in maintenance, for these various program areas.

NCHRP 25‐25/63 Environmental Corridor Management
135
Some DOTs indicated that funding tends to be the largest influence on prioritization, along with coordination with region/district priorities. Others said setting of environmental priorities in maintenance was not standardized in a particular way, or that what environmental work occurred was essentially outsourced to other parts of the agency or external organizations. Many said the question was not applicable, “there are no priorities” or “if a different management strategy appears to be appropriate, we try to adjust practices within that area.”
New York State DOT has involved Maintenance staff in setting corridor environmental priorities through the Green and Blue Highways Program. NYSDOT’s Green and Blue Highways Program addresses the question of how the DOT and its employees can bring the agency priority to “Improve Environmental Conditions” into their daily work. The Maintenance Office initiated the grassroots effort in 2005 to capitalize on field staff insights and capabilities.
In the Blue and Green Highways initiative, each region or residency selects a highway segment, based on environmental and cultural features and operational needs. Then region or residency staff conduct a windshield survey of each segment. The region/residency then prepares a stewardship plan, carries it out, and evaluates and reports accomplishments regularly. The program has succeeded in bringing the environmental stewardship message to the front lines of the agency’s largest workforce and making it real and meaningful.
In some states, regulatory agencies review, comment, or make suggestions on maintenance plans, but in general, such coordination is site specific and limited. As one said “coordination with regulatory agencies depends upon the location and nature of the resources potentially impacted.” Agencies may “review our permit application for specific activities” or “on a project‐by‐project basis as funding is available and projects are deemed jurisdictional. Because our own standards for environmental management exceed most regulatory requirements, few comments are offered.”

NCHRP 25‐25/63 Environmental Corridor Management
136
7.2 NCDOT Environmental Maintenance Evaluations Inform Individual Performance Review
The sheets on the following pages review the functional performance of various environmental elements. These ratings are taken into consideration in performance evaluations of maintenance supervisors.
North Carolina utilizes functional work group work sheets for stormwater, vegetation, litter, landscape beds, right‐of‐way fence maintenance, and rest area‐utility maintenance.

NCHRP 25‐25/63 Environmental Corridor Management
137
ROADSIDE
Functional Work Group Worksheet Element: Roadside Asset: Storm Water Device (NPDES) Activities: Maintenance of Storm Water Device Condition Indicator: Not Functioning as Designed Performance Measure: Percent that is functioning (In Compliance)
LOS Category LOS Description
A 95-100% of the Devices are Functioning as designed
B 90 – 95% of the Devices are Functioning as designed
C 85 – 90% of the Devices are Functioning as designed
D 80 – 85% of the Devices are Functioning as designed
F < 80% of the Devices are Functioning as designed
Statewide Regional Subregional Division County Performance Target C C C Assessment Method SWDCA SWDCA SWDCA Does Assessment Data exist YES YES YES Desired level of survey YES YES YES Does Feature Inventory exist YES YES YES Desired level of Feature Inventory YES YES YES
Performance Target - A performance target is a goal or objective for the condition of assets or the road system.
Assessment Method - The method recommended for appraising the asset or activity- random sample, % of total, 100% assessment, etc Does Assessment Data exist - Does the data exist and at what level. Desired level of survey - Should the assessment be conducted down to the various management levels.
Does Feature Inventory exist - Does the numerical count of the asset exist in detail and at what management level.
Desired level of Feature Inventory - Should detail information exist for the numerical count of the asset and at what management level.

NCHRP 25‐25/63 Environmental Corridor Management
138
ROADSIDE
Functional Work Group Worksheet Element: Roadside Asset: Vegetation Activities: Miscellaneous Vegetation Condition Indicator: Uncontrolled Growth at Signs and Guardrail Performance Measure: Feet
LOS Category LOS Description
A 5% or less of sample area is with in the condition indicator
B 10% or less of sample area is with in the condition indicator
C 15% or less of sample area is with in the condition indicator
D 25% or less of sample area is with in the condition indicator
F >25% or less of sample area is with in the condition indicator
Statewide Regional Subregional Division CountyPerformance Target B C C Assessment Method MCA MCA MCA MCA MCA Does Assessment Data exist YES YES YES YES YES Desired level of survey YES YES YES YES YES Does Feature Inventory exist YES YES NO NO NO Desired level of Feature Inventory YES YES YES YES YES
Performance Target - A performance target is a goal or objective for the condition of assets or the road system.
Assessment Method - The method recommended for appraising the asset or activity- random sample, % of total, 100% assessment, etc Does Assessment Data exist - Does the data exist and at what level. Desired level of survey - Should the assessment be conducted down to the various management levels.
Does Feature Inventory exist - Does the numerical count of the asset exist in detail and at what management level.
Desired level of Feature Inventory - Should detail information exist for the numerical count of the asset and at what management level.

NCHRP 25‐25/63 Environmental Corridor Management
139
7.3 D.C. DOT EMS Tracks Environmental Commitments in Maintenance The District of Columbia DOT is among the most recent to design a plan for an Environmental Management System and the agency has distinctive plans to track performance of environmental commitments in maintenance. Overall, the agency has set a target of a 95% completion rate for environmental commitments and features as planned. To check, the agency plans semi‐annual reviews during construction, scoring a checklist of environmental commitments. The agency aims for a score of at least 95% on routine evaluations performed by PM/site staff and at least 90% on spot checks performed by EP Staff. As a follow up where corrective action is needed, the agency set a target of 95% for follow through on corrective actions and 90% for preventive actions, to be reviewed quarterly. Finally and notably, environmental commitments on maintenance activities will also be evaluated, comparing those performed to those planned/ scheduled, with a target of completing 95% of that which is scheduled.181
How needed maintenance is to be identified, programmed, and scheduled is not addressed in the plan, though the plan lists as “Key Elements of Operation and Maintenance:”182
• Develop maintenance plans and budgets that reflect environmental commitments and requirements.
• Maintain and monitor, as applicable, environmental features and requirements.
• Verify conformance.
• Take actions, as needed, to ensure conformance.
• Provide environmental assistance and support.
As in many other DOTs, compliance will rely on “spot checks” performed by EP Staff, presumably as they are available. The project manager and environmental staff are supposed to identify commitments and requirements to be monitored – requiring periodic examination or sampling (e.g., assessment of vegetation); or maintained – features (e.g., catch basins or sediment control ponds) that require ongoing maintenance to function as intended and determine associated actions and schedules. However, the “when” and “how” are more vague: “as identified during the course of a project” and “capture information as commitments are agreed upon.” Then “assigned staff” are to “fulfill requirements as identified in preceding action in accordance with schedule and assessment needs.”
“Staff identified as responsible in preceding actions” will in turn “review practices and measures to ensure conformance” and “provide assessment results to the Project Manager.” The Project Manager and Environmental staff will conduct periodic assessments to evaluate and ensure day‐to‐day conformance and if needed, identify corrective and preventive actions to address findings and assign responsibility and schedule for action/s. Assigned staff will implement corrective and preventive actions in accordance with an action schedule shown below.

NCHRP 25‐25/63 Environmental Corridor Management
140
Figure 38: District of Columbia DOT Environmental System Management Plan, Oct. 2008.
Implementation tools include an Environmental Evaluation Form, Sample Commitments and Requirements Summary, and Sample Commitments and Requirements Fulfillment Checklists. The Commitments and Requirements summary sheet includes the following maintenance stage actions:
• Description of maintenance required for the commitment
• Maintenance unit informed of requirement
• Maintenance unit acknowledgement of receipt
With regard to monitoring, DDOT intends to track:
• Description of monitoring required for the commitment
• Designated unit/individual informed of commitment
• Designated unit or individual acknowledges receipt of commitment
With regard to agency coordination, DDOT will track the extent to which the regulatory agency is informed of a commitment as it is incorporated into Design/Construction documents and agency acknowledgement of completion of commitment as described.183

NCHRP 25‐25/63 Environmental Corridor Management
141
8 References 1 NCHRP 25‐25/63 kick‐off meeting with the panel and research team, April 2009. 2 The formal title of the SHRP C06 project is “Integration of Conservation, Highway Planning, and Environmental Permitting Environmental Permitting Using an Outcome‐Based Ecosystem Approach.” More information on this project can be found at TRB’s website; see: http://144.171.11.40/cmsfeed/TRBNetProjectDisplay.asp?ProjectID=2423. 3 The NCHRP 25‐25/04 compendium is available online at: http://environment.transportation.org/environmental_issues/construct_maint_prac/compendium/manual/. 4 More information on NYSDOT’s Green and Blue Highways initiative is available at: https://www.nysdot.gov/divisions/operating/oom/transportation‐maintenance/green‐blue‐highways. 5 Yi Lin Pei et al., “Performance Measurement Frameworks and the Development of Effective Sustainable Transport Strategies and Indicators,” TRB 2010 Annual Meeting, Washington, DC, January 2010, http://pressamp.trb.org/compendium/508/202416C9D66D.pdf. 6 For more information on this topic, please see NCHRP 25‐25/60, Increased Use of Environmentally Preferable, Non‐Toxic Products to Reduce Costs, Liabilities, and Pollution at DOT Offices, Maintenance Facilities and Rest Stops. 7 S. Muench et al., “Greenroads,” paper and presentation from the TRB 2009 Annual Meeting, Washington, DC, January 2009. Also see http://www.greenroads.us/. 8 Ibid. 9 NYSDOT, GreenLITES Operations Certification Program, October 2009, https://www.nysdot.gov/programs/greenlites/operations‐cert. 10 Ibid. 11 Ibid. 12 J.A. Gambatese, “Sustainable Roadway Construction: Energy Consumption and Material Waste Generation of Roadways,” Construction Research Congress, 2005, 183. 13 H. Birgisdóttir, “Life Cycle Assessment Model for Road Construction and Use of Residues from Waste Incineration,” Ph.D. Thesis, Institute of Environment & Resources, Technical University of Denmark, 2005; U‐M Mroueh, P. Eskola, and J. Laine‐Ylijoki, . “Life‐Cycle Impacts of the Use of Industrial By‐Products in Road and Earth Construction,” Waste Management, 2001, 21, pp. 271‐277; U‐M Mroueh et al., “Life Cycle Assessment of Road Construction,” Finnra reports, Helsinki, 17/2000; H. Stripple, “Life Cycle Assessment of Road: A Pilot Study for Inventory Analysis,” Second Revised Edition, IVL Swedish Environmental Research Institute, Gothenburg, Sweden, 2001. All cited in Katriina Parikka‐Alhola and Ari Nissinen, “Environmental Impacts of Transport as Award Criteria in Public Road Construction Procurement,” forthcoming, Elsevier, 2010. 14 Marie Venner, AASHTO Compendium of Environmental Stewardship Practices, Policies, and Procedures for Road Construction and Maintenance, 2004; Gambatese, 2005. 15 Gambatese, 2005. 16 Birgisdóttir et al., 2006; Mroueh, et al., 2001; Stripple, 2001; Olsson et al., 2006; Eskola et al., 1999; Pereira et al., 1998; all cited in Katriina Parikka‐Alhola and Ari Nissinen, “Environmental Impacts of Transport as Award Criteria in Public Road Construction Procurement,” forthcoming, Elsevier, 2010. 17 J.C. Lee et al., “Quantitative Assessment of Environmental and Economic Benefits of Using Recycled Construction Materials in Highway Construction,” TRB 2010 Annual Meeting, Washington, DC, January 2010. 18 The same layer thicknesses were used in the conventional and alternative designs and the structural capacity of both pavements was determined using the same procedure; however, the recycled materials have different engineering properties than the conventional materials, which resulted in differences in the calculated service life. The pavements were assumed to be serviceable until the international roughness index (IRI) reached 2.7 m/km, as recommended in FHWA. Once this IRI was reached, the pavement was assumed to require rehabilitation. The IRI
NCHRP 25‐25/63 Environmental Corridor Management
142
was predicted using the Mechanistic‐Empirical Pavement Design Guide (M‐EPDG) Version 1.0. M‐EPDG primarily uses three key variables in the analysis: (1) traffic data, (2) climate conditions, and (3) material properties. The conventional and recycled material designs reach their terminal serviceability at 29 and 32 yr, respectively. The service life for the pavement using recycles materials is 3 years longer because of the superior properties of the recycled materials relative to the conventional materials. 19 See previous note. 20 Lee et al., 2010. 21 Ibid. 22 Ibid. 23 Ibid. 24 R. H. Socolow and S. W. Pacala, “A Plan to Keep Carbon in Check,” Scientific American, September 2006, Vol. 295, pp. 50‐57. 25 Lee et al., 2010. 26 A. C. Carpenter et al., “Life Cycle Based Risk Assessment of Recycled Materials in Roadway Construction,” Waste Management, 2007, 27, pp. 1458 ‐1464. 27 Lee et al., 2010. 28 U.S. EPA, Office of Solid Waste, “RCRA Hazardous Waste Delisting: The First 20 Years,” June 2002, http://www.epa.gov/waste/hazard/wastetypes/wasteid/delist/report.pdf. 29 Lee et al., 2010. 30 Ibid. 31 Ibid. 32 Christopher Robinette and John Epps, “Energy, Emissions, Material Conservation and Prices Associated with Construction, Rehabilitation and Material Alternatives for Flexible Pavement,” TRB 2010 Annual Meeting, Washington, DC, January 2010. 33 Ibid. 34 Parikka‐Alhola and Nissinen, forthcoming 2010. 35 See www.wsdot.wa.gov/NR/rdonlyres/3D73CD62‐6F99‐45DD‐B004‐D7B7B4796C2E/0/EcologyEmbankmentTEER.pdf. 36 U.S. EPA, “Golden Compost: Texas Roadside Composting,” http://www.epa.gov/osw/conserve/rrr/greenscapes/projects/tx_road.htm. 37 Tony Redington, “Modern Roundabouts, Global Warming, and Emissions Reductions: Status of Research, and Opportunities for North America,” Vermont Agency of Transportation, 2001, www.nh.gov/oep/resourcelibrary/referencelibrary/r/roundabouts/documents/vermontctrfpaper.pdf. 38 Robert G. Schiffer, M. Walter Steinvorth, and Ronald T. Milam, “Comparative Evaluations on the Elasticity of Travel Demand,” TRB 2005 Annual Meeting, Washington, DC, January 2005, http://www.trb‐forecasting.org/papers/2005/ADB40/05‐0313_Schiffer.pdf. 39 Todd Litman, “Generated Traffic and Induced Travel: Implications for Transport Planning,” Victoria Transport Policy Institute, February 3, 2009, http://www.vtpi.org/gentraf.pdf. 40 Cambridge Systematics, Inc., Moving Cooler: An Analysis of Transportation Strategies for Reducing Greenhouse Gas Emissions, prepared for the Urban Land Institute, July 2009, http://www.movingcooler.info/. 41 U.S. DOT Secretary Ray LaHood, prepared testimony for the U.S. Senate Committee on Environment and Public Works, hearing on Transportation’s Role in Climate Change and Reducing Greenhouse Gases, July 14, 2009. 42 U.S. DOT, “First Steps Toward Livable Communities,” Fast Lane: Official Blog of the U.S. Secretary of Transportation, March 22, 2009, http://fastlane.dot.gov/2009/03/first‐steps‐toward‐livable‐communities.html. 43 USDOT provides more information on its Livability Initiative at: http://www.fhwa.dot.gov/livability/.

NCHRP 25‐25/63 Environmental Corridor Management
143
44 The handbook can be found online at: http://www.oregon.gov/ODOT/HWY/BIKEPED/docs/mainstreethandbook.pdf. 45 Massachusetts DOT Project Development & Design Guide, January 2005, http://www.mhd.state.ma.us/default.asp?pgid=content/designguide&sid=about. 46 Scott Taylor and Scott McGowen, “Best Practices in Addressing NPDES and Other Water Quality Issues in Highway System Management: A Report from NCHRP 20‐68A, Scan 08‐03,” TRB 2010 Annual Meeting, Washington, DC, January 2010, p. 3. The full report is available at: http://onlinepubs.trb.org/onlinepubs/nchrp/docs/NCHRP20‐68A_08‐03.pdf. 47 Ibid. 48 Marie Venner, “National Performance Review: Examination of Environmental Commitment Tracking Systems in Six States,” prepared for FHWA, 2008. 49 Gayle F. Mitchell, R. Guy Riefler, and Andrew Russ, “Removal of Pollutants from Simulated Highway Runoff Using a Vegetated Biofilter,” TRB 2010 Annual Meeting, Washington, DC, January 2010. 50 Matt Lauffer, North Carolina DOT, personal communication, March 1, 2010. 51 Transportation Research Board (TRB) Committees AFF70 (A2C06) Culverts and Hydraulic Structures, AHD10 (A3C01) Maintenance and Operations Management, and AFB60 (A2A03) Hydrology, Hydraulics and Water Quality, Call for Papers, “Systems for Assessment and Management of Highway Culverts,” 2004. 52 Leroy Irwin, FDOT Environmental Manager, personal communication, April 2003. 53 Michael Barber, Shari Schaftlein, and Dale Anderson, WSDOT, “Stormwater Runoff Cost/Benefit Project: Prioritizing Stormwater Outfalls,” WA‐RD 418.1, NTIS publication number PB98‐108962, 1997. 54 Maryland State Highway Administration, NPDES Procedure Manual, January 2001. 55 Oregon DOT, working draft data fields for Drainage Management System, 2004. 56 Heinz Stefan et al., “Study of Environmental Effects of De‐Icing Salt on Water Quality in the Twin Cities Metropolitan Area, Minnesota,” Report No.: 2008‐42, September 2008, http://www.lrrb.org/pdf/200842.pdf. 57 California DOT, “Storm Water Pollution Prevention Maintenance Bulletin,” November 25, 1998, Vol. 1, Issue 10, http://www.dot.ca.gov/hq/env/stormwater/_pdfs/maintain/m11_98.pdf. 58 Stefan et al., 2008. 59 Minnesota DOT, Research Services Section, “Using Real‐Time Road Condition Measurements for Automated Winter Road Maintenance,” Technical Summary, July 15, 2008, http://www.lrrb.org/pdf/200737ts.pdf. More details are also available in a 2009 research synthesis at http://www.lrrb.org/pdf/trs0902.pdf. 60 Dennis Burkheimer and Bob Younie, Iowa DOT, personal communication, Nov 16‐18, 2009. 61 Bruce Erickson, Oregon DOT Fleet Services Manager, personal communication, Nov. 17, 2009. 62 Burkheimer and Younie, 2009. 63 NYSDOT, CC EE Annual Report, 2009. 64 Minnesota DOT, “Anti‐icing in Winter Maintenance Operations: Examination of Research and Survey of State Practice,” Transportation Research Synthesis 0902, May 2009, http://www.lrrb.org/pdf/trs0902.pdf 65 NCHRP 25‐25/04; R. D. Tabler, “Design Guidelines for the Control of Blowing and Drifting Snow.” SHRP‐H‐38, National Research Council, Washington, DC, 1994, http://www.trb.org/publications/shrp/SHRP‐H‐381.pdf; Federal Highway Administration, “Snow Fences Save Money and Lives,” FHWA‐SA‐96‐045 (CS101), Transportation Research Board, Washington, DC, http://www.fhwa.dot.gov/winter/roadsvr/CS101.htm. 66 Ibid. 67 Minnesota DOT, “Living Snow Fences,” http://www.dot.state.mn.us/environment/livingsnowfence/index.html. 68 Iowa DOT, “Snow Fence Information,” http://www.iowadot.gov/maintenance/snowfence.html. 69.J.B. Callicot and G.K. Lore, “The Nature of Roadsides and the Tools to Work with It,” Federal Highway Administration, Office of Natural and Human Environment, FWHA –EP‐03005, Washington, DC, 1999.
NCHRP 25‐25/63 Environmental Corridor Management
144
70 Bonnie Harper‐Lore, FHWA, personal communication with NYSDOT, December 2008, and with Marie Venner, November 2009. 71 Jaskiewicz, 2001, cited in John D. Bullough et al., “Lighting and Vegetation for Energy‐Efficient and Safe Roadway Travel,” prepared by the Lighting Research Center, Rensselaer Polytechnic Institute, for NYSDOT and the NYS Energy Research and Development Authority, May 2009, https://www.nysdot.gov/divisions/engineering/technical‐services/trans‐r‐and‐d‐repository/LightingVegetation‐C‐08‐03‐10628.pdf. 72 Bullough et al., 2009. 73 Mundell, 1998, cited in Bullough et al., 2009. 74 FHWA, Environmental Excellence Awards, Excellence in Roadside Resource Management and Maintenance, Nebraska Department of Roads: Plan for the Roadside Environment, 2009. 75 K. Green, “Don’t Scare the Fish,” Roads & Bridges, Vol. 39, No. 6, (May 2001) 76 Marie Venner, 2002 survey. 77 Mehmet E. Ozbek, Jesus M.de la Garza, and Juan C. Pinero, “Implementation of the Level‐of‐Service Component of the Performance Measurement Framework for Performance‐Based Road Maintenance Contracts,” presented at the 2010 TRB Annual Meeting, Washington, DC, January 2010. Also see Otto and Ariaratnam. 78 Ibid. 79 Washington State DOT, “WSDOT MAP Field Data Collection Manual – Volume 1,” September 2003, p. 22. 80 Washington State DOT, “Maintenance: Balanced Level of Service Priorities for 2009‐2011 Budget,” July 2009, www.wsdot.wa.gov/NR/rdonlyres/5558D96F‐BE37‐4503‐B020‐0C1152CB13B0/0/0911BalancedLOSPriorities.pdf. 81 Joseph Cortright, “Walking the Walk: How Walkability Raises Housing Values in U.S. Cities,” prepared for CEOs for Cities, August 2009, http://www.ceosforcities.org/pagefiles/WalkingTheWalk_CEOsforCities.pdf. 82 Washington State DOT, “Neighborhood Factors Influence How People Travel,” http://www.wsdot.wa.gov/NR/rdonlyres/2F764D40‐0A4B‐4D9D‐9535‐8D1B18DA036B/0/P3KarenaHouser.pdf. 83 Institute of Transportation Engineers and Congress for the New Urbanism, “Designing Walkable Urban Thoroughfares: A Context Sensitive Approach,” prepared for FHWA, March 2010. 84 John Church, , Extension Educator, Natural Resources, University of Illinois Extension, LGIEN Fact Sheet Series 2001‐013, “Environmental Corridors: “Lifelines for Living,” http://www.extension.uiuc.edu/factsheets/LGIEN%202001‐0013.pdf. 85 Ibid. 86 Conover et al., 1995, Tardif and Associates, Inc., 2003, Huijser et al., 2007b, cited in M. P. Huijser et al., “Cost–Benefit Analyses of Mitigation Measures Aimed at Reducing Collisions with Large Ungulates in the United States and Canada; a Decision‐Support Tool,” Ecology and Society, 2009, 14(2): 15, http://www.ecologyandsociety.org/vol14/iss2/art15/. 87 Ibid. 88 Ament et al., Western Transportation Institute, 2008; Gryz and Krauze, 2008. 89 Oregon DOT, “Key Performance Measure #17: Fish Passage at State Culverts: Number of High‐Priority ODOT Culverts Remaining to be Retrofitted or Replaced to Improve Fish Passage,” January 26, 2009, http://courts.oregon.gov/DAS/OPB/docs/APPR08/Agency_Links/86_87_ODOT_pm17.pdf. 90 Washington State DOT, “July 2009 Fish Passage Report,” http://www.wsdot.wa.gov/NR/rdonlyres/5853B636‐3DE7‐482D‐A0C3‐E7BD8C886CD5/0/2009FishPassageRpt.pdf. 91 Ibid. 92. Green, K., “Don’t Scare the Fish,” Roads & Bridges, Vol. 39, No. 6, (May 2001) 93 Al Gore, “We Can’t Wish Away Climate Change,” The New York Times, February 27, 2010, http://www.nytimes.com/2010/02/28/opinion/28gore.html. 94 D. R. Carder et al., “Motorway Noise Barriers as Solar Energy Generators,” ICE Proceedings: Engineering Sustainability, March 2007, Vol. 160, Issue: 1, pp. 17‐25.

NCHRP 25‐25/63 Environmental Corridor Management
145
95 Ibid. 96 Ibid. 97 Rebecca Smith and Russell Gold, “New Jersey Outshines 48 of Its Peers in Solar Power,” The Wall Street Journal, July 31, 2009, p. A5. 98 Massachusetts Executive Office of Transportation, “Patrick Administration Approves Easement for Town of Carver Photovoltaic Project: Would be First Solar Array Along Massachusetts Highway,” press release, December 3, 2009. 99 Smith and Gold, 2009. 100 Ibid. 101 Ibid. 102 Oregon DOT, http://www.solaroregon.org/learn/oregon‐solar‐resource. 103 Oregon DOT, “Innovative Partnerships: The Oregon Solar Highway,” http://www.oregon.gov/ODOT/HWY/OIPP/inn_solarhighway.shtml, page updated Dec. 1, 2009. 104 To see how much energy is being generated at the site, visit: http://www.live.deckmonitoring.com/?id=solarhighway. A segment on the MSNBC nightly news is available at: www.msnbc.msn.com/id/3032619/ns/nightly_news#33968518. 105 R. Kwartin, et al., “An Analysis of the Technical and Economic Potential for Mid‐Scale Distributed Wind,” prepared for the National Renewable Energy Laboratory, U.S. Department of Energy, December 2008, nrel.gov/wind/pdfs/midscale_analysis.pdf. 106 Ibid. 107 Larry Greenemeier, “Hoisting One for Wind Power: Climbing Crane Expected to Keep Vestas Turbines Spinning,” Scientific American, December 22, 2009, http://www.scientificamerican.com/article.cfm?id=wind‐tower‐crane. 108 Robert P. Walzer, “Solar Power Advocates Hopeful for 2010,” website of The New York Times, Green: A Blog About Energy and the Environment, January 19, 2010, http://greeninc.blogs.nytimes.com/2010/01/19/solar‐power‐advocates‐hopeful‐for‐2010/. 109 U.S. Department of Interior, “Agencies Publish Final Environmental Impact Statement on Energy Corridor Designation in the West,” November 26, 2008, http://www.energy.gov/news/6760.htm. 110 U.S. Department of Energy, “West‐wide Energy Corridor Programmatic EIS Information Center,” http://corridoreis.anl.gov. 111 To see the state maps, visit http://corridoreis.anl.gov/eis/fmap/index.cfm. 112 Vendor research, January 2010. 113 Hirak Patangia and Dennis Gregory, “An Efficient Solar Powered Lighting System for Highway Applications,” Arkansas Highways and the University of Arkansas at Little Rock, August 27, 2008. 114 Hirak Patangia, Ph.D., P.E., “Solar Powered Lighting for Overhead Highway Signs,” prepared for FHWA, Mack‐Blackwell Rural Transportation Center, and Arkansas Highway & Transportation Department under Grant Number MBTC 2096, http://www.uark.edu/rd_engr/MBTC/MBTC2096_Final_report%281%29.pdf. Two lighting systems were researched, developed and tested: one system employs LED technology and the other uses CFL technology. The commercial CFL lights are AC powered. For DC operation with photovoltaic energy, a new inverter design was implemented that has better than 95 percent efficiency and total harmonic distortion (THD) less than 15 percent. The design incorporates SLA (Sealed Lead Acid) batteries for energy storage. The inverter is essential when hybrid operation (AC line as well as solar) is desired. When stand‐alone solar power is used, the CFL lights can be directly operated from dc source and thus eliminate the inverter to minimize power losses. 115 Ibid. 116 R.C. Smith and M. Saito, “Development of a Tool for Analyzing the Performance of Solar‐Powered LED Night Delineator,” Applications of Advanced Technologies in Transportation Engineering: Proceedings of the Eighth International Conference, American Society of Civil Engineers, 2004, pp. 340‐344.
NCHRP 25‐25/63 Environmental Corridor Management
146
117 Gibbons et al., “LED Lighting Study for the City of Anchorage,” 2009. 118 Lindsay Audin, “LED Blinks in the Spotlight,” Eng. Syst., 2007, Vol. 24, No. 5, Pg. 32. 119 R. Allan, “LEDs Lighten the Energy Load,” Electronic Design, 2007, Vol. 55, No. 14, Pg. 55‐56. 120 B.J. Huang et al., “Economic Analysis of Solar‐Powered LED Roadway Lighting,” Proceedings of ISES World Congress 2007 (Vol. I – Vol. V) Solar Energy and Human Settlement, 2007, online August 13, 2009. 121 Ibid. 122 Ibid. 123 Marilyn Burtwell, “Lighting the Way for Sustainability,” Highways, 2004, Vol. 73, No. 5, pp. 12‐13. 124 Patrick J. Szary et al., “Use of LED or Other New Technology to Replace Standard Overhead and Sign Lighting (Mercury and/or Sodium),” Rutgers University, prepared in cooperation with New Jersey DOT and FHWA, June 2005, http://www.state.nj.us/transportation/refdata/research/reports/FHWA‐NJ‐2005‐029.pdf. 125 Carl Gardner, “New York Looks Ahead With LED Street Light,” Lighting Journal, Institute of Lighting Engineers, 2006, Vol. 71, No. 4, pp. 22‐24. 126 Eric A. Taub, “Lighting the Big Apple with LEDs,” The New York Times website, August 20, 2008, http://bits.blogs.nytimes.com/2008/08/20/lighting‐the‐big‐apple‐with‐leds/. 127 Caltrans, 2004 Energy Conservation Plan Status Report, http://www.dot.ca.gov/hq/energy/NRGReport04.pdf, p.25; Prey, S.C., “Caltrans Flexes Its Power,” California Department of Transportation Journal, Nov. 2001, Vol. 2, No. 3, pp. 18‐19, 21. 128 R. N. Robertson and J. D. Shelor, “The Applicability of High‐Intensity Sheeting on Overhead Highway Signs,” Virginia Highway & Transportation Research, 1975. 129 Illinois Department of Transportation, “Illinois DOT Green Friendly Practices” (PowerPoint presentation), www.dot.state.il.us/Green%20Friendly%20Presentation2.ppsx. 130 Ibid. 131 Liang Y. Liu, Ph.D., Associate Professor Construction Engineering and Management Program Department of Civil & Environmental Engineering, University of Illinois, personal communication, February 15, 2010. 132 Christopher M. Monsere and Edward L. Fischer, “Safety Effects of Reducing Highway Illumination for Energy Conservation,” TRB 87th Annual Meeting, Washington, DC, 2008. 133 Ibid. 134 Washington State DOT, Illumination & ITS Engineers, personal communications, November 2009. 135 Ibid. 136 Bullough et al., 2009. 137 Ibid. 138 Policies on lighting and highway design are due for revision soon to account for the current state of technologies and industry practices. 139 Bullough et al., 2009. 140 R. Rausch, NY State Department of Agriculture & Markets, personal communication, October 2008, cited in Bullough et al., 2009. 141 T. Kilcer, Rensselaer County Cornell Cooperative Extension, personal communication, October 2008, cited in Bullough et al., 2009. 142 USDOT Volpe Center and FHWA, “Carbon Sequestration Pilot Program: Implementation and Next Steps,” February 2009, http://climate.dot.gov/documents/FINAL_C‐Seq_Report_021109.pdf. 143 FHWA, Regional Traffic Signal Operations Programs: An Overview, October 2009, http://ops.fhwa.dot.gov/publications/fhwahop09007/index.htm. 144 Ibid.

NCHRP 25‐25/63 Environmental Corridor Management
147
145 Washington State DOT, “The Gray Notebook: WSDOT’s Quarterly Performance Report on Transportation Systems, Programs, and Department Management,” November 2009, p. 46. More information on The Gray Notebook is available at: http://www.wsdot.wa.gov/Accountability/. 146 Washington State DOT, “Climate Change Template, Incident Response,” cited in “Cost and Benefit of Transportation Specific MS4 and Construction Permitting,” NCHRP 25‐25/56, expected publication in July 2010. 147 FHWA, Regional Traffic Signal Operations Programs: An Overview, October 2009, http://ops.fhwa.dot.gov/publications/fhwahop09007/index.htm. 148 CH2M Hill, AASHTO Sustainability Briefing Paper, https://www.nysdot.gov/programs/greenlites/repository/AASHTO%20Sustainability%20Briefing%20Paper.pdf. 149 FHWA, Regional Traffic Signal Operations Programs: An Overview, October 2009, http://ops.fhwa.dot.gov/publications/fhwahop09007/index.htm. 150 Ibid. 151 Washington State DOT, “Climate Change Template, Incident Response,” cited in NCHRP 25‐25/56. 152 FHWA, Regional Traffic Signal Operations Programs: An Overview, October 2009, http://ops.fhwa.dot.gov/publications/fhwahop09007/index.htm. 153 CH2M Hill and Good Company, “Transportation and Sustainability: Best Practices Background,” prepared for the AASHTO Transportation and Sustainability Peer Exchange, Gallaudet University, May 27‐29, 2009, https://www.nysdot.gov/programs/greenlites/repository/AASHTO%20Sustainability%20Briefing%20Paper.pdf. 154 Ibid. 155 NYSDOT, CEE Team Accomplishments, 2009. 156 Anna McLaughlin, Transportation Demand Management Coordinator, District Department of Transportation, personal communication, Nov. 18, 2009. 157 Center for Transportation Studies Report, University of Minnesota, December 2009, pp. 1‐2. 158 Ibid. 159 Ibid. 160 U.S. Department of Energy, Energy Information Administration, “World Oil Transit Choke Points,” www.eia.doe.gov/cabs/World_Oil_Transit_Chokepoints/Background.html. 161 RAND Corporation, “Imported Oil and U.S. National Security,” 2009, p. 71. 162 Michael Dewit, AASHTO EMS expert and NCHRP 25‐25/51 co‐author, personal communication. 163 S.L. Jackson, The ISO 14001 Implementation Guide: Creating an Integrated Management System, John Wiley & Sons, February 1997. 164 Michael Dewit, AASHTO EMS expert and NCHRP 25‐25/51 co‐author, personal communication. 165 Western Corridor Water Re‐Use Project (Largest Water Re‐Use Project in Southern Hemisphere), Australia westerncorridor.com.au/media/fact_sheets/Managing_the_Environment_FACT_SHEET.pdf. 166 Ibid. 167 Ibid. 168 Geraldton Southern Transport Corridor, Main Roads Western Australia, Report and Recommendations of the Environmental Protection Authority, Perth, Western Australia, Bulletin 1013, May 2001. 169 Gary McVoy, PhD, NYSDOT Director of Operations and former Director of the DOT’s environmental office. McVoy also points out that “Because NEPA Sec. 102(c) is really about projects (and mostly about stopping them) the environmental process is generally: Adversarial, Project focused / Sub‐optimized, NEPA issues as surrogates, Designed to “stop bad things”, DOT’s “get through the process” , Little attention to the programmatic. 170 M.M. Ryan, and P. Tartline, “Stockpile Management.” Memo to District Engineers, Commonwealth of Pennsylvania, July 13, 1999. 171 Marie Venner, AASHTO EMS Case Study 9, PennDOT EMS. 172 Ibid.

NCHRP 25‐25/63 Environmental Corridor Management
148
173 M.M. Ryan, and P. Tartline, “Winter Material Handling and Storage and Foreman’s Stockpile Checklist Procedure,” Memo to District Engineers, Commonwealth of Pennsylvania, August 9, 2001. 174 Pennsylvania Department of Transportation, Bureau of Maintenance and Operations, “Maintenance Manual: ’Maintenance First’ Thru Quality Assurance.” Assurance Evaluation Indicators Winter Materials (solid), Publication 23, July 2001, Chapter 4. 175 Ken Pace, North Carolina DOT, Environmental Operations Manager, personal communication, March 1, 2010. 176 Marie Venner et al., “Environmental Asset Management at State DOTs,” NCHRP 25‐25/51, June 2009, http://onlinepubs.trb.org/onlinepubs/archive/NotesDocs/25‐25(51)_FR.pdf. 177 District of Columbia DOT Environmental Management System Plan, October 2008, p. 36. 178 AASHTO’s on‐line Compendium of Environmental Stewardship Practices and Procedures can be found at: http://environment.transportation.org/environmental_issues/construct_maint_prac/compendium/manual/ 179 Florida DOT, “2009 Quality/Level of Service Handbook,” 2009, http://www.dot.state.fl.us/planning/systems/sm/los/pdfs/2009FDOTQLOS_Handbook.pdf. 180 Ken Pace and Matt Lauffer, NCDOT, personal communication, March 1, 2010. 181 District of Columbia DOT Environmental Management System Plan, October 2008, p. 59. 182 Ibid., p. 36. 183 Ibid., p. 109.