Embed Size (px)
Citation preview
1
NCEP NAQFC Verification System
Perry Shafran ,Binbin Zhou, Caterina TassoneJeff McQueen,Geoff DiMego
NOAA/NWS/NCEP/EMC
Jerry GorlineNOAA/NWS/MDL
15 June 2015
2
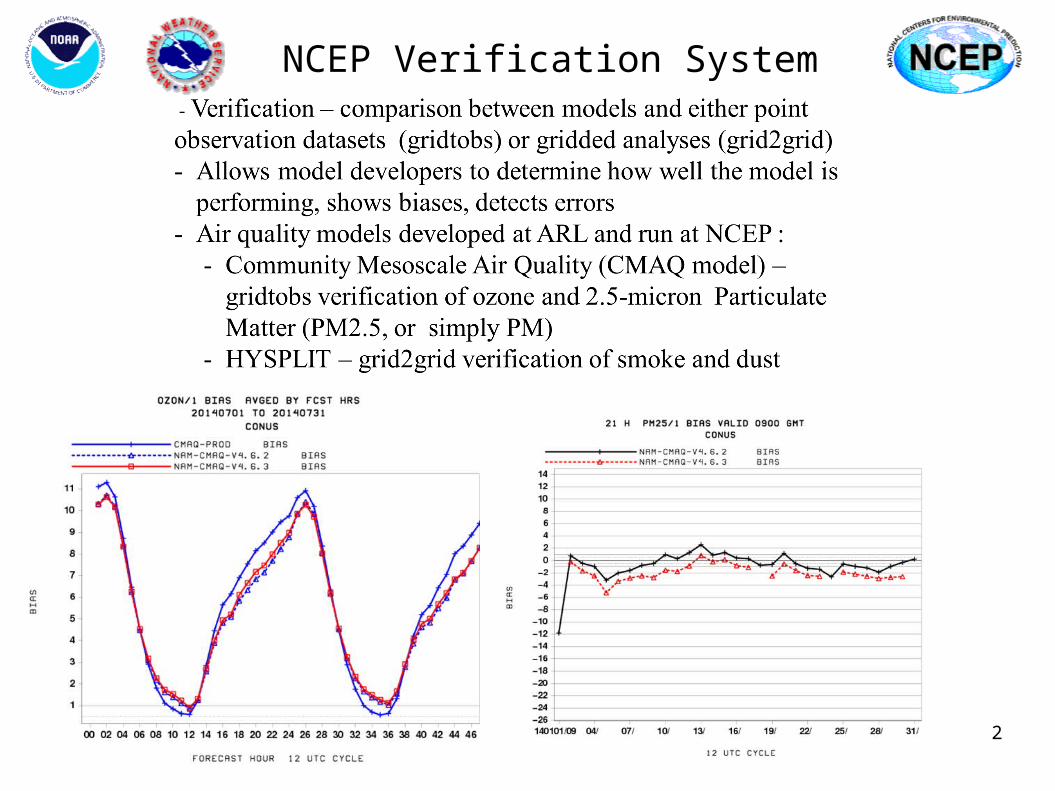
NCEP Verification System

3
NCEP Verification System
- made up of several parts: Editbufr – edits input prepbufr files to output only the preferred obs to be verified Prepfits – interpolates model output to ob location and writes out model-ob pairs Gridtobs – calculates partial sums and writes out sums in VSDB file FVS (Forecast Verification System) – calculates final statistics and produces plots
4
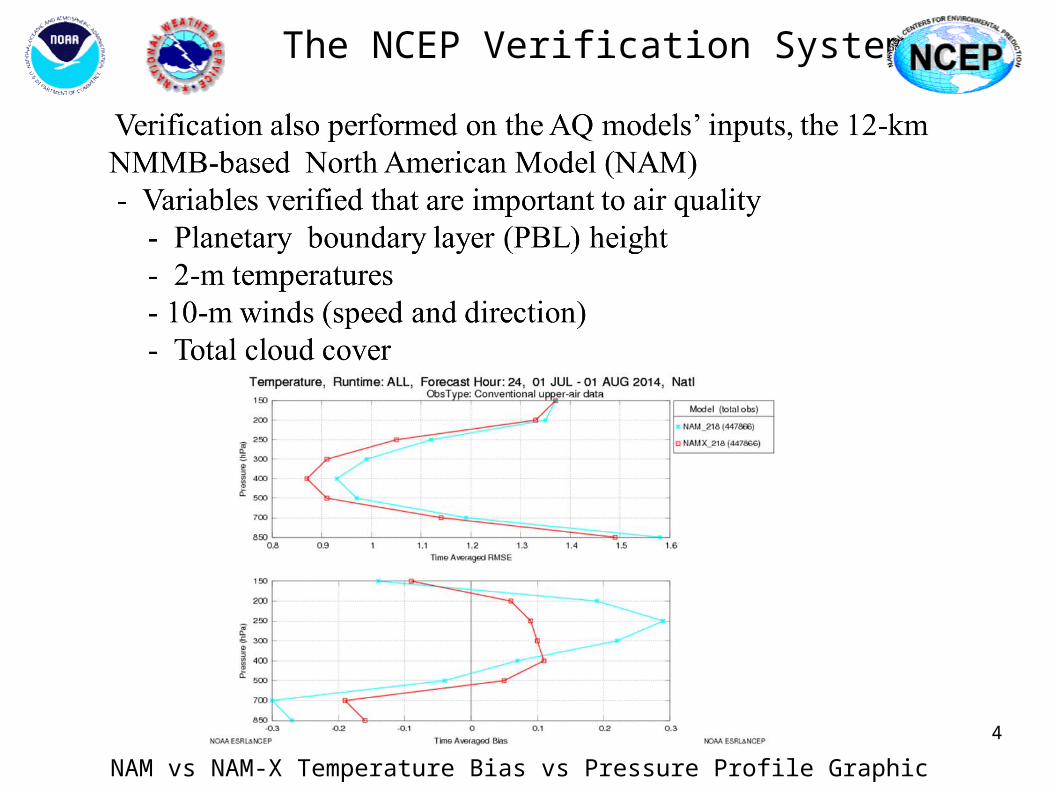
The NCEP Verification System
NAM vs NAM-X Temperature Bias vs Pressure Profile Graphic
5
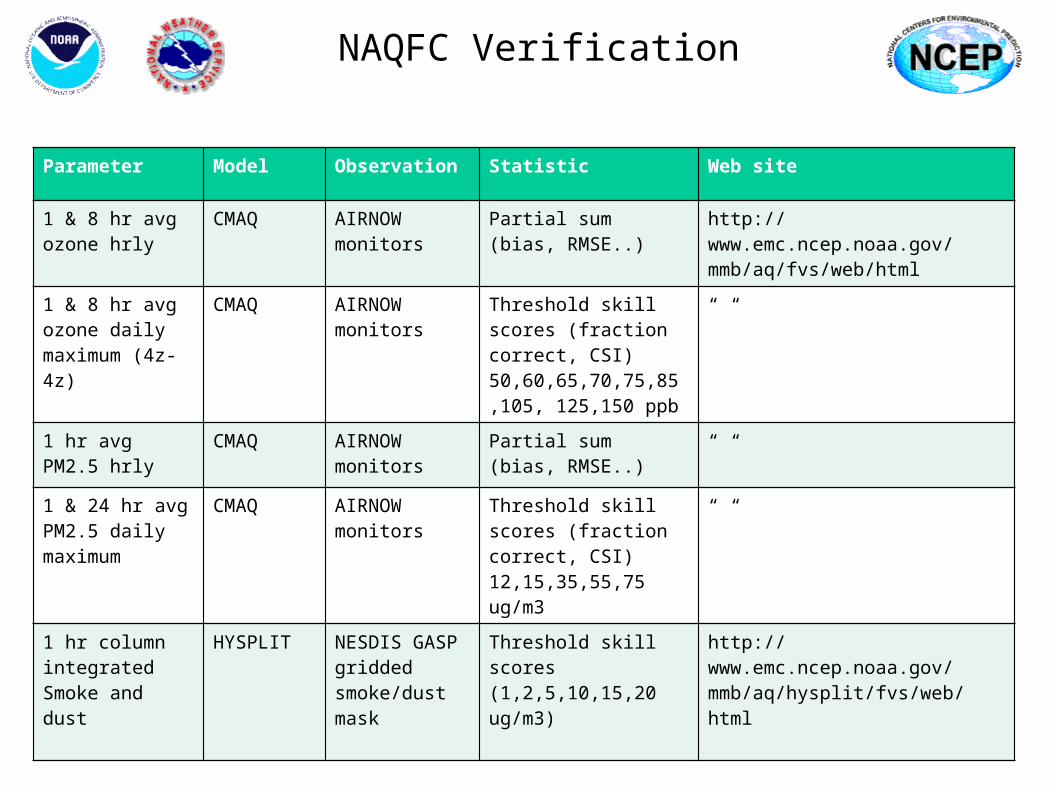
NAQFC Verification
Parameter Model Observation Statistic Web site
1 & 8 hr avg ozone hrly
CMAQ AIRNOW monitors
Partial sum (bias, RMSE..)
http://www.emc.ncep.noaa.gov/mmb/aq/fvs/web/html
1 & 8 hr avg ozone daily maximum (4z-4z)
CMAQ AIRNOW monitors
Threshold skill scores (fraction correct, CSI)50,60,65,70,75,85,105, 125,150 ppb
“ “
1 hr avg PM2.5 hrly
CMAQ AIRNOW monitors
Partial sum (bias, RMSE..)
“ “
1 & 24 hr avg PM2.5 daily maximum
CMAQ AIRNOW monitors
Threshold skill scores (fraction correct, CSI)12,15,35,55,75 ug/m3
“ “
1 hr column integrated Smoke and dust
HYSPLIT NESDIS GASP gridded smoke/dust mask
Threshold skill scores (1,2,5,10,15,20 ug/m3)
http://www.emc.ncep.noaa.gov/mmb/aq/hysplit/fvs/web/html
6
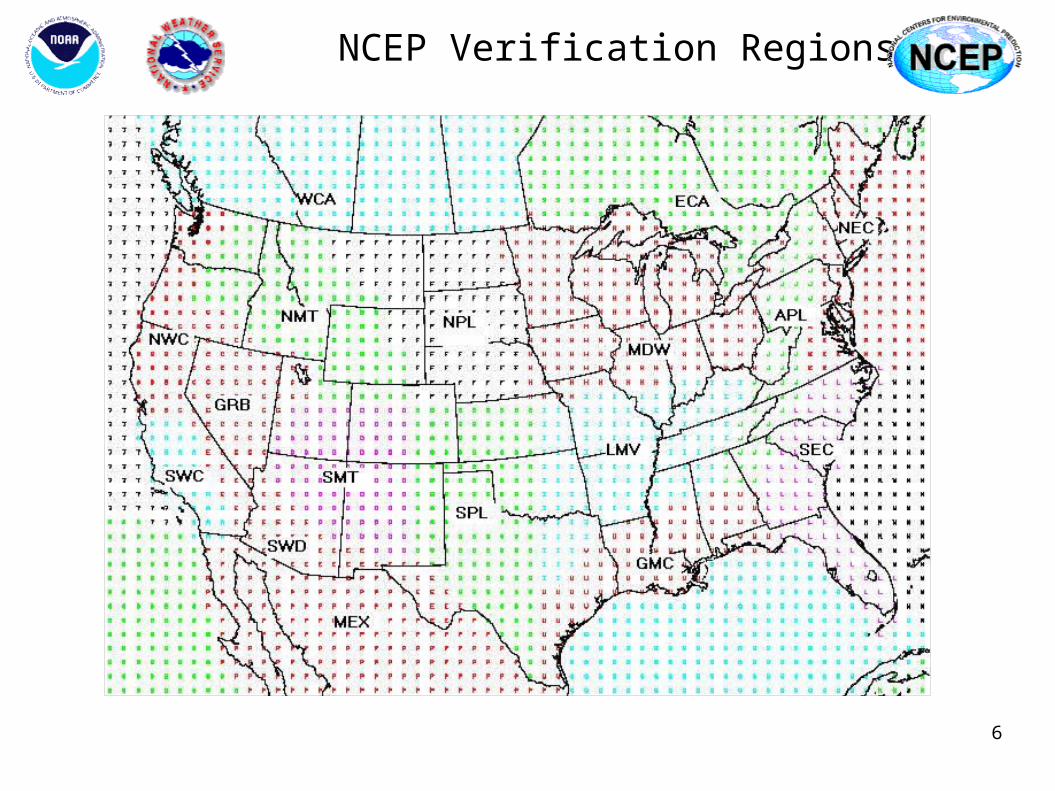
NCEP Verification Regions
7
Editbufr
Input – A standard prepbufr file
What it does – Inputs observations and trims the prepbufr file based on: 1) Ob type – surface obs, raobs, profilers, ships, pibals, satellite, etc 2) Time window – center obs +/- 15 min, 30 min, up to 90 min 3) Grid region – Use standard NCEP grid number or user-defined grid box
Output – A thinned prepbufr file
8
Prepfits
Input – the thinned prepbufr file from Editbufr - all the model grib files that verify at this time
What it does: 1) Reads in model variables 2) Reads in obs variables 3) Interpolates model variables to the ob site using a bilinear interpolation 4) Writes out the model and obs pair at the same location to a new bufr file called the “prepfits” file, for each forecast time
Output – The prepfits file – the model-ob pairs file
9
GridtobsInput: The prepfits file
What it does: 1) Reads in model-ob pairs 2) Reads in user-defined control file that controls: a) What variables to verify (Z, T, etc...) b) What ob types to verify (surface, upper air, etc...) c) What forecast hours to verify (12-hr, 24-hr, etc...) d) What levels to verify (1000 mb, 500 mb, etc...) e) What statistic type is verified (RMSE/bias types, FHO, etc...) f) If FHO – what thresholds to verify 3) Calculates and writes out the partial sums An ensemble version (gridtobsE) is available as well.
Output: A VSDB (Verification Statistical Data Base) file
10
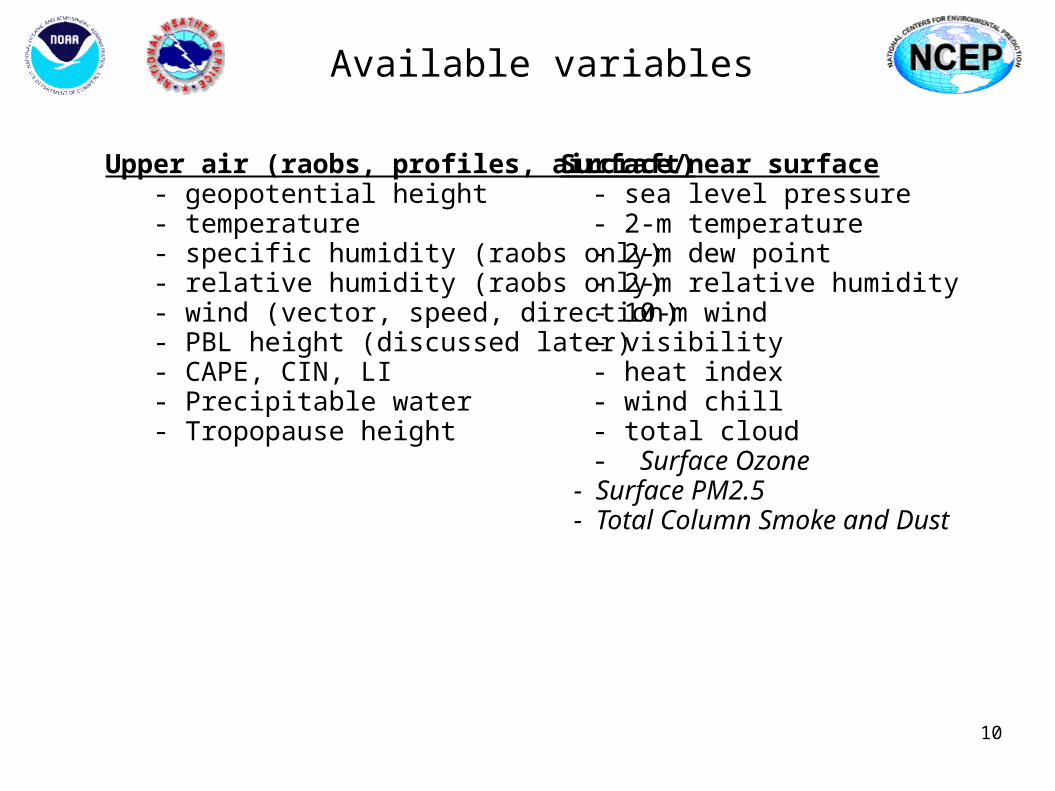
Available variables
Upper air (raobs, profiles, aircraft) - geopotential height - temperature - specific humidity (raobs only) - relative humidity (raobs only) - wind (vector, speed, direction) - PBL height (discussed later) - CAPE, CIN, LI - Precipitable water - Tropopause height
Surface/near surface - sea level pressure - 2-m temperature - 2-m dew point - 2-m relative humidity - 10-m wind - visibility - heat index - wind chill - total cloud - Surface Ozone - Surface PM2.5 - Total Column Smoke and Dust
11
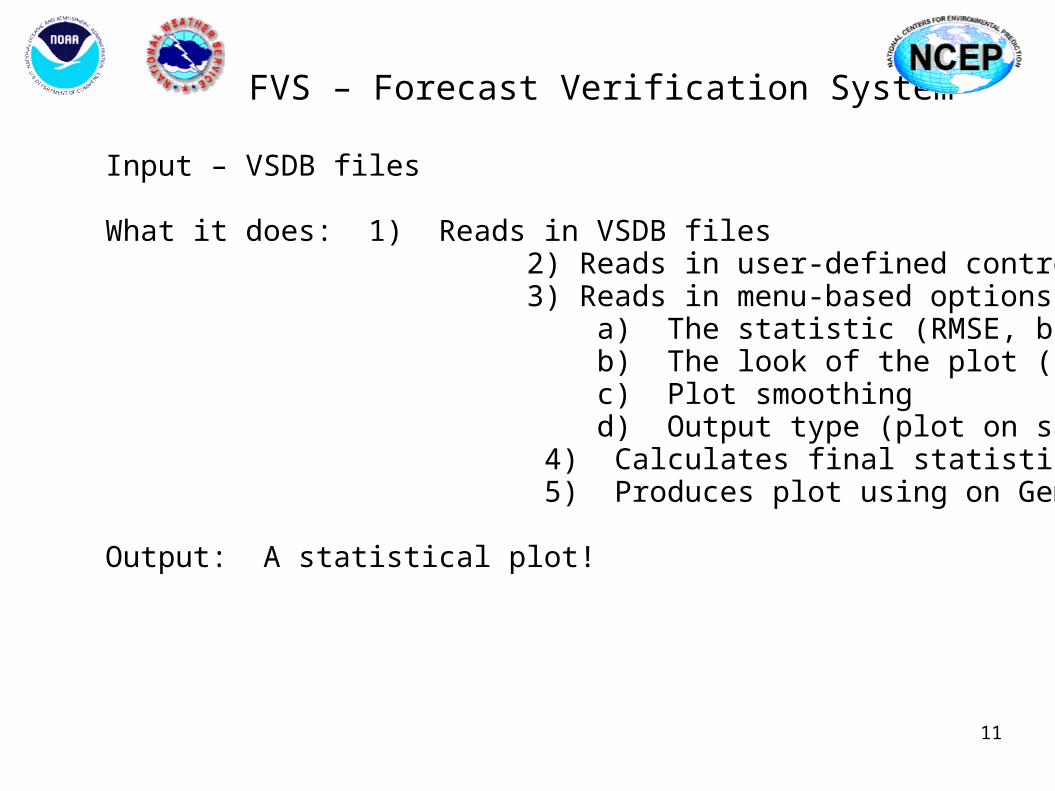
FVS – Forecast Verification System
Input – VSDB files What it does: 1) Reads in VSDB files 2) Reads in user-defined control file 3) Reads in menu-based options to control a) The statistic (RMSE, bias, etc...) b) The look of the plot (axis labels, plot title, etc...) c) Plot smoothing d) Output type (plot on screen, postscript, gif, etc..) 4) Calculates final statistic 5) Produces plot using on Gempak-based subroutines
Output: A statistical plot!

12
Statistics available
- Root mean square error - Simple ob vs. model plot - Bias - Anomaly correlation - Variance - Standard deviation - Difference plot - Equitable threat score - Bias score - Mean absolute error - Mean squared error - S1 score (g2g only)
Plot types
- Time series - Diurnal cycle - Profiles - Histograms - ROC diagrams - Reliability diagrams - Talagrand diagrams - Equally likely diagrams - Ensemble spread
FVS – Forecast Verification System
13
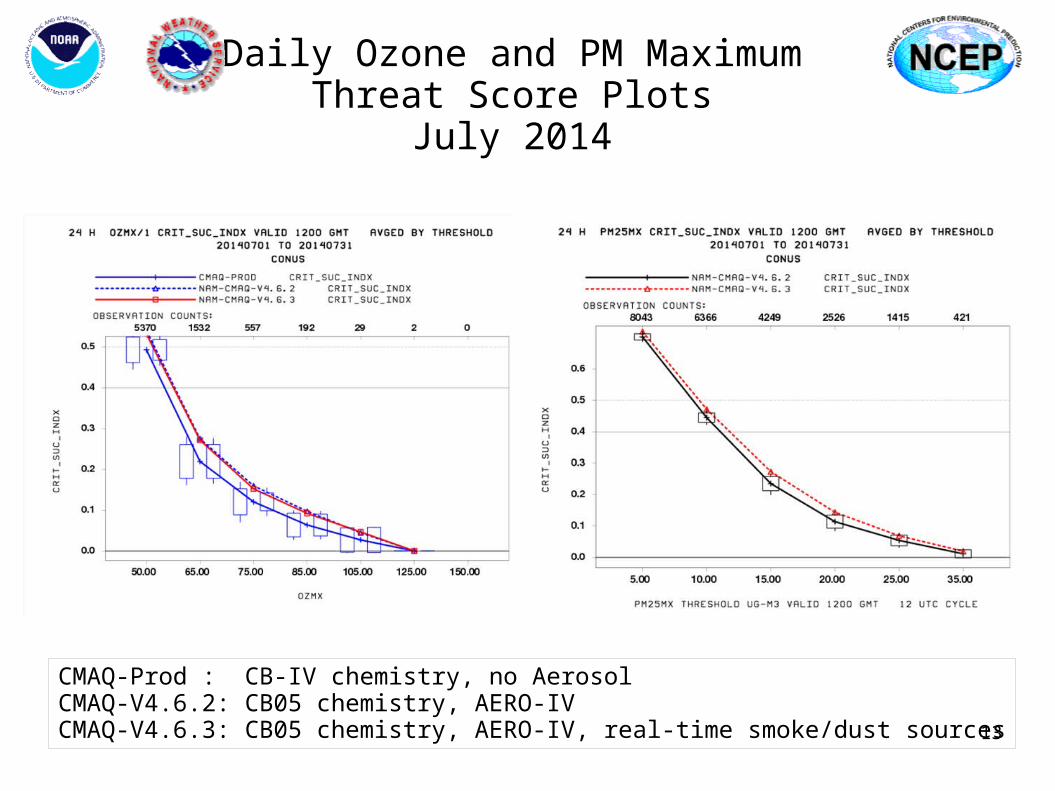
Daily Ozone and PM MaximumThreat Score Plots
July 2014
CMAQ-Prod : CB-IV chemistry, no AerosolCMAQ-V4.6.2: CB05 chemistry, AERO-IV CMAQ-V4.6.3: CB05 chemistry, AERO-IV, real-time smoke/dust sources
14
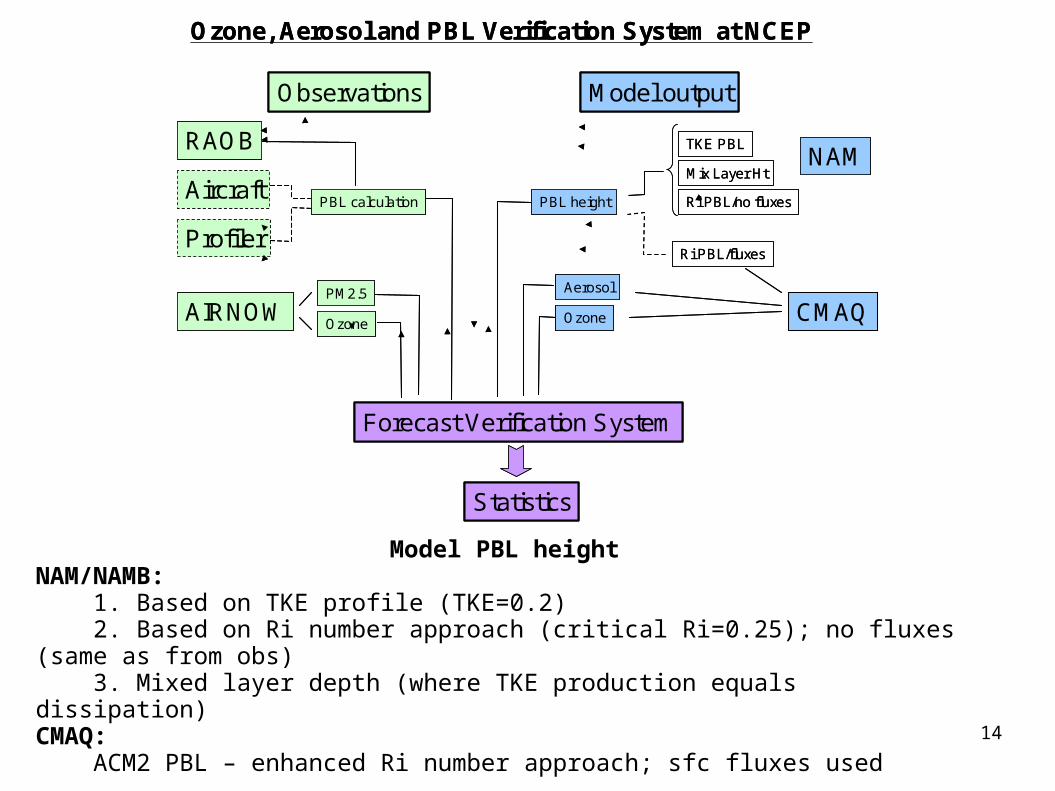
Ozone, Aerosol and PBL Verification System at NCEP
RAOB
Observations Model output
NAM
Forecast Verification System
PBL height
Statistics
PBL calculation
Profiler
Aircraft
TKE PBL
Mix Layer Ht
Ri PBL/fluxes
Ri PBL/no fluxes
CMAQAIRNOWOzone
PM2.5 Aerosol
Ozone
Ozone, Aerosol and PBL Verification System at NCEP
RAOB
Observations Model output
NAM
Forecast Verification System
PBL height
Statistics
PBL calculation
Profiler
Aircraft
TKE PBL
Mix Layer Ht
Ri PBL/fluxes
Ri PBL/no fluxes
CMAQAIRNOWOzone
PM2.5 Aerosol
Ozone
Model PBL heightNAM/NAMB: 1. Based on TKE profile (TKE=0.2) 2. Based on Ri number approach (critical Ri=0.25); no fluxes (same as from obs) 3. Mixed layer depth (where TKE production equals dissipation)CMAQ: ACM2 PBL – enhanced Ri number approach; sfc fluxes used
15
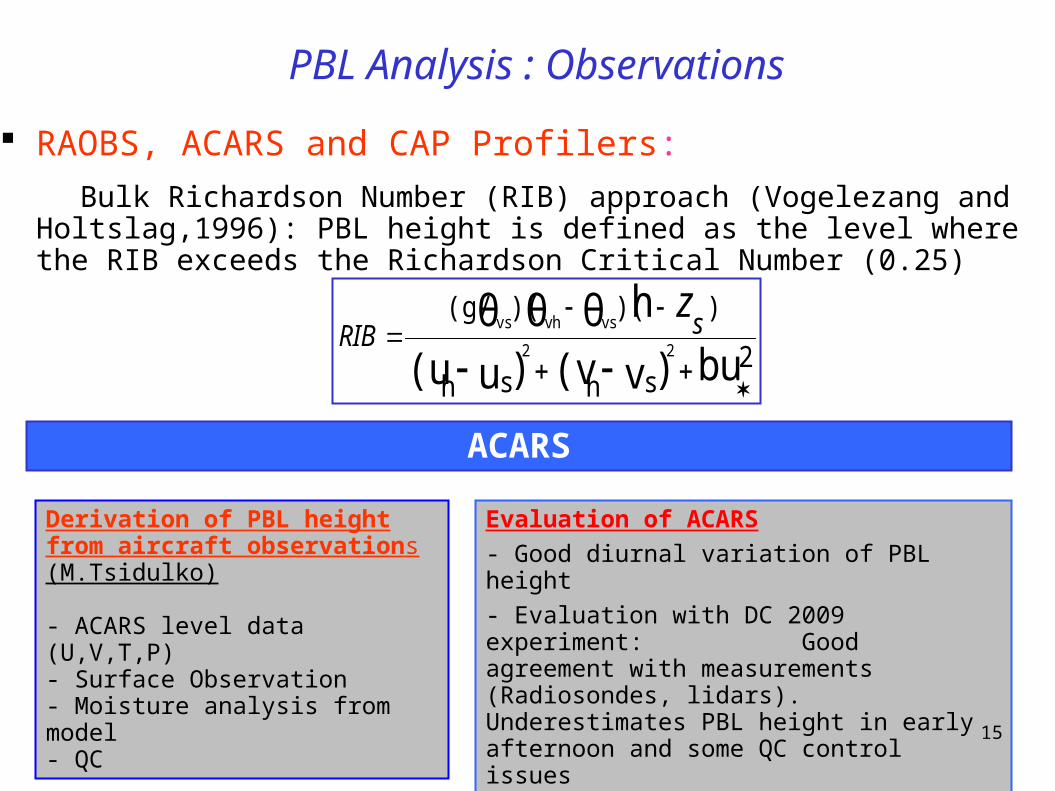
PBL Analysis : Observations
RAOBS, ACARS and CAP Profilers:
Bulk Richardson Number (RIB) approach (Vogelezang and Holtslag,1996): PBL height is defined as the level where the RIB exceeds the Richardson Critical Number (0.25)
Derivation of PBL height from aircraft observations (M.Tsidulko)
- ACARS level data (U,V,T,P)- Surface Observation- Moisture analysis from model- QC
2shsh
))()((g/
bu)v(v)u(u
hθθθ22
vsvhvs
sRIB
z
Evaluation of ACARS
- Good diurnal variation of PBL height
- Evaluation with DC 2009 experiment: Good agreement with measurements (Radiosondes, lidars). Underestimates PBL height in early afternoon and some QC control issues
ACARS
16
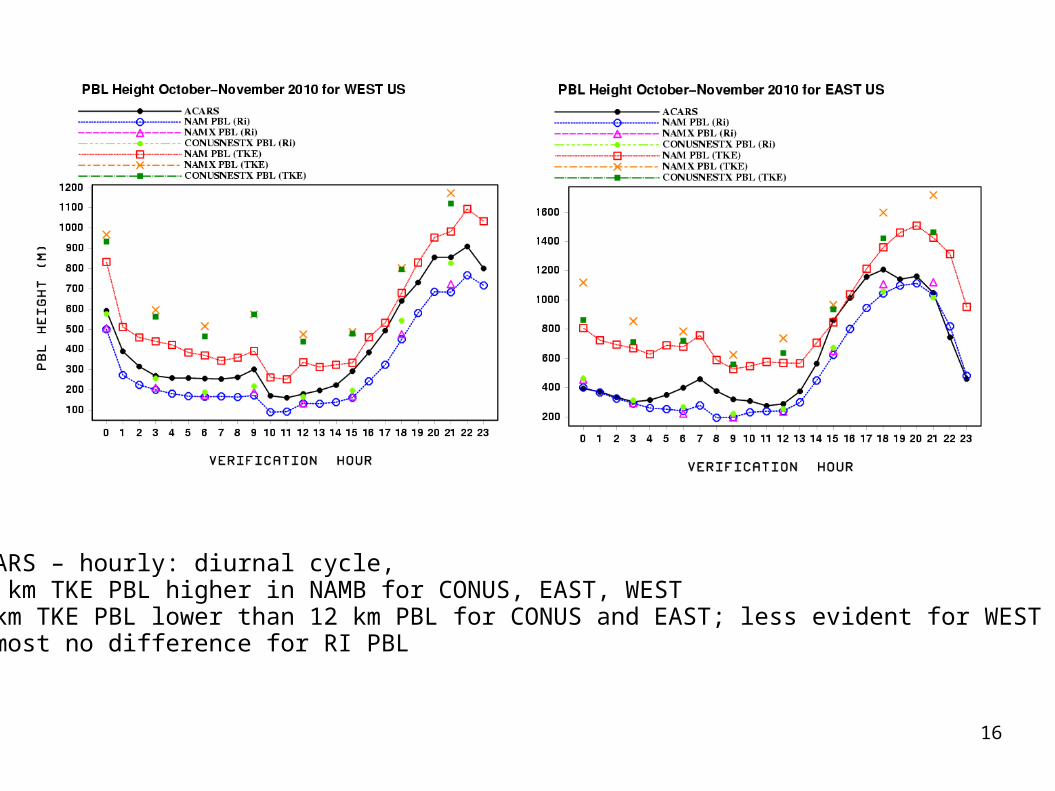
• ACARS – hourly: diurnal cycle, • 12 km TKE PBL higher in NAMB for CONUS, EAST, WEST • 4 km TKE PBL lower than 12 km PBL for CONUS and EAST; less evident for WEST• Almost no difference for RI PBL
17
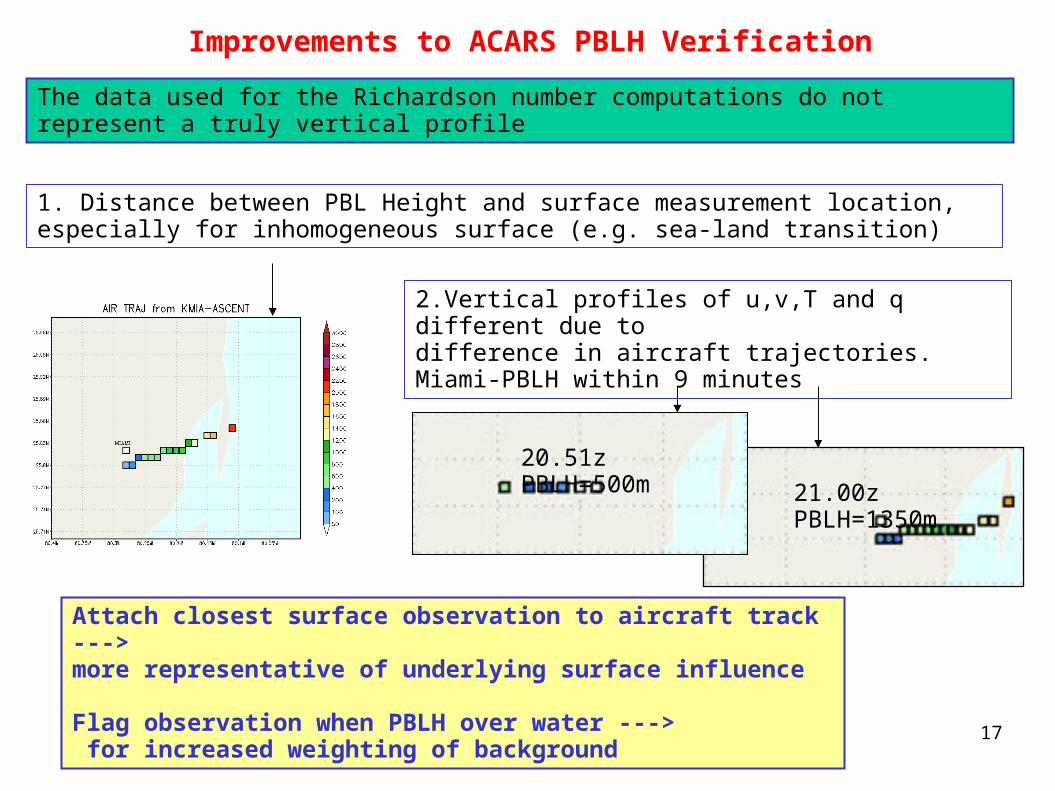
Improvements to ACARS PBLH Verification
The data used for the Richardson number computations do not represent a truly vertical profile
1. Distance between PBL Height and surface measurement location, especially for inhomogeneous surface (e.g. sea-land transition)
21.00z PBLH=1350m
20.51z PBLH=500m
2.Vertical profiles of u,v,T and q different due todifference in aircraft trajectories.Miami-PBLH within 9 minutes
Attach closest surface observation to aircraft track ---> more representative of underlying surface influence
Flag observation when PBLH over water ---> for increased weighting of background
18
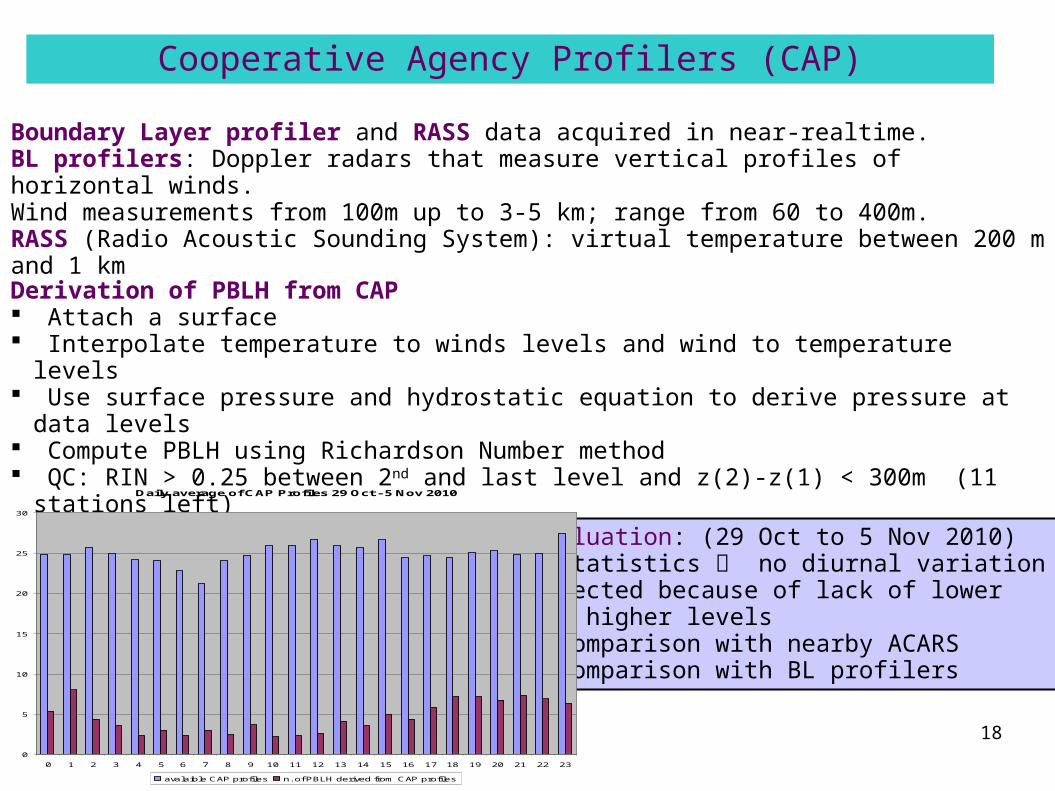
Derivation of PBLH from CAP Attach a surface Interpolate temperature to winds levels and wind to temperature levels Use surface pressure and hydrostatic equation to derive pressure at data levels Compute PBLH using Richardson Number method QC: RIN > 0.25 between 2nd and last level and z(2)-z(1) < 300m (11 stations left)
Boundary Layer profiler and RASS data acquired in near-realtime.BL profilers: Doppler radars that measure vertical profiles of horizontal winds. Wind measurements from 100m up to 3-5 km; range from 60 to 400m.RASS (Radio Acoustic Sounding System): virtual temperature between 200 m and 1 km
Cooperative Agency Profilers (CAP)
Daily average of CAP Profiles 29 Oct - 5 Nov 2010
0
5
10
15
20
25
30
0 1 2 3 4 5 6 7 8 9 10 11 12 13 14 15 16 17 18 19 20 21 22 23
avalaible CAP profiles n. of PBLH derived from CAP profiles
Evaluation: (29 Oct to 5 Nov 2010)- Statistics no diurnal variation detected because of lack of lower and higher levels - Comparison with nearby ACARS- Comparison with BL profilers
19
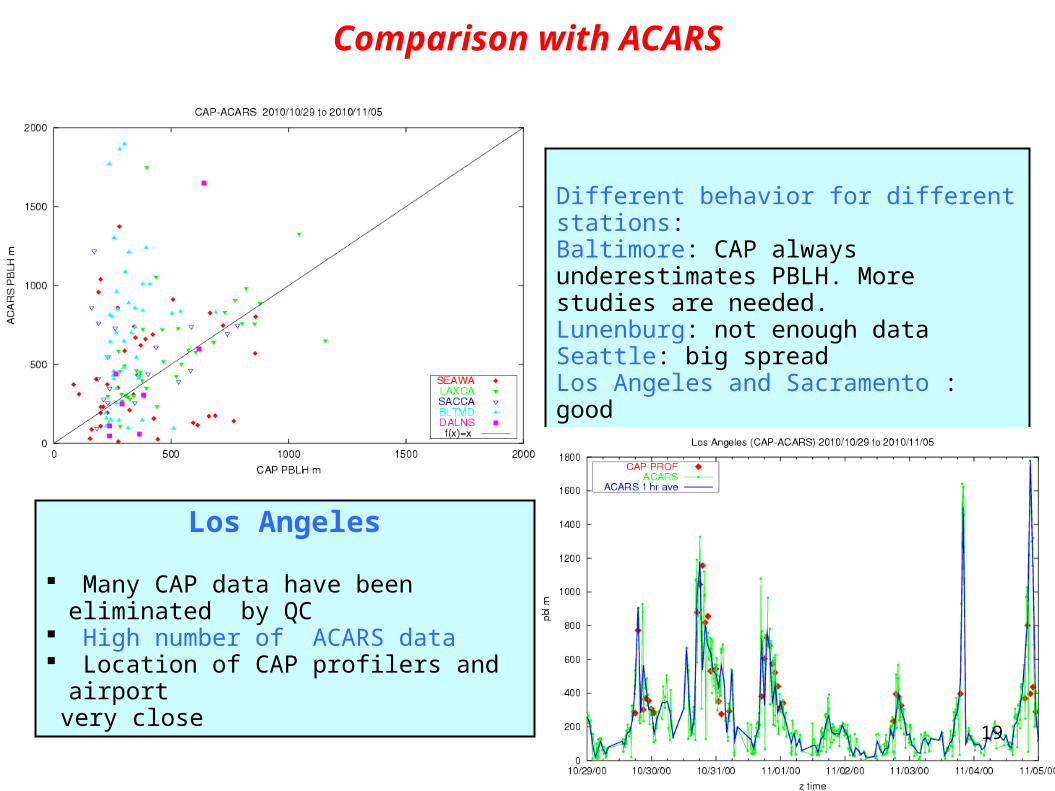
Comparison with ACARS
Different behavior for different stations:Baltimore: CAP always underestimates PBLH. More studies are needed.Lunenburg: not enough dataSeattle: big spreadLos Angeles and Sacramento : good
Los Angeles
Many CAP data have been eliminated by QC
High number of ACARS data Location of CAP profilers and airport very close
20
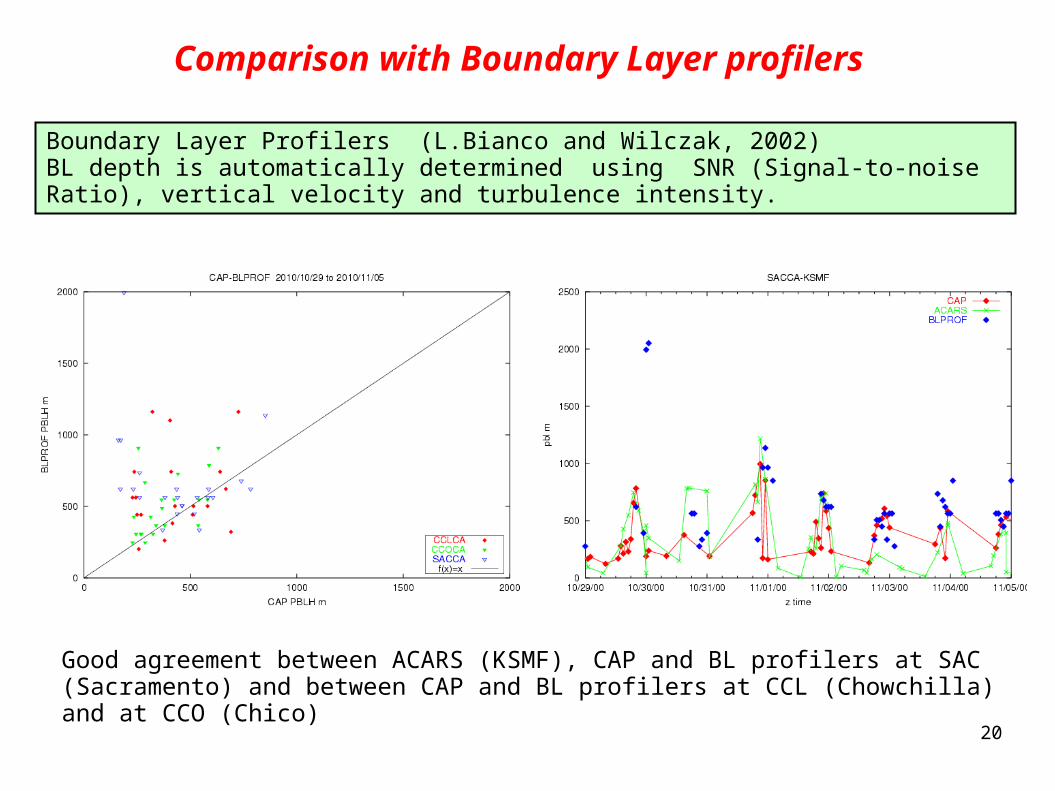
Comparison with Boundary Layer profilers
Boundary Layer Profilers (L.Bianco and Wilczak, 2002)BL depth is automatically determined using SNR (Signal-to-noise Ratio), vertical velocity and turbulence intensity.
Good agreement between ACARS (KSMF), CAP and BL profilers at SAC (Sacramento) and between CAP and BL profilers at CCL (Chowchilla) and at CCO (Chico)
21
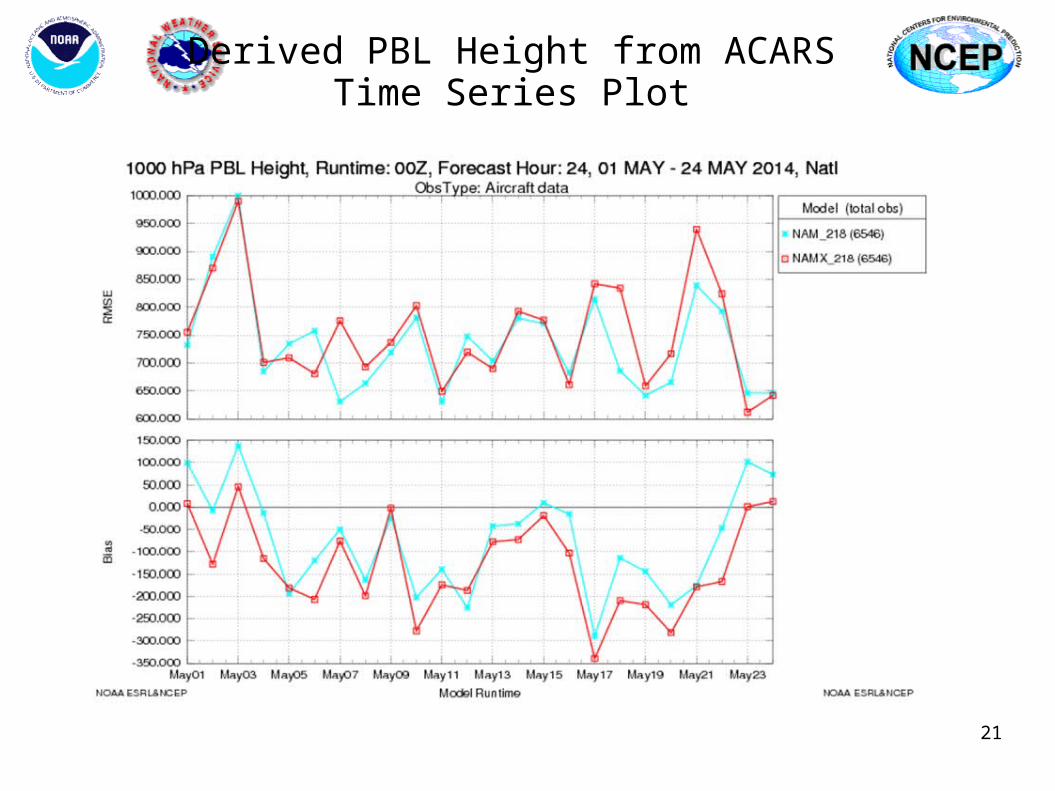
Derived PBL Height from ACARSTime Series Plot

22
NCEP Grid-to-Grid Verification System
23
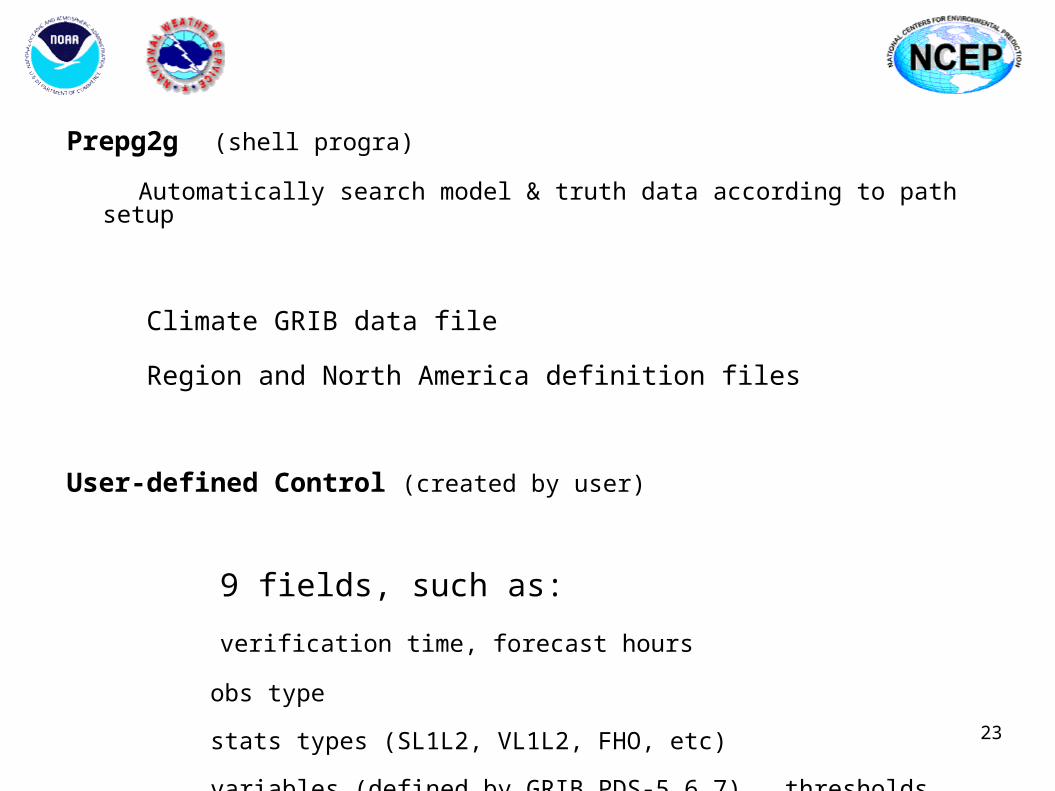
Prepg2g (shell progra)
Automatically search model & truth data according to path setup
Climate GRIB data file
Region and North America definition files
User-defined Control (created by user)
9 fields, such as:
verification time, forecast hours
obs type
stats types (SL1L2, VL1L2, FHO, etc)
variables (defined by GRIB PDS-5,6,7) , thresholds
Levels
….
VSDB files
Output files store partial sum of statistics over region (s)
24
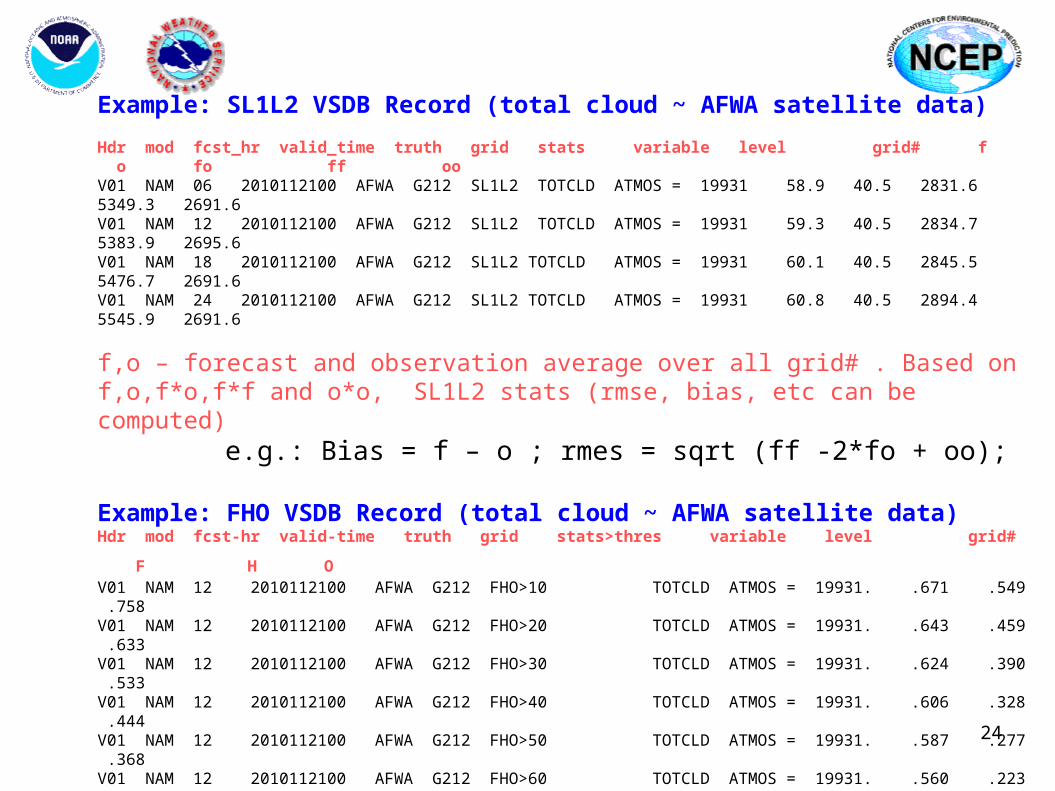
Example: SL1L2 VSDB Record (total cloud ~ AFWA satellite data) Hdr mod fcst_hr valid_time truth grid stats variable level grid# f o fo ff oo V01 NAM 06 2010112100 AFWA G212 SL1L2 TOTCLD ATMOS = 19931 58.9 40.5 2831.6 5349.3 2691.6V01 NAM 12 2010112100 AFWA G212 SL1L2 TOTCLD ATMOS = 19931 59.3 40.5 2834.7 5383.9 2695.6V01 NAM 18 2010112100 AFWA G212 SL1L2 TOTCLD ATMOS = 19931 60.1 40.5 2845.5 5476.7 2691.6V01 NAM 24 2010112100 AFWA G212 SL1L2 TOTCLD ATMOS = 19931 60.8 40.5 2894.4 5545.9 2691.6
f,o – forecast and observation average over all grid# . Based on f,o,f*o,f*f and o*o, SL1L2 stats (rmse, bias, etc can be computed) e.g.: Bias = f – o ; rmes = sqrt (ff -2*fo + oo);
Example: FHO VSDB Record (total cloud ~ AFWA satellite data)Hdr mod fcst-hr valid-time truth grid stats>thres variable level grid# F H OV01 NAM 12 2010112100 AFWA G212 FHO>10 TOTCLD ATMOS = 19931. .671 .549 .758V01 NAM 12 2010112100 AFWA G212 FHO>20 TOTCLD ATMOS = 19931. .643 .459 .633V01 NAM 12 2010112100 AFWA G212 FHO>30 TOTCLD ATMOS = 19931. .624 .390 .533V01 NAM 12 2010112100 AFWA G212 FHO>40 TOTCLD ATMOS = 19931. .606 .328 .444V01 NAM 12 2010112100 AFWA G212 FHO>50 TOTCLD ATMOS = 19931. .587 .277 .368V01 NAM 12 2010112100 AFWA G212 FHO>60 TOTCLD ATMOS = 19931. .560 .223 .298V01 NAM 12 2010112100 AFWA G212 FHO>70 TOTCLD ATMOS = 19931. .535 .178 .237V01 NAM 12 2010112100 AFWA G212 FHO>80 TOTCLD ATMOS = 19931. .506 .128 .171V01 NAM 12 2010112100 AFWA G212 FHO>90 TOTCLD ATMOS = 19931. .473 .086 .109
F, H, O – forecast, hit and observed rates ( x grid# = forecast, hit and observed grid points), based on which POD, FAR, CSI, ETS can be computed e.g.: POD = H/O; FAR=1-H/F; CSI=H/(O+F-H)
25
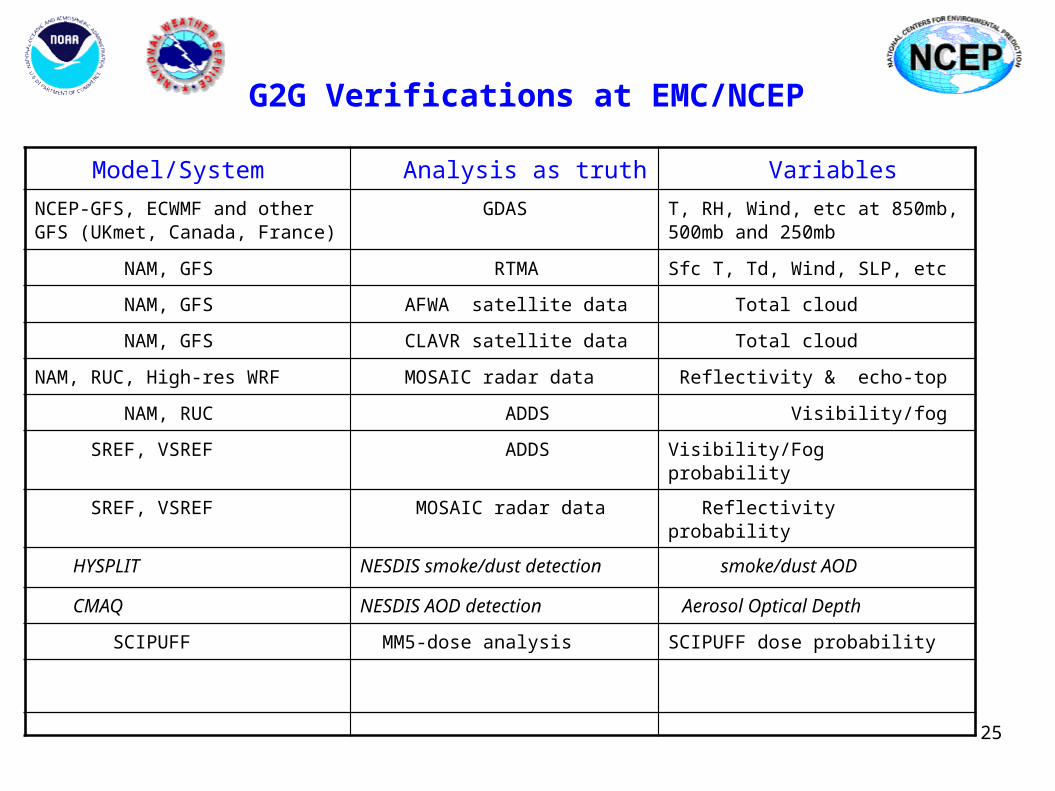
Model/System Analysis as truth Variables
NCEP-GFS, ECWMF and other GFS (UKmet, Canada, France)
GDAS T, RH, Wind, etc at 850mb, 500mb and 250mb
NAM, GFS RTMA Sfc T, Td, Wind, SLP, etc
NAM, GFS AFWA satellite data Total cloud
NAM, GFS CLAVR satellite data Total cloud
NAM, RUC, High-res WRF MOSAIC radar data Reflectivity & echo-top
NAM, RUC ADDS Visibility/fog
SREF, VSREF ADDS Visibility/Fog probability
SREF, VSREF MOSAIC radar data Reflectivity probability
HYSPLIT NESDIS smoke/dust detection smoke/dust AOD
CMAQ NESDIS AOD detection Aerosol Optical Depth
SCIPUFF MM5-dose analysis SCIPUFF dose probability
G2G Verifications at EMC/NCEP
26
27

28
29
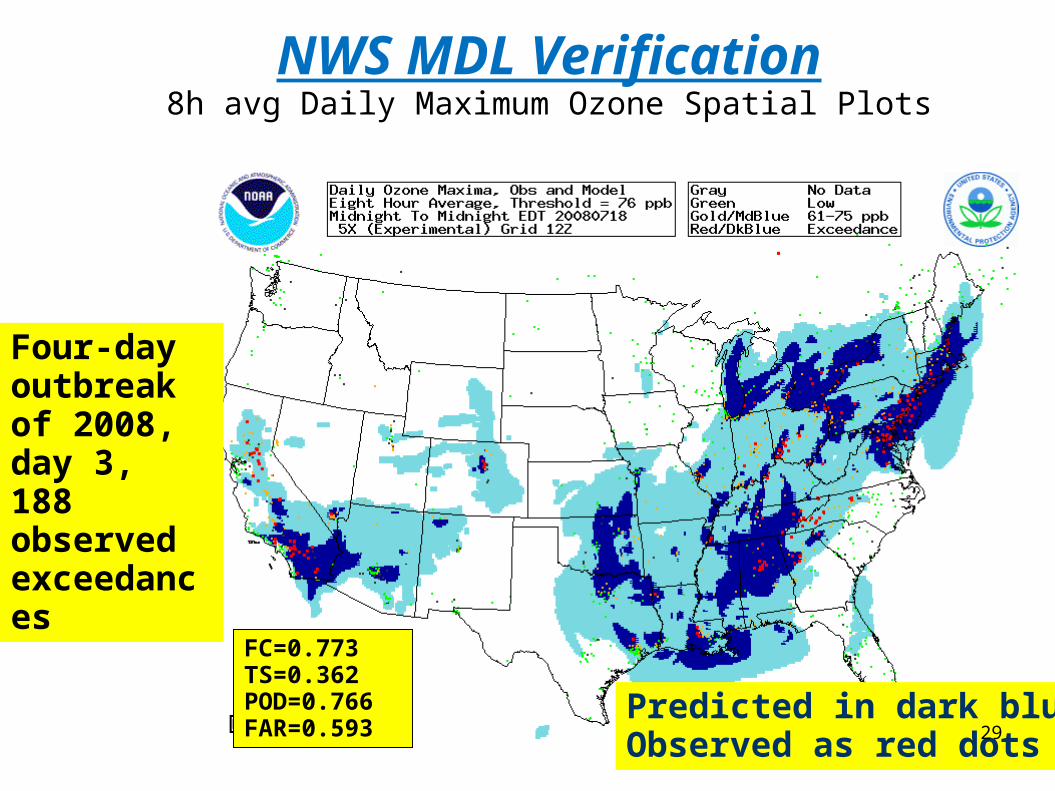
NWS MDL Verification8h avg Daily Maximum Ozone Spatial Plots
FC=0.773TS=0.362POD=0.766FAR=0.593
Predicted in dark blueObserved as red dots
Four-day outbreak of 2008, day 3,188 observed exceedances
30
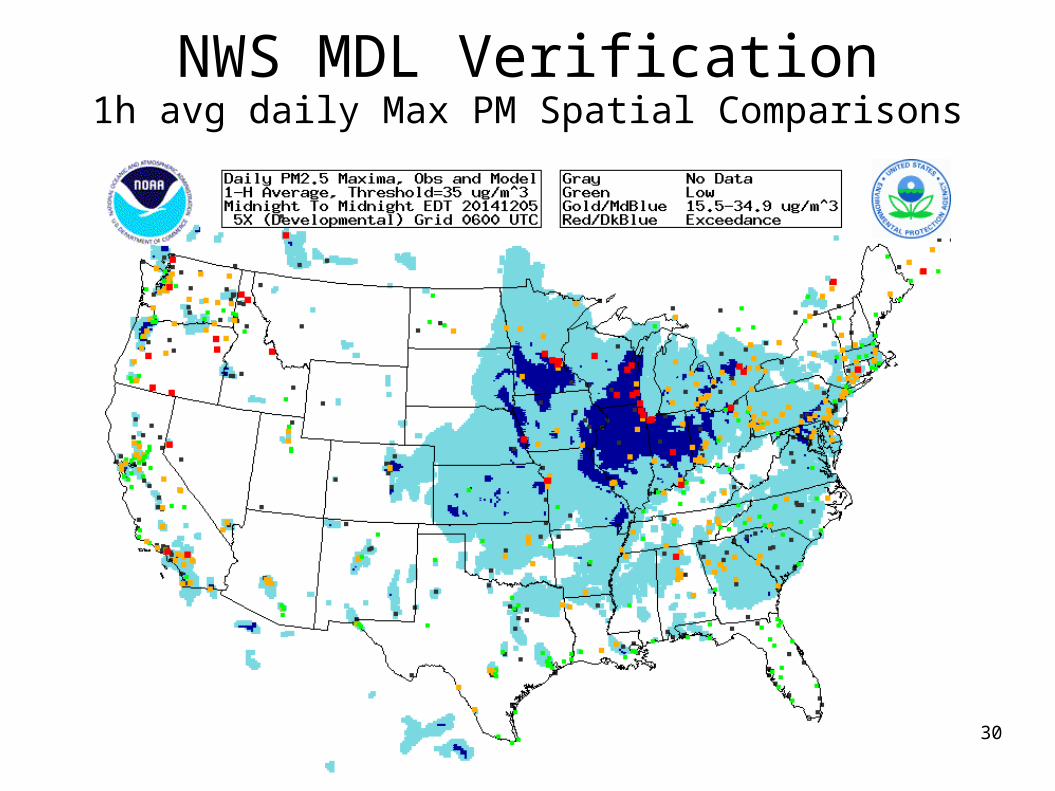
NWS MDL Verification1h avg daily Max PM Spatial Comparisons
31
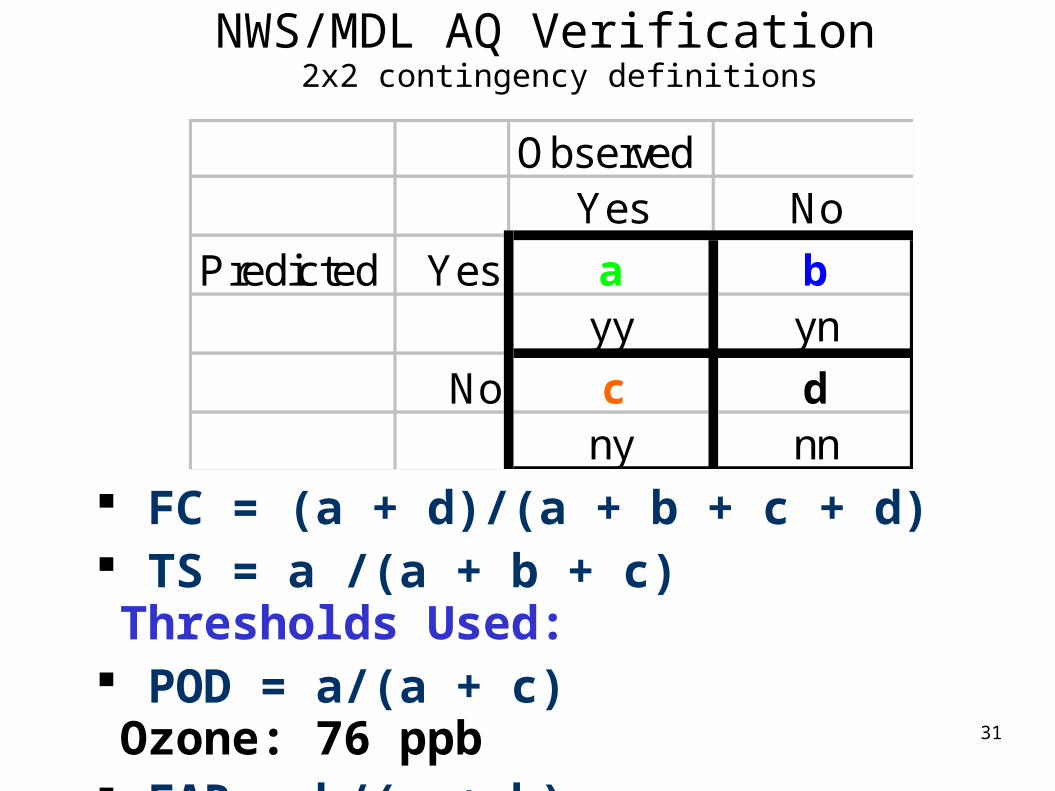
NWS/MDL AQ Verification 2x2 contingency definitions
FC = (a + d)/(a + b + c + d) TS = a /(a + b + c) Thresholds Used: POD = a/(a + c) Ozone: 76 ppb FAR = b/(a + b) Aerosols: 35 ug/m3
ObservedYes No
Predicted Yes a byy yn
No c dny nn
32
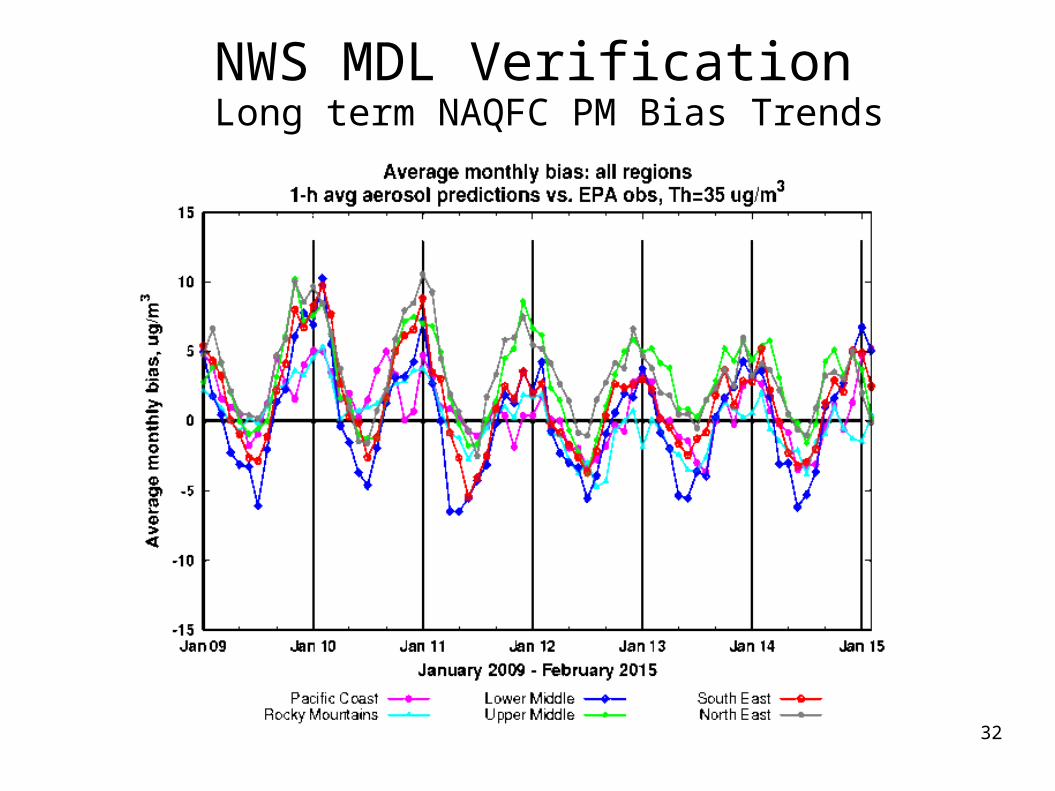
NWS MDL Verification Long term NAQFC PM Bias Trends
33
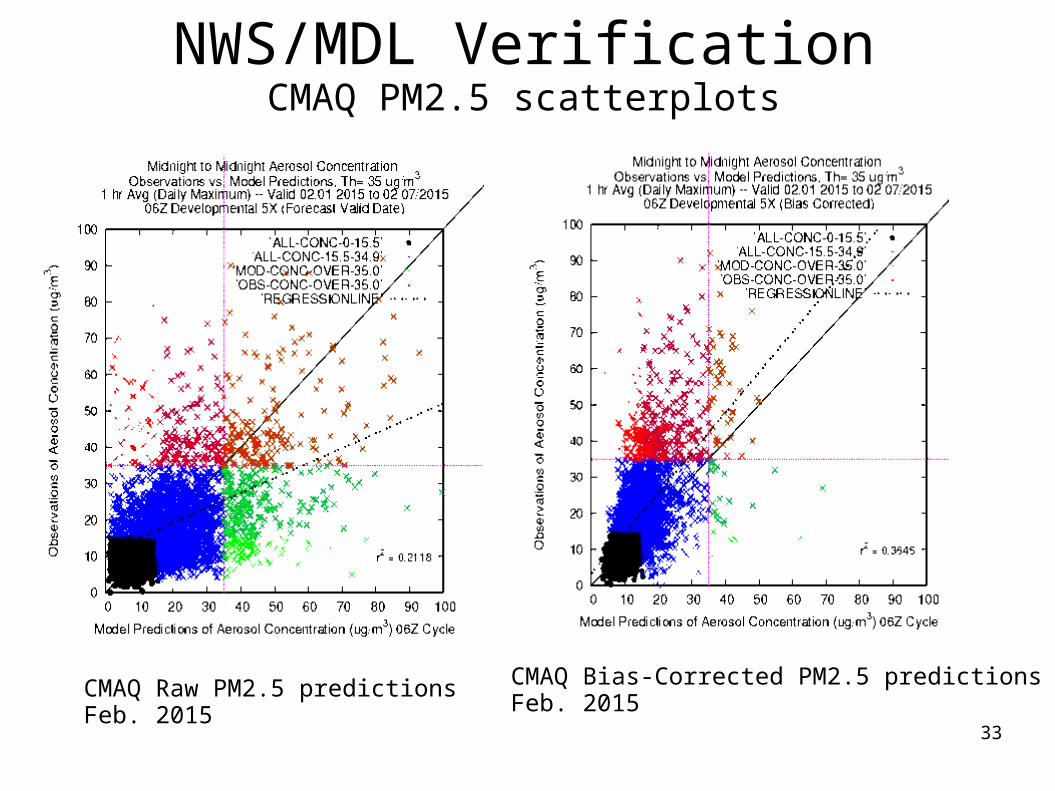
NWS/MDL VerificationCMAQ PM2.5 scatterplots
CMAQ Raw PM2.5 predictionsFeb. 2015
CMAQ Bias-Corrected PM2.5 predictionsFeb. 2015