Embed Size (px)
Citation preview
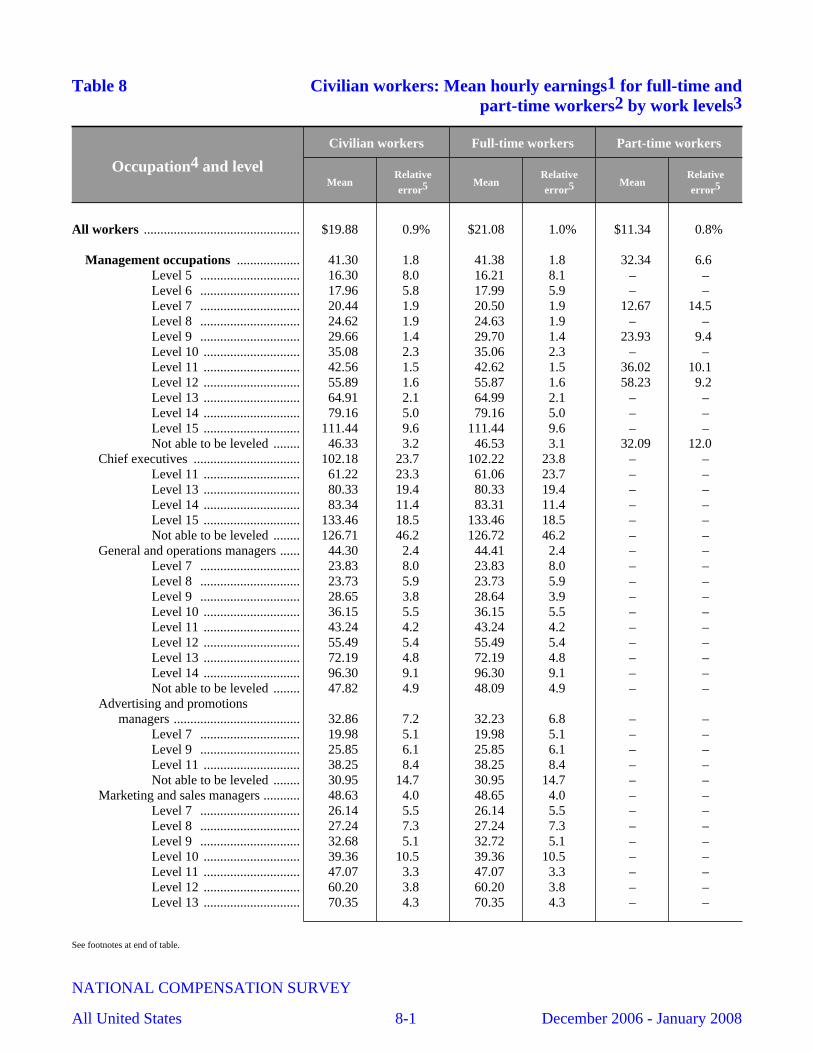
Table 8 Civilian workers: Mean hourly earnings1 for full-time andpart-time workers2 by work levels3
Occupation4 and level
Civilian workers Full-time workers Part-time workers
MeanRelativeerror5 Mean
Relativeerror5 Mean
Relativeerror5
All workers ............................................... $19.88 0.9% $21.08 1.0% $11.34 0.8%
Management occupations ................... 41.30 1.8 41.38 1.8 32.34 6.6 Level 5 .............................. 16.30 8.0 16.21 8.1 – –Level 6 .............................. 17.96 5.8 17.99 5.9 – –Level 7 .............................. 20.44 1.9 20.50 1.9 12.67 14.5 Level 8 .............................. 24.62 1.9 24.63 1.9 – –Level 9 .............................. 29.66 1.4 29.70 1.4 23.93 9.4 Level 10 ............................. 35.08 2.3 35.06 2.3 – –Level 11 ............................. 42.56 1.5 42.62 1.5 36.02 10.1 Level 12 ............................. 55.89 1.6 55.87 1.6 58.23 9.2 Level 13 ............................. 64.91 2.1 64.99 2.1 – –Level 14 ............................. 79.16 5.0 79.16 5.0 – –Level 15 ............................. 111.44 9.6 111.44 9.6 – –Not able to be leveled ........ 46.33 3.2 46.53 3.1 32.09 12.0
Chief executives ................................ 102.18 23.7 102.22 23.8 – –Level 11 ............................. 61.22 23.3 61.06 23.7 – –Level 13 ............................. 80.33 19.4 80.33 19.4 – –Level 14 ............................. 83.34 11.4 83.31 11.4 – –Level 15 ............................. 133.46 18.5 133.46 18.5 – –Not able to be leveled ........ 126.71 46.2 126.72 46.2 – –
General and operations managers ...... 44.30 2.4 44.41 2.4 – –Level 7 .............................. 23.83 8.0 23.83 8.0 – –Level 8 .............................. 23.73 5.9 23.73 5.9 – –Level 9 .............................. 28.65 3.8 28.64 3.9 – –Level 10 ............................. 36.15 5.5 36.15 5.5 – –Level 11 ............................. 43.24 4.2 43.24 4.2 – –Level 12 ............................. 55.49 5.4 55.49 5.4 – –Level 13 ............................. 72.19 4.8 72.19 4.8 – –Level 14 ............................. 96.30 9.1 96.30 9.1 – –Not able to be leveled ........ 47.82 4.9 48.09 4.9 – –
Advertising and promotionsmanagers ...................................... 32.86 7.2 32.23 6.8 – –
Level 7 .............................. 19.98 5.1 19.98 5.1 – –Level 9 .............................. 25.85 6.1 25.85 6.1 – –Level 11 ............................. 38.25 8.4 38.25 8.4 – –Not able to be leveled ........ 30.95 14.7 30.95 14.7 – –
Marketing and sales managers ........... 48.63 4.0 48.65 4.0 – –Level 7 .............................. 26.14 5.5 26.14 5.5 – –Level 8 .............................. 27.24 7.3 27.24 7.3 – –Level 9 .............................. 32.68 5.1 32.72 5.1 – –Level 10 ............................. 39.36 10.5 39.36 10.5 – –Level 11 ............................. 47.07 3.3 47.07 3.3 – –Level 12 ............................. 60.20 3.8 60.20 3.8 – –Level 13 ............................. 70.35 4.3 70.35 4.3 – –
See footnotes at end of table.
NATIONAL COMPENSATION SURVEY
All United States 8-1 December 2006 - January 2008

Table 8 Civilian workers: Mean hourly earnings1 for full-time andpart-time workers2 by work levels3 — Continued
Occupation4 and level
Civilian workers Full-time workers Part-time workers
MeanRelativeerror5 Mean
Relativeerror5 Mean
Relativeerror5
Management occupations –ContinuedMarketing and sales managers
–ContinuedNot able to be leveled ........ $55.01 8.7% $55.01 8.7% – –
Marketing managers ...................... 52.95 5.7 53.00 5.7 – –Level 8 .............................. 26.54 11.7 26.54 11.7 – –Level 9 .............................. 32.57 6.6 32.68 6.7 – –Level 10 ............................. 41.64 11.3 41.64 11.3 – –Level 11 ............................. 44.30 4.4 44.30 4.4 – –Level 12 ............................. 59.86 4.5 59.86 4.5 – –Level 13 ............................. 69.65 5.5 69.65 5.5 – –Not able to be leveled ........ 58.75 15.0 58.75 15.0 – –
Sales managers .............................. 44.16 4.1 44.16 4.1 – –Level 7 .............................. 24.89 5.0 24.89 5.0 – –Level 8 .............................. 28.24 2.9 28.24 2.9 – –Level 9 .............................. 32.73 6.8 32.73 6.8 – –Level 10 ............................. 38.45 14.1 38.45 14.1 – –Level 11 ............................. 49.97 5.9 49.97 5.9 – –Level 12 ............................. 61.38 4.3 61.38 4.3 – –Not able to be leveled ........ 50.85 5.5 50.85 5.5 – –
Public relations managers .................. 41.18 16.5 41.45 16.7 – –Level 7 .............................. 20.00 6.3 20.00 6.3 – –Level 8 .............................. 27.97 10.8 27.97 10.8 – –Level 9 .............................. 28.20 8.8 28.20 8.8 – –Level 10 ............................. 32.76 9.1 32.76 9.1 – –Level 11 ............................. 42.76 6.9 45.00 4.4 – –Level 12 ............................. 57.65 6.3 57.65 6.3 – –Not able to be leveled ........ 52.13 46.5 52.17 46.6 – –
Administrative services managers ..... 31.05 3.5 31.05 3.5 – –Level 7 .............................. 22.14 7.1 22.14 7.1 – –Level 8 .............................. 24.37 4.6 24.37 4.6 – –Level 9 .............................. 32.95 3.7 32.95 3.7 – –Level 10 ............................. 34.51 6.9 34.51 6.9 – –Level 11 ............................. 39.01 4.6 39.01 4.6 – –Not able to be leveled ........ 36.62 6.6 36.62 6.6 – –
Computer and information systemsmanagers ...................................... 52.54 2.2 52.56 2.2 – –
Level 9 .............................. 29.64 4.9 29.64 4.9 – –Level 10 ............................. 39.18 9.0 39.18 9.0 – –Level 11 ............................. 44.81 3.6 44.81 3.6 – –Level 12 ............................. 57.76 5.0 57.76 5.0 – –Level 13 ............................. 61.07 3.8 61.07 3.8 – –Not able to be leveled ........ 58.63 4.1 58.76 4.1 – –
Financial managers ............................ 42.21 2.2 42.20 2.2 $44.34 22.8%
See footnotes at end of table.
NATIONAL COMPENSATION SURVEY
All United States 8-2 December 2006 - January 2008
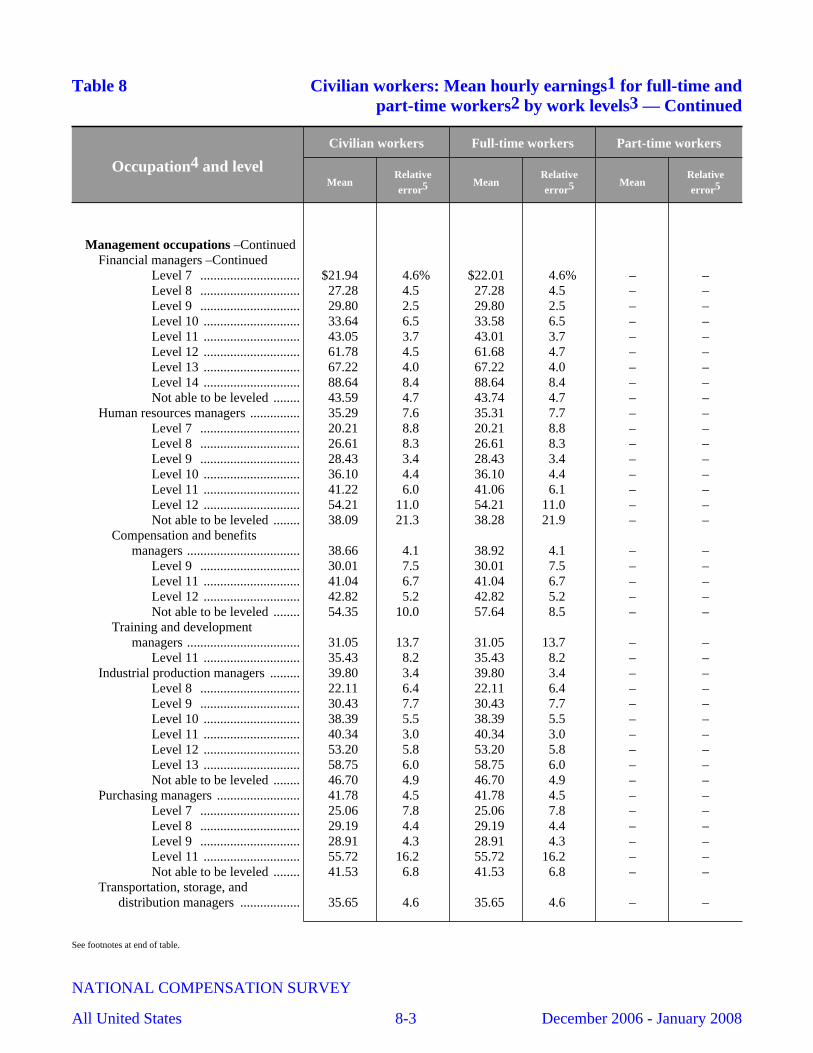
Table 8 Civilian workers: Mean hourly earnings1 for full-time andpart-time workers2 by work levels3 — Continued
Occupation4 and level
Civilian workers Full-time workers Part-time workers
MeanRelativeerror5 Mean
Relativeerror5 Mean
Relativeerror5
Management occupations –ContinuedFinancial managers –Continued
Level 7 .............................. $21.94 4.6% $22.01 4.6% – –Level 8 .............................. 27.28 4.5 27.28 4.5 – –Level 9 .............................. 29.80 2.5 29.80 2.5 – –Level 10 ............................. 33.64 6.5 33.58 6.5 – –Level 11 ............................. 43.05 3.7 43.01 3.7 – –Level 12 ............................. 61.78 4.5 61.68 4.7 – –Level 13 ............................. 67.22 4.0 67.22 4.0 – –Level 14 ............................. 88.64 8.4 88.64 8.4 – –Not able to be leveled ........ 43.59 4.7 43.74 4.7 – –
Human resources managers ............... 35.29 7.6 35.31 7.7 – –Level 7 .............................. 20.21 8.8 20.21 8.8 – –Level 8 .............................. 26.61 8.3 26.61 8.3 – –Level 9 .............................. 28.43 3.4 28.43 3.4 – –Level 10 ............................. 36.10 4.4 36.10 4.4 – –Level 11 ............................. 41.22 6.0 41.06 6.1 – –Level 12 ............................. 54.21 11.0 54.21 11.0 – –Not able to be leveled ........ 38.09 21.3 38.28 21.9 – –
Compensation and benefitsmanagers .................................. 38.66 4.1 38.92 4.1 – –
Level 9 .............................. 30.01 7.5 30.01 7.5 – –Level 11 ............................. 41.04 6.7 41.04 6.7 – –Level 12 ............................. 42.82 5.2 42.82 5.2 – –Not able to be leveled ........ 54.35 10.0 57.64 8.5 – –
Training and developmentmanagers .................................. 31.05 13.7 31.05 13.7 – –
Level 11 ............................. 35.43 8.2 35.43 8.2 – –Industrial production managers ......... 39.80 3.4 39.80 3.4 – –
Level 8 .............................. 22.11 6.4 22.11 6.4 – –Level 9 .............................. 30.43 7.7 30.43 7.7 – –Level 10 ............................. 38.39 5.5 38.39 5.5 – –Level 11 ............................. 40.34 3.0 40.34 3.0 – –Level 12 ............................. 53.20 5.8 53.20 5.8 – –Level 13 ............................. 58.75 6.0 58.75 6.0 – –Not able to be leveled ........ 46.70 4.9 46.70 4.9 – –
Purchasing managers ......................... 41.78 4.5 41.78 4.5 – –Level 7 .............................. 25.06 7.8 25.06 7.8 – –Level 8 .............................. 29.19 4.4 29.19 4.4 – –Level 9 .............................. 28.91 4.3 28.91 4.3 – –Level 11 ............................. 55.72 16.2 55.72 16.2 – –Not able to be leveled ........ 41.53 6.8 41.53 6.8 – –
Transportation, storage, anddistribution managers .................. 35.65 4.6 35.65 4.6 – –
See footnotes at end of table.
NATIONAL COMPENSATION SURVEY
All United States 8-3 December 2006 - January 2008
Table 8 Civilian workers: Mean hourly earnings1 for full-time andpart-time workers2 by work levels3 — Continued
Occupation4 and level
Civilian workers Full-time workers Part-time workers
MeanRelativeerror5 Mean
Relativeerror5 Mean
Relativeerror5
Management occupations –ContinuedTransportation, storage, and
distribution managers –ContinuedLevel 7 .............................. $19.74 6.9% $19.74 6.9% – –Level 8 .............................. 30.59 7.2 30.59 7.2 – –Level 9 .............................. 36.28 5.8 36.28 5.8 – –Level 10 ............................. 39.07 4.1 39.07 4.1 – –Level 11 ............................. 41.74 12.2 41.74 12.2 – –Level 12 ............................. 59.31 15.0 59.31 15.0 – –Not able to be leveled ........ 37.44 10.7 37.44 10.7 – –
Construction managers ...................... 35.78 4.1 35.78 4.1 – –Level 7 .............................. 21.67 6.5 21.67 6.5 – –Level 8 .............................. 27.86 11.3 27.86 11.3 – –Level 9 .............................. 32.63 4.2 32.63 4.2 – –Level 10 ............................. 33.91 6.4 33.91 6.4 – –Level 11 ............................. 39.97 5.6 39.97 5.6 – –Level 12 ............................. 53.51 7.7 53.51 7.7 – –Not able to be leveled ........ 40.46 6.4 40.46 6.4 – –
Education administrators ................... 36.83 2.4 36.92 2.4 $33.34 14.2%Level 6 .............................. 16.42 5.1 16.42 5.1 – –Level 7 .............................. 16.47 3.8 16.74 4.0 – –Level 8 .............................. 22.11 7.4 22.06 8.0 – –Level 9 .............................. 28.01 4.7 28.09 4.7 – –Level 10 ............................. 32.57 4.2 32.50 4.3 – –Level 11 ............................. 42.46 2.4 42.85 2.3 – –Level 12 ............................. 51.06 3.7 51.09 3.7 – –Level 13 ............................. 53.36 3.9 53.36 3.9 – –Level 14 ............................. 69.70 12.2 69.70 12.2 – –Not able to be leveled ........ 38.08 8.1 37.73 8.1 51.48 27.8
Education administrators,preschool and child carecenter/program ......................... 22.20 9.8 21.69 10.7 – –
Level 7 .............................. 14.91 3.3 15.17 3.1 – –Level 8 .............................. 15.63 16.7 15.63 16.7 – –Level 9 .............................. 22.27 8.5 22.27 8.5 – –
Education administrators,elementary and secondaryschool ....................................... 44.03 1.8 44.12 1.8 34.96 16.7
Level 9 .............................. 36.01 7.0 36.60 6.8 – –Level 10 ............................. 39.44 2.9 39.30 2.9 – –Level 11 ............................. 43.52 2.2 43.51 2.2 – –Level 12 ............................. 50.82 3.6 50.86 3.6 – –Level 13 ............................. 51.34 4.2 51.34 4.2 – –Not able to be leveled ........ 44.97 4.2 45.14 4.3 – –
See footnotes at end of table.
NATIONAL COMPENSATION SURVEY
All United States 8-4 December 2006 - January 2008
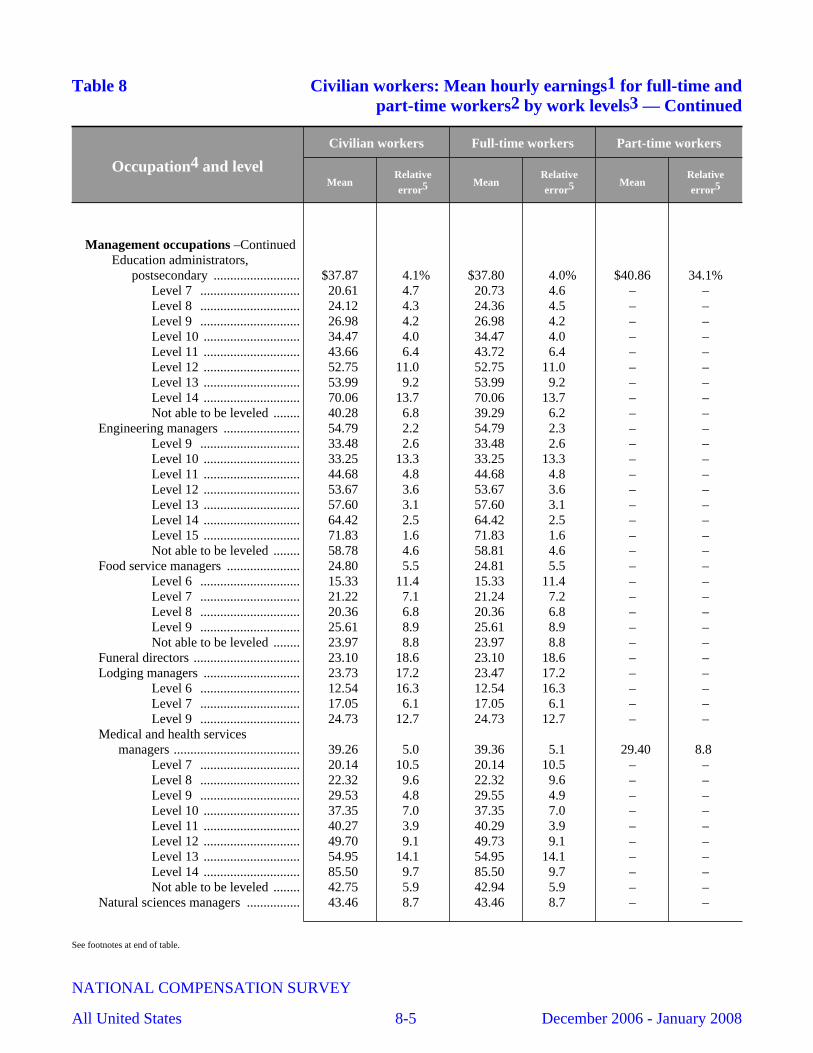
Table 8 Civilian workers: Mean hourly earnings1 for full-time andpart-time workers2 by work levels3 — Continued
Occupation4 and level
Civilian workers Full-time workers Part-time workers
MeanRelativeerror5 Mean
Relativeerror5 Mean
Relativeerror5
Management occupations –ContinuedEducation administrators,
postsecondary .......................... $37.87 4.1% $37.80 4.0% $40.86 34.1%Level 7 .............................. 20.61 4.7 20.73 4.6 – –Level 8 .............................. 24.12 4.3 24.36 4.5 – –Level 9 .............................. 26.98 4.2 26.98 4.2 – –Level 10 ............................. 34.47 4.0 34.47 4.0 – –Level 11 ............................. 43.66 6.4 43.72 6.4 – –Level 12 ............................. 52.75 11.0 52.75 11.0 – –Level 13 ............................. 53.99 9.2 53.99 9.2 – –Level 14 ............................. 70.06 13.7 70.06 13.7 – –Not able to be leveled ........ 40.28 6.8 39.29 6.2 – –
Engineering managers ....................... 54.79 2.2 54.79 2.3 – –Level 9 .............................. 33.48 2.6 33.48 2.6 – –Level 10 ............................. 33.25 13.3 33.25 13.3 – –Level 11 ............................. 44.68 4.8 44.68 4.8 – –Level 12 ............................. 53.67 3.6 53.67 3.6 – –Level 13 ............................. 57.60 3.1 57.60 3.1 – –Level 14 ............................. 64.42 2.5 64.42 2.5 – –Level 15 ............................. 71.83 1.6 71.83 1.6 – –Not able to be leveled ........ 58.78 4.6 58.81 4.6 – –
Food service managers ...................... 24.80 5.5 24.81 5.5 – –Level 6 .............................. 15.33 11.4 15.33 11.4 – –Level 7 .............................. 21.22 7.1 21.24 7.2 – –Level 8 .............................. 20.36 6.8 20.36 6.8 – –Level 9 .............................. 25.61 8.9 25.61 8.9 – –Not able to be leveled ........ 23.97 8.8 23.97 8.8 – –
Funeral directors ................................ 23.10 18.6 23.10 18.6 – –Lodging managers ............................. 23.73 17.2 23.47 17.2 – –
Level 6 .............................. 12.54 16.3 12.54 16.3 – –Level 7 .............................. 17.05 6.1 17.05 6.1 – –Level 9 .............................. 24.73 12.7 24.73 12.7 – –
Medical and health servicesmanagers ...................................... 39.26 5.0 39.36 5.1 29.40 8.8
Level 7 .............................. 20.14 10.5 20.14 10.5 – –Level 8 .............................. 22.32 9.6 22.32 9.6 – –Level 9 .............................. 29.53 4.8 29.55 4.9 – –Level 10 ............................. 37.35 7.0 37.35 7.0 – –Level 11 ............................. 40.27 3.9 40.29 3.9 – –Level 12 ............................. 49.70 9.1 49.73 9.1 – –Level 13 ............................. 54.95 14.1 54.95 14.1 – –Level 14 ............................. 85.50 9.7 85.50 9.7 – –Not able to be leveled ........ 42.75 5.9 42.94 5.9 – –
Natural sciences managers ................ 43.46 8.7 43.46 8.7 – –
See footnotes at end of table.
NATIONAL COMPENSATION SURVEY
All United States 8-5 December 2006 - January 2008
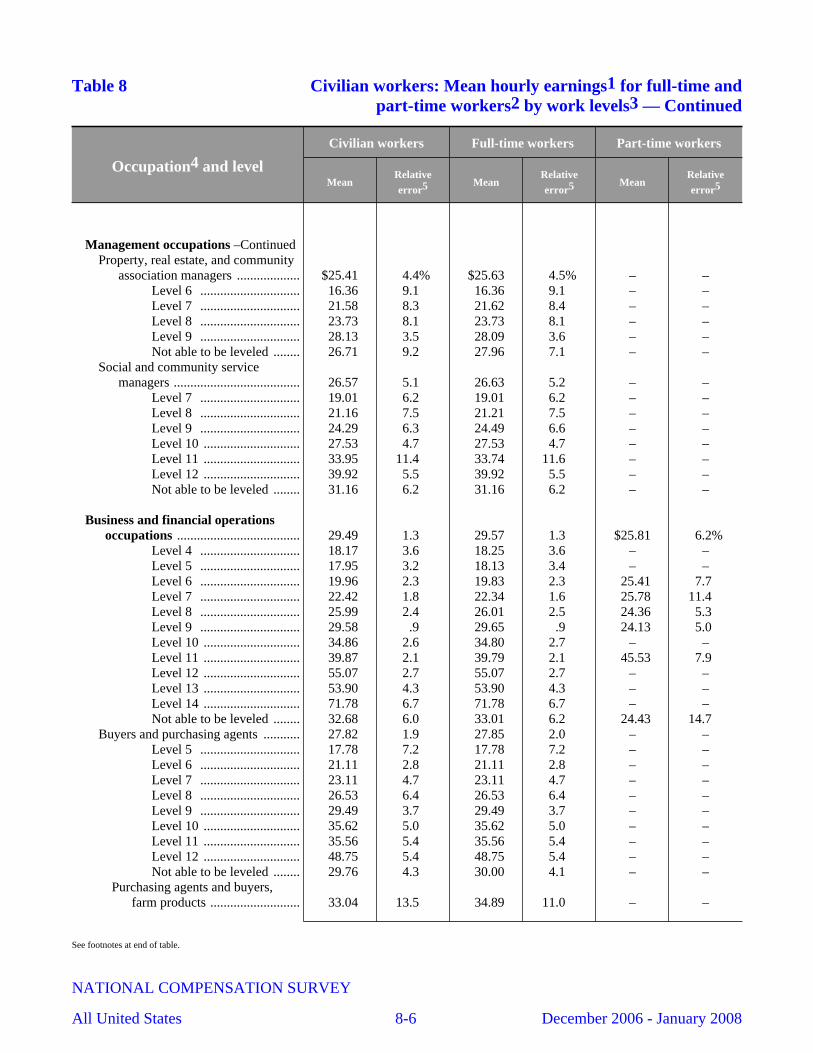
Table 8 Civilian workers: Mean hourly earnings1 for full-time andpart-time workers2 by work levels3 — Continued
Occupation4 and level
Civilian workers Full-time workers Part-time workers
MeanRelativeerror5 Mean
Relativeerror5 Mean
Relativeerror5
Management occupations –ContinuedProperty, real estate, and community
association managers ................... $25.41 4.4% $25.63 4.5% – –Level 6 .............................. 16.36 9.1 16.36 9.1 – –Level 7 .............................. 21.58 8.3 21.62 8.4 – –Level 8 .............................. 23.73 8.1 23.73 8.1 – –Level 9 .............................. 28.13 3.5 28.09 3.6 – –Not able to be leveled ........ 26.71 9.2 27.96 7.1 – –
Social and community servicemanagers ...................................... 26.57 5.1 26.63 5.2 – –
Level 7 .............................. 19.01 6.2 19.01 6.2 – –Level 8 .............................. 21.16 7.5 21.21 7.5 – –Level 9 .............................. 24.29 6.3 24.49 6.6 – –Level 10 ............................. 27.53 4.7 27.53 4.7 – –Level 11 ............................. 33.95 11.4 33.74 11.6 – –Level 12 ............................. 39.92 5.5 39.92 5.5 – –Not able to be leveled ........ 31.16 6.2 31.16 6.2 – –
Business and financial operationsoccupations ..................................... 29.49 1.3 29.57 1.3 $25.81 6.2%
Level 4 .............................. 18.17 3.6 18.25 3.6 – –Level 5 .............................. 17.95 3.2 18.13 3.4 – –Level 6 .............................. 19.96 2.3 19.83 2.3 25.41 7.7 Level 7 .............................. 22.42 1.8 22.34 1.6 25.78 11.4 Level 8 .............................. 25.99 2.4 26.01 2.5 24.36 5.3 Level 9 .............................. 29.58 .9 29.65 .9 24.13 5.0 Level 10 ............................. 34.86 2.6 34.80 2.7 – –Level 11 ............................. 39.87 2.1 39.79 2.1 45.53 7.9 Level 12 ............................. 55.07 2.7 55.07 2.7 – –Level 13 ............................. 53.90 4.3 53.90 4.3 – –Level 14 ............................. 71.78 6.7 71.78 6.7 – –Not able to be leveled ........ 32.68 6.0 33.01 6.2 24.43 14.7
Buyers and purchasing agents ........... 27.82 1.9 27.85 2.0 – –Level 5 .............................. 17.78 7.2 17.78 7.2 – –Level 6 .............................. 21.11 2.8 21.11 2.8 – –Level 7 .............................. 23.11 4.7 23.11 4.7 – –Level 8 .............................. 26.53 6.4 26.53 6.4 – –Level 9 .............................. 29.49 3.7 29.49 3.7 – –Level 10 ............................. 35.62 5.0 35.62 5.0 – –Level 11 ............................. 35.56 5.4 35.56 5.4 – –Level 12 ............................. 48.75 5.4 48.75 5.4 – –Not able to be leveled ........ 29.76 4.3 30.00 4.1 – –
Purchasing agents and buyers,farm products ........................... 33.04 13.5 34.89 11.0 – –
See footnotes at end of table.
NATIONAL COMPENSATION SURVEY
All United States 8-6 December 2006 - January 2008

Table 8 Civilian workers: Mean hourly earnings1 for full-time andpart-time workers2 by work levels3 — Continued
Occupation4 and level
Civilian workers Full-time workers Part-time workers
MeanRelativeerror5 Mean
Relativeerror5 Mean
Relativeerror5
Business and financial operationsoccupations –ContinuedWholesale and retail buyers,
except farm products ............... $28.21 3.7% $28.21 3.7% – –Level 5 .............................. 16.51 8.4 16.51 8.4 – –Level 6 .............................. 20.57 4.1 20.57 4.1 – –Level 7 .............................. 22.79 3.1 22.78 3.2 – –Level 8 .............................. 28.56 14.9 28.56 14.9 – –Level 9 .............................. 31.69 5.0 31.69 5.0 – –Level 10 ............................. 40.55 8.9 40.55 8.9 – –Not able to be leveled ........ 30.68 9.3 30.68 9.3 – –
Purchasing agents, exceptwholesale, retail, and farmproducts ................................... 27.28 2.8 27.28 2.8 – –
Level 5 .............................. 19.34 8.1 19.34 8.1 – –Level 6 .............................. 21.42 4.2 21.42 4.2 – –Level 7 .............................. 22.44 8.2 22.44 8.2 – –Level 8 .............................. 25.51 4.8 25.51 4.8 – –Level 9 .............................. 27.94 4.2 27.94 4.2 – –Level 10 ............................. 34.20 5.7 34.20 5.7 – –Level 11 ............................. 36.44 3.3 36.44 3.3 – –Level 12 ............................. 49.31 6.9 49.31 6.9 – –Not able to be leveled ........ 28.85 7.5 28.85 7.5 – –
Claims adjusters, appraisers,examiners, and investigators ....... 26.16 2.3 26.20 2.3 $23.08 14.3%
Level 4 .............................. 18.17 3.6 18.25 3.6 – –Level 5 .............................. 17.93 2.9 17.93 2.9 – –Level 6 .............................. 22.48 11.5 22.48 11.5 – –Level 7 .............................. 23.77 2.9 23.77 2.9 – –Level 8 .............................. 27.46 4.3 27.47 4.3 – –Level 9 .............................. 31.40 2.0 31.40 2.0 – –Level 10 ............................. 33.90 6.0 34.10 6.6 – –Not able to be leveled ........ 27.10 6.5 27.48 6.5 – –
Claims adjusters, examiners, andinvestigators ............................. 26.10 2.3 26.13 2.3 23.08 14.3
Level 4 .............................. 18.17 3.7 18.25 3.7 – –Level 5 .............................. 17.92 3.0 17.93 3.0 – –Level 6 .............................. 22.64 11.3 22.64 11.3 – –Level 7 .............................. 23.37 2.9 23.37 2.9 – –Level 8 .............................. 27.60 4.4 27.61 4.4 – –Level 9 .............................. 31.50 2.1 31.50 2.1 – –Level 10 ............................. 33.90 6.0 34.10 6.6 – –Not able to be leveled ........ 27.40 6.5 27.82 6.5 – –
Insurance appraisers, auto damage 27.28 9.1 27.28 9.1 – –
See footnotes at end of table.
NATIONAL COMPENSATION SURVEY
All United States 8-7 December 2006 - January 2008
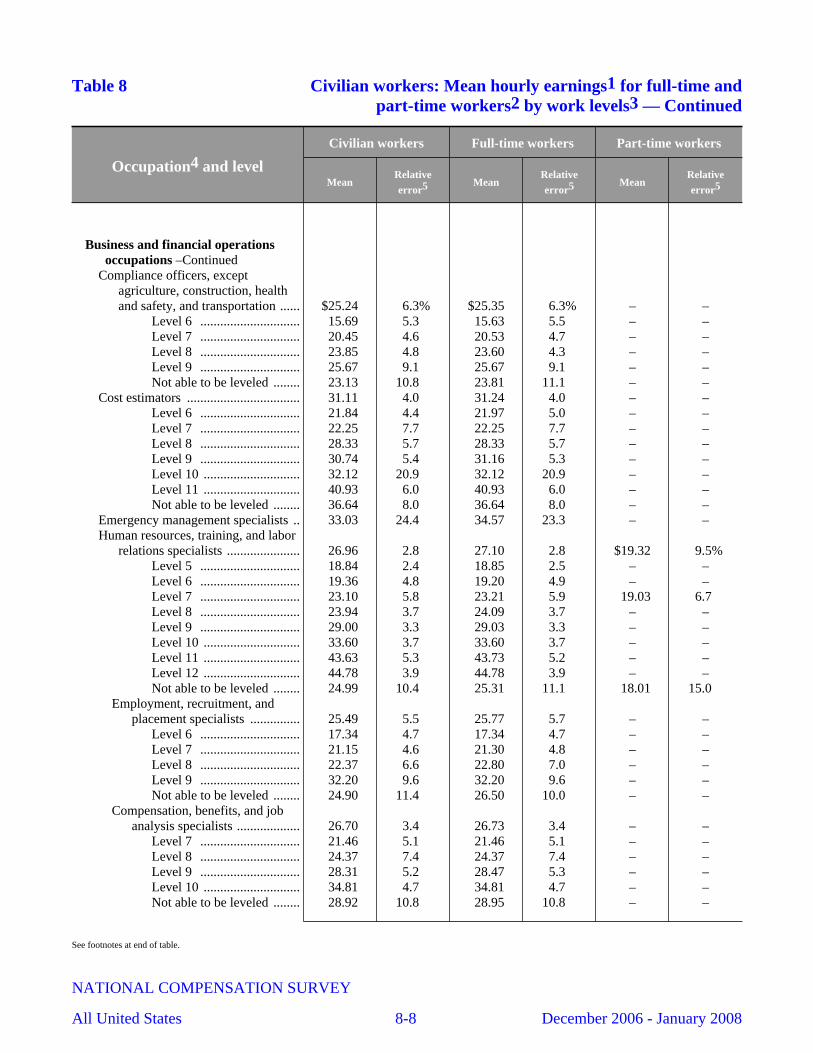
Table 8 Civilian workers: Mean hourly earnings1 for full-time andpart-time workers2 by work levels3 — Continued
Occupation4 and level
Civilian workers Full-time workers Part-time workers
MeanRelativeerror5 Mean
Relativeerror5 Mean
Relativeerror5
Business and financial operationsoccupations –Continued
Compliance officers, exceptagriculture, construction, healthand safety, and transportation ...... $25.24 6.3% $25.35 6.3% – –
Level 6 .............................. 15.69 5.3 15.63 5.5 – –Level 7 .............................. 20.45 4.6 20.53 4.7 – –Level 8 .............................. 23.85 4.8 23.60 4.3 – –Level 9 .............................. 25.67 9.1 25.67 9.1 – –Not able to be leveled ........ 23.13 10.8 23.81 11.1 – –
Cost estimators .................................. 31.11 4.0 31.24 4.0 – –Level 6 .............................. 21.84 4.4 21.97 5.0 – –Level 7 .............................. 22.25 7.7 22.25 7.7 – –Level 8 .............................. 28.33 5.7 28.33 5.7 – –Level 9 .............................. 30.74 5.4 31.16 5.3 – –Level 10 ............................. 32.12 20.9 32.12 20.9 – –Level 11 ............................. 40.93 6.0 40.93 6.0 – –Not able to be leveled ........ 36.64 8.0 36.64 8.0 – –
Emergency management specialists .. 33.03 24.4 34.57 23.3 – –Human resources, training, and labor
relations specialists ...................... 26.96 2.8 27.10 2.8 $19.32 9.5%Level 5 .............................. 18.84 2.4 18.85 2.5 – –Level 6 .............................. 19.36 4.8 19.20 4.9 – –Level 7 .............................. 23.10 5.8 23.21 5.9 19.03 6.7 Level 8 .............................. 23.94 3.7 24.09 3.7 – –Level 9 .............................. 29.00 3.3 29.03 3.3 – –Level 10 ............................. 33.60 3.7 33.60 3.7 – –Level 11 ............................. 43.63 5.3 43.73 5.2 – –Level 12 ............................. 44.78 3.9 44.78 3.9 – –Not able to be leveled ........ 24.99 10.4 25.31 11.1 18.01 15.0
Employment, recruitment, andplacement specialists ............... 25.49 5.5 25.77 5.7 – –
Level 6 .............................. 17.34 4.7 17.34 4.7 – –Level 7 .............................. 21.15 4.6 21.30 4.8 – –Level 8 .............................. 22.37 6.6 22.80 7.0 – –Level 9 .............................. 32.20 9.6 32.20 9.6 – –Not able to be leveled ........ 24.90 11.4 26.50 10.0 – –
Compensation, benefits, and jobanalysis specialists ................... 26.70 3.4 26.73 3.4 – –
Level 7 .............................. 21.46 5.1 21.46 5.1 – –Level 8 .............................. 24.37 7.4 24.37 7.4 – –Level 9 .............................. 28.31 5.2 28.47 5.3 – –Level 10 ............................. 34.81 4.7 34.81 4.7 – –Not able to be leveled ........ 28.92 10.8 28.95 10.8 – –
See footnotes at end of table.
NATIONAL COMPENSATION SURVEY
All United States 8-8 December 2006 - January 2008
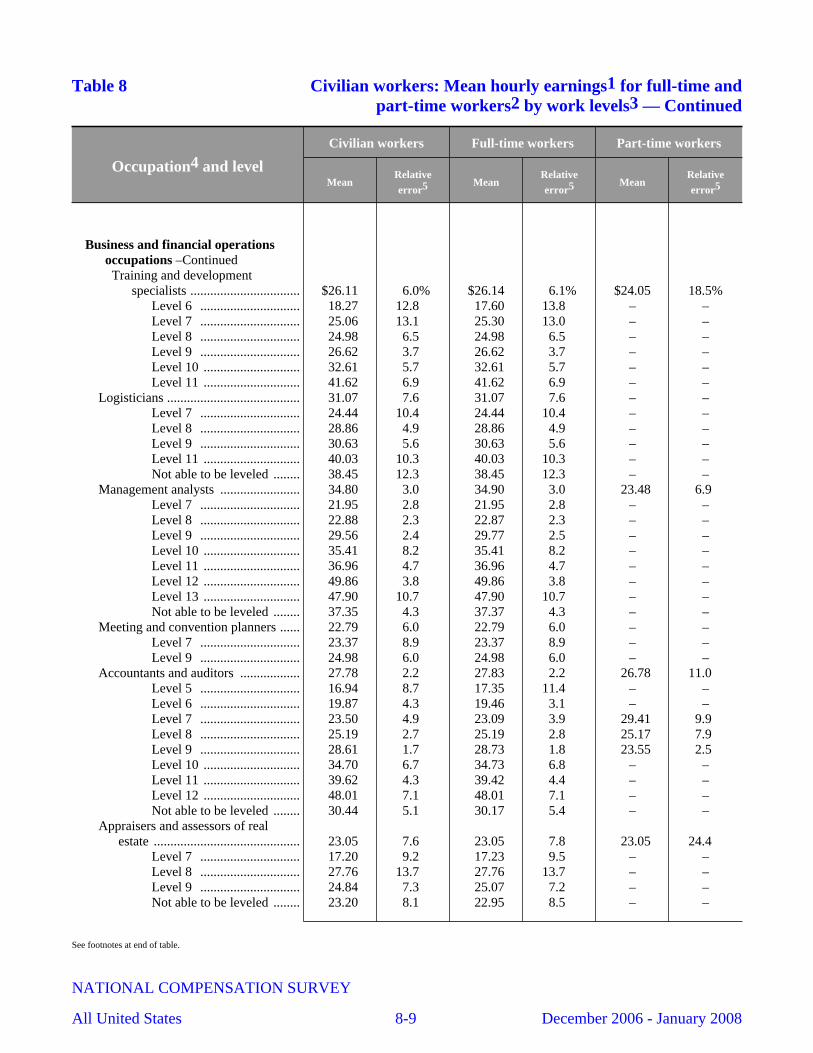
Table 8 Civilian workers: Mean hourly earnings1 for full-time andpart-time workers2 by work levels3 — Continued
Occupation4 and level
Civilian workers Full-time workers Part-time workers
MeanRelativeerror5 Mean
Relativeerror5 Mean
Relativeerror5
Business and financial operationsoccupations –ContinuedTraining and development
specialists ................................. $26.11 6.0% $26.14 6.1% $24.05 18.5%Level 6 .............................. 18.27 12.8 17.60 13.8 – –Level 7 .............................. 25.06 13.1 25.30 13.0 – –Level 8 .............................. 24.98 6.5 24.98 6.5 – –Level 9 .............................. 26.62 3.7 26.62 3.7 – –Level 10 ............................. 32.61 5.7 32.61 5.7 – –Level 11 ............................. 41.62 6.9 41.62 6.9 – –
Logisticians ........................................ 31.07 7.6 31.07 7.6 – –Level 7 .............................. 24.44 10.4 24.44 10.4 – –Level 8 .............................. 28.86 4.9 28.86 4.9 – –Level 9 .............................. 30.63 5.6 30.63 5.6 – –Level 11 ............................. 40.03 10.3 40.03 10.3 – –Not able to be leveled ........ 38.45 12.3 38.45 12.3 – –
Management analysts ........................ 34.80 3.0 34.90 3.0 23.48 6.9 Level 7 .............................. 21.95 2.8 21.95 2.8 – –Level 8 .............................. 22.88 2.3 22.87 2.3 – –Level 9 .............................. 29.56 2.4 29.77 2.5 – –Level 10 ............................. 35.41 8.2 35.41 8.2 – –Level 11 ............................. 36.96 4.7 36.96 4.7 – –Level 12 ............................. 49.86 3.8 49.86 3.8 – –Level 13 ............................. 47.90 10.7 47.90 10.7 – –Not able to be leveled ........ 37.35 4.3 37.37 4.3 – –
Meeting and convention planners ...... 22.79 6.0 22.79 6.0 – –Level 7 .............................. 23.37 8.9 23.37 8.9 – –Level 9 .............................. 24.98 6.0 24.98 6.0 – –
Accountants and auditors .................. 27.78 2.2 27.83 2.2 26.78 11.0 Level 5 .............................. 16.94 8.7 17.35 11.4 – –Level 6 .............................. 19.87 4.3 19.46 3.1 – –Level 7 .............................. 23.50 4.9 23.09 3.9 29.41 9.9 Level 8 .............................. 25.19 2.7 25.19 2.8 25.17 7.9 Level 9 .............................. 28.61 1.7 28.73 1.8 23.55 2.5 Level 10 ............................. 34.70 6.7 34.73 6.8 – –Level 11 ............................. 39.62 4.3 39.42 4.4 – –Level 12 ............................. 48.01 7.1 48.01 7.1 – –Not able to be leveled ........ 30.44 5.1 30.17 5.4 – –
Appraisers and assessors of realestate ............................................ 23.05 7.6 23.05 7.8 23.05 24.4
Level 7 .............................. 17.20 9.2 17.23 9.5 – –Level 8 .............................. 27.76 13.7 27.76 13.7 – –Level 9 .............................. 24.84 7.3 25.07 7.2 – –Not able to be leveled ........ 23.20 8.1 22.95 8.5 – –
See footnotes at end of table.
NATIONAL COMPENSATION SURVEY
All United States 8-9 December 2006 - January 2008
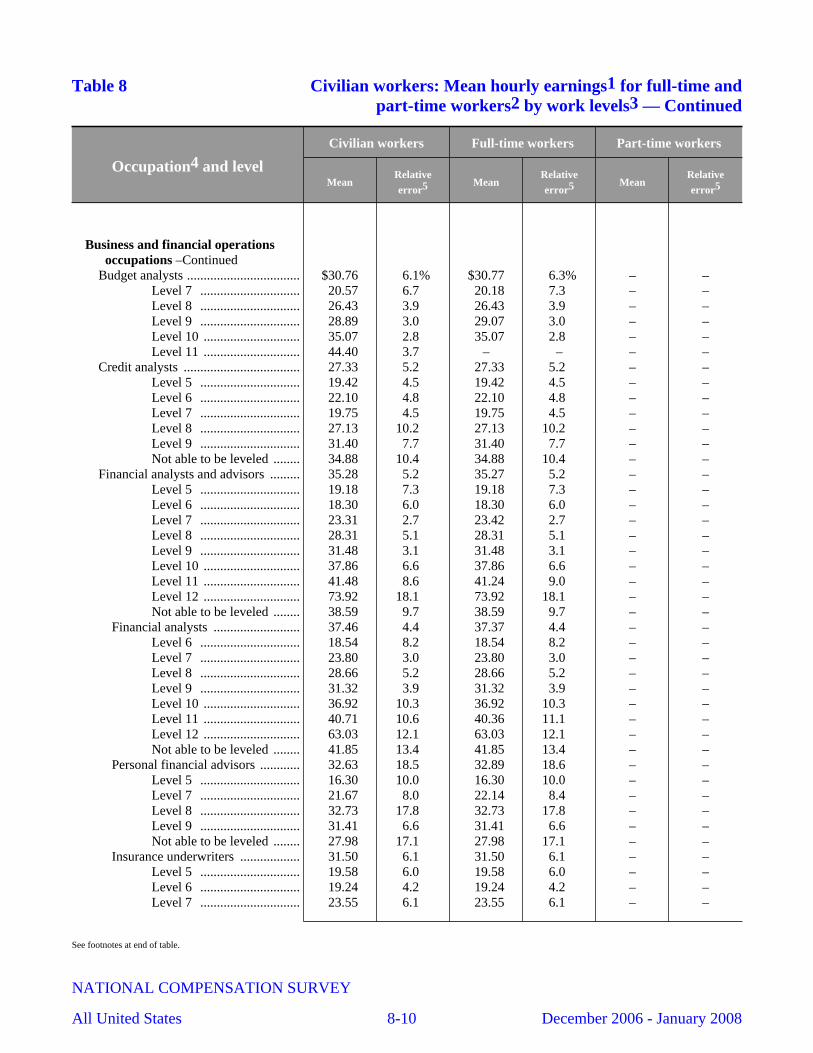
Table 8 Civilian workers: Mean hourly earnings1 for full-time andpart-time workers2 by work levels3 — Continued
Occupation4 and level
Civilian workers Full-time workers Part-time workers
MeanRelativeerror5 Mean
Relativeerror5 Mean
Relativeerror5
Business and financial operationsoccupations –Continued
Budget analysts .................................. $30.76 6.1% $30.77 6.3% – –Level 7 .............................. 20.57 6.7 20.18 7.3 – –Level 8 .............................. 26.43 3.9 26.43 3.9 – –Level 9 .............................. 28.89 3.0 29.07 3.0 – –Level 10 ............................. 35.07 2.8 35.07 2.8 – –Level 11 ............................. 44.40 3.7 – – – –
Credit analysts ................................... 27.33 5.2 27.33 5.2 – –Level 5 .............................. 19.42 4.5 19.42 4.5 – –Level 6 .............................. 22.10 4.8 22.10 4.8 – –Level 7 .............................. 19.75 4.5 19.75 4.5 – –Level 8 .............................. 27.13 10.2 27.13 10.2 – –Level 9 .............................. 31.40 7.7 31.40 7.7 – –Not able to be leveled ........ 34.88 10.4 34.88 10.4 – –
Financial analysts and advisors ......... 35.28 5.2 35.27 5.2 – –Level 5 .............................. 19.18 7.3 19.18 7.3 – –Level 6 .............................. 18.30 6.0 18.30 6.0 – –Level 7 .............................. 23.31 2.7 23.42 2.7 – –Level 8 .............................. 28.31 5.1 28.31 5.1 – –Level 9 .............................. 31.48 3.1 31.48 3.1 – –Level 10 ............................. 37.86 6.6 37.86 6.6 – –Level 11 ............................. 41.48 8.6 41.24 9.0 – –Level 12 ............................. 73.92 18.1 73.92 18.1 – –Not able to be leveled ........ 38.59 9.7 38.59 9.7 – –
Financial analysts .......................... 37.46 4.4 37.37 4.4 – –Level 6 .............................. 18.54 8.2 18.54 8.2 – –Level 7 .............................. 23.80 3.0 23.80 3.0 – –Level 8 .............................. 28.66 5.2 28.66 5.2 – –Level 9 .............................. 31.32 3.9 31.32 3.9 – –Level 10 ............................. 36.92 10.3 36.92 10.3 – –Level 11 ............................. 40.71 10.6 40.36 11.1 – –Level 12 ............................. 63.03 12.1 63.03 12.1 – –Not able to be leveled ........ 41.85 13.4 41.85 13.4 – –
Personal financial advisors ............ 32.63 18.5 32.89 18.6 – –Level 5 .............................. 16.30 10.0 16.30 10.0 – –Level 7 .............................. 21.67 8.0 22.14 8.4 – –Level 8 .............................. 32.73 17.8 32.73 17.8 – –Level 9 .............................. 31.41 6.6 31.41 6.6 – –Not able to be leveled ........ 27.98 17.1 27.98 17.1 – –
Insurance underwriters .................. 31.50 6.1 31.50 6.1 – –Level 5 .............................. 19.58 6.0 19.58 6.0 – –Level 6 .............................. 19.24 4.2 19.24 4.2 – –Level 7 .............................. 23.55 6.1 23.55 6.1 – –
See footnotes at end of table.
NATIONAL COMPENSATION SURVEY
All United States 8-10 December 2006 - January 2008
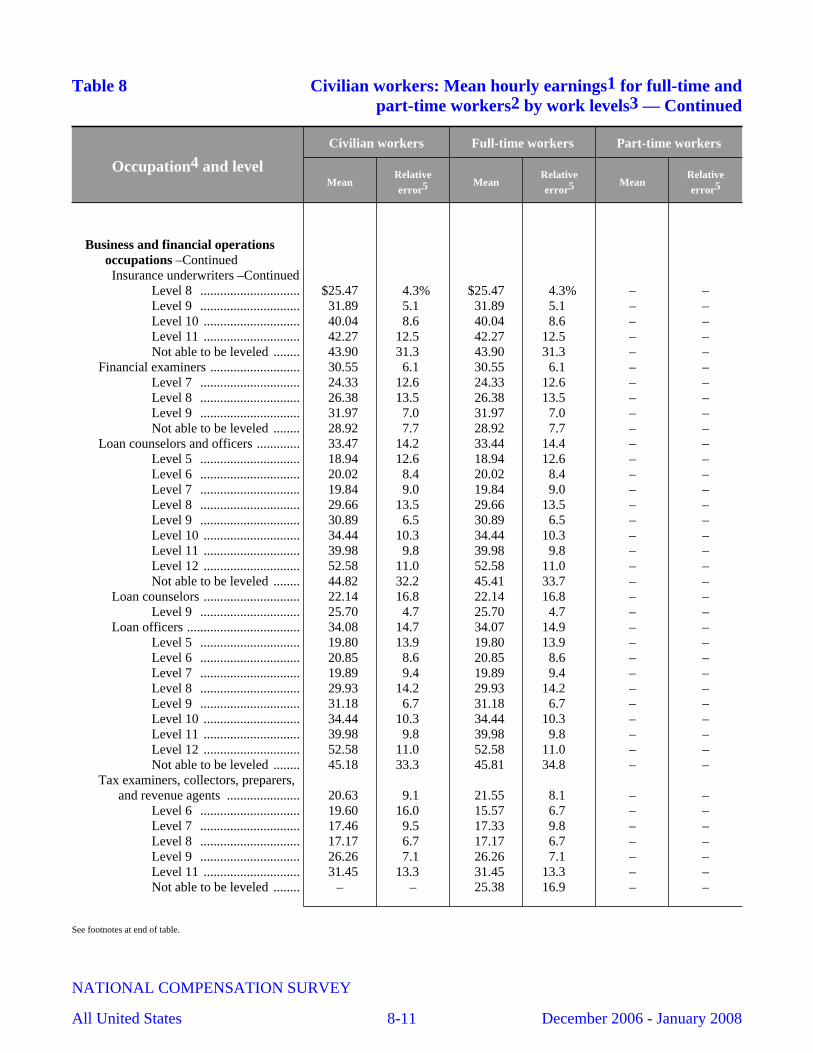
Table 8 Civilian workers: Mean hourly earnings1 for full-time andpart-time workers2 by work levels3 — Continued
Occupation4 and level
Civilian workers Full-time workers Part-time workers
MeanRelativeerror5 Mean
Relativeerror5 Mean
Relativeerror5
Business and financial operationsoccupations –ContinuedInsurance underwriters –Continued
Level 8 .............................. $25.47 4.3% $25.47 4.3% – –Level 9 .............................. 31.89 5.1 31.89 5.1 – –Level 10 ............................. 40.04 8.6 40.04 8.6 – –Level 11 ............................. 42.27 12.5 42.27 12.5 – –Not able to be leveled ........ 43.90 31.3 43.90 31.3 – –
Financial examiners ........................... 30.55 6.1 30.55 6.1 – –Level 7 .............................. 24.33 12.6 24.33 12.6 – –Level 8 .............................. 26.38 13.5 26.38 13.5 – –Level 9 .............................. 31.97 7.0 31.97 7.0 – –Not able to be leveled ........ 28.92 7.7 28.92 7.7 – –
Loan counselors and officers ............. 33.47 14.2 33.44 14.4 – –Level 5 .............................. 18.94 12.6 18.94 12.6 – –Level 6 .............................. 20.02 8.4 20.02 8.4 – –Level 7 .............................. 19.84 9.0 19.84 9.0 – –Level 8 .............................. 29.66 13.5 29.66 13.5 – –Level 9 .............................. 30.89 6.5 30.89 6.5 – –Level 10 ............................. 34.44 10.3 34.44 10.3 – –Level 11 ............................. 39.98 9.8 39.98 9.8 – –Level 12 ............................. 52.58 11.0 52.58 11.0 – –Not able to be leveled ........ 44.82 32.2 45.41 33.7 – –
Loan counselors ............................. 22.14 16.8 22.14 16.8 – –Level 9 .............................. 25.70 4.7 25.70 4.7 – –
Loan officers .................................. 34.08 14.7 34.07 14.9 – –Level 5 .............................. 19.80 13.9 19.80 13.9 – –Level 6 .............................. 20.85 8.6 20.85 8.6 – –Level 7 .............................. 19.89 9.4 19.89 9.4 – –Level 8 .............................. 29.93 14.2 29.93 14.2 – –Level 9 .............................. 31.18 6.7 31.18 6.7 – –Level 10 ............................. 34.44 10.3 34.44 10.3 – –Level 11 ............................. 39.98 9.8 39.98 9.8 – –Level 12 ............................. 52.58 11.0 52.58 11.0 – –Not able to be leveled ........ 45.18 33.3 45.81 34.8 – –
Tax examiners, collectors, preparers,and revenue agents ...................... 20.63 9.1 21.55 8.1 – –
Level 6 .............................. 19.60 16.0 15.57 6.7 – –Level 7 .............................. 17.46 9.5 17.33 9.8 – –Level 8 .............................. 17.17 6.7 17.17 6.7 – –Level 9 .............................. 26.26 7.1 26.26 7.1 – –Level 11 ............................. 31.45 13.3 31.45 13.3 – –Not able to be leveled ........ – – 25.38 16.9 – –
See footnotes at end of table.
NATIONAL COMPENSATION SURVEY
All United States 8-11 December 2006 - January 2008
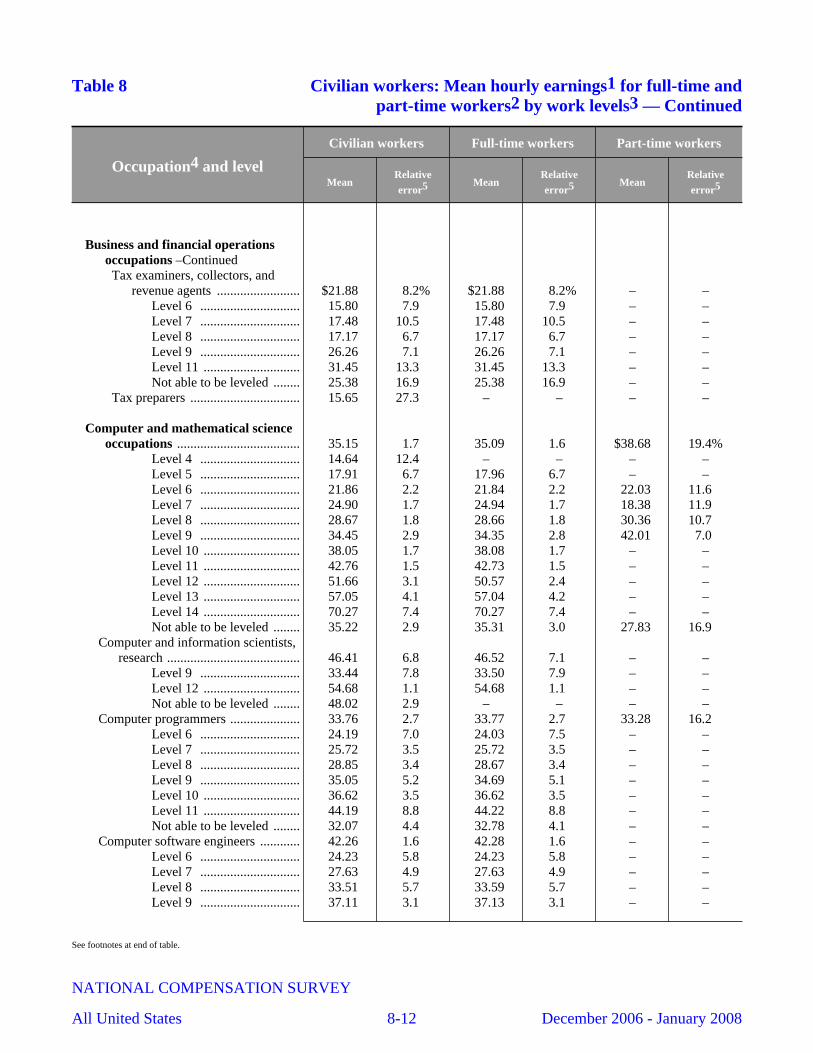
Table 8 Civilian workers: Mean hourly earnings1 for full-time andpart-time workers2 by work levels3 — Continued
Occupation4 and level
Civilian workers Full-time workers Part-time workers
MeanRelativeerror5 Mean
Relativeerror5 Mean
Relativeerror5
Business and financial operationsoccupations –ContinuedTax examiners, collectors, and
revenue agents ......................... $21.88 8.2% $21.88 8.2% – –Level 6 .............................. 15.80 7.9 15.80 7.9 – –Level 7 .............................. 17.48 10.5 17.48 10.5 – –Level 8 .............................. 17.17 6.7 17.17 6.7 – –Level 9 .............................. 26.26 7.1 26.26 7.1 – –Level 11 ............................. 31.45 13.3 31.45 13.3 – –Not able to be leveled ........ 25.38 16.9 25.38 16.9 – –
Tax preparers ................................. 15.65 27.3 – – – –
Computer and mathematical scienceoccupations ..................................... 35.15 1.7 35.09 1.6 $38.68 19.4%
Level 4 .............................. 14.64 12.4 – – – –Level 5 .............................. 17.91 6.7 17.96 6.7 – –Level 6 .............................. 21.86 2.2 21.84 2.2 22.03 11.6 Level 7 .............................. 24.90 1.7 24.94 1.7 18.38 11.9 Level 8 .............................. 28.67 1.8 28.66 1.8 30.36 10.7 Level 9 .............................. 34.45 2.9 34.35 2.8 42.01 7.0 Level 10 ............................. 38.05 1.7 38.08 1.7 – –Level 11 ............................. 42.76 1.5 42.73 1.5 – –Level 12 ............................. 51.66 3.1 50.57 2.4 – –Level 13 ............................. 57.05 4.1 57.04 4.2 – –Level 14 ............................. 70.27 7.4 70.27 7.4 – –Not able to be leveled ........ 35.22 2.9 35.31 3.0 27.83 16.9
Computer and information scientists,research ........................................ 46.41 6.8 46.52 7.1 – –
Level 9 .............................. 33.44 7.8 33.50 7.9 – –Level 12 ............................. 54.68 1.1 54.68 1.1 – –Not able to be leveled ........ 48.02 2.9 – – – –
Computer programmers ..................... 33.76 2.7 33.77 2.7 33.28 16.2 Level 6 .............................. 24.19 7.0 24.03 7.5 – –Level 7 .............................. 25.72 3.5 25.72 3.5 – –Level 8 .............................. 28.85 3.4 28.67 3.4 – –Level 9 .............................. 35.05 5.2 34.69 5.1 – –Level 10 ............................. 36.62 3.5 36.62 3.5 – –Level 11 ............................. 44.19 8.8 44.22 8.8 – –Not able to be leveled ........ 32.07 4.4 32.78 4.1 – –
Computer software engineers ............ 42.26 1.6 42.28 1.6 – –Level 6 .............................. 24.23 5.8 24.23 5.8 – –Level 7 .............................. 27.63 4.9 27.63 4.9 – –Level 8 .............................. 33.51 5.7 33.59 5.7 – –Level 9 .............................. 37.11 3.1 37.13 3.1 – –
See footnotes at end of table.
NATIONAL COMPENSATION SURVEY
All United States 8-12 December 2006 - January 2008

Table 8 Civilian workers: Mean hourly earnings1 for full-time andpart-time workers2 by work levels3 — Continued
Occupation4 and level
Civilian workers Full-time workers Part-time workers
MeanRelativeerror5 Mean
Relativeerror5 Mean
Relativeerror5
Computer and mathematical scienceoccupations –Continued
Computer software engineers–Continued
Level 10 ............................. $38.99 3.0% $38.99 3.0% – –Level 11 ............................. 45.21 1.7 45.21 1.7 – –Level 12 ............................. 51.62 2.8 51.62 2.8 – –Level 13 ............................. 59.86 3.9 59.86 3.9 – –Level 14 ............................. 75.98 3.6 75.98 3.6 – –Not able to be leveled ........ 44.61 3.5 44.67 3.5 – –
Computer software engineers,applications .............................. 41.20 2.7 41.22 2.7 – –
Level 7 .............................. 27.50 5.3 27.50 5.3 – –Level 8 .............................. 32.87 8.9 33.03 8.9 – –Level 9 .............................. 38.37 4.3 38.40 4.2 – –Level 10 ............................. 39.27 4.9 39.27 4.9 – –Level 11 ............................. 46.43 2.4 46.43 2.4 – –Level 12 ............................. 51.67 5.8 51.67 5.8 – –Level 13 ............................. 56.29 7.3 56.29 7.3 – –Not able to be leveled ........ 43.42 4.2 43.42 4.2 – –
Computer software engineers,systems software ...................... 43.44 1.9 43.47 1.9 – –
Level 7 .............................. 28.36 5.5 28.36 5.5 – –Level 8 .............................. 34.19 5.7 34.19 5.7 – –Level 9 .............................. 35.19 2.7 35.20 2.7 – –Level 10 ............................. 38.65 2.2 38.65 2.2 – –Level 11 ............................. 43.90 1.5 43.90 1.5 – –Level 12 ............................. 51.57 1.5 51.57 1.5 – –Level 13 ............................. 60.82 4.4 60.82 4.4 – –Level 14 ............................. 72.64 2.2 72.64 2.2 – –Not able to be leveled ........ 45.50 5.0 45.62 5.0 – –
Computer support specialists ............. 24.82 3.6 24.99 3.4 $14.41 13.4%Level 5 .............................. 16.48 4.5 16.48 4.7 – –Level 6 .............................. 20.72 2.7 20.83 2.7 – –Level 7 .............................. 25.11 3.4 25.11 3.4 – –Level 8 .............................. 26.90 3.2 26.90 3.2 – –Level 9 .............................. 33.03 6.1 33.03 6.1 – –Level 10 ............................. 39.69 9.3 39.69 9.3 – –Level 11 ............................. 44.52 9.3 44.52 9.3 – –Level 12 ............................. 54.44 4.6 54.44 4.6 – –Not able to be leveled ........ 22.94 6.5 22.94 6.5 – –
Computer systems analysts ................ 38.28 2.3 37.64 1.6 60.10 17.7 Level 5 .............................. 23.99 8.1 23.99 8.1 – –Level 6 .............................. 23.75 7.4 23.53 7.8 – –
See footnotes at end of table.
NATIONAL COMPENSATION SURVEY
All United States 8-13 December 2006 - January 2008

Table 8 Civilian workers: Mean hourly earnings1 for full-time andpart-time workers2 by work levels3 — Continued
Occupation4 and level
Civilian workers Full-time workers Part-time workers
MeanRelativeerror5 Mean
Relativeerror5 Mean
Relativeerror5
Computer and mathematical scienceoccupations –Continued
Computer systems analysts–Continued
Level 7 .............................. $25.60 4.0% $25.73 3.9% – –Level 8 .............................. 28.02 3.6 28.02 3.6 – –Level 9 .............................. 33.38 1.1 33.24 1.1 – –Level 10 ............................. 36.90 2.3 36.90 2.3 – –Level 11 ............................. 41.61 2.1 41.45 2.2 – –Level 12 ............................. 53.52 5.3 50.43 2.8 – –Level 13 ............................. 50.35 7.8 50.35 7.8 – –Not able to be leveled ........ 37.11 2.6 37.16 2.5 – –
Database administrators ..................... 32.90 4.8 32.82 5.0 – –Level 7 .............................. 21.80 3.9 21.80 3.9 – –Level 8 .............................. 27.56 12.2 27.56 12.2 – –Level 9 .............................. 35.23 5.1 35.05 5.3 – –Level 10 ............................. 34.02 3.9 34.02 3.9 – –Level 11 ............................. 38.97 4.2 38.97 4.2 – –Level 12 ............................. 50.79 8.7 50.79 8.7 – –Not able to be leveled ........ 28.64 15.0 28.64 15.0 – –
Network and computer systemsadministrators .............................. 30.81 2.2 31.05 2.2 $20.69 7.8%
Level 6 .............................. 21.35 6.5 22.01 7.1 – –Level 7 .............................. 23.08 3.0 23.22 3.0 – –Level 8 .............................. 29.10 3.5 29.16 3.5 – –Level 9 .............................. 32.07 2.6 32.07 2.6 – –Level 10 ............................. 39.07 5.3 39.46 5.3 – –Level 11 ............................. 39.56 4.0 39.56 4.0 – –Level 12 ............................. 57.60 13.1 57.60 13.1 – –Not able to be leveled ........ 29.89 12.2 29.89 12.2 – –
Network systems and datacommunications analysts ............. 32.64 4.0 32.51 4.4 – –
Level 7 .............................. 21.95 3.5 21.95 3.5 – –Level 8 .............................. 28.08 4.5 28.08 4.5 – –Level 9 .............................. 31.61 8.2 30.97 8.1 – –Level 10 ............................. 38.73 8.7 39.14 8.9 – –Level 11 ............................. 39.21 3.9 39.21 3.9 – –Level 12 ............................. 45.29 1.7 45.29 1.7 – –Not able to be leveled ........ 33.27 9.2 33.27 9.2 – –
Actuaries ............................................ 40.73 4.5 40.73 4.5 – –Level 11 ............................. 47.25 10.5 47.25 10.5 – –Not able to be leveled ........ 40.00 6.7 40.00 6.7 – –
Operations research analysts ............. 33.20 4.4 33.20 4.4 – –Level 7 .............................. 23.62 2.2 23.62 2.2 – –
See footnotes at end of table.
NATIONAL COMPENSATION SURVEY
All United States 8-14 December 2006 - January 2008
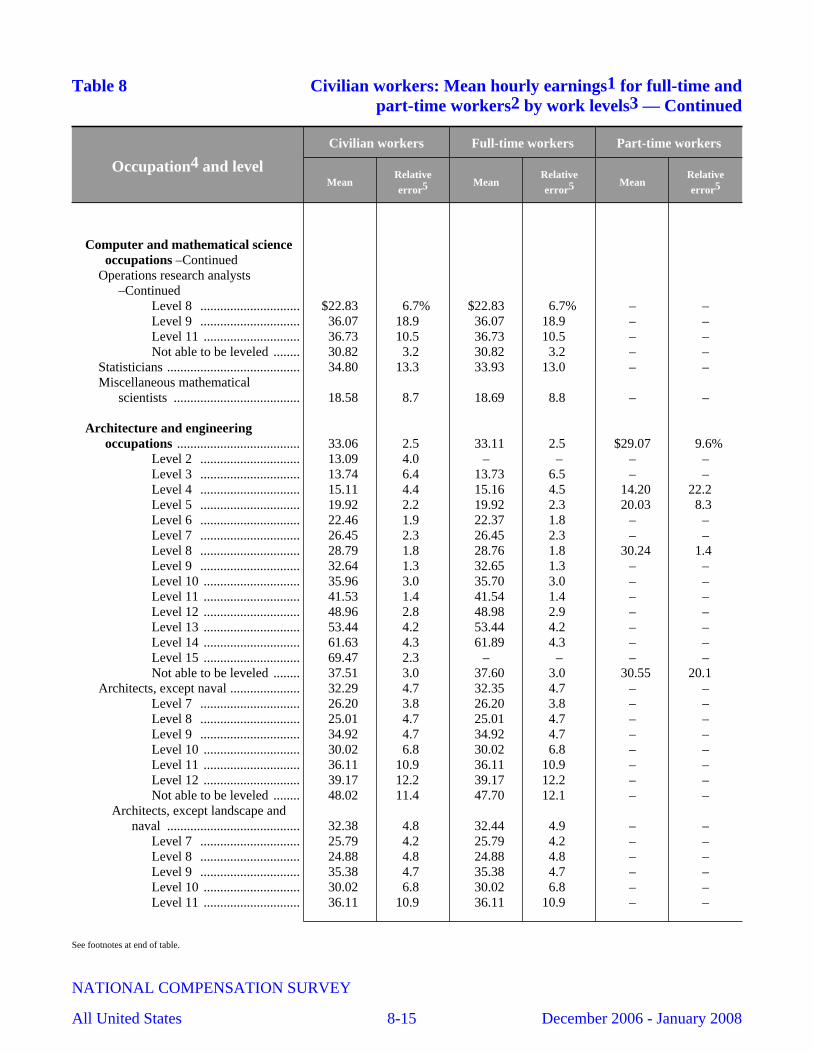
Table 8 Civilian workers: Mean hourly earnings1 for full-time andpart-time workers2 by work levels3 — Continued
Occupation4 and level
Civilian workers Full-time workers Part-time workers
MeanRelativeerror5 Mean
Relativeerror5 Mean
Relativeerror5
Computer and mathematical scienceoccupations –Continued
Operations research analysts–Continued
Level 8 .............................. $22.83 6.7% $22.83 6.7% – –Level 9 .............................. 36.07 18.9 36.07 18.9 – –Level 11 ............................. 36.73 10.5 36.73 10.5 – –Not able to be leveled ........ 30.82 3.2 30.82 3.2 – –
Statisticians ........................................ 34.80 13.3 33.93 13.0 – –Miscellaneous mathematical
scientists ...................................... 18.58 8.7 18.69 8.8 – –
Architecture and engineeringoccupations ..................................... 33.06 2.5 33.11 2.5 $29.07 9.6%
Level 2 .............................. 13.09 4.0 – – – –Level 3 .............................. 13.74 6.4 13.73 6.5 – –Level 4 .............................. 15.11 4.4 15.16 4.5 14.20 22.2 Level 5 .............................. 19.92 2.2 19.92 2.3 20.03 8.3 Level 6 .............................. 22.46 1.9 22.37 1.8 – –Level 7 .............................. 26.45 2.3 26.45 2.3 – –Level 8 .............................. 28.79 1.8 28.76 1.8 30.24 1.4 Level 9 .............................. 32.64 1.3 32.65 1.3 – –Level 10 ............................. 35.96 3.0 35.70 3.0 – –Level 11 ............................. 41.53 1.4 41.54 1.4 – –Level 12 ............................. 48.96 2.8 48.98 2.9 – –Level 13 ............................. 53.44 4.2 53.44 4.2 – –Level 14 ............................. 61.63 4.3 61.89 4.3 – –Level 15 ............................. 69.47 2.3 – – – –Not able to be leveled ........ 37.51 3.0 37.60 3.0 30.55 20.1
Architects, except naval ..................... 32.29 4.7 32.35 4.7 – –Level 7 .............................. 26.20 3.8 26.20 3.8 – –Level 8 .............................. 25.01 4.7 25.01 4.7 – –Level 9 .............................. 34.92 4.7 34.92 4.7 – –Level 10 ............................. 30.02 6.8 30.02 6.8 – –Level 11 ............................. 36.11 10.9 36.11 10.9 – –Level 12 ............................. 39.17 12.2 39.17 12.2 – –Not able to be leveled ........ 48.02 11.4 47.70 12.1 – –
Architects, except landscape andnaval ........................................ 32.38 4.8 32.44 4.9 – –
Level 7 .............................. 25.79 4.2 25.79 4.2 – –Level 8 .............................. 24.88 4.8 24.88 4.8 – –Level 9 .............................. 35.38 4.7 35.38 4.7 – –Level 10 ............................. 30.02 6.8 30.02 6.8 – –Level 11 ............................. 36.11 10.9 36.11 10.9 – –
See footnotes at end of table.
NATIONAL COMPENSATION SURVEY
All United States 8-15 December 2006 - January 2008
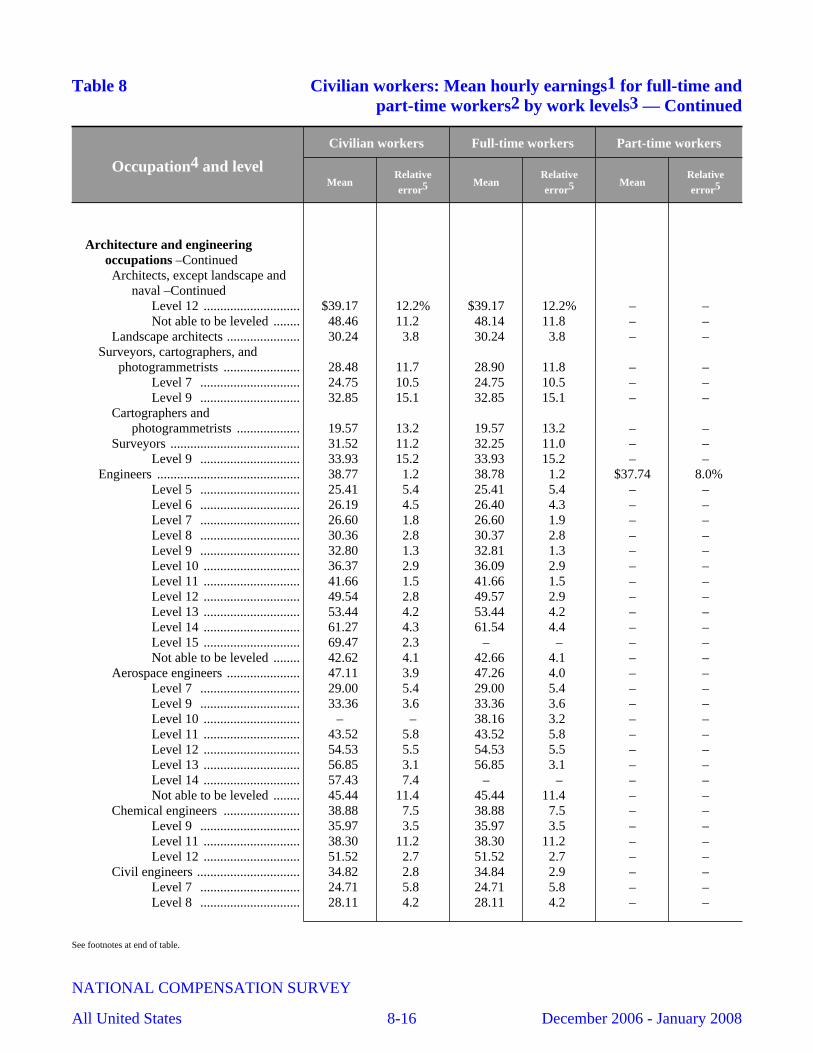
Table 8 Civilian workers: Mean hourly earnings1 for full-time andpart-time workers2 by work levels3 — Continued
Occupation4 and level
Civilian workers Full-time workers Part-time workers
MeanRelativeerror5 Mean
Relativeerror5 Mean
Relativeerror5
Architecture and engineeringoccupations –ContinuedArchitects, except landscape and
naval –ContinuedLevel 12 ............................. $39.17 12.2% $39.17 12.2% – –Not able to be leveled ........ 48.46 11.2 48.14 11.8 – –
Landscape architects ...................... 30.24 3.8 30.24 3.8 – –Surveyors, cartographers, and
photogrammetrists ....................... 28.48 11.7 28.90 11.8 – –Level 7 .............................. 24.75 10.5 24.75 10.5 – –Level 9 .............................. 32.85 15.1 32.85 15.1 – –
Cartographers andphotogrammetrists ................... 19.57 13.2 19.57 13.2 – –
Surveyors ....................................... 31.52 11.2 32.25 11.0 – –Level 9 .............................. 33.93 15.2 33.93 15.2 – –
Engineers ........................................... 38.77 1.2 38.78 1.2 $37.74 8.0%Level 5 .............................. 25.41 5.4 25.41 5.4 – –Level 6 .............................. 26.19 4.5 26.40 4.3 – –Level 7 .............................. 26.60 1.8 26.60 1.9 – –Level 8 .............................. 30.36 2.8 30.37 2.8 – –Level 9 .............................. 32.80 1.3 32.81 1.3 – –Level 10 ............................. 36.37 2.9 36.09 2.9 – –Level 11 ............................. 41.66 1.5 41.66 1.5 – –Level 12 ............................. 49.54 2.8 49.57 2.9 – –Level 13 ............................. 53.44 4.2 53.44 4.2 – –Level 14 ............................. 61.27 4.3 61.54 4.4 – –Level 15 ............................. 69.47 2.3 – – – –Not able to be leveled ........ 42.62 4.1 42.66 4.1 – –
Aerospace engineers ...................... 47.11 3.9 47.26 4.0 – –Level 7 .............................. 29.00 5.4 29.00 5.4 – –Level 9 .............................. 33.36 3.6 33.36 3.6 – –Level 10 ............................. – – 38.16 3.2 – –Level 11 ............................. 43.52 5.8 43.52 5.8 – –Level 12 ............................. 54.53 5.5 54.53 5.5 – –Level 13 ............................. 56.85 3.1 56.85 3.1 – –Level 14 ............................. 57.43 7.4 – – – –Not able to be leveled ........ 45.44 11.4 45.44 11.4 – –
Chemical engineers ....................... 38.88 7.5 38.88 7.5 – –Level 9 .............................. 35.97 3.5 35.97 3.5 – –Level 11 ............................. 38.30 11.2 38.30 11.2 – –Level 12 ............................. 51.52 2.7 51.52 2.7 – –
Civil engineers ............................... 34.82 2.8 34.84 2.9 – –Level 7 .............................. 24.71 5.8 24.71 5.8 – –Level 8 .............................. 28.11 4.2 28.11 4.2 – –
See footnotes at end of table.
NATIONAL COMPENSATION SURVEY
All United States 8-16 December 2006 - January 2008

Table 8 Civilian workers: Mean hourly earnings1 for full-time andpart-time workers2 by work levels3 — Continued
Occupation4 and level
Civilian workers Full-time workers Part-time workers
MeanRelativeerror5 Mean
Relativeerror5 Mean
Relativeerror5
Architecture and engineeringoccupations –ContinuedCivil engineers –Continued
Level 9 .............................. $31.70 4.5% $31.74 4.6% – –Level 10 ............................. 32.29 4.7 32.29 4.7 – –Level 11 ............................. 43.09 4.0 43.09 4.0 – –Level 12 ............................. 51.41 5.1 51.41 5.1 – –Not able to be leveled ........ 36.94 5.4 36.94 5.4 – –
Computer hardware engineers ....... 43.49 6.3 43.61 6.4 – –Level 7 .............................. 26.38 6.5 26.38 6.5 – –Level 9 .............................. 32.49 4.3 32.49 4.3 – –Level 10 ............................. 40.56 8.8 41.39 9.5 – –Level 11 ............................. 45.76 1.1 45.76 1.1 – –Level 12 ............................. 61.52 7.0 61.52 7.0 – –Not able to be leveled ........ 49.29 3.4 49.29 3.4 – –
Electrical and electronicsengineers .................................. 39.09 2.6 39.11 2.5 – –
Level 7 .............................. 25.39 6.0 25.28 6.1 – –Level 8 .............................. 35.15 7.9 35.15 7.9 – –Level 9 .............................. 32.78 2.8 32.81 2.8 – –Level 10 ............................. 37.14 6.0 36.41 6.0 – –Level 11 ............................. 43.19 1.8 43.19 1.8 – –Level 12 ............................. 45.10 1.9 45.10 1.9 – –Level 13 ............................. 59.14 3.5 59.14 3.5 – –Not able to be leveled ........ 45.95 5.2 45.95 5.2 – –
Electrical engineers ................... 38.45 4.6 38.62 4.4 – –Level 7 .............................. 26.38 6.6 26.34 7.0 – –Level 8 .............................. 38.57 7.1 38.57 7.1 – –Level 9 .............................. 32.82 5.4 32.88 5.4 – –Level 10 ............................. 35.98 7.9 35.98 7.9 – –Level 11 ............................. 43.26 2.6 43.26 2.6 – –Level 12 ............................. 43.98 3.3 43.98 3.3 – –Level 13 ............................. 60.74 4.1 60.74 4.1 – –Not able to be leveled ........ 46.62 11.9 46.62 11.9 – –
Electronics engineers, exceptcomputer .............................. 39.65 2.8 39.53 2.8 – –Level 8 .............................. 28.31 9.3 28.31 9.3 – –Level 9 .............................. 32.75 2.3 32.75 2.3 – –Level 10 ............................. 37.91 8.0 36.73 7.5 – –Level 11 ............................. 43.13 2.7 43.13 2.7 – –Level 12 ............................. 45.88 2.7 45.88 2.7 – –Not able to be leveled ........ 45.76 4.6 45.76 4.6 – –
Environmental engineers ............... 40.16 6.5 39.98 6.9 – –Level 8 .............................. 30.11 10.3 30.11 10.3 – –
See footnotes at end of table.
NATIONAL COMPENSATION SURVEY
All United States 8-17 December 2006 - January 2008

Table 8 Civilian workers: Mean hourly earnings1 for full-time andpart-time workers2 by work levels3 — Continued
Occupation4 and level
Civilian workers Full-time workers Part-time workers
MeanRelativeerror5 Mean
Relativeerror5 Mean
Relativeerror5
Architecture and engineeringoccupations –ContinuedEnvironmental engineers
–ContinuedLevel 9 .............................. $32.91 9.6% $32.91 9.6% – –Level 11 ............................. 47.16 11.7 47.16 11.7 – –
Industrial engineers, includinghealth and safety ...................... 36.23 2.7 36.27 2.7 – –
Level 7 .............................. 26.42 5.1 26.43 5.4 – –Level 8 .............................. 28.95 7.3 28.97 7.4 – –Level 9 .............................. 32.29 2.6 32.29 2.6 – –Level 10 ............................. 38.01 5.6 38.01 5.6 – –Level 11 ............................. 38.50 4.9 38.50 4.9 – –Level 12 ............................. 45.20 4.3 45.20 4.3 – –Not able to be leveled ........ 43.17 10.4 43.17 10.4 – –
Health and safety engineers,except mining safetyengineers and inspectors ...... 41.30 11.8 41.30 11.8 – –Level 9 .............................. 31.91 8.1 31.91 8.1 – –
Industrial engineers ................... 35.03 2.0 35.07 2.0 – –Level 7 .............................. 26.09 5.5 26.08 5.8 – –Level 8 .............................. 28.99 8.6 29.01 8.6 – –Level 9 .............................. 32.32 2.8 32.32 2.8 – –Level 10 ............................. 38.01 5.6 38.01 5.6 – –Level 11 ............................. 39.61 3.5 39.61 3.5 – –Level 12 ............................. 43.31 5.2 43.31 5.2 – –Not able to be leveled ........ 39.42 4.9 39.42 4.9 – –
Marine engineers and navalarchitects .................................. 31.28 8.0 31.28 8.0 – –
Materials engineers ........................ 37.57 7.6 37.57 7.6 – –Level 9 .............................. 32.39 7.1 32.39 7.1 – –Level 11 ............................. 44.58 9.7 44.58 9.7 – –
Mechanical engineers .................... 34.99 2.1 34.98 2.1 – –Level 7 .............................. 27.46 4.3 27.46 4.3 – –Level 8 .............................. 28.80 5.5 28.81 5.6 – –Level 9 .............................. 31.66 2.1 31.66 2.1 – –Level 10 ............................. 35.36 4.9 35.36 4.9 – –Level 11 ............................. 38.40 3.4 38.40 3.5 – –Level 12 ............................. 49.70 4.4 49.70 4.4 – –Not able to be leveled ........ 39.59 5.8 39.59 5.8 – –
Nuclear engineers .......................... 42.63 6.2 42.63 6.2 – –Level 12 ............................. 50.04 1.1 50.04 1.1 – –Not able to be leveled ........ 51.18 14.0 51.18 14.0 – –
Petroleum engineers ...................... 48.78 15.7 48.78 15.7 – –
See footnotes at end of table.
NATIONAL COMPENSATION SURVEY
All United States 8-18 December 2006 - January 2008
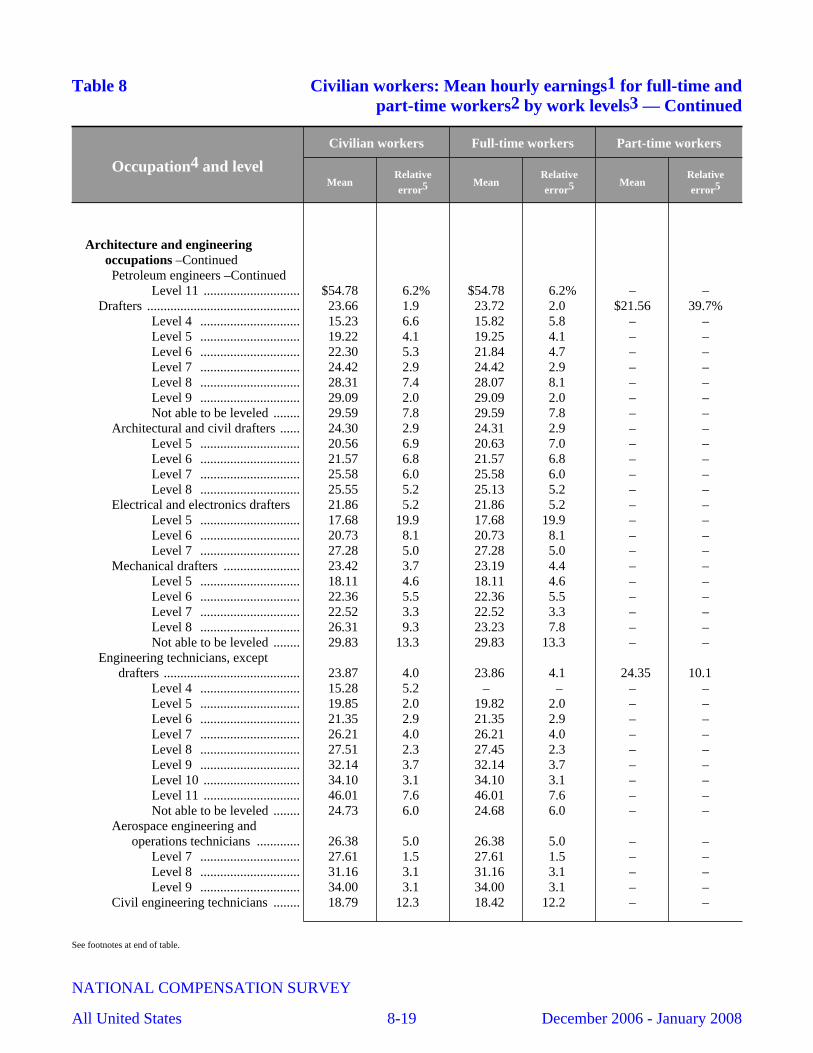
Table 8 Civilian workers: Mean hourly earnings1 for full-time andpart-time workers2 by work levels3 — Continued
Occupation4 and level
Civilian workers Full-time workers Part-time workers
MeanRelativeerror5 Mean
Relativeerror5 Mean
Relativeerror5
Architecture and engineeringoccupations –ContinuedPetroleum engineers –Continued
Level 11 ............................. $54.78 6.2% $54.78 6.2% – –Drafters .............................................. 23.66 1.9 23.72 2.0 $21.56 39.7%
Level 4 .............................. 15.23 6.6 15.82 5.8 – –Level 5 .............................. 19.22 4.1 19.25 4.1 – –Level 6 .............................. 22.30 5.3 21.84 4.7 – –Level 7 .............................. 24.42 2.9 24.42 2.9 – –Level 8 .............................. 28.31 7.4 28.07 8.1 – –Level 9 .............................. 29.09 2.0 29.09 2.0 – –Not able to be leveled ........ 29.59 7.8 29.59 7.8 – –
Architectural and civil drafters ...... 24.30 2.9 24.31 2.9 – –Level 5 .............................. 20.56 6.9 20.63 7.0 – –Level 6 .............................. 21.57 6.8 21.57 6.8 – –Level 7 .............................. 25.58 6.0 25.58 6.0 – –Level 8 .............................. 25.55 5.2 25.13 5.2 – –
Electrical and electronics drafters 21.86 5.2 21.86 5.2 – –Level 5 .............................. 17.68 19.9 17.68 19.9 – –Level 6 .............................. 20.73 8.1 20.73 8.1 – –Level 7 .............................. 27.28 5.0 27.28 5.0 – –
Mechanical drafters ....................... 23.42 3.7 23.19 4.4 – –Level 5 .............................. 18.11 4.6 18.11 4.6 – –Level 6 .............................. 22.36 5.5 22.36 5.5 – –Level 7 .............................. 22.52 3.3 22.52 3.3 – –Level 8 .............................. 26.31 9.3 23.23 7.8 – –Not able to be leveled ........ 29.83 13.3 29.83 13.3 – –
Engineering technicians, exceptdrafters ......................................... 23.87 4.0 23.86 4.1 24.35 10.1
Level 4 .............................. 15.28 5.2 – – – –Level 5 .............................. 19.85 2.0 19.82 2.0 – –Level 6 .............................. 21.35 2.9 21.35 2.9 – –Level 7 .............................. 26.21 4.0 26.21 4.0 – –Level 8 .............................. 27.51 2.3 27.45 2.3 – –Level 9 .............................. 32.14 3.7 32.14 3.7 – –Level 10 ............................. 34.10 3.1 34.10 3.1 – –Level 11 ............................. 46.01 7.6 46.01 7.6 – –Not able to be leveled ........ 24.73 6.0 24.68 6.0 – –
Aerospace engineering andoperations technicians ............. 26.38 5.0 26.38 5.0 – –
Level 7 .............................. 27.61 1.5 27.61 1.5 – –Level 8 .............................. 31.16 3.1 31.16 3.1 – –Level 9 .............................. 34.00 3.1 34.00 3.1 – –
Civil engineering technicians ........ 18.79 12.3 18.42 12.2 – –
See footnotes at end of table.
NATIONAL COMPENSATION SURVEY
All United States 8-19 December 2006 - January 2008
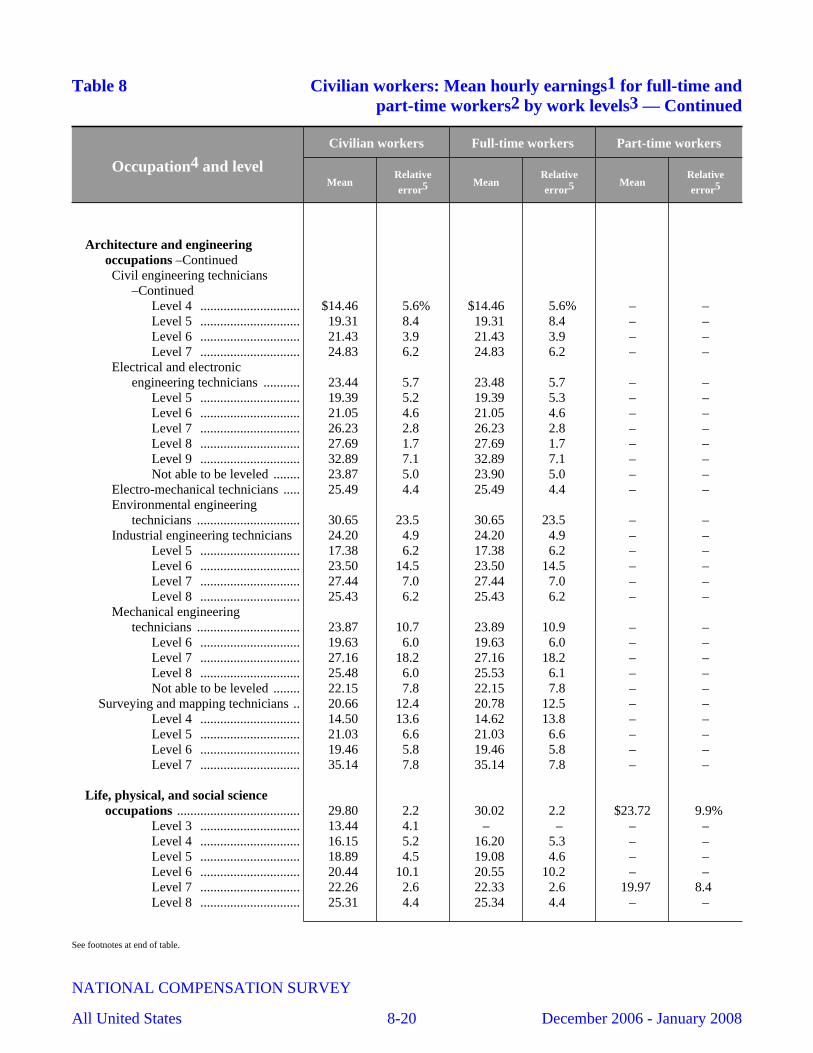
Table 8 Civilian workers: Mean hourly earnings1 for full-time andpart-time workers2 by work levels3 — Continued
Occupation4 and level
Civilian workers Full-time workers Part-time workers
MeanRelativeerror5 Mean
Relativeerror5 Mean
Relativeerror5
Architecture and engineeringoccupations –ContinuedCivil engineering technicians
–ContinuedLevel 4 .............................. $14.46 5.6% $14.46 5.6% – –Level 5 .............................. 19.31 8.4 19.31 8.4 – –Level 6 .............................. 21.43 3.9 21.43 3.9 – –Level 7 .............................. 24.83 6.2 24.83 6.2 – –
Electrical and electronicengineering technicians ........... 23.44 5.7 23.48 5.7 – –
Level 5 .............................. 19.39 5.2 19.39 5.3 – –Level 6 .............................. 21.05 4.6 21.05 4.6 – –Level 7 .............................. 26.23 2.8 26.23 2.8 – –Level 8 .............................. 27.69 1.7 27.69 1.7 – –Level 9 .............................. 32.89 7.1 32.89 7.1 – –Not able to be leveled ........ 23.87 5.0 23.90 5.0 – –
Electro-mechanical technicians ..... 25.49 4.4 25.49 4.4 – –Environmental engineering
technicians ............................... 30.65 23.5 30.65 23.5 – –Industrial engineering technicians 24.20 4.9 24.20 4.9 – –
Level 5 .............................. 17.38 6.2 17.38 6.2 – –Level 6 .............................. 23.50 14.5 23.50 14.5 – –Level 7 .............................. 27.44 7.0 27.44 7.0 – –Level 8 .............................. 25.43 6.2 25.43 6.2 – –
Mechanical engineeringtechnicians ............................... 23.87 10.7 23.89 10.9 – –
Level 6 .............................. 19.63 6.0 19.63 6.0 – –Level 7 .............................. 27.16 18.2 27.16 18.2 – –Level 8 .............................. 25.48 6.0 25.53 6.1 – –Not able to be leveled ........ 22.15 7.8 22.15 7.8 – –
Surveying and mapping technicians .. 20.66 12.4 20.78 12.5 – –Level 4 .............................. 14.50 13.6 14.62 13.8 – –Level 5 .............................. 21.03 6.6 21.03 6.6 – –Level 6 .............................. 19.46 5.8 19.46 5.8 – –Level 7 .............................. 35.14 7.8 35.14 7.8 – –
Life, physical, and social scienceoccupations ..................................... 29.80 2.2 30.02 2.2 $23.72 9.9%
Level 3 .............................. 13.44 4.1 – – – –Level 4 .............................. 16.15 5.2 16.20 5.3 – –Level 5 .............................. 18.89 4.5 19.08 4.6 – –Level 6 .............................. 20.44 10.1 20.55 10.2 – –Level 7 .............................. 22.26 2.6 22.33 2.6 19.97 8.4 Level 8 .............................. 25.31 4.4 25.34 4.4 – –
See footnotes at end of table.
NATIONAL COMPENSATION SURVEY
All United States 8-20 December 2006 - January 2008
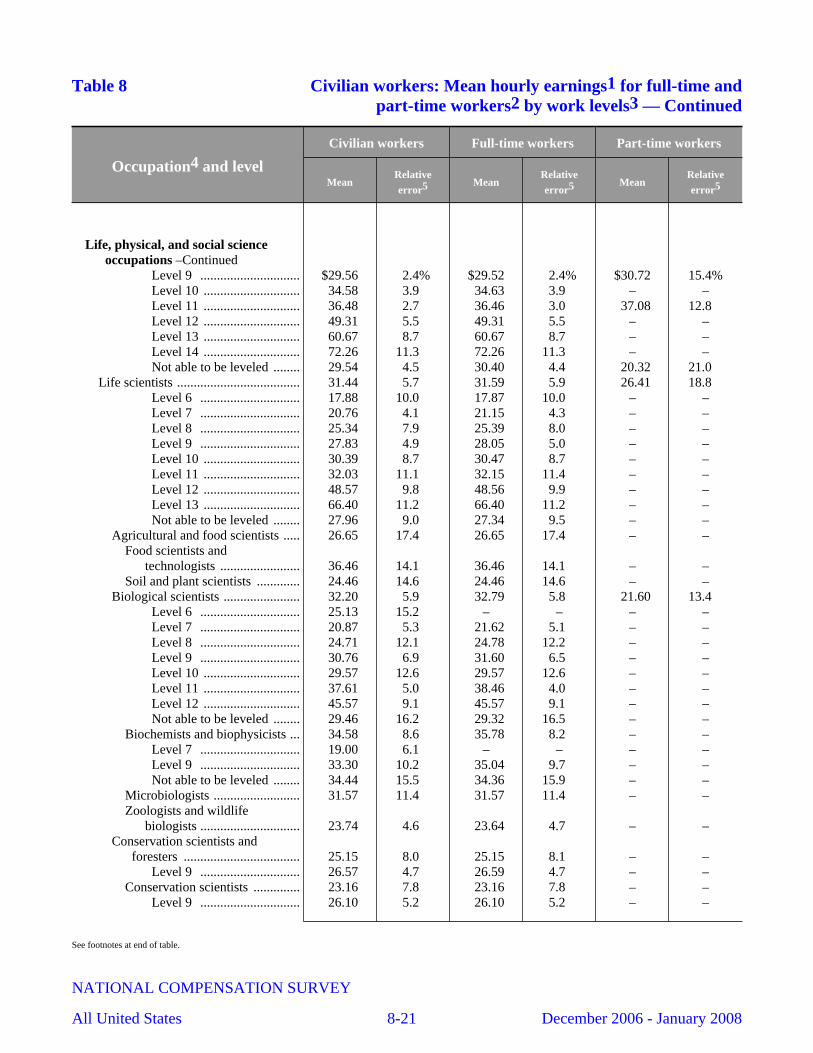
Table 8 Civilian workers: Mean hourly earnings1 for full-time andpart-time workers2 by work levels3 — Continued
Occupation4 and level
Civilian workers Full-time workers Part-time workers
MeanRelativeerror5 Mean
Relativeerror5 Mean
Relativeerror5
Life, physical, and social scienceoccupations –Continued
Level 9 .............................. $29.56 2.4% $29.52 2.4% $30.72 15.4%Level 10 ............................. 34.58 3.9 34.63 3.9 – –Level 11 ............................. 36.48 2.7 36.46 3.0 37.08 12.8 Level 12 ............................. 49.31 5.5 49.31 5.5 – –Level 13 ............................. 60.67 8.7 60.67 8.7 – –Level 14 ............................. 72.26 11.3 72.26 11.3 – –Not able to be leveled ........ 29.54 4.5 30.40 4.4 20.32 21.0
Life scientists ..................................... 31.44 5.7 31.59 5.9 26.41 18.8 Level 6 .............................. 17.88 10.0 17.87 10.0 – –Level 7 .............................. 20.76 4.1 21.15 4.3 – –Level 8 .............................. 25.34 7.9 25.39 8.0 – –Level 9 .............................. 27.83 4.9 28.05 5.0 – –Level 10 ............................. 30.39 8.7 30.47 8.7 – –Level 11 ............................. 32.03 11.1 32.15 11.4 – –Level 12 ............................. 48.57 9.8 48.56 9.9 – –Level 13 ............................. 66.40 11.2 66.40 11.2 – –Not able to be leveled ........ 27.96 9.0 27.34 9.5 – –
Agricultural and food scientists ..... 26.65 17.4 26.65 17.4 – –Food scientists and
technologists ........................ 36.46 14.1 36.46 14.1 – –Soil and plant scientists ............. 24.46 14.6 24.46 14.6 – –
Biological scientists ....................... 32.20 5.9 32.79 5.8 21.60 13.4 Level 6 .............................. 25.13 15.2 – – – –Level 7 .............................. 20.87 5.3 21.62 5.1 – –Level 8 .............................. 24.71 12.1 24.78 12.2 – –Level 9 .............................. 30.76 6.9 31.60 6.5 – –Level 10 ............................. 29.57 12.6 29.57 12.6 – –Level 11 ............................. 37.61 5.0 38.46 4.0 – –Level 12 ............................. 45.57 9.1 45.57 9.1 – –Not able to be leveled ........ 29.46 16.2 29.32 16.5 – –
Biochemists and biophysicists ... 34.58 8.6 35.78 8.2 – –Level 7 .............................. 19.00 6.1 – – – –Level 9 .............................. 33.30 10.2 35.04 9.7 – –Not able to be leveled ........ 34.44 15.5 34.36 15.9 – –
Microbiologists .......................... 31.57 11.4 31.57 11.4 – –Zoologists and wildlife
biologists .............................. 23.74 4.6 23.64 4.7 – –Conservation scientists and
foresters ................................... 25.15 8.0 25.15 8.1 – –Level 9 .............................. 26.57 4.7 26.59 4.7 – –
Conservation scientists .............. 23.16 7.8 23.16 7.8 – –Level 9 .............................. 26.10 5.2 26.10 5.2 – –
See footnotes at end of table.
NATIONAL COMPENSATION SURVEY
All United States 8-21 December 2006 - January 2008

Table 8 Civilian workers: Mean hourly earnings1 for full-time andpart-time workers2 by work levels3 — Continued
Occupation4 and level
Civilian workers Full-time workers Part-time workers
MeanRelativeerror5 Mean
Relativeerror5 Mean
Relativeerror5
Life, physical, and social scienceoccupations –Continued
Foresters .................................... $30.07 14.7% $30.10 14.7% – –Medical scientists .......................... 32.68 9.7 32.58 9.9 $38.50 21.3%
Level 8 .............................. 27.05 8.3 27.23 8.9 – –Level 9 .............................. 23.43 13.3 23.43 13.3 – –Level 11 ............................. 29.09 16.4 29.09 16.4 – –Level 12 ............................. 48.81 16.9 48.80 17.0 – –Level 13 ............................. 65.73 16.7 65.73 16.7 – –Not able to be leveled ........ 25.59 13.5 24.51 13.2 – –
Physical scientists .............................. 34.18 3.6 34.20 3.6 – –Level 5 .............................. 23.17 11.7 23.17 11.7 – –Level 6 .............................. 19.88 10.1 19.88 10.1 – –Level 7 .............................. 23.61 4.3 23.61 4.3 – –Level 8 .............................. 27.51 5.2 27.51 5.2 – –Level 9 .............................. 28.03 4.9 28.07 4.9 – –Level 10 ............................. 37.09 8.4 37.09 8.4 – –Level 11 ............................. 38.79 4.7 38.79 4.7 – –Level 12 ............................. 50.42 10.3 50.42 10.3 – –Level 13 ............................. 52.61 10.4 52.61 10.4 – –Not able to be leveled ........ 38.46 5.8 38.46 5.8 – –
Astronomers and physicists ........... 43.74 8.7 43.74 8.7 – –Physicists ................................... 45.05 8.7 45.05 8.7 – –
Chemists and materials scientists .. 33.01 7.8 33.05 7.8 – –Level 7 .............................. 24.85 3.8 24.85 3.8 – –Level 8 .............................. 25.89 4.9 25.89 4.9 – –Level 9 .............................. 27.38 3.3 27.46 3.1 – –Level 10 ............................. 36.31 11.5 36.31 11.5 – –Level 11 ............................. 40.10 5.8 40.10 5.8 – –Level 12 ............................. 63.31 14.0 63.31 14.0 – –Not able to be leveled ........ 34.40 6.2 34.40 6.2 – –
Chemists .................................... 31.54 7.3 31.58 7.3 – –Level 7 .............................. 24.74 4.3 24.74 4.3 – –Level 8 .............................. 26.53 5.0 26.53 5.0 – –Level 9 .............................. 27.38 3.4 27.46 3.2 – –Level 10 ............................. 36.31 11.5 36.31 11.5 – –Level 11 ............................. 40.18 5.3 40.18 5.3 – –Not able to be leveled ........ 32.53 6.6 32.53 6.6 – –
Materials scientists .................... 41.13 8.6 41.13 8.6 – –Environmental scientists and
geoscientists ............................. 34.32 4.1 34.32 4.1 – –Level 7 .............................. 21.83 3.9 21.83 3.9 – –Level 8 .............................. 29.27 9.6 29.27 9.6 – –Level 9 .............................. 28.07 5.2 28.07 5.2 – –
See footnotes at end of table.
NATIONAL COMPENSATION SURVEY
All United States 8-22 December 2006 - January 2008
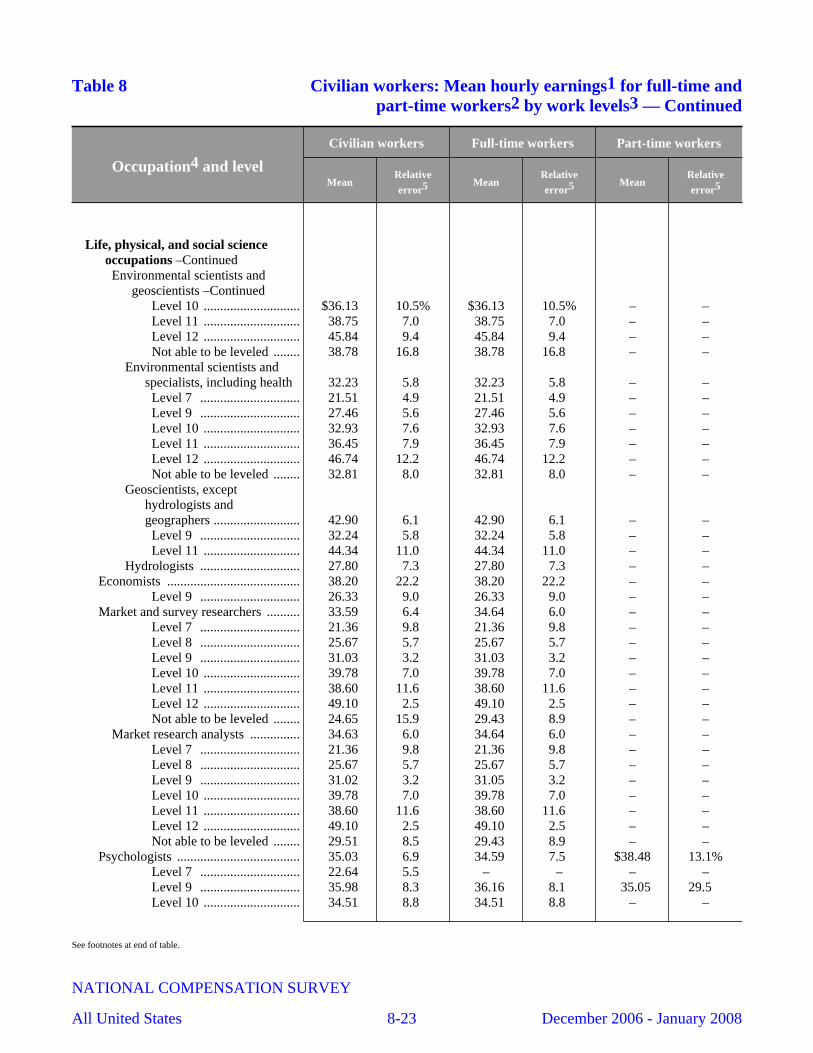
Table 8 Civilian workers: Mean hourly earnings1 for full-time andpart-time workers2 by work levels3 — Continued
Occupation4 and level
Civilian workers Full-time workers Part-time workers
MeanRelativeerror5 Mean
Relativeerror5 Mean
Relativeerror5
Life, physical, and social scienceoccupations –ContinuedEnvironmental scientists and
geoscientists –ContinuedLevel 10 ............................. $36.13 10.5% $36.13 10.5% – –Level 11 ............................. 38.75 7.0 38.75 7.0 – –Level 12 ............................. 45.84 9.4 45.84 9.4 – –Not able to be leveled ........ 38.78 16.8 38.78 16.8 – –
Environmental scientists andspecialists, including health 32.23 5.8 32.23 5.8 – –Level 7 .............................. 21.51 4.9 21.51 4.9 – –Level 9 .............................. 27.46 5.6 27.46 5.6 – –Level 10 ............................. 32.93 7.6 32.93 7.6 – –Level 11 ............................. 36.45 7.9 36.45 7.9 – –Level 12 ............................. 46.74 12.2 46.74 12.2 – –Not able to be leveled ........ 32.81 8.0 32.81 8.0 – –
Geoscientists, excepthydrologists andgeographers .......................... 42.90 6.1 42.90 6.1 – –Level 9 .............................. 32.24 5.8 32.24 5.8 – –Level 11 ............................. 44.34 11.0 44.34 11.0 – –
Hydrologists .............................. 27.80 7.3 27.80 7.3 – –Economists ........................................ 38.20 22.2 38.20 22.2 – –
Level 9 .............................. 26.33 9.0 26.33 9.0 – –Market and survey researchers .......... 33.59 6.4 34.64 6.0 – –
Level 7 .............................. 21.36 9.8 21.36 9.8 – –Level 8 .............................. 25.67 5.7 25.67 5.7 – –Level 9 .............................. 31.03 3.2 31.03 3.2 – –Level 10 ............................. 39.78 7.0 39.78 7.0 – –Level 11 ............................. 38.60 11.6 38.60 11.6 – –Level 12 ............................. 49.10 2.5 49.10 2.5 – –Not able to be leveled ........ 24.65 15.9 29.43 8.9 – –
Market research analysts ............... 34.63 6.0 34.64 6.0 – –Level 7 .............................. 21.36 9.8 21.36 9.8 – –Level 8 .............................. 25.67 5.7 25.67 5.7 – –Level 9 .............................. 31.02 3.2 31.05 3.2 – –Level 10 ............................. 39.78 7.0 39.78 7.0 – –Level 11 ............................. 38.60 11.6 38.60 11.6 – –Level 12 ............................. 49.10 2.5 49.10 2.5 – –Not able to be leveled ........ 29.51 8.5 29.43 8.9 – –
Psychologists ..................................... 35.03 6.9 34.59 7.5 $38.48 13.1%Level 7 .............................. 22.64 5.5 – – – –Level 9 .............................. 35.98 8.3 36.16 8.1 35.05 29.5 Level 10 ............................. 34.51 8.8 34.51 8.8 – –
See footnotes at end of table.
NATIONAL COMPENSATION SURVEY
All United States 8-23 December 2006 - January 2008
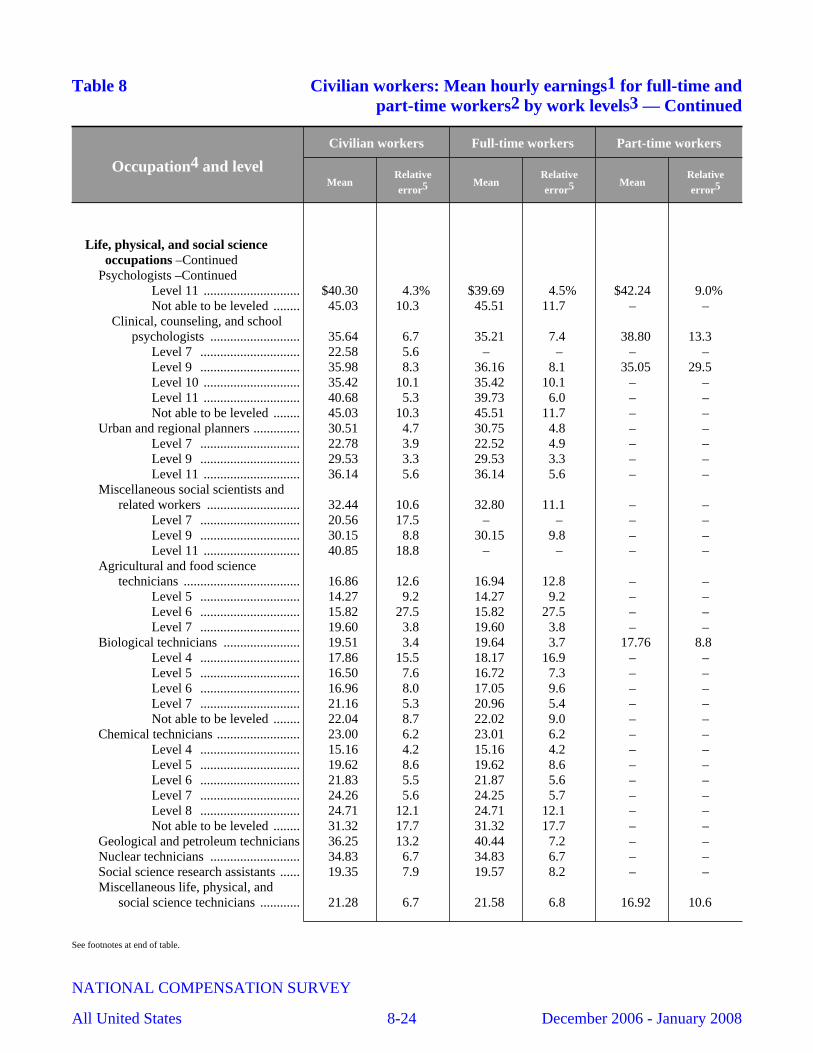
Table 8 Civilian workers: Mean hourly earnings1 for full-time andpart-time workers2 by work levels3 — Continued
Occupation4 and level
Civilian workers Full-time workers Part-time workers
MeanRelativeerror5 Mean
Relativeerror5 Mean
Relativeerror5
Life, physical, and social scienceoccupations –Continued
Psychologists –ContinuedLevel 11 ............................. $40.30 4.3% $39.69 4.5% $42.24 9.0%Not able to be leveled ........ 45.03 10.3 45.51 11.7 – –
Clinical, counseling, and schoolpsychologists ........................... 35.64 6.7 35.21 7.4 38.80 13.3
Level 7 .............................. 22.58 5.6 – – – –Level 9 .............................. 35.98 8.3 36.16 8.1 35.05 29.5 Level 10 ............................. 35.42 10.1 35.42 10.1 – –Level 11 ............................. 40.68 5.3 39.73 6.0 – –Not able to be leveled ........ 45.03 10.3 45.51 11.7 – –
Urban and regional planners .............. 30.51 4.7 30.75 4.8 – –Level 7 .............................. 22.78 3.9 22.52 4.9 – –Level 9 .............................. 29.53 3.3 29.53 3.3 – –Level 11 ............................. 36.14 5.6 36.14 5.6 – –
Miscellaneous social scientists andrelated workers ............................ 32.44 10.6 32.80 11.1 – –
Level 7 .............................. 20.56 17.5 – – – –Level 9 .............................. 30.15 8.8 30.15 9.8 – –Level 11 ............................. 40.85 18.8 – – – –
Agricultural and food sciencetechnicians ................................... 16.86 12.6 16.94 12.8 – –
Level 5 .............................. 14.27 9.2 14.27 9.2 – –Level 6 .............................. 15.82 27.5 15.82 27.5 – –Level 7 .............................. 19.60 3.8 19.60 3.8 – –
Biological technicians ....................... 19.51 3.4 19.64 3.7 17.76 8.8 Level 4 .............................. 17.86 15.5 18.17 16.9 – –Level 5 .............................. 16.50 7.6 16.72 7.3 – –Level 6 .............................. 16.96 8.0 17.05 9.6 – –Level 7 .............................. 21.16 5.3 20.96 5.4 – –Not able to be leveled ........ 22.04 8.7 22.02 9.0 – –
Chemical technicians ......................... 23.00 6.2 23.01 6.2 – –Level 4 .............................. 15.16 4.2 15.16 4.2 – –Level 5 .............................. 19.62 8.6 19.62 8.6 – –Level 6 .............................. 21.83 5.5 21.87 5.6 – –Level 7 .............................. 24.26 5.6 24.25 5.7 – –Level 8 .............................. 24.71 12.1 24.71 12.1 – –Not able to be leveled ........ 31.32 17.7 31.32 17.7 – –
Geological and petroleum technicians 36.25 13.2 40.44 7.2 – –Nuclear technicians ........................... 34.83 6.7 34.83 6.7 – –Social science research assistants ...... 19.35 7.9 19.57 8.2 – –Miscellaneous life, physical, and
social science technicians ............ 21.28 6.7 21.58 6.8 16.92 10.6
See footnotes at end of table.
NATIONAL COMPENSATION SURVEY
All United States 8-24 December 2006 - January 2008
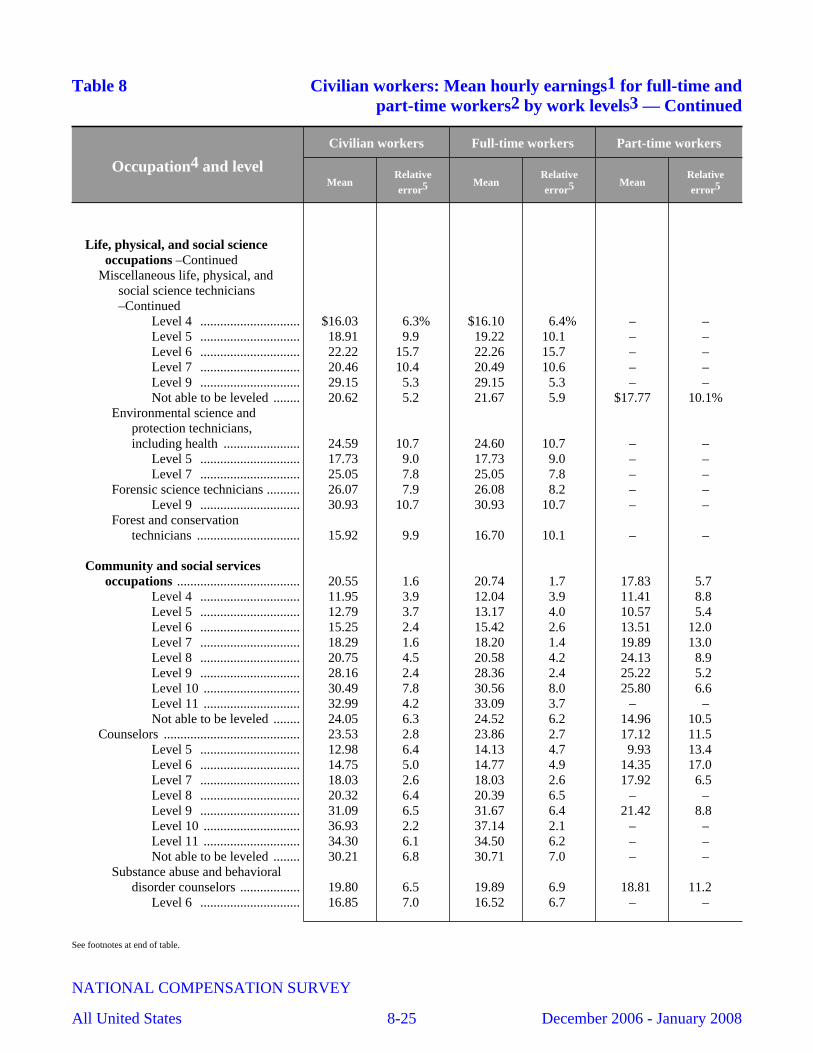
Table 8 Civilian workers: Mean hourly earnings1 for full-time andpart-time workers2 by work levels3 — Continued
Occupation4 and level
Civilian workers Full-time workers Part-time workers
MeanRelativeerror5 Mean
Relativeerror5 Mean
Relativeerror5
Life, physical, and social scienceoccupations –Continued
Miscellaneous life, physical, andsocial science technicians–Continued
Level 4 .............................. $16.03 6.3% $16.10 6.4% – –Level 5 .............................. 18.91 9.9 19.22 10.1 – –Level 6 .............................. 22.22 15.7 22.26 15.7 – –Level 7 .............................. 20.46 10.4 20.49 10.6 – –Level 9 .............................. 29.15 5.3 29.15 5.3 – –Not able to be leveled ........ 20.62 5.2 21.67 5.9 $17.77 10.1%
Environmental science andprotection technicians,including health ....................... 24.59 10.7 24.60 10.7 – –
Level 5 .............................. 17.73 9.0 17.73 9.0 – –Level 7 .............................. 25.05 7.8 25.05 7.8 – –
Forensic science technicians .......... 26.07 7.9 26.08 8.2 – –Level 9 .............................. 30.93 10.7 30.93 10.7 – –
Forest and conservationtechnicians ............................... 15.92 9.9 16.70 10.1 – –
Community and social servicesoccupations ..................................... 20.55 1.6 20.74 1.7 17.83 5.7
Level 4 .............................. 11.95 3.9 12.04 3.9 11.41 8.8 Level 5 .............................. 12.79 3.7 13.17 4.0 10.57 5.4 Level 6 .............................. 15.25 2.4 15.42 2.6 13.51 12.0 Level 7 .............................. 18.29 1.6 18.20 1.4 19.89 13.0 Level 8 .............................. 20.75 4.5 20.58 4.2 24.13 8.9 Level 9 .............................. 28.16 2.4 28.36 2.4 25.22 5.2 Level 10 ............................. 30.49 7.8 30.56 8.0 25.80 6.6 Level 11 ............................. 32.99 4.2 33.09 3.7 – –Not able to be leveled ........ 24.05 6.3 24.52 6.2 14.96 10.5
Counselors ......................................... 23.53 2.8 23.86 2.7 17.12 11.5 Level 5 .............................. 12.98 6.4 14.13 4.7 9.93 13.4 Level 6 .............................. 14.75 5.0 14.77 4.9 14.35 17.0 Level 7 .............................. 18.03 2.6 18.03 2.6 17.92 6.5 Level 8 .............................. 20.32 6.4 20.39 6.5 – –Level 9 .............................. 31.09 6.5 31.67 6.4 21.42 8.8 Level 10 ............................. 36.93 2.2 37.14 2.1 – –Level 11 ............................. 34.30 6.1 34.50 6.2 – –Not able to be leveled ........ 30.21 6.8 30.71 7.0 – –
Substance abuse and behavioraldisorder counselors .................. 19.80 6.5 19.89 6.9 18.81 11.2
Level 6 .............................. 16.85 7.0 16.52 6.7 – –
See footnotes at end of table.
NATIONAL COMPENSATION SURVEY
All United States 8-25 December 2006 - January 2008
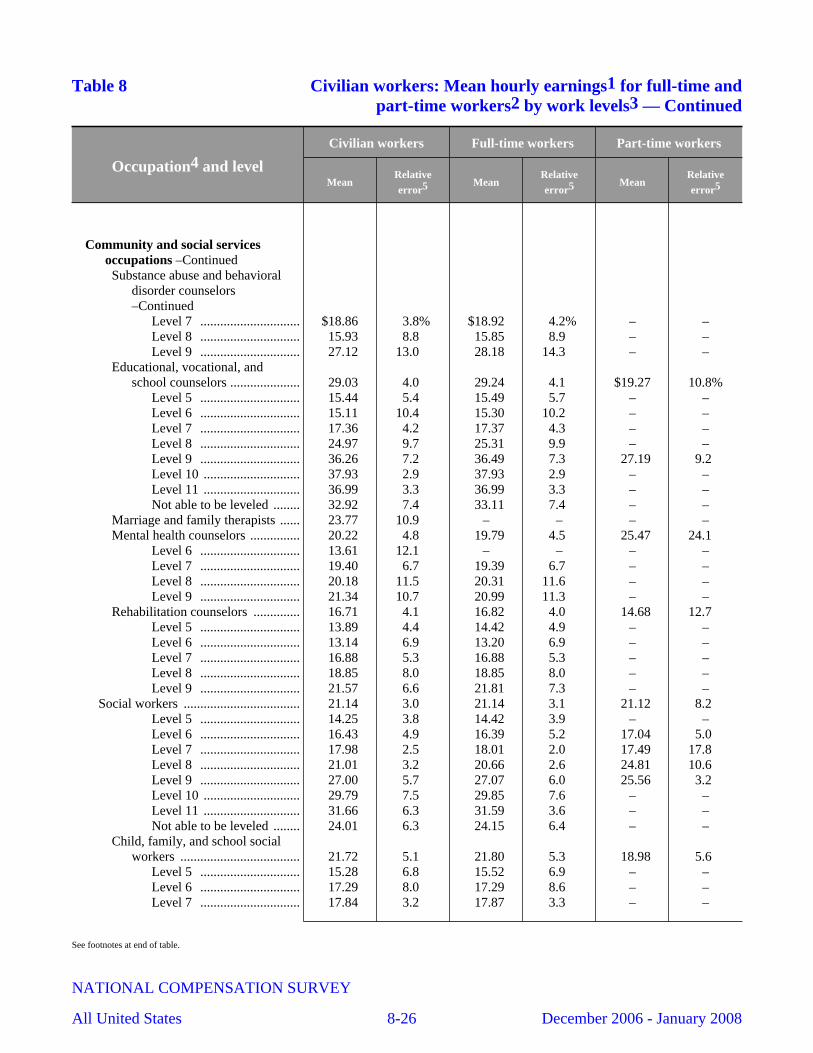
Table 8 Civilian workers: Mean hourly earnings1 for full-time andpart-time workers2 by work levels3 — Continued
Occupation4 and level
Civilian workers Full-time workers Part-time workers
MeanRelativeerror5 Mean
Relativeerror5 Mean
Relativeerror5
Community and social servicesoccupations –ContinuedSubstance abuse and behavioral
disorder counselors–Continued
Level 7 .............................. $18.86 3.8% $18.92 4.2% – –Level 8 .............................. 15.93 8.8 15.85 8.9 – –Level 9 .............................. 27.12 13.0 28.18 14.3 – –
Educational, vocational, andschool counselors ..................... 29.03 4.0 29.24 4.1 $19.27 10.8%
Level 5 .............................. 15.44 5.4 15.49 5.7 – –Level 6 .............................. 15.11 10.4 15.30 10.2 – –Level 7 .............................. 17.36 4.2 17.37 4.3 – –Level 8 .............................. 24.97 9.7 25.31 9.9 – –Level 9 .............................. 36.26 7.2 36.49 7.3 27.19 9.2 Level 10 ............................. 37.93 2.9 37.93 2.9 – –Level 11 ............................. 36.99 3.3 36.99 3.3 – –Not able to be leveled ........ 32.92 7.4 33.11 7.4 – –
Marriage and family therapists ...... 23.77 10.9 – – – –Mental health counselors ............... 20.22 4.8 19.79 4.5 25.47 24.1
Level 6 .............................. 13.61 12.1 – – – –Level 7 .............................. 19.40 6.7 19.39 6.7 – –Level 8 .............................. 20.18 11.5 20.31 11.6 – –Level 9 .............................. 21.34 10.7 20.99 11.3 – –
Rehabilitation counselors .............. 16.71 4.1 16.82 4.0 14.68 12.7 Level 5 .............................. 13.89 4.4 14.42 4.9 – –Level 6 .............................. 13.14 6.9 13.20 6.9 – –Level 7 .............................. 16.88 5.3 16.88 5.3 – –Level 8 .............................. 18.85 8.0 18.85 8.0 – –Level 9 .............................. 21.57 6.6 21.81 7.3 – –
Social workers ................................... 21.14 3.0 21.14 3.1 21.12 8.2 Level 5 .............................. 14.25 3.8 14.42 3.9 – –Level 6 .............................. 16.43 4.9 16.39 5.2 17.04 5.0 Level 7 .............................. 17.98 2.5 18.01 2.0 17.49 17.8 Level 8 .............................. 21.01 3.2 20.66 2.6 24.81 10.6 Level 9 .............................. 27.00 5.7 27.07 6.0 25.56 3.2 Level 10 ............................. 29.79 7.5 29.85 7.6 – –Level 11 ............................. 31.66 6.3 31.59 3.6 – –Not able to be leveled ........ 24.01 6.3 24.15 6.4 – –
Child, family, and school socialworkers .................................... 21.72 5.1 21.80 5.3 18.98 5.6
Level 5 .............................. 15.28 6.8 15.52 6.9 – –Level 6 .............................. 17.29 8.0 17.29 8.6 – –Level 7 .............................. 17.84 3.2 17.87 3.3 – –
See footnotes at end of table.
NATIONAL COMPENSATION SURVEY
All United States 8-26 December 2006 - January 2008
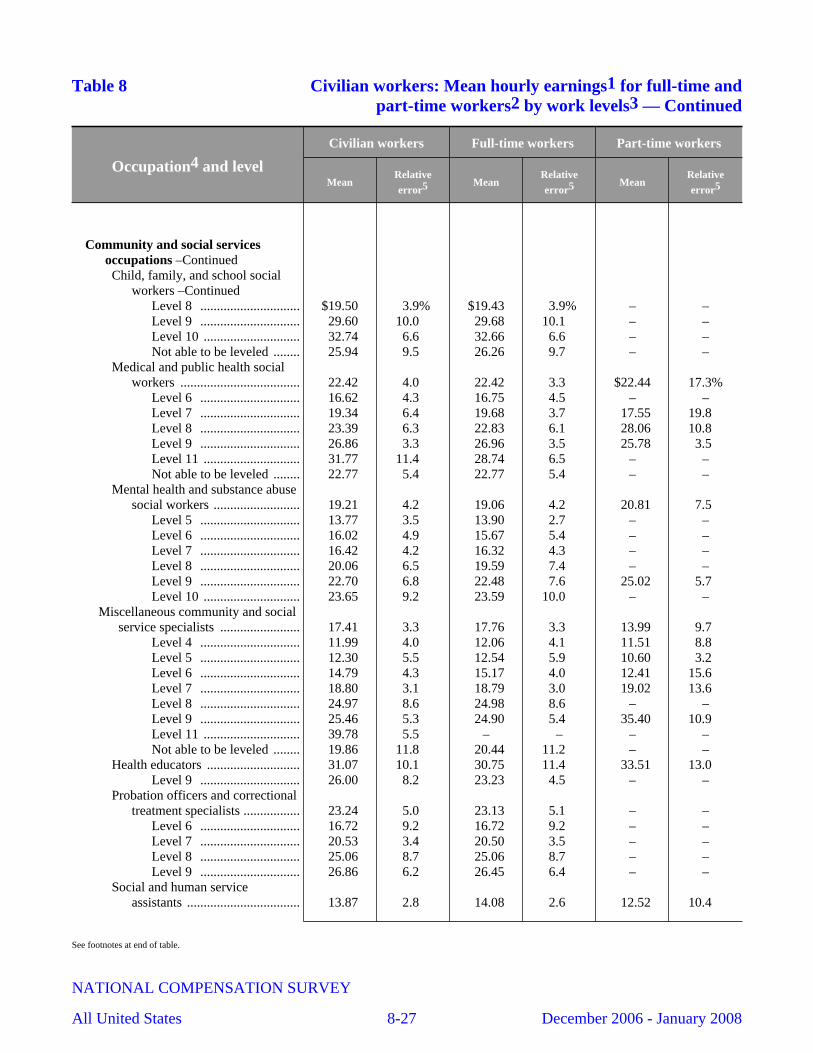
Table 8 Civilian workers: Mean hourly earnings1 for full-time andpart-time workers2 by work levels3 — Continued
Occupation4 and level
Civilian workers Full-time workers Part-time workers
MeanRelativeerror5 Mean
Relativeerror5 Mean
Relativeerror5
Community and social servicesoccupations –ContinuedChild, family, and school social
workers –ContinuedLevel 8 .............................. $19.50 3.9% $19.43 3.9% – –Level 9 .............................. 29.60 10.0 29.68 10.1 – –Level 10 ............................. 32.74 6.6 32.66 6.6 – –Not able to be leveled ........ 25.94 9.5 26.26 9.7 – –
Medical and public health socialworkers .................................... 22.42 4.0 22.42 3.3 $22.44 17.3%
Level 6 .............................. 16.62 4.3 16.75 4.5 – –Level 7 .............................. 19.34 6.4 19.68 3.7 17.55 19.8 Level 8 .............................. 23.39 6.3 22.83 6.1 28.06 10.8 Level 9 .............................. 26.86 3.3 26.96 3.5 25.78 3.5 Level 11 ............................. 31.77 11.4 28.74 6.5 – –Not able to be leveled ........ 22.77 5.4 22.77 5.4 – –
Mental health and substance abusesocial workers .......................... 19.21 4.2 19.06 4.2 20.81 7.5
Level 5 .............................. 13.77 3.5 13.90 2.7 – –Level 6 .............................. 16.02 4.9 15.67 5.4 – –Level 7 .............................. 16.42 4.2 16.32 4.3 – –Level 8 .............................. 20.06 6.5 19.59 7.4 – –Level 9 .............................. 22.70 6.8 22.48 7.6 25.02 5.7 Level 10 ............................. 23.65 9.2 23.59 10.0 – –
Miscellaneous community and socialservice specialists ........................ 17.41 3.3 17.76 3.3 13.99 9.7
Level 4 .............................. 11.99 4.0 12.06 4.1 11.51 8.8 Level 5 .............................. 12.30 5.5 12.54 5.9 10.60 3.2 Level 6 .............................. 14.79 4.3 15.17 4.0 12.41 15.6 Level 7 .............................. 18.80 3.1 18.79 3.0 19.02 13.6 Level 8 .............................. 24.97 8.6 24.98 8.6 – –Level 9 .............................. 25.46 5.3 24.90 5.4 35.40 10.9 Level 11 ............................. 39.78 5.5 – – – –Not able to be leveled ........ 19.86 11.8 20.44 11.2 – –
Health educators ............................ 31.07 10.1 30.75 11.4 33.51 13.0 Level 9 .............................. 26.00 8.2 23.23 4.5 – –
Probation officers and correctionaltreatment specialists ................. 23.24 5.0 23.13 5.1 – –
Level 6 .............................. 16.72 9.2 16.72 9.2 – –Level 7 .............................. 20.53 3.4 20.50 3.5 – –Level 8 .............................. 25.06 8.7 25.06 8.7 – –Level 9 .............................. 26.86 6.2 26.45 6.4 – –
Social and human serviceassistants .................................. 13.87 2.8 14.08 2.6 12.52 10.4
See footnotes at end of table.
NATIONAL COMPENSATION SURVEY
All United States 8-27 December 2006 - January 2008
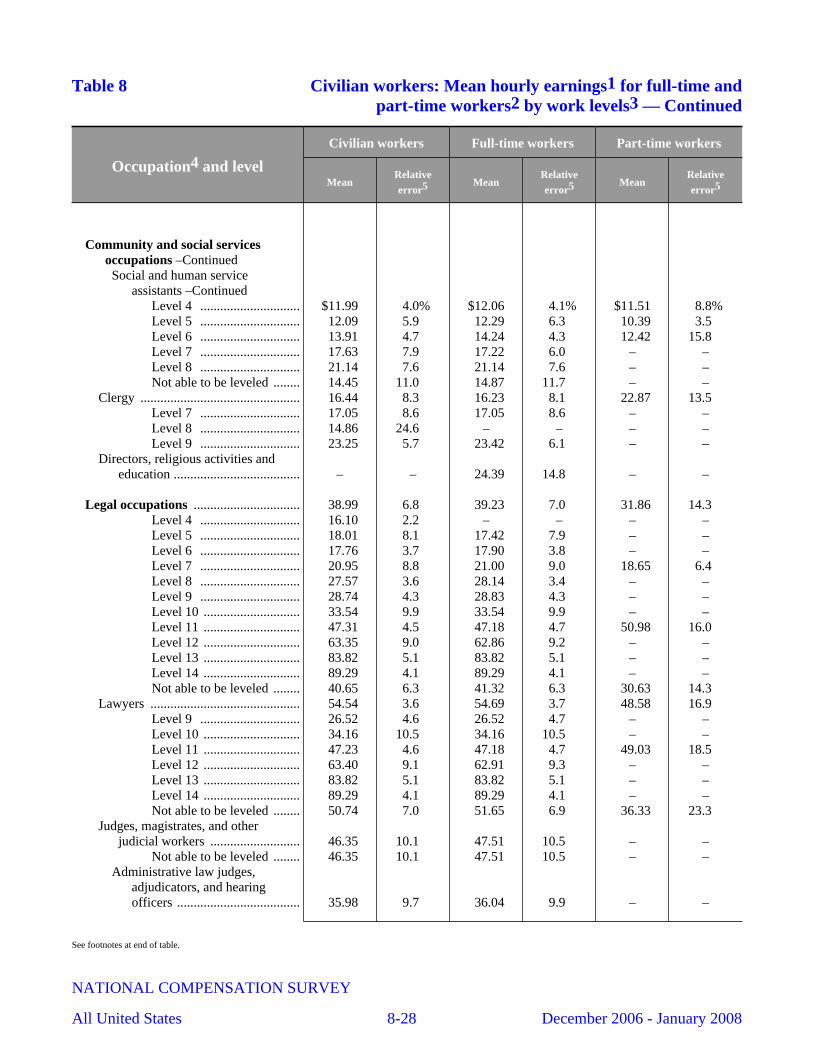
Table 8 Civilian workers: Mean hourly earnings1 for full-time andpart-time workers2 by work levels3 — Continued
Occupation4 and level
Civilian workers Full-time workers Part-time workers
MeanRelativeerror5 Mean
Relativeerror5 Mean
Relativeerror5
Community and social servicesoccupations –ContinuedSocial and human service
assistants –ContinuedLevel 4 .............................. $11.99 4.0% $12.06 4.1% $11.51 8.8%Level 5 .............................. 12.09 5.9 12.29 6.3 10.39 3.5 Level 6 .............................. 13.91 4.7 14.24 4.3 12.42 15.8 Level 7 .............................. 17.63 7.9 17.22 6.0 – –Level 8 .............................. 21.14 7.6 21.14 7.6 – –Not able to be leveled ........ 14.45 11.0 14.87 11.7 – –
Clergy ................................................ 16.44 8.3 16.23 8.1 22.87 13.5 Level 7 .............................. 17.05 8.6 17.05 8.6 – –Level 8 .............................. 14.86 24.6 – – – –Level 9 .............................. 23.25 5.7 23.42 6.1 – –
Directors, religious activities andeducation ...................................... – – 24.39 14.8 – –
Legal occupations ................................ 38.99 6.8 39.23 7.0 31.86 14.3 Level 4 .............................. 16.10 2.2 – – – –Level 5 .............................. 18.01 8.1 17.42 7.9 – –Level 6 .............................. 17.76 3.7 17.90 3.8 – –Level 7 .............................. 20.95 8.8 21.00 9.0 18.65 6.4 Level 8 .............................. 27.57 3.6 28.14 3.4 – –Level 9 .............................. 28.74 4.3 28.83 4.3 – –Level 10 ............................. 33.54 9.9 33.54 9.9 – –Level 11 ............................. 47.31 4.5 47.18 4.7 50.98 16.0 Level 12 ............................. 63.35 9.0 62.86 9.2 – –Level 13 ............................. 83.82 5.1 83.82 5.1 – –Level 14 ............................. 89.29 4.1 89.29 4.1 – –Not able to be leveled ........ 40.65 6.3 41.32 6.3 30.63 14.3
Lawyers ............................................. 54.54 3.6 54.69 3.7 48.58 16.9 Level 9 .............................. 26.52 4.6 26.52 4.7 – –Level 10 ............................. 34.16 10.5 34.16 10.5 – –Level 11 ............................. 47.23 4.6 47.18 4.7 49.03 18.5 Level 12 ............................. 63.40 9.1 62.91 9.3 – –Level 13 ............................. 83.82 5.1 83.82 5.1 – –Level 14 ............................. 89.29 4.1 89.29 4.1 – –Not able to be leveled ........ 50.74 7.0 51.65 6.9 36.33 23.3
Judges, magistrates, and otherjudicial workers ........................... 46.35 10.1 47.51 10.5 – –
Not able to be leveled ........ 46.35 10.1 47.51 10.5 – –Administrative law judges,
adjudicators, and hearingofficers ..................................... 35.98 9.7 36.04 9.9 – –
See footnotes at end of table.
NATIONAL COMPENSATION SURVEY
All United States 8-28 December 2006 - January 2008
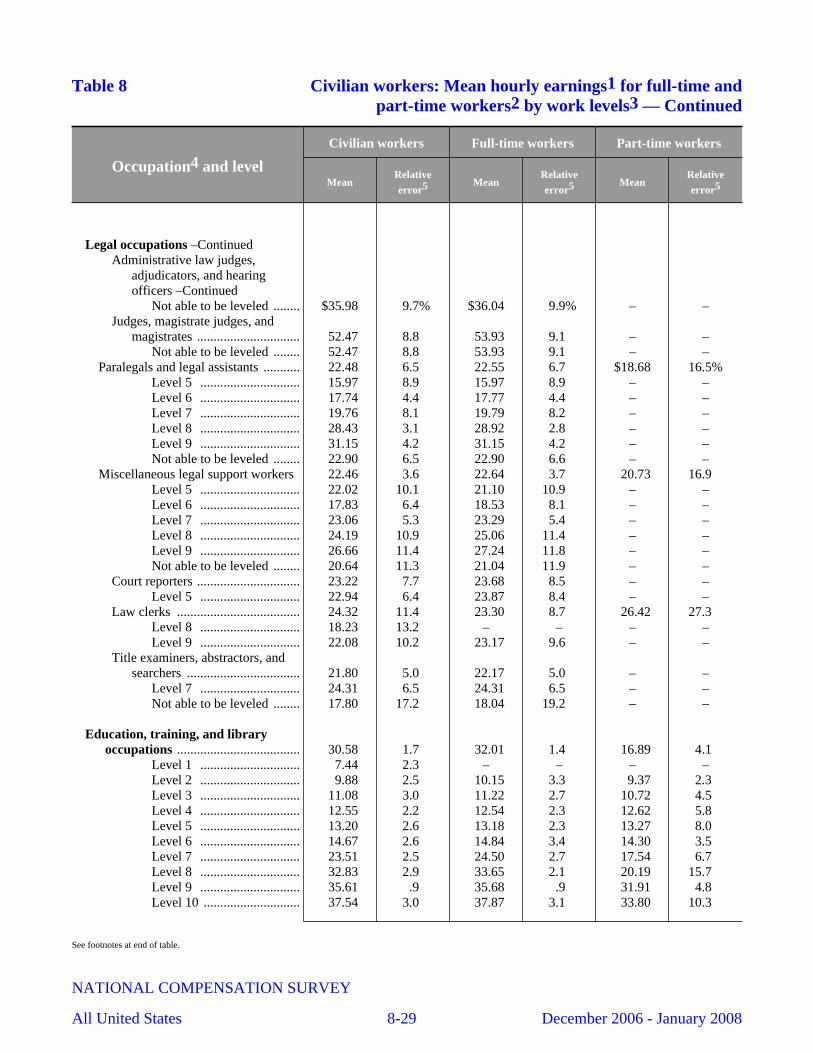
Table 8 Civilian workers: Mean hourly earnings1 for full-time andpart-time workers2 by work levels3 — Continued
Occupation4 and level
Civilian workers Full-time workers Part-time workers
MeanRelativeerror5 Mean
Relativeerror5 Mean
Relativeerror5
Legal occupations –ContinuedAdministrative law judges,
adjudicators, and hearingofficers –Continued
Not able to be leveled ........ $35.98 9.7% $36.04 9.9% – –Judges, magistrate judges, and
magistrates ............................... 52.47 8.8 53.93 9.1 – –Not able to be leveled ........ 52.47 8.8 53.93 9.1 – –
Paralegals and legal assistants ........... 22.48 6.5 22.55 6.7 $18.68 16.5%Level 5 .............................. 15.97 8.9 15.97 8.9 – –Level 6 .............................. 17.74 4.4 17.77 4.4 – –Level 7 .............................. 19.76 8.1 19.79 8.2 – –Level 8 .............................. 28.43 3.1 28.92 2.8 – –Level 9 .............................. 31.15 4.2 31.15 4.2 – –Not able to be leveled ........ 22.90 6.5 22.90 6.6 – –
Miscellaneous legal support workers 22.46 3.6 22.64 3.7 20.73 16.9 Level 5 .............................. 22.02 10.1 21.10 10.9 – –Level 6 .............................. 17.83 6.4 18.53 8.1 – –Level 7 .............................. 23.06 5.3 23.29 5.4 – –Level 8 .............................. 24.19 10.9 25.06 11.4 – –Level 9 .............................. 26.66 11.4 27.24 11.8 – –Not able to be leveled ........ 20.64 11.3 21.04 11.9 – –
Court reporters ............................... 23.22 7.7 23.68 8.5 – –Level 5 .............................. 22.94 6.4 23.87 8.4 – –
Law clerks ..................................... 24.32 11.4 23.30 8.7 26.42 27.3 Level 8 .............................. 18.23 13.2 – – – –Level 9 .............................. 22.08 10.2 23.17 9.6 – –
Title examiners, abstractors, andsearchers .................................. 21.80 5.0 22.17 5.0 – –
Level 7 .............................. 24.31 6.5 24.31 6.5 – –Not able to be leveled ........ 17.80 17.2 18.04 19.2 – –
Education, training, and libraryoccupations ..................................... 30.58 1.7 32.01 1.4 16.89 4.1
Level 1 .............................. 7.44 2.3 – – – –Level 2 .............................. 9.88 2.5 10.15 3.3 9.37 2.3 Level 3 .............................. 11.08 3.0 11.22 2.7 10.72 4.5 Level 4 .............................. 12.55 2.2 12.54 2.3 12.62 5.8 Level 5 .............................. 13.20 2.6 13.18 2.3 13.27 8.0 Level 6 .............................. 14.67 2.6 14.84 3.4 14.30 3.5 Level 7 .............................. 23.51 2.5 24.50 2.7 17.54 6.7 Level 8 .............................. 32.83 2.9 33.65 2.1 20.19 15.7 Level 9 .............................. 35.61 .9 35.68 .9 31.91 4.8 Level 10 ............................. 37.54 3.0 37.87 3.1 33.80 10.3
See footnotes at end of table.
NATIONAL COMPENSATION SURVEY
All United States 8-29 December 2006 - January 2008

Table 8 Civilian workers: Mean hourly earnings1 for full-time andpart-time workers2 by work levels3 — Continued
Occupation4 and level
Civilian workers Full-time workers Part-time workers
MeanRelativeerror5 Mean
Relativeerror5 Mean
Relativeerror5
Education, training, and libraryoccupations –Continued
Level 11 ............................. $43.00 6.0% $43.13 6.1% $38.63 5.8%Level 12 ............................. 56.10 6.3 56.12 6.4 55.19 10.3 Level 13 ............................. 69.54 6.9 69.54 7.0 – –Level 14 ............................. 94.63 7.5 94.63 7.5 – –Not able to be leveled ........ 32.38 4.2 35.09 4.6 18.86 8.4
Postsecondary teachers ...................... 45.83 3.7 47.00 3.9 31.16 3.5 Level 5 .............................. – – 15.28 9.6 – –Level 6 .............................. 16.38 7.5 – – 16.00 7.7 Level 7 .............................. 21.87 4.9 22.12 3.8 21.24 14.8 Level 8 .............................. 26.32 3.7 26.25 4.3 26.72 10.6 Level 9 .............................. 32.54 4.8 32.22 4.6 34.55 7.9 Level 10 ............................. 37.84 4.3 38.57 4.0 31.89 13.1 Level 11 ............................. 43.69 6.8 43.87 7.0 38.56 6.1 Level 12 ............................. 56.13 6.3 56.13 6.5 55.84 10.7 Level 13 ............................. 70.12 7.1 70.13 7.2 – –Level 14 ............................. 94.63 7.5 94.63 7.5 – –Not able to be leveled ........ 46.75 5.0 48.00 5.4 31.89 10.2
Business teachers, postsecondary .. 57.46 11.8 60.59 10.1 21.85 17.0 Level 8 .............................. 27.36 17.4 – – 29.14 10.7 Level 9 .............................. 26.83 8.5 26.98 10.2 25.63 7.0 Level 10 ............................. 35.01 17.1 45.77 6.4 20.16 16.6 Level 11 ............................. 66.65 6.7 67.23 6.1 – –Level 12 ............................. 72.46 12.7 72.60 12.7 – –Level 13 ............................. 73.23 7.4 73.23 7.4 – –Not able to be leveled ........ 37.21 25.3 49.20 11.6 – –
Math and computer teachers,postsecondary .......................... 42.49 5.6 42.89 5.7 30.90 12.4
Level 9 .............................. 34.09 8.3 34.73 8.7 25.45 23.6 Level 10 ............................. 35.81 3.4 35.61 3.1 – –Level 11 ............................. 36.52 6.0 36.48 6.2 37.72 8.5 Level 12 ............................. 49.12 9.3 49.27 9.5 – –Level 13 ............................. 63.39 8.1 63.39 8.1 – –Not able to be leveled ........ 54.84 13.1 55.45 13.5 – –
Computer science teachers,postsecondary ...................... 45.91 13.5 47.10 13.7 30.57 18.7 Level 9 .............................. 32.48 7.7 32.17 8.3 – –Level 11 ............................. 32.33 10.4 31.43 10.7 39.07 12.6 Level 12 ............................. 59.68 10.7 – – – –
Mathematical science teachers,postsecondary ...................... 41.14 4.5 41.32 4.6 31.41 12.4 Level 9 .............................. 34.81 10.8 35.88 11.0 – –Level 10 ............................. 35.51 3.5 35.28 3.3 – –
See footnotes at end of table.
NATIONAL COMPENSATION SURVEY
All United States 8-30 December 2006 - January 2008
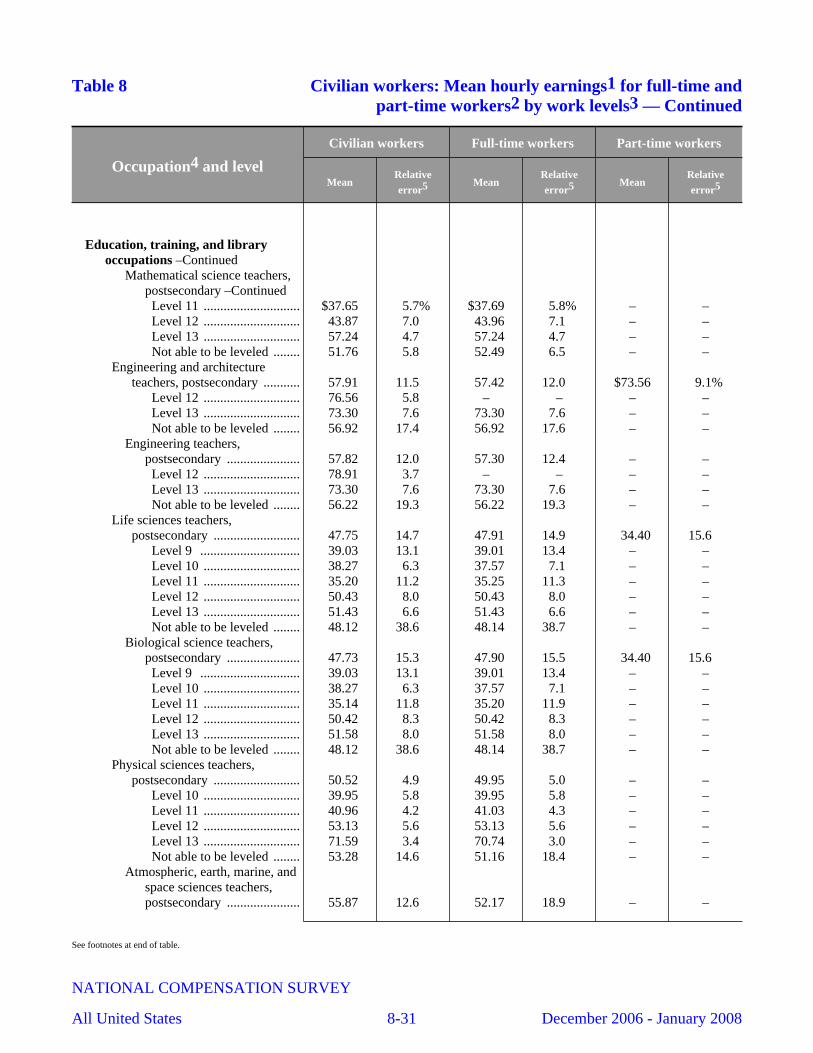
Table 8 Civilian workers: Mean hourly earnings1 for full-time andpart-time workers2 by work levels3 — Continued
Occupation4 and level
Civilian workers Full-time workers Part-time workers
MeanRelativeerror5 Mean
Relativeerror5 Mean
Relativeerror5
Education, training, and libraryoccupations –Continued
Mathematical science teachers,postsecondary –ContinuedLevel 11 ............................. $37.65 5.7% $37.69 5.8% – –Level 12 ............................. 43.87 7.0 43.96 7.1 – –Level 13 ............................. 57.24 4.7 57.24 4.7 – –Not able to be leveled ........ 51.76 5.8 52.49 6.5 – –
Engineering and architectureteachers, postsecondary ........... 57.91 11.5 57.42 12.0 $73.56 9.1%
Level 12 ............................. 76.56 5.8 – – – –Level 13 ............................. 73.30 7.6 73.30 7.6 – –Not able to be leveled ........ 56.92 17.4 56.92 17.6 – –
Engineering teachers,postsecondary ...................... 57.82 12.0 57.30 12.4 – –Level 12 ............................. 78.91 3.7 – – – –Level 13 ............................. 73.30 7.6 73.30 7.6 – –Not able to be leveled ........ 56.22 19.3 56.22 19.3 – –
Life sciences teachers,postsecondary .......................... 47.75 14.7 47.91 14.9 34.40 15.6
Level 9 .............................. 39.03 13.1 39.01 13.4 – –Level 10 ............................. 38.27 6.3 37.57 7.1 – –Level 11 ............................. 35.20 11.2 35.25 11.3 – –Level 12 ............................. 50.43 8.0 50.43 8.0 – –Level 13 ............................. 51.43 6.6 51.43 6.6 – –Not able to be leveled ........ 48.12 38.6 48.14 38.7 – –
Biological science teachers,postsecondary ...................... 47.73 15.3 47.90 15.5 34.40 15.6 Level 9 .............................. 39.03 13.1 39.01 13.4 – –Level 10 ............................. 38.27 6.3 37.57 7.1 – –Level 11 ............................. 35.14 11.8 35.20 11.9 – –Level 12 ............................. 50.42 8.3 50.42 8.3 – –Level 13 ............................. 51.58 8.0 51.58 8.0 – –Not able to be leveled ........ 48.12 38.6 48.14 38.7 – –
Physical sciences teachers,postsecondary .......................... 50.52 4.9 49.95 5.0 – –
Level 10 ............................. 39.95 5.8 39.95 5.8 – –Level 11 ............................. 40.96 4.2 41.03 4.3 – –Level 12 ............................. 53.13 5.6 53.13 5.6 – –Level 13 ............................. 71.59 3.4 70.74 3.0 – –Not able to be leveled ........ 53.28 14.6 51.16 18.4 – –
Atmospheric, earth, marine, andspace sciences teachers,postsecondary ...................... 55.87 12.6 52.17 18.9 – –
See footnotes at end of table.
NATIONAL COMPENSATION SURVEY
All United States 8-31 December 2006 - January 2008
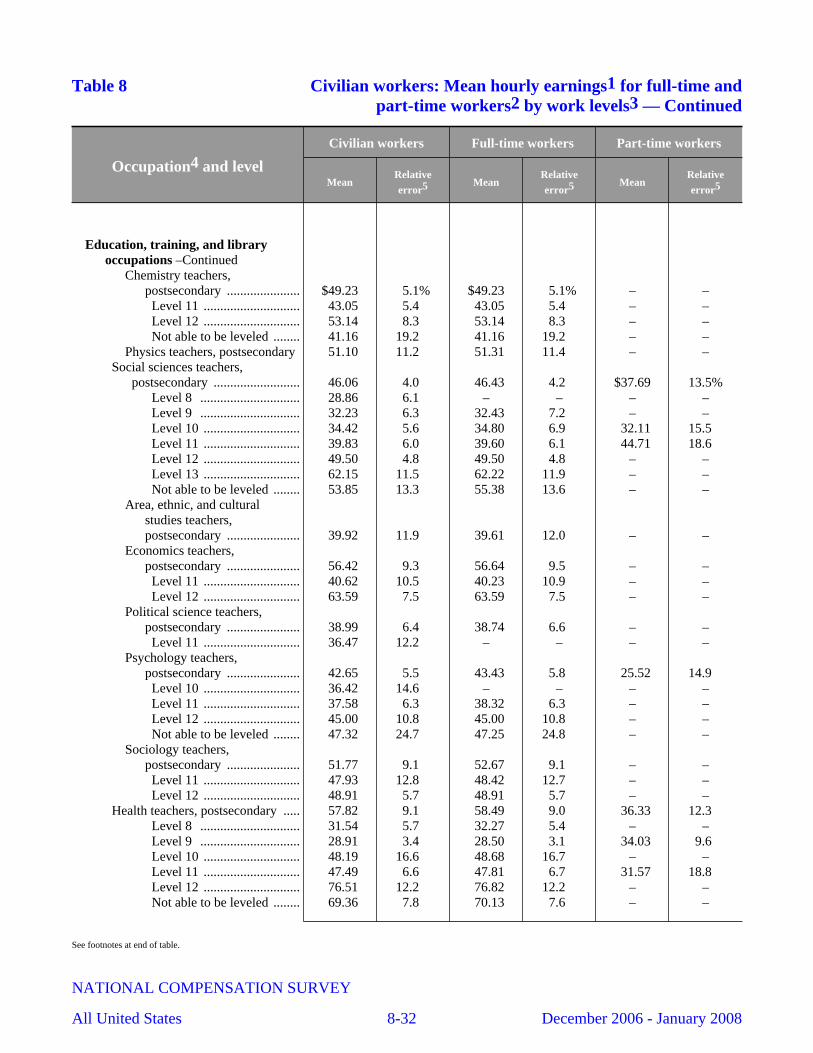
Table 8 Civilian workers: Mean hourly earnings1 for full-time andpart-time workers2 by work levels3 — Continued
Occupation4 and level
Civilian workers Full-time workers Part-time workers
MeanRelativeerror5 Mean
Relativeerror5 Mean
Relativeerror5
Education, training, and libraryoccupations –Continued
Chemistry teachers,postsecondary ...................... $49.23 5.1% $49.23 5.1% – –Level 11 ............................. 43.05 5.4 43.05 5.4 – –Level 12 ............................. 53.14 8.3 53.14 8.3 – –Not able to be leveled ........ 41.16 19.2 41.16 19.2 – –
Physics teachers, postsecondary 51.10 11.2 51.31 11.4 – –Social sciences teachers,
postsecondary .......................... 46.06 4.0 46.43 4.2 $37.69 13.5%Level 8 .............................. 28.86 6.1 – – – –Level 9 .............................. 32.23 6.3 32.43 7.2 – –Level 10 ............................. 34.42 5.6 34.80 6.9 32.11 15.5 Level 11 ............................. 39.83 6.0 39.60 6.1 44.71 18.6 Level 12 ............................. 49.50 4.8 49.50 4.8 – –Level 13 ............................. 62.15 11.5 62.22 11.9 – –Not able to be leveled ........ 53.85 13.3 55.38 13.6 – –
Area, ethnic, and culturalstudies teachers,postsecondary ...................... 39.92 11.9 39.61 12.0 – –
Economics teachers,postsecondary ...................... 56.42 9.3 56.64 9.5 – –Level 11 ............................. 40.62 10.5 40.23 10.9 – –Level 12 ............................. 63.59 7.5 63.59 7.5 – –
Political science teachers,postsecondary ...................... 38.99 6.4 38.74 6.6 – –Level 11 ............................. 36.47 12.2 – – – –
Psychology teachers,postsecondary ...................... 42.65 5.5 43.43 5.8 25.52 14.9 Level 10 ............................. 36.42 14.6 – – – –Level 11 ............................. 37.58 6.3 38.32 6.3 – –Level 12 ............................. 45.00 10.8 45.00 10.8 – –Not able to be leveled ........ 47.32 24.7 47.25 24.8 – –
Sociology teachers,postsecondary ...................... 51.77 9.1 52.67 9.1 – –Level 11 ............................. 47.93 12.8 48.42 12.7 – –Level 12 ............................. 48.91 5.7 48.91 5.7 – –
Health teachers, postsecondary ..... 57.82 9.1 58.49 9.0 36.33 12.3 Level 8 .............................. 31.54 5.7 32.27 5.4 – –Level 9 .............................. 28.91 3.4 28.50 3.1 34.03 9.6 Level 10 ............................. 48.19 16.6 48.68 16.7 – –Level 11 ............................. 47.49 6.6 47.81 6.7 31.57 18.8 Level 12 ............................. 76.51 12.2 76.82 12.2 – –Not able to be leveled ........ 69.36 7.8 70.13 7.6 – –
See footnotes at end of table.
NATIONAL COMPENSATION SURVEY
All United States 8-32 December 2006 - January 2008
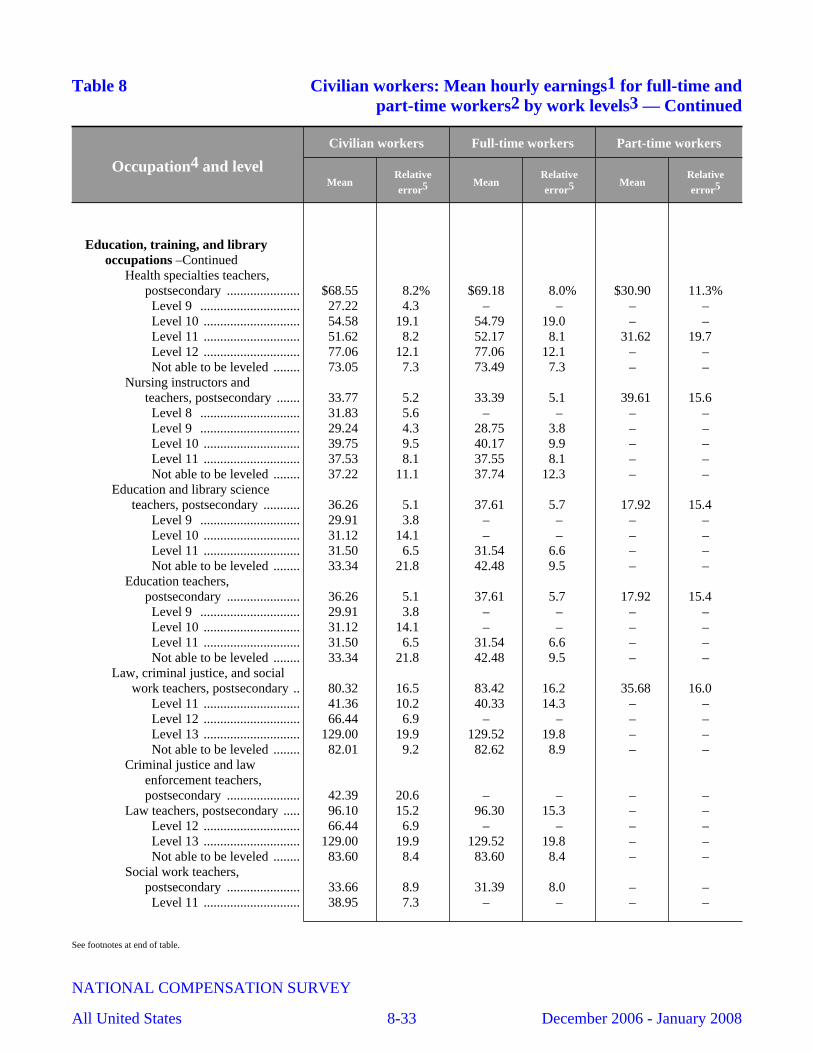
Table 8 Civilian workers: Mean hourly earnings1 for full-time andpart-time workers2 by work levels3 — Continued
Occupation4 and level
Civilian workers Full-time workers Part-time workers
MeanRelativeerror5 Mean
Relativeerror5 Mean
Relativeerror5
Education, training, and libraryoccupations –Continued
Health specialties teachers,postsecondary ...................... $68.55 8.2% $69.18 8.0% $30.90 11.3%Level 9 .............................. 27.22 4.3 – – – –Level 10 ............................. 54.58 19.1 54.79 19.0 – –Level 11 ............................. 51.62 8.2 52.17 8.1 31.62 19.7 Level 12 ............................. 77.06 12.1 77.06 12.1 – –Not able to be leveled ........ 73.05 7.3 73.49 7.3 – –
Nursing instructors andteachers, postsecondary ....... 33.77 5.2 33.39 5.1 39.61 15.6 Level 8 .............................. 31.83 5.6 – – – –Level 9 .............................. 29.24 4.3 28.75 3.8 – –Level 10 ............................. 39.75 9.5 40.17 9.9 – –Level 11 ............................. 37.53 8.1 37.55 8.1 – –Not able to be leveled ........ 37.22 11.1 37.74 12.3 – –
Education and library scienceteachers, postsecondary ........... 36.26 5.1 37.61 5.7 17.92 15.4
Level 9 .............................. 29.91 3.8 – – – –Level 10 ............................. 31.12 14.1 – – – –Level 11 ............................. 31.50 6.5 31.54 6.6 – –Not able to be leveled ........ 33.34 21.8 42.48 9.5 – –
Education teachers,postsecondary ...................... 36.26 5.1 37.61 5.7 17.92 15.4 Level 9 .............................. 29.91 3.8 – – – –Level 10 ............................. 31.12 14.1 – – – –Level 11 ............................. 31.50 6.5 31.54 6.6 – –Not able to be leveled ........ 33.34 21.8 42.48 9.5 – –
Law, criminal justice, and socialwork teachers, postsecondary .. 80.32 16.5 83.42 16.2 35.68 16.0
Level 11 ............................. 41.36 10.2 40.33 14.3 – –Level 12 ............................. 66.44 6.9 – – – –Level 13 ............................. 129.00 19.9 129.52 19.8 – –Not able to be leveled ........ 82.01 9.2 82.62 8.9 – –
Criminal justice and lawenforcement teachers,postsecondary ...................... 42.39 20.6 – – – –
Law teachers, postsecondary ..... 96.10 15.2 96.30 15.3 – –Level 12 ............................. 66.44 6.9 – – – –Level 13 ............................. 129.00 19.9 129.52 19.8 – –Not able to be leveled ........ 83.60 8.4 83.60 8.4 – –
Social work teachers,postsecondary ...................... 33.66 8.9 31.39 8.0 – –Level 11 ............................. 38.95 7.3 – – – –
See footnotes at end of table.
NATIONAL COMPENSATION SURVEY
All United States 8-33 December 2006 - January 2008
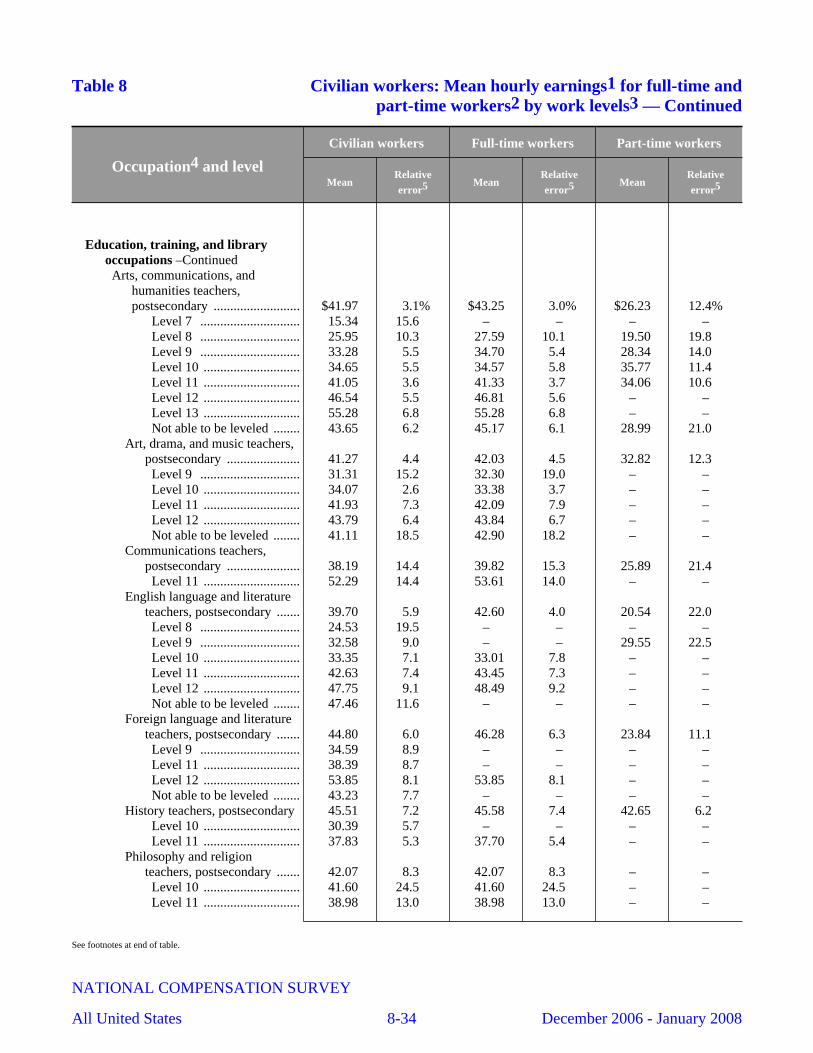
Table 8 Civilian workers: Mean hourly earnings1 for full-time andpart-time workers2 by work levels3 — Continued
Occupation4 and level
Civilian workers Full-time workers Part-time workers
MeanRelativeerror5 Mean
Relativeerror5 Mean
Relativeerror5
Education, training, and libraryoccupations –ContinuedArts, communications, and
humanities teachers,postsecondary .......................... $41.97 3.1% $43.25 3.0% $26.23 12.4%
Level 7 .............................. 15.34 15.6 – – – –Level 8 .............................. 25.95 10.3 27.59 10.1 19.50 19.8 Level 9 .............................. 33.28 5.5 34.70 5.4 28.34 14.0 Level 10 ............................. 34.65 5.5 34.57 5.8 35.77 11.4 Level 11 ............................. 41.05 3.6 41.33 3.7 34.06 10.6 Level 12 ............................. 46.54 5.5 46.81 5.6 – –Level 13 ............................. 55.28 6.8 55.28 6.8 – –Not able to be leveled ........ 43.65 6.2 45.17 6.1 28.99 21.0
Art, drama, and music teachers,postsecondary ...................... 41.27 4.4 42.03 4.5 32.82 12.3 Level 9 .............................. 31.31 15.2 32.30 19.0 – –Level 10 ............................. 34.07 2.6 33.38 3.7 – –Level 11 ............................. 41.93 7.3 42.09 7.9 – –Level 12 ............................. 43.79 6.4 43.84 6.7 – –Not able to be leveled ........ 41.11 18.5 42.90 18.2 – –
Communications teachers,postsecondary ...................... 38.19 14.4 39.82 15.3 25.89 21.4 Level 11 ............................. 52.29 14.4 53.61 14.0 – –
English language and literatureteachers, postsecondary ....... 39.70 5.9 42.60 4.0 20.54 22.0 Level 8 .............................. 24.53 19.5 – – – –Level 9 .............................. 32.58 9.0 – – 29.55 22.5 Level 10 ............................. 33.35 7.1 33.01 7.8 – –Level 11 ............................. 42.63 7.4 43.45 7.3 – –Level 12 ............................. 47.75 9.1 48.49 9.2 – –Not able to be leveled ........ 47.46 11.6 – – – –
Foreign language and literatureteachers, postsecondary ....... 44.80 6.0 46.28 6.3 23.84 11.1 Level 9 .............................. 34.59 8.9 – – – –Level 11 ............................. 38.39 8.7 – – – –Level 12 ............................. 53.85 8.1 53.85 8.1 – –Not able to be leveled ........ 43.23 7.7 – – – –
History teachers, postsecondary 45.51 7.2 45.58 7.4 42.65 6.2 Level 10 ............................. 30.39 5.7 – – – –Level 11 ............................. 37.83 5.3 37.70 5.4 – –
Philosophy and religionteachers, postsecondary ....... 42.07 8.3 42.07 8.3 – –Level 10 ............................. 41.60 24.5 41.60 24.5 – –Level 11 ............................. 38.98 13.0 38.98 13.0 – –
See footnotes at end of table.
NATIONAL COMPENSATION SURVEY
All United States 8-34 December 2006 - January 2008
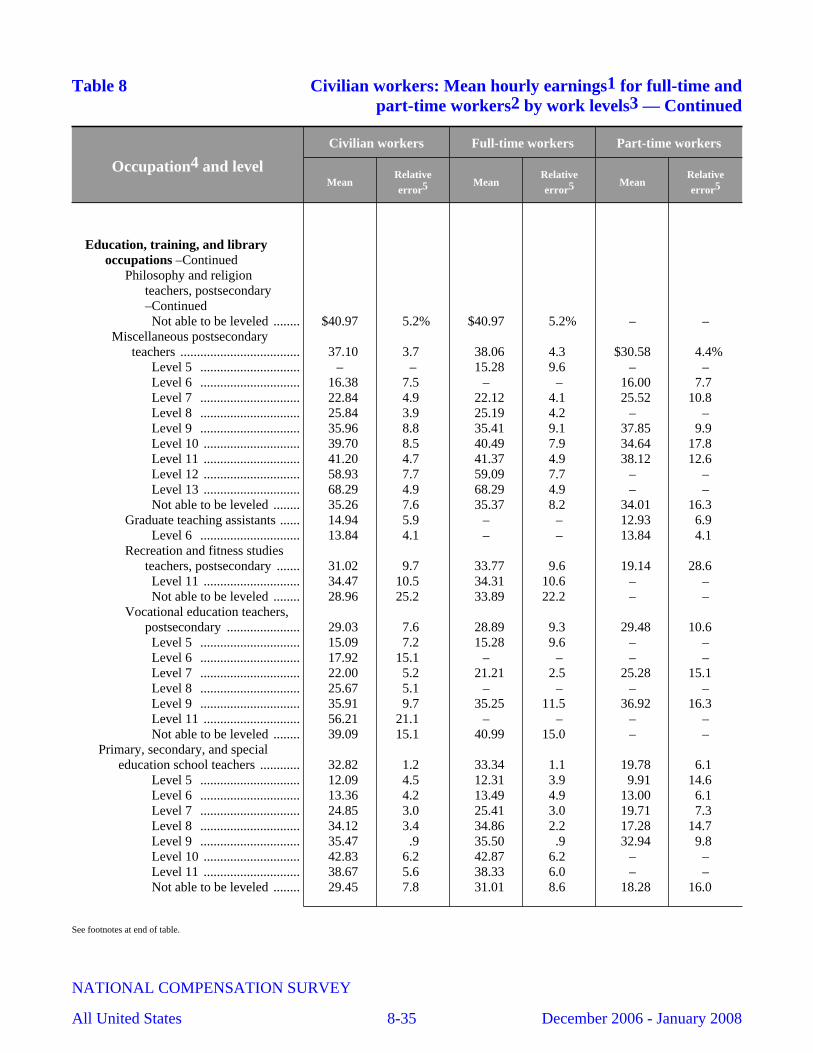
Table 8 Civilian workers: Mean hourly earnings1 for full-time andpart-time workers2 by work levels3 — Continued
Occupation4 and level
Civilian workers Full-time workers Part-time workers
MeanRelativeerror5 Mean
Relativeerror5 Mean
Relativeerror5
Education, training, and libraryoccupations –Continued
Philosophy and religionteachers, postsecondary–ContinuedNot able to be leveled ........ $40.97 5.2% $40.97 5.2% – –
Miscellaneous postsecondaryteachers .................................... 37.10 3.7 38.06 4.3 $30.58 4.4%
Level 5 .............................. – – 15.28 9.6 – –Level 6 .............................. 16.38 7.5 – – 16.00 7.7 Level 7 .............................. 22.84 4.9 22.12 4.1 25.52 10.8 Level 8 .............................. 25.84 3.9 25.19 4.2 – –Level 9 .............................. 35.96 8.8 35.41 9.1 37.85 9.9 Level 10 ............................. 39.70 8.5 40.49 7.9 34.64 17.8 Level 11 ............................. 41.20 4.7 41.37 4.9 38.12 12.6 Level 12 ............................. 58.93 7.7 59.09 7.7 – –Level 13 ............................. 68.29 4.9 68.29 4.9 – –Not able to be leveled ........ 35.26 7.6 35.37 8.2 34.01 16.3
Graduate teaching assistants ...... 14.94 5.9 – – 12.93 6.9 Level 6 .............................. 13.84 4.1 – – 13.84 4.1
Recreation and fitness studiesteachers, postsecondary ....... 31.02 9.7 33.77 9.6 19.14 28.6 Level 11 ............................. 34.47 10.5 34.31 10.6 – –Not able to be leveled ........ 28.96 25.2 33.89 22.2 – –
Vocational education teachers,postsecondary ...................... 29.03 7.6 28.89 9.3 29.48 10.6 Level 5 .............................. 15.09 7.2 15.28 9.6 – –Level 6 .............................. 17.92 15.1 – – – –Level 7 .............................. 22.00 5.2 21.21 2.5 25.28 15.1 Level 8 .............................. 25.67 5.1 – – – –Level 9 .............................. 35.91 9.7 35.25 11.5 36.92 16.3 Level 11 ............................. 56.21 21.1 – – – –Not able to be leveled ........ 39.09 15.1 40.99 15.0 – –
Primary, secondary, and specialeducation school teachers ............ 32.82 1.2 33.34 1.1 19.78 6.1
Level 5 .............................. 12.09 4.5 12.31 3.9 9.91 14.6 Level 6 .............................. 13.36 4.2 13.49 4.9 13.00 6.1 Level 7 .............................. 24.85 3.0 25.41 3.0 19.71 7.3 Level 8 .............................. 34.12 3.4 34.86 2.2 17.28 14.7 Level 9 .............................. 35.47 .9 35.50 .9 32.94 9.8 Level 10 ............................. 42.83 6.2 42.87 6.2 – –Level 11 ............................. 38.67 5.6 38.33 6.0 – –Not able to be leveled ........ 29.45 7.8 31.01 8.6 18.28 16.0
See footnotes at end of table.
NATIONAL COMPENSATION SURVEY
All United States 8-35 December 2006 - January 2008
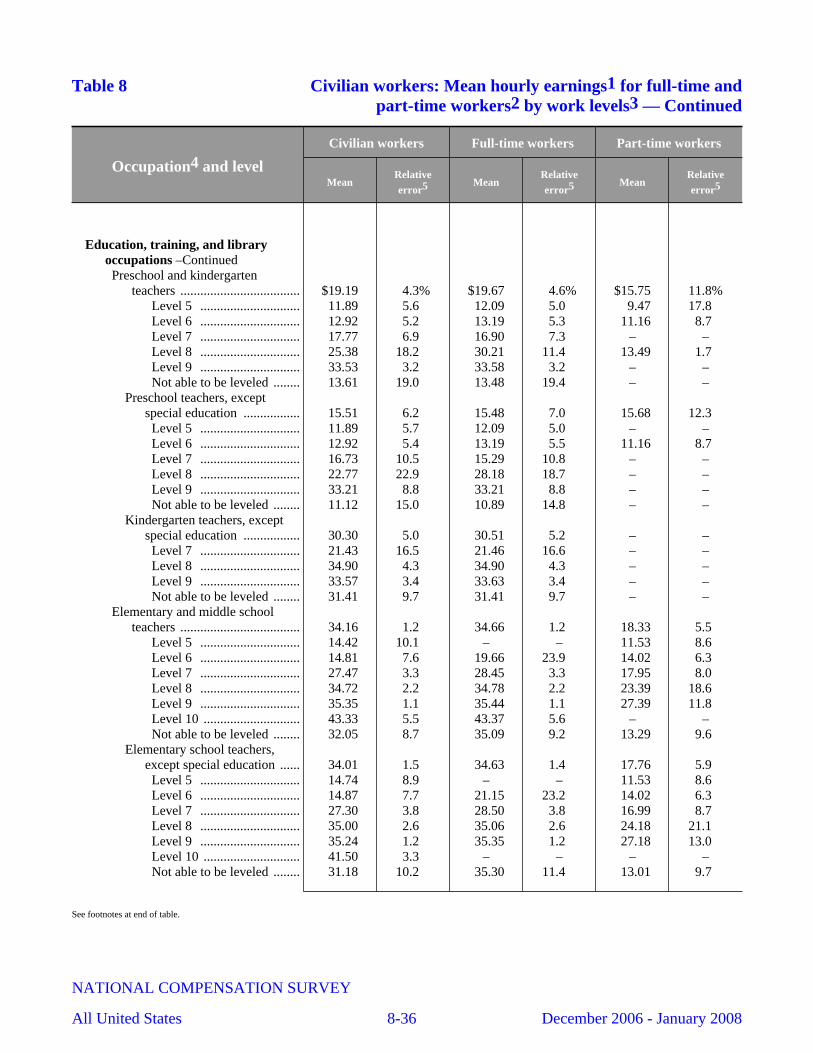
Table 8 Civilian workers: Mean hourly earnings1 for full-time andpart-time workers2 by work levels3 — Continued
Occupation4 and level
Civilian workers Full-time workers Part-time workers
MeanRelativeerror5 Mean
Relativeerror5 Mean
Relativeerror5
Education, training, and libraryoccupations –ContinuedPreschool and kindergarten
teachers .................................... $19.19 4.3% $19.67 4.6% $15.75 11.8%Level 5 .............................. 11.89 5.6 12.09 5.0 9.47 17.8 Level 6 .............................. 12.92 5.2 13.19 5.3 11.16 8.7 Level 7 .............................. 17.77 6.9 16.90 7.3 – –Level 8 .............................. 25.38 18.2 30.21 11.4 13.49 1.7 Level 9 .............................. 33.53 3.2 33.58 3.2 – –Not able to be leveled ........ 13.61 19.0 13.48 19.4 – –
Preschool teachers, exceptspecial education ................. 15.51 6.2 15.48 7.0 15.68 12.3 Level 5 .............................. 11.89 5.7 12.09 5.0 – –Level 6 .............................. 12.92 5.4 13.19 5.5 11.16 8.7 Level 7 .............................. 16.73 10.5 15.29 10.8 – –Level 8 .............................. 22.77 22.9 28.18 18.7 – –Level 9 .............................. 33.21 8.8 33.21 8.8 – –Not able to be leveled ........ 11.12 15.0 10.89 14.8 – –
Kindergarten teachers, exceptspecial education ................. 30.30 5.0 30.51 5.2 – –Level 7 .............................. 21.43 16.5 21.46 16.6 – –Level 8 .............................. 34.90 4.3 34.90 4.3 – –Level 9 .............................. 33.57 3.4 33.63 3.4 – –Not able to be leveled ........ 31.41 9.7 31.41 9.7 – –
Elementary and middle schoolteachers .................................... 34.16 1.2 34.66 1.2 18.33 5.5
Level 5 .............................. 14.42 10.1 – – 11.53 8.6 Level 6 .............................. 14.81 7.6 19.66 23.9 14.02 6.3 Level 7 .............................. 27.47 3.3 28.45 3.3 17.95 8.0 Level 8 .............................. 34.72 2.2 34.78 2.2 23.39 18.6 Level 9 .............................. 35.35 1.1 35.44 1.1 27.39 11.8 Level 10 ............................. 43.33 5.5 43.37 5.6 – –Not able to be leveled ........ 32.05 8.7 35.09 9.2 13.29 9.6
Elementary school teachers,except special education ...... 34.01 1.5 34.63 1.4 17.76 5.9 Level 5 .............................. 14.74 8.9 – – 11.53 8.6 Level 6 .............................. 14.87 7.7 21.15 23.2 14.02 6.3 Level 7 .............................. 27.30 3.8 28.50 3.8 16.99 8.7 Level 8 .............................. 35.00 2.6 35.06 2.6 24.18 21.1 Level 9 .............................. 35.24 1.2 35.35 1.2 27.18 13.0 Level 10 ............................. 41.50 3.3 – – – –Not able to be leveled ........ 31.18 10.2 35.30 11.4 13.01 9.7
See footnotes at end of table.
NATIONAL COMPENSATION SURVEY
All United States 8-36 December 2006 - January 2008
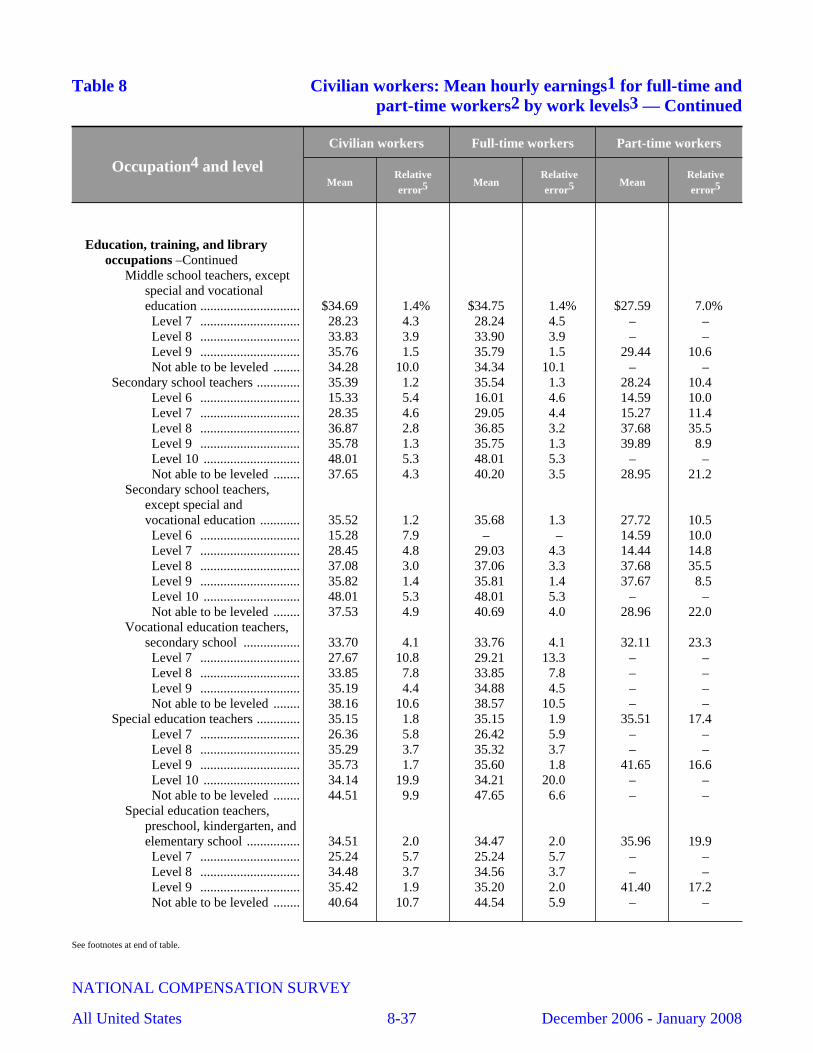
Table 8 Civilian workers: Mean hourly earnings1 for full-time andpart-time workers2 by work levels3 — Continued
Occupation4 and level
Civilian workers Full-time workers Part-time workers
MeanRelativeerror5 Mean
Relativeerror5 Mean
Relativeerror5
Education, training, and libraryoccupations –Continued
Middle school teachers, exceptspecial and vocationaleducation .............................. $34.69 1.4% $34.75 1.4% $27.59 7.0%Level 7 .............................. 28.23 4.3 28.24 4.5 – –Level 8 .............................. 33.83 3.9 33.90 3.9 – –Level 9 .............................. 35.76 1.5 35.79 1.5 29.44 10.6 Not able to be leveled ........ 34.28 10.0 34.34 10.1 – –
Secondary school teachers ............. 35.39 1.2 35.54 1.3 28.24 10.4 Level 6 .............................. 15.33 5.4 16.01 4.6 14.59 10.0 Level 7 .............................. 28.35 4.6 29.05 4.4 15.27 11.4 Level 8 .............................. 36.87 2.8 36.85 3.2 37.68 35.5 Level 9 .............................. 35.78 1.3 35.75 1.3 39.89 8.9 Level 10 ............................. 48.01 5.3 48.01 5.3 – –Not able to be leveled ........ 37.65 4.3 40.20 3.5 28.95 21.2
Secondary school teachers,except special andvocational education ............ 35.52 1.2 35.68 1.3 27.72 10.5 Level 6 .............................. 15.28 7.9 – – 14.59 10.0 Level 7 .............................. 28.45 4.8 29.03 4.3 14.44 14.8 Level 8 .............................. 37.08 3.0 37.06 3.3 37.68 35.5 Level 9 .............................. 35.82 1.4 35.81 1.4 37.67 8.5 Level 10 ............................. 48.01 5.3 48.01 5.3 – –Not able to be leveled ........ 37.53 4.9 40.69 4.0 28.96 22.0
Vocational education teachers,secondary school ................. 33.70 4.1 33.76 4.1 32.11 23.3 Level 7 .............................. 27.67 10.8 29.21 13.3 – –Level 8 .............................. 33.85 7.8 33.85 7.8 – –Level 9 .............................. 35.19 4.4 34.88 4.5 – –Not able to be leveled ........ 38.16 10.6 38.57 10.5 – –
Special education teachers ............. 35.15 1.8 35.15 1.9 35.51 17.4 Level 7 .............................. 26.36 5.8 26.42 5.9 – –Level 8 .............................. 35.29 3.7 35.32 3.7 – –Level 9 .............................. 35.73 1.7 35.60 1.8 41.65 16.6 Level 10 ............................. 34.14 19.9 34.21 20.0 – –Not able to be leveled ........ 44.51 9.9 47.65 6.6 – –
Special education teachers,preschool, kindergarten, andelementary school ................ 34.51 2.0 34.47 2.0 35.96 19.9 Level 7 .............................. 25.24 5.7 25.24 5.7 – –Level 8 .............................. 34.48 3.7 34.56 3.7 – –Level 9 .............................. 35.42 1.9 35.20 2.0 41.40 17.2 Not able to be leveled ........ 40.64 10.7 44.54 5.9 – –
See footnotes at end of table.
NATIONAL COMPENSATION SURVEY
All United States 8-37 December 2006 - January 2008
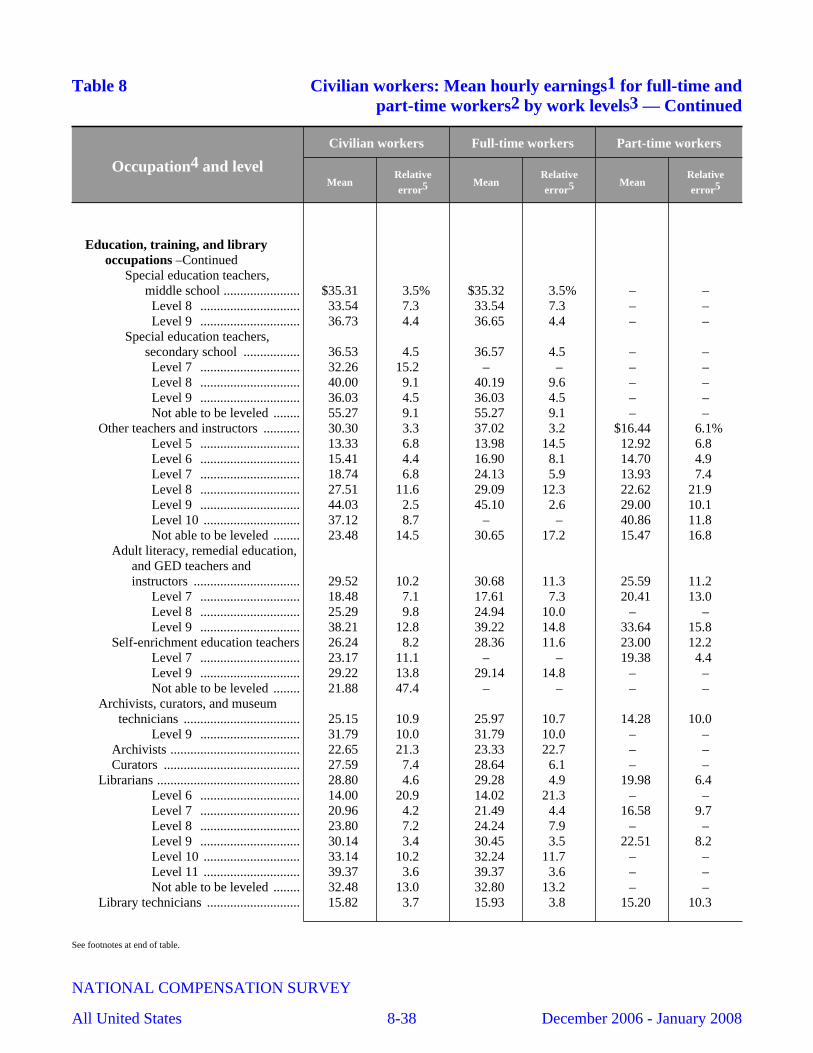
Table 8 Civilian workers: Mean hourly earnings1 for full-time andpart-time workers2 by work levels3 — Continued
Occupation4 and level
Civilian workers Full-time workers Part-time workers
MeanRelativeerror5 Mean
Relativeerror5 Mean
Relativeerror5
Education, training, and libraryoccupations –Continued
Special education teachers,middle school ....................... $35.31 3.5% $35.32 3.5% – –Level 8 .............................. 33.54 7.3 33.54 7.3 – –Level 9 .............................. 36.73 4.4 36.65 4.4 – –
Special education teachers,secondary school ................. 36.53 4.5 36.57 4.5 – –Level 7 .............................. 32.26 15.2 – – – –Level 8 .............................. 40.00 9.1 40.19 9.6 – –Level 9 .............................. 36.03 4.5 36.03 4.5 – –Not able to be leveled ........ 55.27 9.1 55.27 9.1 – –
Other teachers and instructors ........... 30.30 3.3 37.02 3.2 $16.44 6.1%Level 5 .............................. 13.33 6.8 13.98 14.5 12.92 6.8 Level 6 .............................. 15.41 4.4 16.90 8.1 14.70 4.9 Level 7 .............................. 18.74 6.8 24.13 5.9 13.93 7.4 Level 8 .............................. 27.51 11.6 29.09 12.3 22.62 21.9 Level 9 .............................. 44.03 2.5 45.10 2.6 29.00 10.1 Level 10 ............................. 37.12 8.7 – – 40.86 11.8 Not able to be leveled ........ 23.48 14.5 30.65 17.2 15.47 16.8
Adult literacy, remedial education,and GED teachers andinstructors ................................ 29.52 10.2 30.68 11.3 25.59 11.2
Level 7 .............................. 18.48 7.1 17.61 7.3 20.41 13.0 Level 8 .............................. 25.29 9.8 24.94 10.0 – –Level 9 .............................. 38.21 12.8 39.22 14.8 33.64 15.8
Self-enrichment education teachers 26.24 8.2 28.36 11.6 23.00 12.2 Level 7 .............................. 23.17 11.1 – – 19.38 4.4 Level 9 .............................. 29.22 13.8 29.14 14.8 – –Not able to be leveled ........ 21.88 47.4 – – – –
Archivists, curators, and museumtechnicians ................................... 25.15 10.9 25.97 10.7 14.28 10.0
Level 9 .............................. 31.79 10.0 31.79 10.0 – –Archivists ....................................... 22.65 21.3 23.33 22.7 – –Curators ......................................... 27.59 7.4 28.64 6.1 – –
Librarians ........................................... 28.80 4.6 29.28 4.9 19.98 6.4 Level 6 .............................. 14.00 20.9 14.02 21.3 – –Level 7 .............................. 20.96 4.2 21.49 4.4 16.58 9.7 Level 8 .............................. 23.80 7.2 24.24 7.9 – –Level 9 .............................. 30.14 3.4 30.45 3.5 22.51 8.2 Level 10 ............................. 33.14 10.2 32.24 11.7 – –Level 11 ............................. 39.37 3.6 39.37 3.6 – –Not able to be leveled ........ 32.48 13.0 32.80 13.2 – –
Library technicians ............................ 15.82 3.7 15.93 3.8 15.20 10.3
See footnotes at end of table.
NATIONAL COMPENSATION SURVEY
All United States 8-38 December 2006 - January 2008
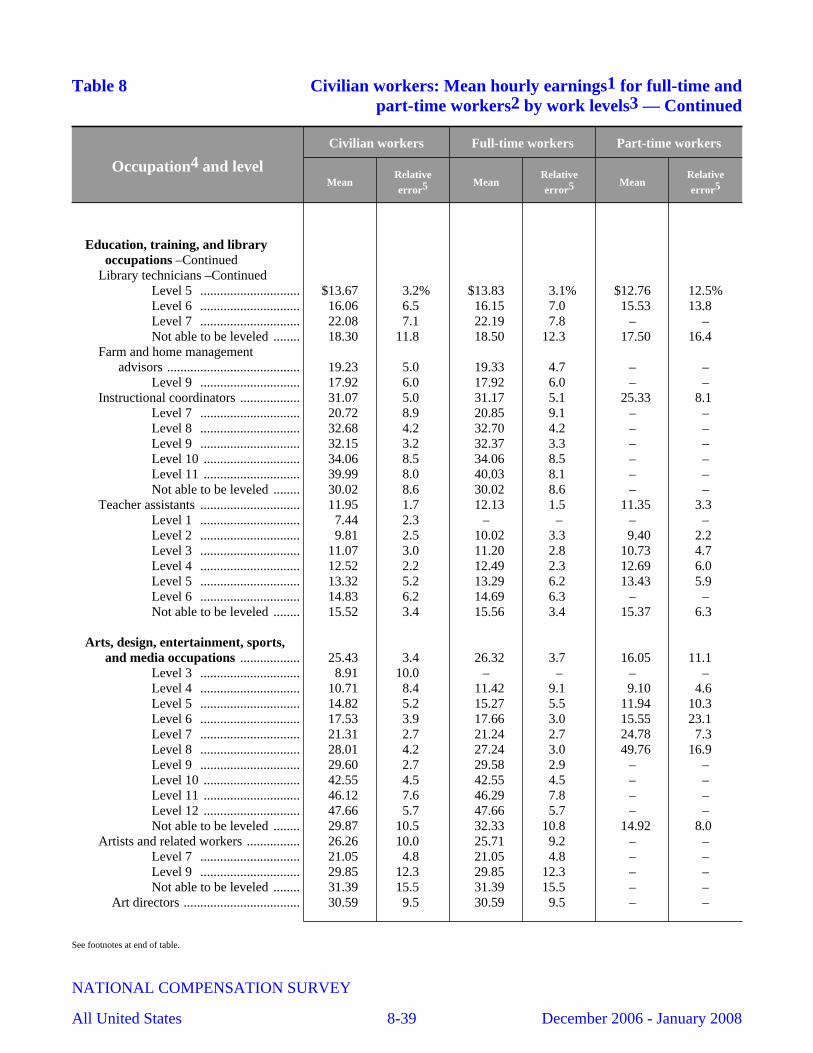
Table 8 Civilian workers: Mean hourly earnings1 for full-time andpart-time workers2 by work levels3 — Continued
Occupation4 and level
Civilian workers Full-time workers Part-time workers
MeanRelativeerror5 Mean
Relativeerror5 Mean
Relativeerror5
Education, training, and libraryoccupations –Continued
Library technicians –ContinuedLevel 5 .............................. $13.67 3.2% $13.83 3.1% $12.76 12.5%Level 6 .............................. 16.06 6.5 16.15 7.0 15.53 13.8 Level 7 .............................. 22.08 7.1 22.19 7.8 – –Not able to be leveled ........ 18.30 11.8 18.50 12.3 17.50 16.4
Farm and home managementadvisors ........................................ 19.23 5.0 19.33 4.7 – –
Level 9 .............................. 17.92 6.0 17.92 6.0 – –Instructional coordinators .................. 31.07 5.0 31.17 5.1 25.33 8.1
Level 7 .............................. 20.72 8.9 20.85 9.1 – –Level 8 .............................. 32.68 4.2 32.70 4.2 – –Level 9 .............................. 32.15 3.2 32.37 3.3 – –Level 10 ............................. 34.06 8.5 34.06 8.5 – –Level 11 ............................. 39.99 8.0 40.03 8.1 – –Not able to be leveled ........ 30.02 8.6 30.02 8.6 – –
Teacher assistants .............................. 11.95 1.7 12.13 1.5 11.35 3.3 Level 1 .............................. 7.44 2.3 – – – –Level 2 .............................. 9.81 2.5 10.02 3.3 9.40 2.2 Level 3 .............................. 11.07 3.0 11.20 2.8 10.73 4.7 Level 4 .............................. 12.52 2.2 12.49 2.3 12.69 6.0 Level 5 .............................. 13.32 5.2 13.29 6.2 13.43 5.9 Level 6 .............................. 14.83 6.2 14.69 6.3 – –Not able to be leveled ........ 15.52 3.4 15.56 3.4 15.37 6.3
Arts, design, entertainment, sports,and media occupations .................. 25.43 3.4 26.32 3.7 16.05 11.1
Level 3 .............................. 8.91 10.0 – – – –Level 4 .............................. 10.71 8.4 11.42 9.1 9.10 4.6 Level 5 .............................. 14.82 5.2 15.27 5.5 11.94 10.3 Level 6 .............................. 17.53 3.9 17.66 3.0 15.55 23.1 Level 7 .............................. 21.31 2.7 21.24 2.7 24.78 7.3 Level 8 .............................. 28.01 4.2 27.24 3.0 49.76 16.9 Level 9 .............................. 29.60 2.7 29.58 2.9 – –Level 10 ............................. 42.55 4.5 42.55 4.5 – –Level 11 ............................. 46.12 7.6 46.29 7.8 – –Level 12 ............................. 47.66 5.7 47.66 5.7 – –Not able to be leveled ........ 29.87 10.5 32.33 10.8 14.92 8.0
Artists and related workers ................ 26.26 10.0 25.71 9.2 – –Level 7 .............................. 21.05 4.8 21.05 4.8 – –Level 9 .............................. 29.85 12.3 29.85 12.3 – –Not able to be leveled ........ 31.39 15.5 31.39 15.5 – –
Art directors ................................... 30.59 9.5 30.59 9.5 – –
See footnotes at end of table.
NATIONAL COMPENSATION SURVEY
All United States 8-39 December 2006 - January 2008
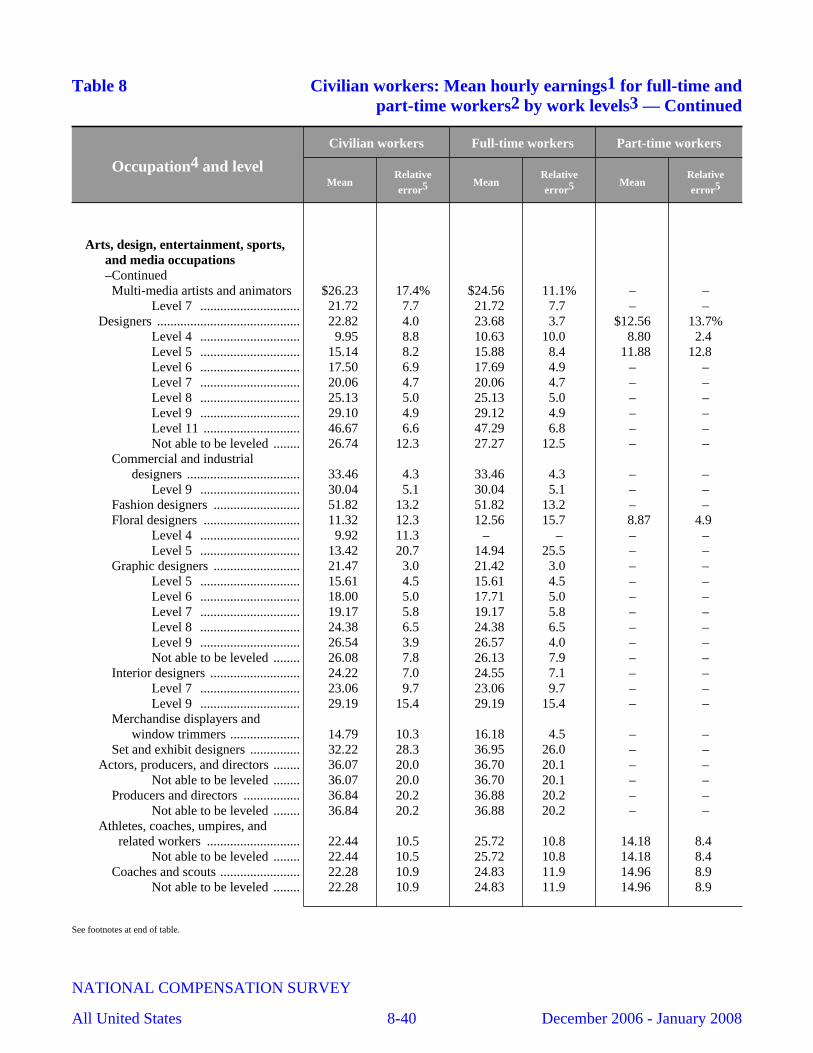
Table 8 Civilian workers: Mean hourly earnings1 for full-time andpart-time workers2 by work levels3 — Continued
Occupation4 and level
Civilian workers Full-time workers Part-time workers
MeanRelativeerror5 Mean
Relativeerror5 Mean
Relativeerror5
Arts, design, entertainment, sports,and media occupations–ContinuedMulti-media artists and animators $26.23 17.4% $24.56 11.1% – –
Level 7 .............................. 21.72 7.7 21.72 7.7 – –Designers ........................................... 22.82 4.0 23.68 3.7 $12.56 13.7%
Level 4 .............................. 9.95 8.8 10.63 10.0 8.80 2.4 Level 5 .............................. 15.14 8.2 15.88 8.4 11.88 12.8 Level 6 .............................. 17.50 6.9 17.69 4.9 – –Level 7 .............................. 20.06 4.7 20.06 4.7 – –Level 8 .............................. 25.13 5.0 25.13 5.0 – –Level 9 .............................. 29.10 4.9 29.12 4.9 – –Level 11 ............................. 46.67 6.6 47.29 6.8 – –Not able to be leveled ........ 26.74 12.3 27.27 12.5 – –
Commercial and industrialdesigners .................................. 33.46 4.3 33.46 4.3 – –
Level 9 .............................. 30.04 5.1 30.04 5.1 – –Fashion designers .......................... 51.82 13.2 51.82 13.2 – –Floral designers ............................. 11.32 12.3 12.56 15.7 8.87 4.9
Level 4 .............................. 9.92 11.3 – – – –Level 5 .............................. 13.42 20.7 14.94 25.5 – –
Graphic designers .......................... 21.47 3.0 21.42 3.0 – –Level 5 .............................. 15.61 4.5 15.61 4.5 – –Level 6 .............................. 18.00 5.0 17.71 5.0 – –Level 7 .............................. 19.17 5.8 19.17 5.8 – –Level 8 .............................. 24.38 6.5 24.38 6.5 – –Level 9 .............................. 26.54 3.9 26.57 4.0 – –Not able to be leveled ........ 26.08 7.8 26.13 7.9 – –
Interior designers ........................... 24.22 7.0 24.55 7.1 – –Level 7 .............................. 23.06 9.7 23.06 9.7 – –Level 9 .............................. 29.19 15.4 29.19 15.4 – –
Merchandise displayers andwindow trimmers ..................... 14.79 10.3 16.18 4.5 – –
Set and exhibit designers ............... 32.22 28.3 36.95 26.0 – –Actors, producers, and directors ........ 36.07 20.0 36.70 20.1 – –
Not able to be leveled ........ 36.07 20.0 36.70 20.1 – –Producers and directors ................. 36.84 20.2 36.88 20.2 – –
Not able to be leveled ........ 36.84 20.2 36.88 20.2 – –Athletes, coaches, umpires, and
related workers ............................ 22.44 10.5 25.72 10.8 14.18 8.4 Not able to be leveled ........ 22.44 10.5 25.72 10.8 14.18 8.4
Coaches and scouts ........................ 22.28 10.9 24.83 11.9 14.96 8.9 Not able to be leveled ........ 22.28 10.9 24.83 11.9 14.96 8.9
See footnotes at end of table.
NATIONAL COMPENSATION SURVEY
All United States 8-40 December 2006 - January 2008
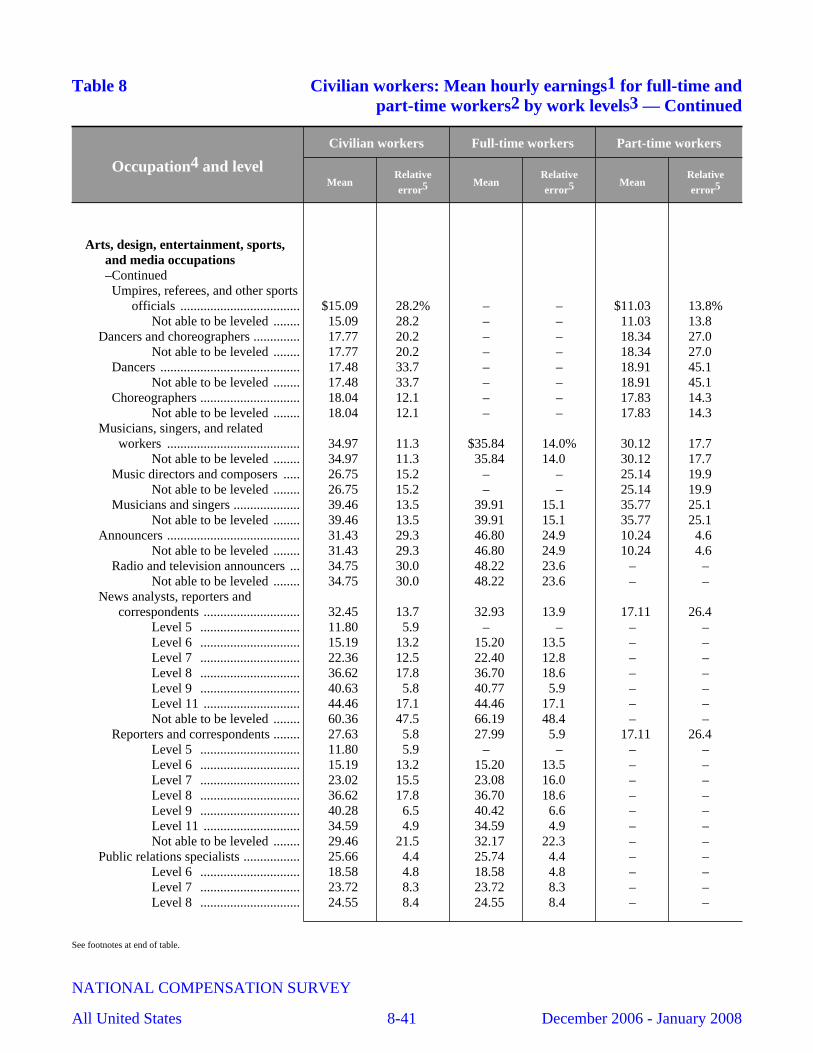
Table 8 Civilian workers: Mean hourly earnings1 for full-time andpart-time workers2 by work levels3 — Continued
Occupation4 and level
Civilian workers Full-time workers Part-time workers
MeanRelativeerror5 Mean
Relativeerror5 Mean
Relativeerror5
Arts, design, entertainment, sports,and media occupations–ContinuedUmpires, referees, and other sports
officials .................................... $15.09 28.2% – – $11.03 13.8%Not able to be leveled ........ 15.09 28.2 – – 11.03 13.8
Dancers and choreographers .............. 17.77 20.2 – – 18.34 27.0 Not able to be leveled ........ 17.77 20.2 – – 18.34 27.0
Dancers .......................................... 17.48 33.7 – – 18.91 45.1 Not able to be leveled ........ 17.48 33.7 – – 18.91 45.1
Choreographers .............................. 18.04 12.1 – – 17.83 14.3 Not able to be leveled ........ 18.04 12.1 – – 17.83 14.3
Musicians, singers, and relatedworkers ........................................ 34.97 11.3 $35.84 14.0% 30.12 17.7
Not able to be leveled ........ 34.97 11.3 35.84 14.0 30.12 17.7 Music directors and composers ..... 26.75 15.2 – – 25.14 19.9
Not able to be leveled ........ 26.75 15.2 – – 25.14 19.9 Musicians and singers .................... 39.46 13.5 39.91 15.1 35.77 25.1
Not able to be leveled ........ 39.46 13.5 39.91 15.1 35.77 25.1 Announcers ........................................ 31.43 29.3 46.80 24.9 10.24 4.6
Not able to be leveled ........ 31.43 29.3 46.80 24.9 10.24 4.6 Radio and television announcers ... 34.75 30.0 48.22 23.6 – –
Not able to be leveled ........ 34.75 30.0 48.22 23.6 – –News analysts, reporters and
correspondents ............................. 32.45 13.7 32.93 13.9 17.11 26.4 Level 5 .............................. 11.80 5.9 – – – –Level 6 .............................. 15.19 13.2 15.20 13.5 – –Level 7 .............................. 22.36 12.5 22.40 12.8 – –Level 8 .............................. 36.62 17.8 36.70 18.6 – –Level 9 .............................. 40.63 5.8 40.77 5.9 – –Level 11 ............................. 44.46 17.1 44.46 17.1 – –Not able to be leveled ........ 60.36 47.5 66.19 48.4 – –
Reporters and correspondents ........ 27.63 5.8 27.99 5.9 17.11 26.4 Level 5 .............................. 11.80 5.9 – – – –Level 6 .............................. 15.19 13.2 15.20 13.5 – –Level 7 .............................. 23.02 15.5 23.08 16.0 – –Level 8 .............................. 36.62 17.8 36.70 18.6 – –Level 9 .............................. 40.28 6.5 40.42 6.6 – –Level 11 ............................. 34.59 4.9 34.59 4.9 – –Not able to be leveled ........ 29.46 21.5 32.17 22.3 – –
Public relations specialists ................. 25.66 4.4 25.74 4.4 – –Level 6 .............................. 18.58 4.8 18.58 4.8 – –Level 7 .............................. 23.72 8.3 23.72 8.3 – –Level 8 .............................. 24.55 8.4 24.55 8.4 – –
See footnotes at end of table.
NATIONAL COMPENSATION SURVEY
All United States 8-41 December 2006 - January 2008
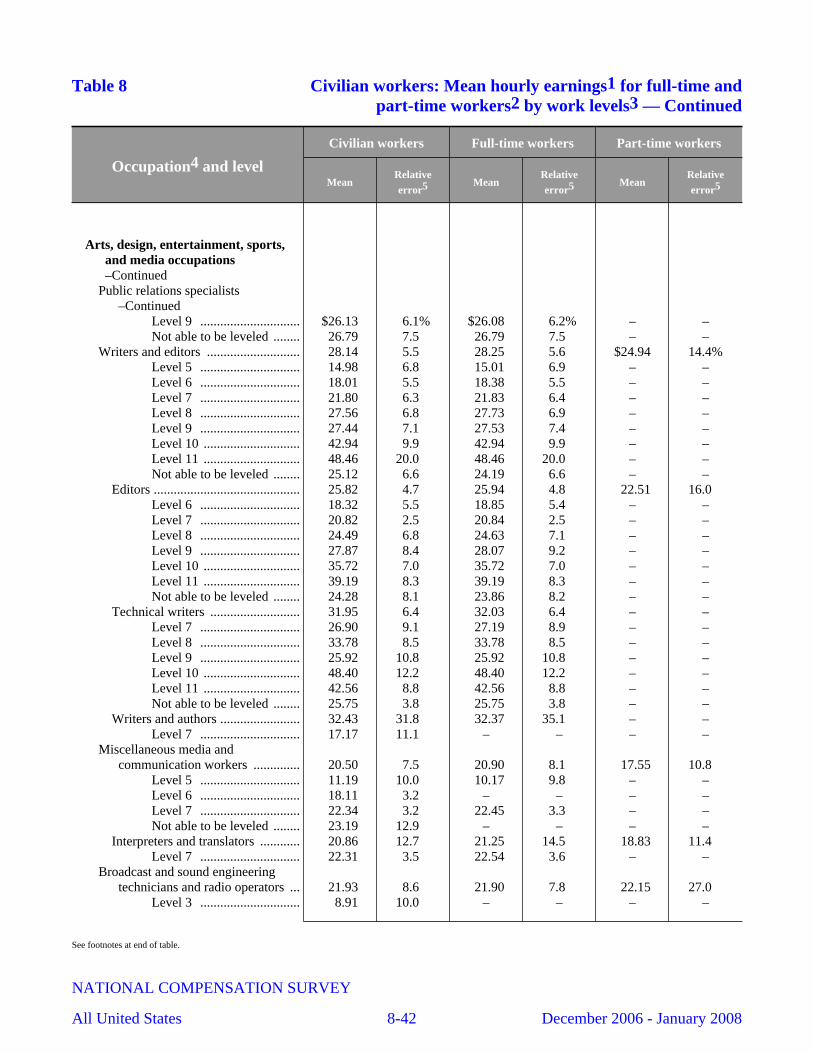
Table 8 Civilian workers: Mean hourly earnings1 for full-time andpart-time workers2 by work levels3 — Continued
Occupation4 and level
Civilian workers Full-time workers Part-time workers
MeanRelativeerror5 Mean
Relativeerror5 Mean
Relativeerror5
Arts, design, entertainment, sports,and media occupations–Continued
Public relations specialists–Continued
Level 9 .............................. $26.13 6.1% $26.08 6.2% – –Not able to be leveled ........ 26.79 7.5 26.79 7.5 – –
Writers and editors ............................ 28.14 5.5 28.25 5.6 $24.94 14.4%Level 5 .............................. 14.98 6.8 15.01 6.9 – –Level 6 .............................. 18.01 5.5 18.38 5.5 – –Level 7 .............................. 21.80 6.3 21.83 6.4 – –Level 8 .............................. 27.56 6.8 27.73 6.9 – –Level 9 .............................. 27.44 7.1 27.53 7.4 – –Level 10 ............................. 42.94 9.9 42.94 9.9 – –Level 11 ............................. 48.46 20.0 48.46 20.0 – –Not able to be leveled ........ 25.12 6.6 24.19 6.6 – –
Editors ............................................ 25.82 4.7 25.94 4.8 22.51 16.0 Level 6 .............................. 18.32 5.5 18.85 5.4 – –Level 7 .............................. 20.82 2.5 20.84 2.5 – –Level 8 .............................. 24.49 6.8 24.63 7.1 – –Level 9 .............................. 27.87 8.4 28.07 9.2 – –Level 10 ............................. 35.72 7.0 35.72 7.0 – –Level 11 ............................. 39.19 8.3 39.19 8.3 – –Not able to be leveled ........ 24.28 8.1 23.86 8.2 – –
Technical writers ........................... 31.95 6.4 32.03 6.4 – –Level 7 .............................. 26.90 9.1 27.19 8.9 – –Level 8 .............................. 33.78 8.5 33.78 8.5 – –Level 9 .............................. 25.92 10.8 25.92 10.8 – –Level 10 ............................. 48.40 12.2 48.40 12.2 – –Level 11 ............................. 42.56 8.8 42.56 8.8 – –Not able to be leveled ........ 25.75 3.8 25.75 3.8 – –
Writers and authors ........................ 32.43 31.8 32.37 35.1 – –Level 7 .............................. 17.17 11.1 – – – –
Miscellaneous media andcommunication workers .............. 20.50 7.5 20.90 8.1 17.55 10.8
Level 5 .............................. 11.19 10.0 10.17 9.8 – –Level 6 .............................. 18.11 3.2 – – – –Level 7 .............................. 22.34 3.2 22.45 3.3 – –Not able to be leveled ........ 23.19 12.9 – – – –
Interpreters and translators ............ 20.86 12.7 21.25 14.5 18.83 11.4 Level 7 .............................. 22.31 3.5 22.54 3.6 – –
Broadcast and sound engineeringtechnicians and radio operators ... 21.93 8.6 21.90 7.8 22.15 27.0
Level 3 .............................. 8.91 10.0 – – – –
See footnotes at end of table.
NATIONAL COMPENSATION SURVEY
All United States 8-42 December 2006 - January 2008
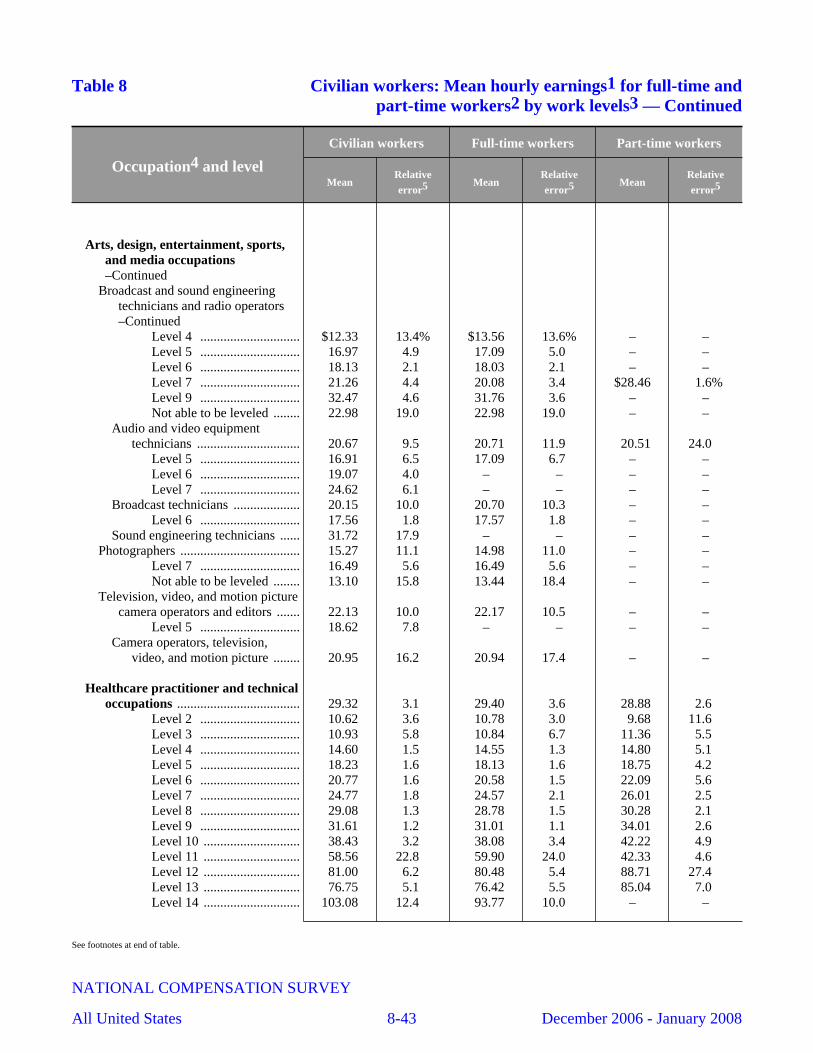
Table 8 Civilian workers: Mean hourly earnings1 for full-time andpart-time workers2 by work levels3 — Continued
Occupation4 and level
Civilian workers Full-time workers Part-time workers
MeanRelativeerror5 Mean
Relativeerror5 Mean
Relativeerror5
Arts, design, entertainment, sports,and media occupations–Continued
Broadcast and sound engineeringtechnicians and radio operators–Continued
Level 4 .............................. $12.33 13.4% $13.56 13.6% – –Level 5 .............................. 16.97 4.9 17.09 5.0 – –Level 6 .............................. 18.13 2.1 18.03 2.1 – –Level 7 .............................. 21.26 4.4 20.08 3.4 $28.46 1.6%Level 9 .............................. 32.47 4.6 31.76 3.6 – –Not able to be leveled ........ 22.98 19.0 22.98 19.0 – –
Audio and video equipmenttechnicians ............................... 20.67 9.5 20.71 11.9 20.51 24.0
Level 5 .............................. 16.91 6.5 17.09 6.7 – –Level 6 .............................. 19.07 4.0 – – – –Level 7 .............................. 24.62 6.1 – – – –
Broadcast technicians .................... 20.15 10.0 20.70 10.3 – –Level 6 .............................. 17.56 1.8 17.57 1.8 – –
Sound engineering technicians ...... 31.72 17.9 – – – –Photographers .................................... 15.27 11.1 14.98 11.0 – –
Level 7 .............................. 16.49 5.6 16.49 5.6 – –Not able to be leveled ........ 13.10 15.8 13.44 18.4 – –
Television, video, and motion picturecamera operators and editors ....... 22.13 10.0 22.17 10.5 – –
Level 5 .............................. 18.62 7.8 – – – –Camera operators, television,
video, and motion picture ........ 20.95 16.2 20.94 17.4 – –
Healthcare practitioner and technicaloccupations ..................................... 29.32 3.1 29.40 3.6 28.88 2.6
Level 2 .............................. 10.62 3.6 10.78 3.0 9.68 11.6 Level 3 .............................. 10.93 5.8 10.84 6.7 11.36 5.5 Level 4 .............................. 14.60 1.5 14.55 1.3 14.80 5.1 Level 5 .............................. 18.23 1.6 18.13 1.6 18.75 4.2 Level 6 .............................. 20.77 1.6 20.58 1.5 22.09 5.6 Level 7 .............................. 24.77 1.8 24.57 2.1 26.01 2.5 Level 8 .............................. 29.08 1.3 28.78 1.5 30.28 2.1 Level 9 .............................. 31.61 1.2 31.01 1.1 34.01 2.6 Level 10 ............................. 38.43 3.2 38.08 3.4 42.22 4.9 Level 11 ............................. 58.56 22.8 59.90 24.0 42.33 4.6 Level 12 ............................. 81.00 6.2 80.48 5.4 88.71 27.4 Level 13 ............................. 76.75 5.1 76.42 5.5 85.04 7.0 Level 14 ............................. 103.08 12.4 93.77 10.0 – –
See footnotes at end of table.
NATIONAL COMPENSATION SURVEY
All United States 8-43 December 2006 - January 2008
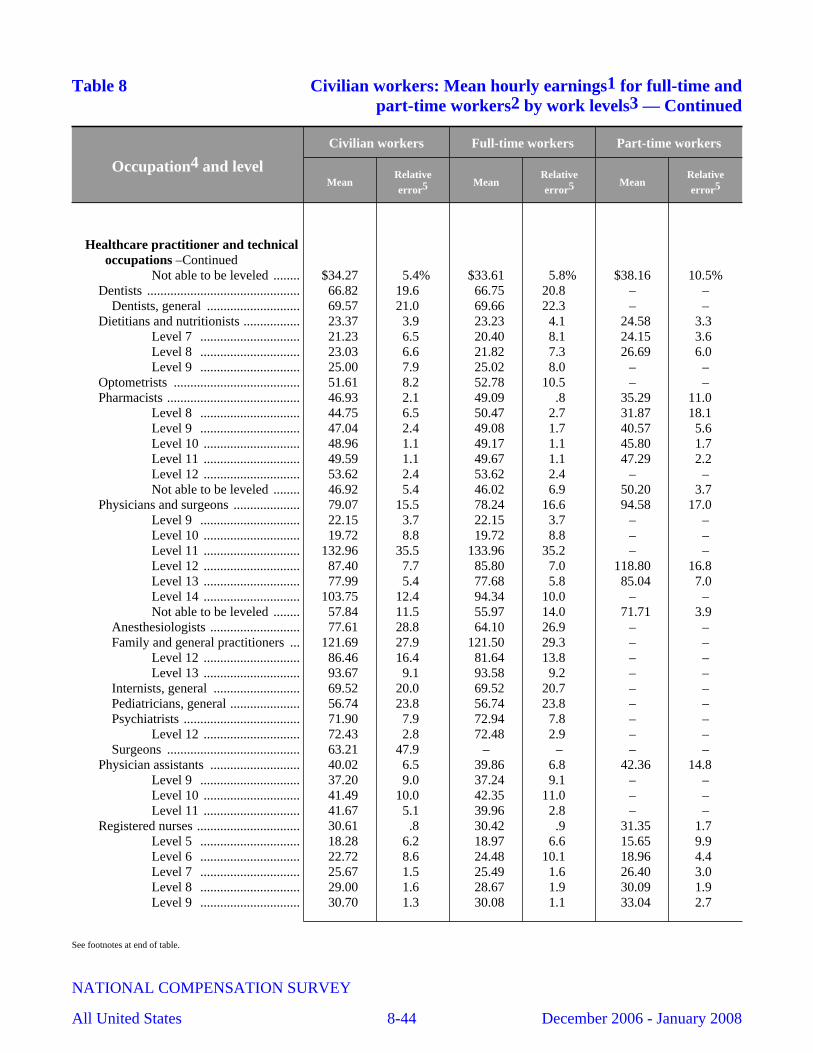
Table 8 Civilian workers: Mean hourly earnings1 for full-time andpart-time workers2 by work levels3 — Continued
Occupation4 and level
Civilian workers Full-time workers Part-time workers
MeanRelativeerror5 Mean
Relativeerror5 Mean
Relativeerror5
Healthcare practitioner and technicaloccupations –Continued
Not able to be leveled ........ $34.27 5.4% $33.61 5.8% $38.16 10.5%Dentists .............................................. 66.82 19.6 66.75 20.8 – –
Dentists, general ............................ 69.57 21.0 69.66 22.3 – –Dietitians and nutritionists ................. 23.37 3.9 23.23 4.1 24.58 3.3
Level 7 .............................. 21.23 6.5 20.40 8.1 24.15 3.6 Level 8 .............................. 23.03 6.6 21.82 7.3 26.69 6.0 Level 9 .............................. 25.00 7.9 25.02 8.0 – –
Optometrists ...................................... 51.61 8.2 52.78 10.5 – –Pharmacists ........................................ 46.93 2.1 49.09 .8 35.29 11.0
Level 8 .............................. 44.75 6.5 50.47 2.7 31.87 18.1 Level 9 .............................. 47.04 2.4 49.08 1.7 40.57 5.6 Level 10 ............................. 48.96 1.1 49.17 1.1 45.80 1.7 Level 11 ............................. 49.59 1.1 49.67 1.1 47.29 2.2 Level 12 ............................. 53.62 2.4 53.62 2.4 – –Not able to be leveled ........ 46.92 5.4 46.02 6.9 50.20 3.7
Physicians and surgeons .................... 79.07 15.5 78.24 16.6 94.58 17.0 Level 9 .............................. 22.15 3.7 22.15 3.7 – –Level 10 ............................. 19.72 8.8 19.72 8.8 – –Level 11 ............................. 132.96 35.5 133.96 35.2 – –Level 12 ............................. 87.40 7.7 85.80 7.0 118.80 16.8 Level 13 ............................. 77.99 5.4 77.68 5.8 85.04 7.0 Level 14 ............................. 103.75 12.4 94.34 10.0 – –Not able to be leveled ........ 57.84 11.5 55.97 14.0 71.71 3.9
Anesthesiologists ........................... 77.61 28.8 64.10 26.9 – –Family and general practitioners ... 121.69 27.9 121.50 29.3 – –
Level 12 ............................. 86.46 16.4 81.64 13.8 – –Level 13 ............................. 93.67 9.1 93.58 9.2 – –
Internists, general .......................... 69.52 20.0 69.52 20.7 – –Pediatricians, general ..................... 56.74 23.8 56.74 23.8 – –Psychiatrists ................................... 71.90 7.9 72.94 7.8 – –
Level 12 ............................. 72.43 2.8 72.48 2.9 – –Surgeons ........................................ 63.21 47.9 – – – –
Physician assistants ........................... 40.02 6.5 39.86 6.8 42.36 14.8 Level 9 .............................. 37.20 9.0 37.24 9.1 – –Level 10 ............................. 41.49 10.0 42.35 11.0 – –Level 11 ............................. 41.67 5.1 39.96 2.8 – –
Registered nurses ............................... 30.61 .8 30.42 .9 31.35 1.7 Level 5 .............................. 18.28 6.2 18.97 6.6 15.65 9.9 Level 6 .............................. 22.72 8.6 24.48 10.1 18.96 4.4 Level 7 .............................. 25.67 1.5 25.49 1.6 26.40 3.0 Level 8 .............................. 29.00 1.6 28.67 1.9 30.09 1.9 Level 9 .............................. 30.70 1.3 30.08 1.1 33.04 2.7
See footnotes at end of table.
NATIONAL COMPENSATION SURVEY
All United States 8-44 December 2006 - January 2008
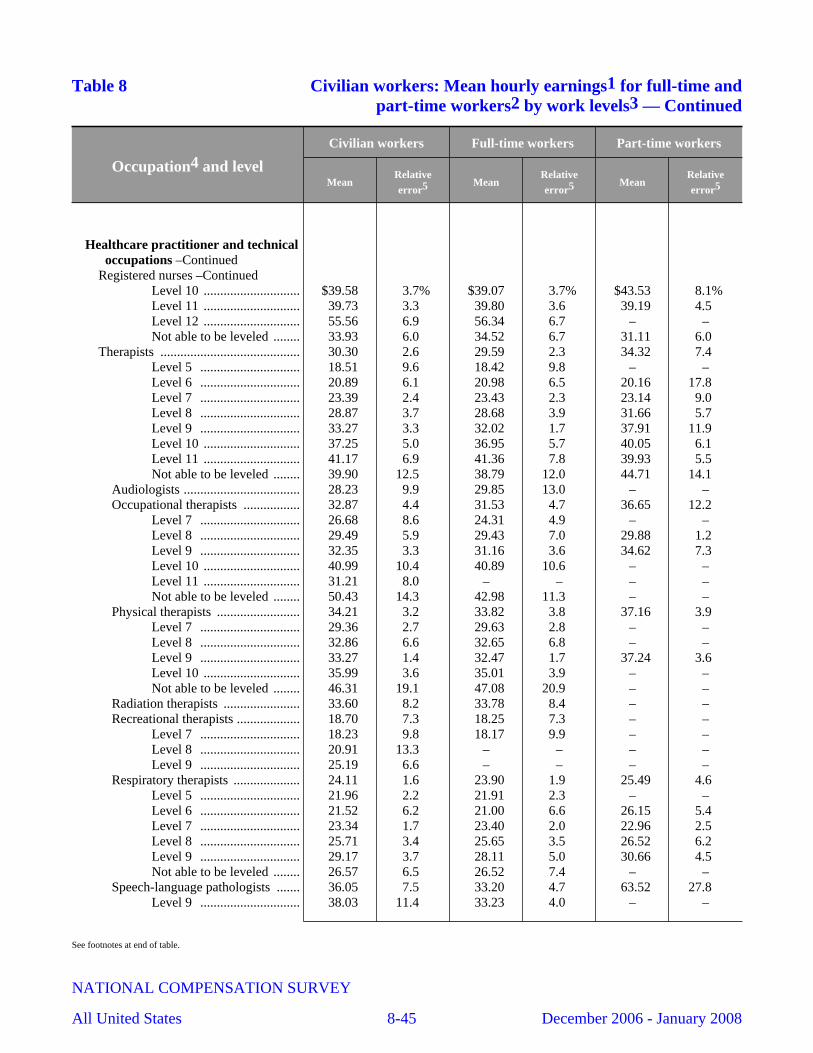
Table 8 Civilian workers: Mean hourly earnings1 for full-time andpart-time workers2 by work levels3 — Continued
Occupation4 and level
Civilian workers Full-time workers Part-time workers
MeanRelativeerror5 Mean
Relativeerror5 Mean
Relativeerror5
Healthcare practitioner and technicaloccupations –Continued
Registered nurses –ContinuedLevel 10 ............................. $39.58 3.7% $39.07 3.7% $43.53 8.1%Level 11 ............................. 39.73 3.3 39.80 3.6 39.19 4.5 Level 12 ............................. 55.56 6.9 56.34 6.7 – –Not able to be leveled ........ 33.93 6.0 34.52 6.7 31.11 6.0
Therapists .......................................... 30.30 2.6 29.59 2.3 34.32 7.4 Level 5 .............................. 18.51 9.6 18.42 9.8 – –Level 6 .............................. 20.89 6.1 20.98 6.5 20.16 17.8 Level 7 .............................. 23.39 2.4 23.43 2.3 23.14 9.0 Level 8 .............................. 28.87 3.7 28.68 3.9 31.66 5.7 Level 9 .............................. 33.27 3.3 32.02 1.7 37.91 11.9 Level 10 ............................. 37.25 5.0 36.95 5.7 40.05 6.1 Level 11 ............................. 41.17 6.9 41.36 7.8 39.93 5.5 Not able to be leveled ........ 39.90 12.5 38.79 12.0 44.71 14.1
Audiologists ................................... 28.23 9.9 29.85 13.0 – –Occupational therapists ................. 32.87 4.4 31.53 4.7 36.65 12.2
Level 7 .............................. 26.68 8.6 24.31 4.9 – –Level 8 .............................. 29.49 5.9 29.43 7.0 29.88 1.2 Level 9 .............................. 32.35 3.3 31.16 3.6 34.62 7.3 Level 10 ............................. 40.99 10.4 40.89 10.6 – –Level 11 ............................. 31.21 8.0 – – – –Not able to be leveled ........ 50.43 14.3 42.98 11.3 – –
Physical therapists ......................... 34.21 3.2 33.82 3.8 37.16 3.9 Level 7 .............................. 29.36 2.7 29.63 2.8 – –Level 8 .............................. 32.86 6.6 32.65 6.8 – –Level 9 .............................. 33.27 1.4 32.47 1.7 37.24 3.6 Level 10 ............................. 35.99 3.6 35.01 3.9 – –Not able to be leveled ........ 46.31 19.1 47.08 20.9 – –
Radiation therapists ....................... 33.60 8.2 33.78 8.4 – –Recreational therapists ................... 18.70 7.3 18.25 7.3 – –
Level 7 .............................. 18.23 9.8 18.17 9.9 – –Level 8 .............................. 20.91 13.3 – – – –Level 9 .............................. 25.19 6.6 – – – –
Respiratory therapists .................... 24.11 1.6 23.90 1.9 25.49 4.6 Level 5 .............................. 21.96 2.2 21.91 2.3 – –Level 6 .............................. 21.52 6.2 21.00 6.6 26.15 5.4 Level 7 .............................. 23.34 1.7 23.40 2.0 22.96 2.5 Level 8 .............................. 25.71 3.4 25.65 3.5 26.52 6.2 Level 9 .............................. 29.17 3.7 28.11 5.0 30.66 4.5 Not able to be leveled ........ 26.57 6.5 26.52 7.4 – –
Speech-language pathologists ....... 36.05 7.5 33.20 4.7 63.52 27.8 Level 9 .............................. 38.03 11.4 33.23 4.0 – –
See footnotes at end of table.
NATIONAL COMPENSATION SURVEY
All United States 8-45 December 2006 - January 2008
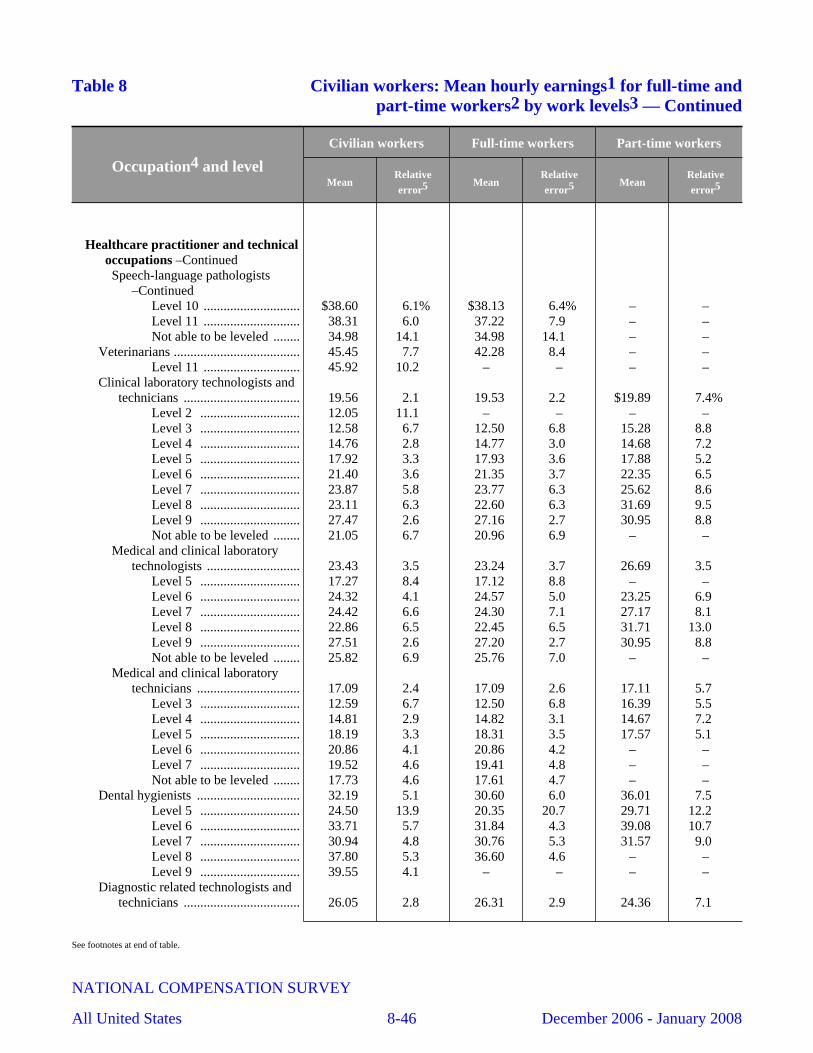
Table 8 Civilian workers: Mean hourly earnings1 for full-time andpart-time workers2 by work levels3 — Continued
Occupation4 and level
Civilian workers Full-time workers Part-time workers
MeanRelativeerror5 Mean
Relativeerror5 Mean
Relativeerror5
Healthcare practitioner and technicaloccupations –ContinuedSpeech-language pathologists
–ContinuedLevel 10 ............................. $38.60 6.1% $38.13 6.4% – –Level 11 ............................. 38.31 6.0 37.22 7.9 – –Not able to be leveled ........ 34.98 14.1 34.98 14.1 – –
Veterinarians ...................................... 45.45 7.7 42.28 8.4 – –Level 11 ............................. 45.92 10.2 – – – –
Clinical laboratory technologists andtechnicians ................................... 19.56 2.1 19.53 2.2 $19.89 7.4%
Level 2 .............................. 12.05 11.1 – – – –Level 3 .............................. 12.58 6.7 12.50 6.8 15.28 8.8 Level 4 .............................. 14.76 2.8 14.77 3.0 14.68 7.2 Level 5 .............................. 17.92 3.3 17.93 3.6 17.88 5.2 Level 6 .............................. 21.40 3.6 21.35 3.7 22.35 6.5 Level 7 .............................. 23.87 5.8 23.77 6.3 25.62 8.6 Level 8 .............................. 23.11 6.3 22.60 6.3 31.69 9.5 Level 9 .............................. 27.47 2.6 27.16 2.7 30.95 8.8 Not able to be leveled ........ 21.05 6.7 20.96 6.9 – –
Medical and clinical laboratorytechnologists ............................ 23.43 3.5 23.24 3.7 26.69 3.5
Level 5 .............................. 17.27 8.4 17.12 8.8 – –Level 6 .............................. 24.32 4.1 24.57 5.0 23.25 6.9 Level 7 .............................. 24.42 6.6 24.30 7.1 27.17 8.1 Level 8 .............................. 22.86 6.5 22.45 6.5 31.71 13.0 Level 9 .............................. 27.51 2.6 27.20 2.7 30.95 8.8 Not able to be leveled ........ 25.82 6.9 25.76 7.0 – –
Medical and clinical laboratorytechnicians ............................... 17.09 2.4 17.09 2.6 17.11 5.7
Level 3 .............................. 12.59 6.7 12.50 6.8 16.39 5.5 Level 4 .............................. 14.81 2.9 14.82 3.1 14.67 7.2 Level 5 .............................. 18.19 3.3 18.31 3.5 17.57 5.1 Level 6 .............................. 20.86 4.1 20.86 4.2 – –Level 7 .............................. 19.52 4.6 19.41 4.8 – –Not able to be leveled ........ 17.73 4.6 17.61 4.7 – –
Dental hygienists ............................... 32.19 5.1 30.60 6.0 36.01 7.5 Level 5 .............................. 24.50 13.9 20.35 20.7 29.71 12.2 Level 6 .............................. 33.71 5.7 31.84 4.3 39.08 10.7 Level 7 .............................. 30.94 4.8 30.76 5.3 31.57 9.0 Level 8 .............................. 37.80 5.3 36.60 4.6 – –Level 9 .............................. 39.55 4.1 – – – –
Diagnostic related technologists andtechnicians ................................... 26.05 2.8 26.31 2.9 24.36 7.1
See footnotes at end of table.
NATIONAL COMPENSATION SURVEY
All United States 8-46 December 2006 - January 2008

Table 8 Civilian workers: Mean hourly earnings1 for full-time andpart-time workers2 by work levels3 — Continued
Occupation4 and level
Civilian workers Full-time workers Part-time workers
MeanRelativeerror5 Mean
Relativeerror5 Mean
Relativeerror5
Healthcare practitioner and technicaloccupations –Continued
Diagnostic related technologists andtechnicians –Continued
Level 3 .............................. $12.39 7.1% $10.93 4.3% – –Level 4 .............................. 13.74 5.3 14.30 4.9 $12.00 11.1%Level 5 .............................. 22.64 5.8 21.64 6.2 29.82 13.5 Level 6 .............................. 23.51 3.1 23.64 3.1 22.88 6.4 Level 7 .............................. 28.55 5.5 28.99 5.9 24.47 7.6 Level 8 .............................. 30.50 3.1 30.34 3.9 31.87 7.7 Level 9 .............................. 34.15 6.0 34.18 6.0 – –Not able to be leveled ........ 28.48 7.8 27.95 8.9 31.04 13.0
Cardiovascular technologists andtechnicians ............................... 23.60 9.6 24.99 10.3 17.09 12.4
Level 3 .............................. 12.39 7.2 – – – –Level 4 .............................. 13.27 5.8 13.27 4.3 – –Level 5 .............................. 23.39 9.3 23.25 10.0 – –Level 6 .............................. 22.21 7.6 – – – –Level 7 .............................. 34.56 10.6 34.83 11.8 – –Level 8 .............................. 30.24 16.1 30.24 16.1 – –Not able to be leveled ........ 21.26 23.6 21.77 26.2 – –
Diagnostic medical sonographers .. 32.66 4.7 31.81 4.3 – –Level 7 .............................. 33.65 5.6 33.78 5.8 – –
Nuclear medicine technologists ..... 34.10 6.9 34.26 6.8 – –Radiologic technologists and
technicians ............................... 25.43 2.4 25.50 2.5 25.02 6.6 Level 4 .............................. 14.39 10.0 – – – –Level 5 .............................. 21.34 5.8 21.14 6.4 23.35 5.7 Level 6 .............................. 23.08 3.8 23.21 3.7 22.50 7.5 Level 7 .............................. 26.60 3.6 26.97 3.8 23.64 7.1 Level 8 .............................. 30.73 3.3 30.51 4.4 32.52 8.5 Level 9 .............................. 33.02 5.1 33.10 5.0 – –Not able to be leveled ........ 28.83 7.1 27.84 7.5 32.50 11.8
Emergency medical technicians andparamedics ................................... 15.57 4.3 15.84 5.4 14.22 5.9
Level 4 .............................. 11.43 6.2 10.69 4.3 12.92 7.6 Level 5 .............................. 14.76 5.2 15.11 6.0 12.61 7.6 Level 6 .............................. 17.32 8.5 17.25 9.5 17.93 7.4 Level 7 .............................. 20.52 5.5 20.69 5.4 – –Level 8 .............................. 13.92 16.8 – – – –Not able to be leveled ........ 17.70 2.4 – – – –
Health diagnosing and treatingpractitioner support technicians ... 15.91 1.9 16.29 2.4 14.25 4.5
Level 2 .............................. 10.97 6.7 – – – –
See footnotes at end of table.
NATIONAL COMPENSATION SURVEY
All United States 8-47 December 2006 - January 2008
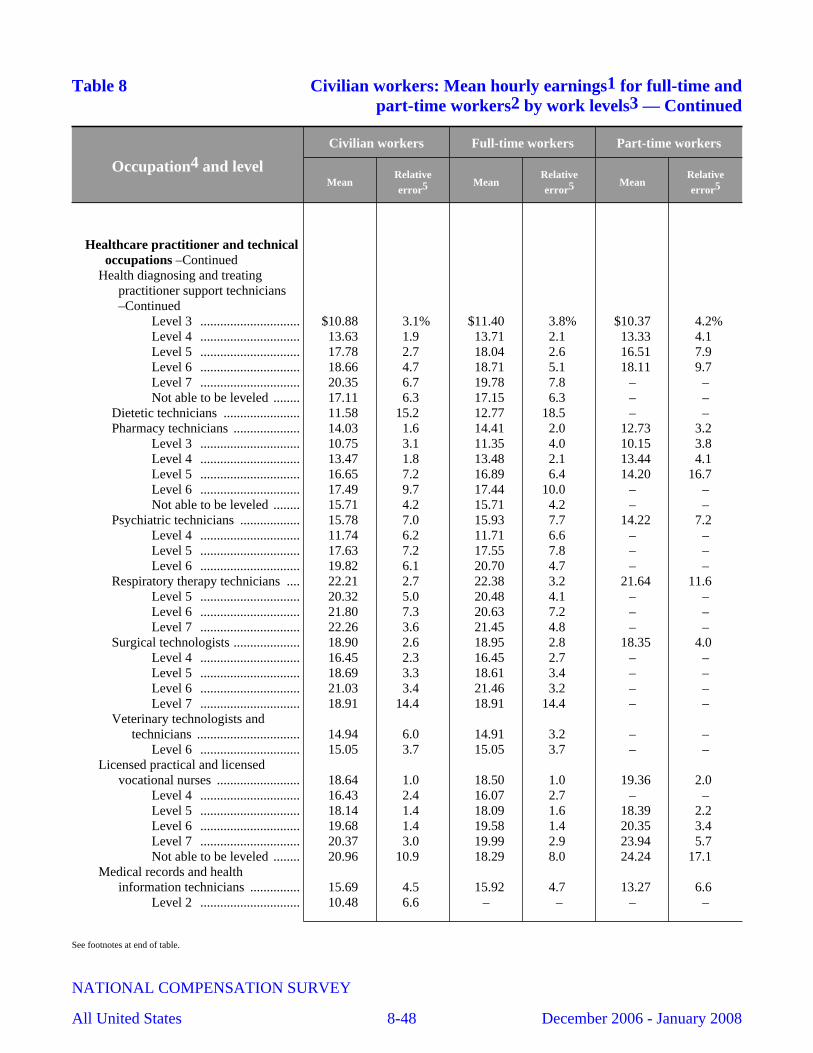
Table 8 Civilian workers: Mean hourly earnings1 for full-time andpart-time workers2 by work levels3 — Continued
Occupation4 and level
Civilian workers Full-time workers Part-time workers
MeanRelativeerror5 Mean
Relativeerror5 Mean
Relativeerror5
Healthcare practitioner and technicaloccupations –Continued
Health diagnosing and treatingpractitioner support technicians–Continued
Level 3 .............................. $10.88 3.1% $11.40 3.8% $10.37 4.2%Level 4 .............................. 13.63 1.9 13.71 2.1 13.33 4.1 Level 5 .............................. 17.78 2.7 18.04 2.6 16.51 7.9 Level 6 .............................. 18.66 4.7 18.71 5.1 18.11 9.7 Level 7 .............................. 20.35 6.7 19.78 7.8 – –Not able to be leveled ........ 17.11 6.3 17.15 6.3 – –
Dietetic technicians ....................... 11.58 15.2 12.77 18.5 – –Pharmacy technicians .................... 14.03 1.6 14.41 2.0 12.73 3.2
Level 3 .............................. 10.75 3.1 11.35 4.0 10.15 3.8 Level 4 .............................. 13.47 1.8 13.48 2.1 13.44 4.1 Level 5 .............................. 16.65 7.2 16.89 6.4 14.20 16.7 Level 6 .............................. 17.49 9.7 17.44 10.0 – –Not able to be leveled ........ 15.71 4.2 15.71 4.2 – –
Psychiatric technicians .................. 15.78 7.0 15.93 7.7 14.22 7.2 Level 4 .............................. 11.74 6.2 11.71 6.6 – –Level 5 .............................. 17.63 7.2 17.55 7.8 – –Level 6 .............................. 19.82 6.1 20.70 4.7 – –
Respiratory therapy technicians .... 22.21 2.7 22.38 3.2 21.64 11.6 Level 5 .............................. 20.32 5.0 20.48 4.1 – –Level 6 .............................. 21.80 7.3 20.63 7.2 – –Level 7 .............................. 22.26 3.6 21.45 4.8 – –
Surgical technologists .................... 18.90 2.6 18.95 2.8 18.35 4.0 Level 4 .............................. 16.45 2.3 16.45 2.7 – –Level 5 .............................. 18.69 3.3 18.61 3.4 – –Level 6 .............................. 21.03 3.4 21.46 3.2 – –Level 7 .............................. 18.91 14.4 18.91 14.4 – –
Veterinary technologists andtechnicians ............................... 14.94 6.0 14.91 3.2 – –
Level 6 .............................. 15.05 3.7 15.05 3.7 – –Licensed practical and licensed
vocational nurses ......................... 18.64 1.0 18.50 1.0 19.36 2.0 Level 4 .............................. 16.43 2.4 16.07 2.7 – –Level 5 .............................. 18.14 1.4 18.09 1.6 18.39 2.2 Level 6 .............................. 19.68 1.4 19.58 1.4 20.35 3.4 Level 7 .............................. 20.37 3.0 19.99 2.9 23.94 5.7 Not able to be leveled ........ 20.96 10.9 18.29 8.0 24.24 17.1
Medical records and healthinformation technicians ............... 15.69 4.5 15.92 4.7 13.27 6.6
Level 2 .............................. 10.48 6.6 – – – –
See footnotes at end of table.
NATIONAL COMPENSATION SURVEY
All United States 8-48 December 2006 - January 2008
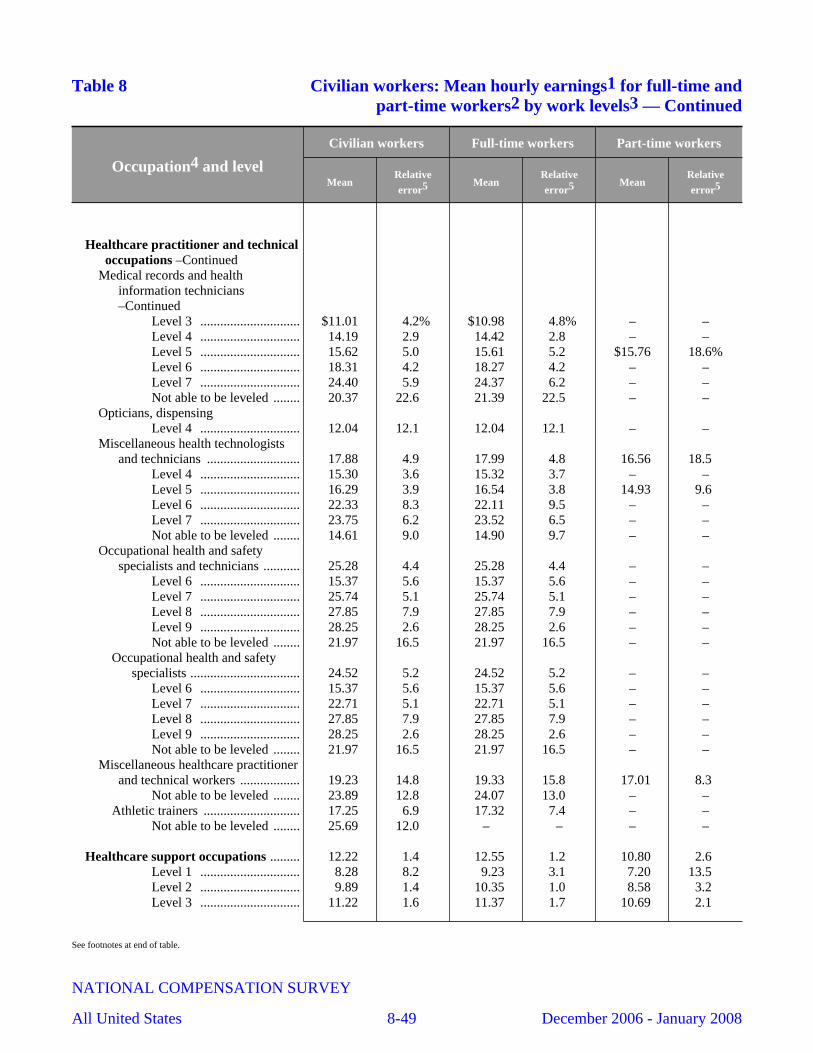
Table 8 Civilian workers: Mean hourly earnings1 for full-time andpart-time workers2 by work levels3 — Continued
Occupation4 and level
Civilian workers Full-time workers Part-time workers
MeanRelativeerror5 Mean
Relativeerror5 Mean
Relativeerror5
Healthcare practitioner and technicaloccupations –Continued
Medical records and healthinformation technicians–Continued
Level 3 .............................. $11.01 4.2% $10.98 4.8% – –Level 4 .............................. 14.19 2.9 14.42 2.8 – –Level 5 .............................. 15.62 5.0 15.61 5.2 $15.76 18.6%Level 6 .............................. 18.31 4.2 18.27 4.2 – –Level 7 .............................. 24.40 5.9 24.37 6.2 – –Not able to be leveled ........ 20.37 22.6 21.39 22.5 – –
Opticians, dispensingLevel 4 .............................. 12.04 12.1 12.04 12.1 – –
Miscellaneous health technologistsand technicians ............................ 17.88 4.9 17.99 4.8 16.56 18.5
Level 4 .............................. 15.30 3.6 15.32 3.7 – –Level 5 .............................. 16.29 3.9 16.54 3.8 14.93 9.6 Level 6 .............................. 22.33 8.3 22.11 9.5 – –Level 7 .............................. 23.75 6.2 23.52 6.5 – –Not able to be leveled ........ 14.61 9.0 14.90 9.7 – –
Occupational health and safetyspecialists and technicians ........... 25.28 4.4 25.28 4.4 – –
Level 6 .............................. 15.37 5.6 15.37 5.6 – –Level 7 .............................. 25.74 5.1 25.74 5.1 – –Level 8 .............................. 27.85 7.9 27.85 7.9 – –Level 9 .............................. 28.25 2.6 28.25 2.6 – –Not able to be leveled ........ 21.97 16.5 21.97 16.5 – –
Occupational health and safetyspecialists ................................. 24.52 5.2 24.52 5.2 – –
Level 6 .............................. 15.37 5.6 15.37 5.6 – –Level 7 .............................. 22.71 5.1 22.71 5.1 – –Level 8 .............................. 27.85 7.9 27.85 7.9 – –Level 9 .............................. 28.25 2.6 28.25 2.6 – –Not able to be leveled ........ 21.97 16.5 21.97 16.5 – –
Miscellaneous healthcare practitionerand technical workers .................. 19.23 14.8 19.33 15.8 17.01 8.3
Not able to be leveled ........ 23.89 12.8 24.07 13.0 – –Athletic trainers ............................. 17.25 6.9 17.32 7.4 – –
Not able to be leveled ........ 25.69 12.0 – – – –
Healthcare support occupations ......... 12.22 1.4 12.55 1.2 10.80 2.6 Level 1 .............................. 8.28 8.2 9.23 3.1 7.20 13.5 Level 2 .............................. 9.89 1.4 10.35 1.0 8.58 3.2 Level 3 .............................. 11.22 1.6 11.37 1.7 10.69 2.1
See footnotes at end of table.
NATIONAL COMPENSATION SURVEY
All United States 8-49 December 2006 - January 2008
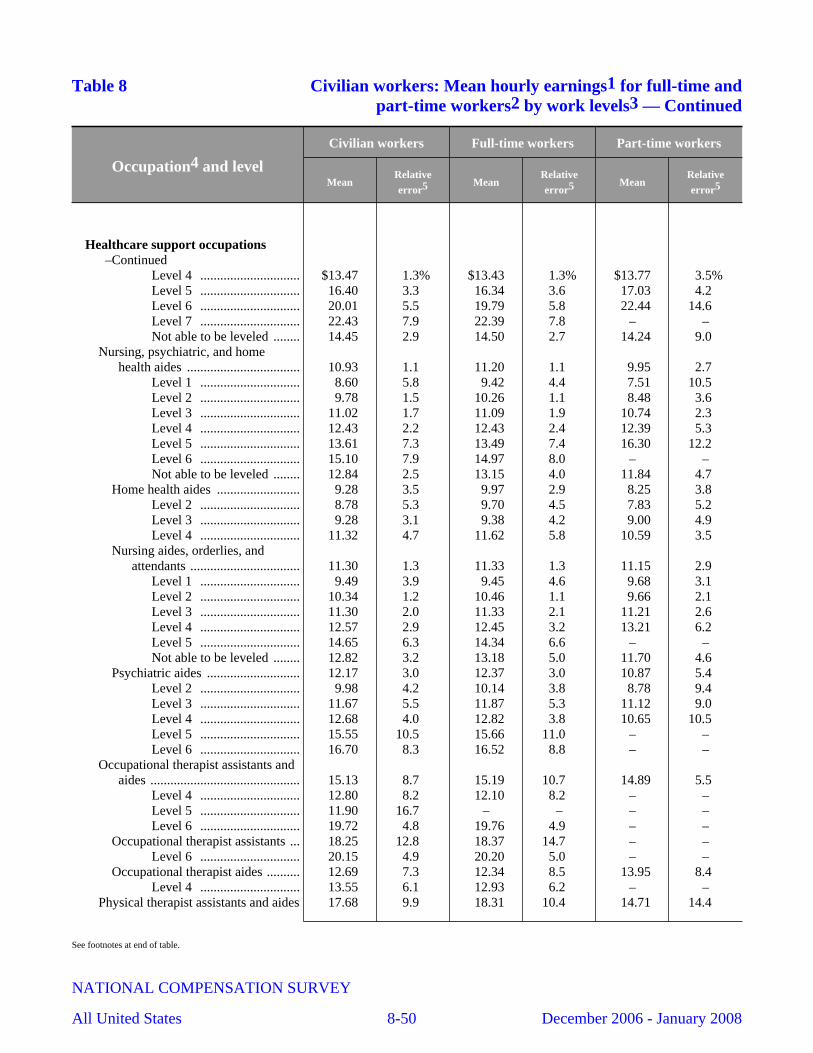
Table 8 Civilian workers: Mean hourly earnings1 for full-time andpart-time workers2 by work levels3 — Continued
Occupation4 and level
Civilian workers Full-time workers Part-time workers
MeanRelativeerror5 Mean
Relativeerror5 Mean
Relativeerror5
Healthcare support occupations–Continued
Level 4 .............................. $13.47 1.3% $13.43 1.3% $13.77 3.5%Level 5 .............................. 16.40 3.3 16.34 3.6 17.03 4.2 Level 6 .............................. 20.01 5.5 19.79 5.8 22.44 14.6 Level 7 .............................. 22.43 7.9 22.39 7.8 – –Not able to be leveled ........ 14.45 2.9 14.50 2.7 14.24 9.0
Nursing, psychiatric, and homehealth aides .................................. 10.93 1.1 11.20 1.1 9.95 2.7
Level 1 .............................. 8.60 5.8 9.42 4.4 7.51 10.5 Level 2 .............................. 9.78 1.5 10.26 1.1 8.48 3.6 Level 3 .............................. 11.02 1.7 11.09 1.9 10.74 2.3 Level 4 .............................. 12.43 2.2 12.43 2.4 12.39 5.3 Level 5 .............................. 13.61 7.3 13.49 7.4 16.30 12.2 Level 6 .............................. 15.10 7.9 14.97 8.0 – –Not able to be leveled ........ 12.84 2.5 13.15 4.0 11.84 4.7
Home health aides ......................... 9.28 3.5 9.97 2.9 8.25 3.8 Level 2 .............................. 8.78 5.3 9.70 4.5 7.83 5.2 Level 3 .............................. 9.28 3.1 9.38 4.2 9.00 4.9 Level 4 .............................. 11.32 4.7 11.62 5.8 10.59 3.5
Nursing aides, orderlies, andattendants ................................. 11.30 1.3 11.33 1.3 11.15 2.9
Level 1 .............................. 9.49 3.9 9.45 4.6 9.68 3.1 Level 2 .............................. 10.34 1.2 10.46 1.1 9.66 2.1 Level 3 .............................. 11.30 2.0 11.33 2.1 11.21 2.6 Level 4 .............................. 12.57 2.9 12.45 3.2 13.21 6.2 Level 5 .............................. 14.65 6.3 14.34 6.6 – –Not able to be leveled ........ 12.82 3.2 13.18 5.0 11.70 4.6
Psychiatric aides ............................ 12.17 3.0 12.37 3.0 10.87 5.4 Level 2 .............................. 9.98 4.2 10.14 3.8 8.78 9.4 Level 3 .............................. 11.67 5.5 11.87 5.3 11.12 9.0 Level 4 .............................. 12.68 4.0 12.82 3.8 10.65 10.5 Level 5 .............................. 15.55 10.5 15.66 11.0 – –Level 6 .............................. 16.70 8.3 16.52 8.8 – –
Occupational therapist assistants andaides ............................................. 15.13 8.7 15.19 10.7 14.89 5.5
Level 4 .............................. 12.80 8.2 12.10 8.2 – –Level 5 .............................. 11.90 16.7 – – – –Level 6 .............................. 19.72 4.8 19.76 4.9 – –
Occupational therapist assistants ... 18.25 12.8 18.37 14.7 – –Level 6 .............................. 20.15 4.9 20.20 5.0 – –
Occupational therapist aides .......... 12.69 7.3 12.34 8.5 13.95 8.4 Level 4 .............................. 13.55 6.1 12.93 6.2 – –
Physical therapist assistants and aides 17.68 9.9 18.31 10.4 14.71 14.4
See footnotes at end of table.
NATIONAL COMPENSATION SURVEY
All United States 8-50 December 2006 - January 2008

Table 8 Civilian workers: Mean hourly earnings1 for full-time andpart-time workers2 by work levels3 — Continued
Occupation4 and level
Civilian workers Full-time workers Part-time workers
MeanRelativeerror5 Mean
Relativeerror5 Mean
Relativeerror5
Healthcare support occupations–Continued
Physical therapist assistants and aides–Continued
Level 2 .............................. $12.92 16.9% $14.25 22.0% $10.17 3.1%Level 3 .............................. 11.25 9.7 11.45 10.1 – –Level 4 .............................. 12.13 8.7 11.70 8.5 12.95 18.2 Level 5 .............................. 17.95 5.7 17.64 6.5 – –Level 6 .............................. 29.75 6.4 – – – –Level 7 .............................. 22.82 12.4 22.81 12.4 – –
Physical therapist assistants ........... 22.82 12.0 24.10 8.8 17.04 25.3 Level 4 .............................. – – 15.97 11.6 – –Level 5 .............................. 17.95 5.7 17.64 6.5 – –Level 6 .............................. 29.77 6.4 – – – –Level 7 .............................. 22.82 12.4 22.81 12.4 – –
Physical therapist aides .................. 12.03 5.7 12.04 6.6 11.95 9.8 Level 2 .............................. 12.97 17.1 14.25 22.0 10.16 3.3 Level 3 .............................. 11.20 9.9 11.40 10.3 – –Level 4 .............................. 12.03 8.8 11.29 8.3 – –
Massage therapists ............................. 20.78 13.4 21.35 16.7 19.84 20.3 Level 5 .............................. 21.55 29.1 – – – –
Miscellaneous healthcare supportoccupations .................................. 13.88 1.7 14.15 1.6 12.27 5.1
Level 1 .............................. 7.84 11.5 8.91 4.4 – –Level 2 .............................. 10.22 3.4 10.51 3.7 9.09 6.9 Level 3 .............................. 11.88 3.5 12.39 4.0 10.59 4.3 Level 4 .............................. 14.27 1.5 14.14 1.7 15.88 2.8 Level 5 .............................. 17.21 2.1 17.24 2.3 16.92 3.9 Level 6 .............................. 19.01 3.7 19.12 4.0 – –Level 7 .............................. 22.25 5.8 22.25 5.8 – –Not able to be leveled ........ 16.04 5.0 15.62 5.5 19.04 19.0
Dental assistants ............................ 16.48 2.6 16.71 2.7 14.10 9.3 Level 3 .............................. 15.24 7.5 16.44 5.9 11.52 9.2 Level 4 .............................. 16.17 2.9 16.15 3.1 16.43 9.6 Level 5 .............................. 18.79 4.6 18.81 4.7 – –Level 6 .............................. 19.62 4.9 19.62 4.9 – –
Medical assistants .......................... 13.48 2.6 13.46 2.4 13.78 7.2 Level 2 .............................. 10.58 5.3 10.64 5.7 – –Level 3 .............................. 11.00 3.1 11.03 2.8 10.81 18.8 Level 4 .............................. 13.75 3.0 13.65 3.2 15.42 3.7 Level 5 .............................. 16.84 4.0 16.81 4.3 – –Level 6 .............................. 17.82 7.8 – – – –Not able to be leveled ........ 14.58 4.3 14.67 4.9 – –
Medical equipment preparers ........ 14.13 3.9 14.16 4.2 13.95 8.7
See footnotes at end of table.
NATIONAL COMPENSATION SURVEY
All United States 8-51 December 2006 - January 2008
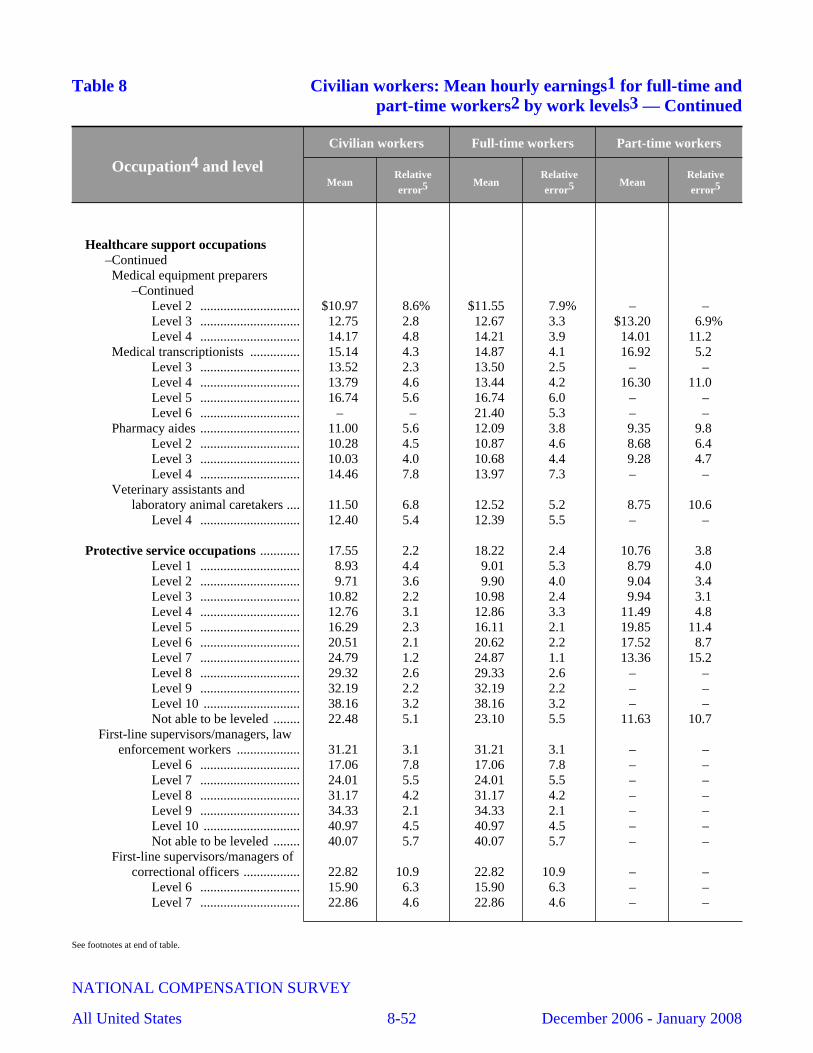
Table 8 Civilian workers: Mean hourly earnings1 for full-time andpart-time workers2 by work levels3 — Continued
Occupation4 and level
Civilian workers Full-time workers Part-time workers
MeanRelativeerror5 Mean
Relativeerror5 Mean
Relativeerror5
Healthcare support occupations–ContinuedMedical equipment preparers
–ContinuedLevel 2 .............................. $10.97 8.6% $11.55 7.9% – –Level 3 .............................. 12.75 2.8 12.67 3.3 $13.20 6.9%Level 4 .............................. 14.17 4.8 14.21 3.9 14.01 11.2
Medical transcriptionists ............... 15.14 4.3 14.87 4.1 16.92 5.2 Level 3 .............................. 13.52 2.3 13.50 2.5 – –Level 4 .............................. 13.79 4.6 13.44 4.2 16.30 11.0 Level 5 .............................. 16.74 5.6 16.74 6.0 – –Level 6 .............................. – – 21.40 5.3 – –
Pharmacy aides .............................. 11.00 5.6 12.09 3.8 9.35 9.8 Level 2 .............................. 10.28 4.5 10.87 4.6 8.68 6.4 Level 3 .............................. 10.03 4.0 10.68 4.4 9.28 4.7 Level 4 .............................. 14.46 7.8 13.97 7.3 – –
Veterinary assistants andlaboratory animal caretakers .... 11.50 6.8 12.52 5.2 8.75 10.6
Level 4 .............................. 12.40 5.4 12.39 5.5 – –
Protective service occupations ............ 17.55 2.2 18.22 2.4 10.76 3.8 Level 1 .............................. 8.93 4.4 9.01 5.3 8.79 4.0 Level 2 .............................. 9.71 3.6 9.90 4.0 9.04 3.4 Level 3 .............................. 10.82 2.2 10.98 2.4 9.94 3.1 Level 4 .............................. 12.76 3.1 12.86 3.3 11.49 4.8 Level 5 .............................. 16.29 2.3 16.11 2.1 19.85 11.4 Level 6 .............................. 20.51 2.1 20.62 2.2 17.52 8.7 Level 7 .............................. 24.79 1.2 24.87 1.1 13.36 15.2 Level 8 .............................. 29.32 2.6 29.33 2.6 – –Level 9 .............................. 32.19 2.2 32.19 2.2 – –Level 10 ............................. 38.16 3.2 38.16 3.2 – –Not able to be leveled ........ 22.48 5.1 23.10 5.5 11.63 10.7
First-line supervisors/managers, lawenforcement workers ................... 31.21 3.1 31.21 3.1 – –
Level 6 .............................. 17.06 7.8 17.06 7.8 – –Level 7 .............................. 24.01 5.5 24.01 5.5 – –Level 8 .............................. 31.17 4.2 31.17 4.2 – –Level 9 .............................. 34.33 2.1 34.33 2.1 – –Level 10 ............................. 40.97 4.5 40.97 4.5 – –Not able to be leveled ........ 40.07 5.7 40.07 5.7 – –
First-line supervisors/managers ofcorrectional officers ................. 22.82 10.9 22.82 10.9 – –
Level 6 .............................. 15.90 6.3 15.90 6.3 – –Level 7 .............................. 22.86 4.6 22.86 4.6 – –
See footnotes at end of table.
NATIONAL COMPENSATION SURVEY
All United States 8-52 December 2006 - January 2008
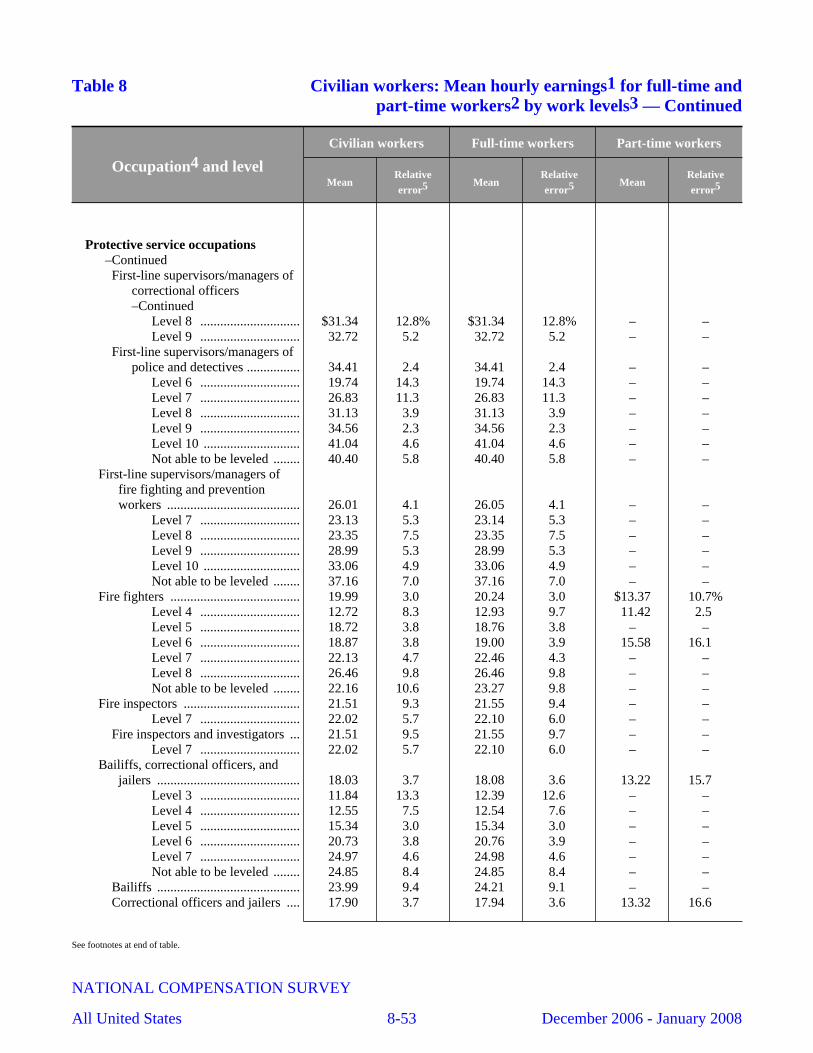
Table 8 Civilian workers: Mean hourly earnings1 for full-time andpart-time workers2 by work levels3 — Continued
Occupation4 and level
Civilian workers Full-time workers Part-time workers
MeanRelativeerror5 Mean
Relativeerror5 Mean
Relativeerror5
Protective service occupations–ContinuedFirst-line supervisors/managers of
correctional officers–Continued
Level 8 .............................. $31.34 12.8% $31.34 12.8% – –Level 9 .............................. 32.72 5.2 32.72 5.2 – –
First-line supervisors/managers ofpolice and detectives ................ 34.41 2.4 34.41 2.4 – –
Level 6 .............................. 19.74 14.3 19.74 14.3 – –Level 7 .............................. 26.83 11.3 26.83 11.3 – –Level 8 .............................. 31.13 3.9 31.13 3.9 – –Level 9 .............................. 34.56 2.3 34.56 2.3 – –Level 10 ............................. 41.04 4.6 41.04 4.6 – –Not able to be leveled ........ 40.40 5.8 40.40 5.8 – –
First-line supervisors/managers offire fighting and preventionworkers ........................................ 26.01 4.1 26.05 4.1 – –
Level 7 .............................. 23.13 5.3 23.14 5.3 – –Level 8 .............................. 23.35 7.5 23.35 7.5 – –Level 9 .............................. 28.99 5.3 28.99 5.3 – –Level 10 ............................. 33.06 4.9 33.06 4.9 – –Not able to be leveled ........ 37.16 7.0 37.16 7.0 – –
Fire fighters ....................................... 19.99 3.0 20.24 3.0 $13.37 10.7%Level 4 .............................. 12.72 8.3 12.93 9.7 11.42 2.5 Level 5 .............................. 18.72 3.8 18.76 3.8 – –Level 6 .............................. 18.87 3.8 19.00 3.9 15.58 16.1 Level 7 .............................. 22.13 4.7 22.46 4.3 – –Level 8 .............................. 26.46 9.8 26.46 9.8 – –Not able to be leveled ........ 22.16 10.6 23.27 9.8 – –
Fire inspectors ................................... 21.51 9.3 21.55 9.4 – –Level 7 .............................. 22.02 5.7 22.10 6.0 – –
Fire inspectors and investigators ... 21.51 9.5 21.55 9.7 – –Level 7 .............................. 22.02 5.7 22.10 6.0 – –
Bailiffs, correctional officers, andjailers ........................................... 18.03 3.7 18.08 3.6 13.22 15.7
Level 3 .............................. 11.84 13.3 12.39 12.6 – –Level 4 .............................. 12.55 7.5 12.54 7.6 – –Level 5 .............................. 15.34 3.0 15.34 3.0 – –Level 6 .............................. 20.73 3.8 20.76 3.9 – –Level 7 .............................. 24.97 4.6 24.98 4.6 – –Not able to be leveled ........ 24.85 8.4 24.85 8.4 – –
Bailiffs ........................................... 23.99 9.4 24.21 9.1 – –Correctional officers and jailers .... 17.90 3.7 17.94 3.6 13.32 16.6
See footnotes at end of table.
NATIONAL COMPENSATION SURVEY
All United States 8-53 December 2006 - January 2008
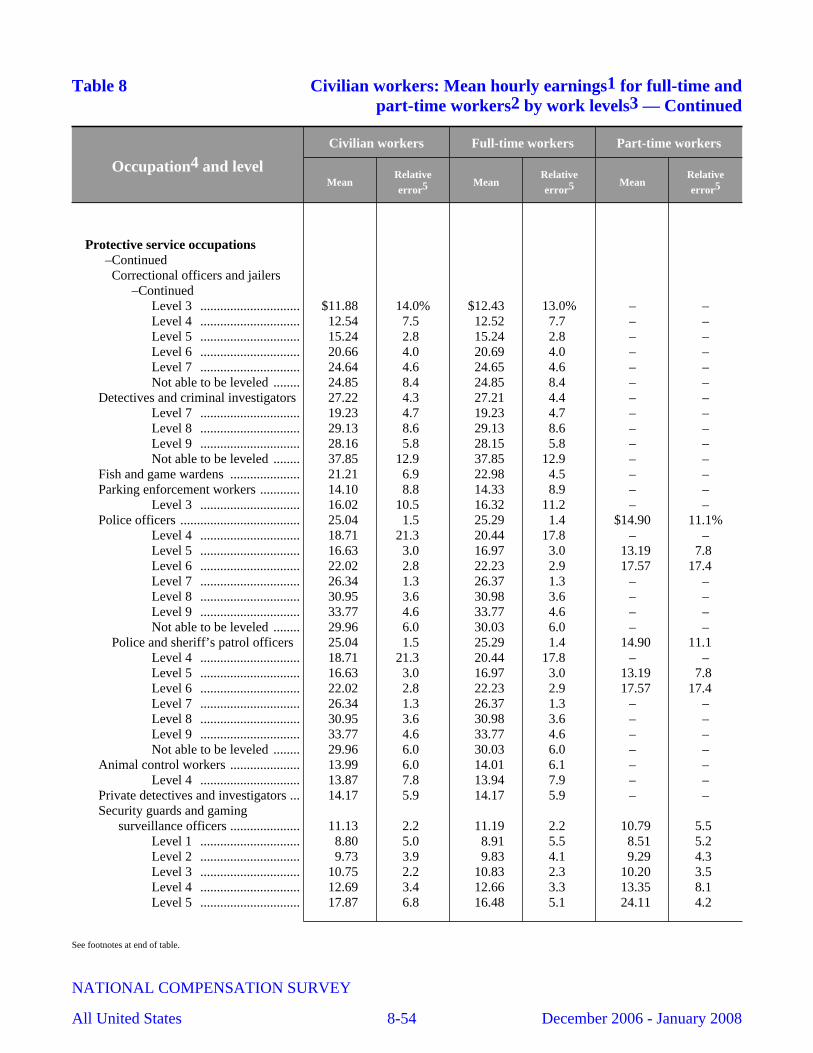
Table 8 Civilian workers: Mean hourly earnings1 for full-time andpart-time workers2 by work levels3 — Continued
Occupation4 and level
Civilian workers Full-time workers Part-time workers
MeanRelativeerror5 Mean
Relativeerror5 Mean
Relativeerror5
Protective service occupations–ContinuedCorrectional officers and jailers
–ContinuedLevel 3 .............................. $11.88 14.0% $12.43 13.0% – –Level 4 .............................. 12.54 7.5 12.52 7.7 – –Level 5 .............................. 15.24 2.8 15.24 2.8 – –Level 6 .............................. 20.66 4.0 20.69 4.0 – –Level 7 .............................. 24.64 4.6 24.65 4.6 – –Not able to be leveled ........ 24.85 8.4 24.85 8.4 – –
Detectives and criminal investigators 27.22 4.3 27.21 4.4 – –Level 7 .............................. 19.23 4.7 19.23 4.7 – –Level 8 .............................. 29.13 8.6 29.13 8.6 – –Level 9 .............................. 28.16 5.8 28.15 5.8 – –Not able to be leveled ........ 37.85 12.9 37.85 12.9 – –
Fish and game wardens ..................... 21.21 6.9 22.98 4.5 – –Parking enforcement workers ............ 14.10 8.8 14.33 8.9 – –
Level 3 .............................. 16.02 10.5 16.32 11.2 – –Police officers .................................... 25.04 1.5 25.29 1.4 $14.90 11.1%
Level 4 .............................. 18.71 21.3 20.44 17.8 – –Level 5 .............................. 16.63 3.0 16.97 3.0 13.19 7.8 Level 6 .............................. 22.02 2.8 22.23 2.9 17.57 17.4 Level 7 .............................. 26.34 1.3 26.37 1.3 – –Level 8 .............................. 30.95 3.6 30.98 3.6 – –Level 9 .............................. 33.77 4.6 33.77 4.6 – –Not able to be leveled ........ 29.96 6.0 30.03 6.0 – –
Police and sheriff’s patrol officers 25.04 1.5 25.29 1.4 14.90 11.1 Level 4 .............................. 18.71 21.3 20.44 17.8 – –Level 5 .............................. 16.63 3.0 16.97 3.0 13.19 7.8 Level 6 .............................. 22.02 2.8 22.23 2.9 17.57 17.4 Level 7 .............................. 26.34 1.3 26.37 1.3 – –Level 8 .............................. 30.95 3.6 30.98 3.6 – –Level 9 .............................. 33.77 4.6 33.77 4.6 – –Not able to be leveled ........ 29.96 6.0 30.03 6.0 – –
Animal control workers ..................... 13.99 6.0 14.01 6.1 – –Level 4 .............................. 13.87 7.8 13.94 7.9 – –
Private detectives and investigators ... 14.17 5.9 14.17 5.9 – –Security guards and gaming
surveillance officers ..................... 11.13 2.2 11.19 2.2 10.79 5.5 Level 1 .............................. 8.80 5.0 8.91 5.5 8.51 5.2 Level 2 .............................. 9.73 3.9 9.83 4.1 9.29 4.3 Level 3 .............................. 10.75 2.2 10.83 2.3 10.20 3.5 Level 4 .............................. 12.69 3.4 12.66 3.3 13.35 8.1 Level 5 .............................. 17.87 6.8 16.48 5.1 24.11 4.2
See footnotes at end of table.
NATIONAL COMPENSATION SURVEY
All United States 8-54 December 2006 - January 2008
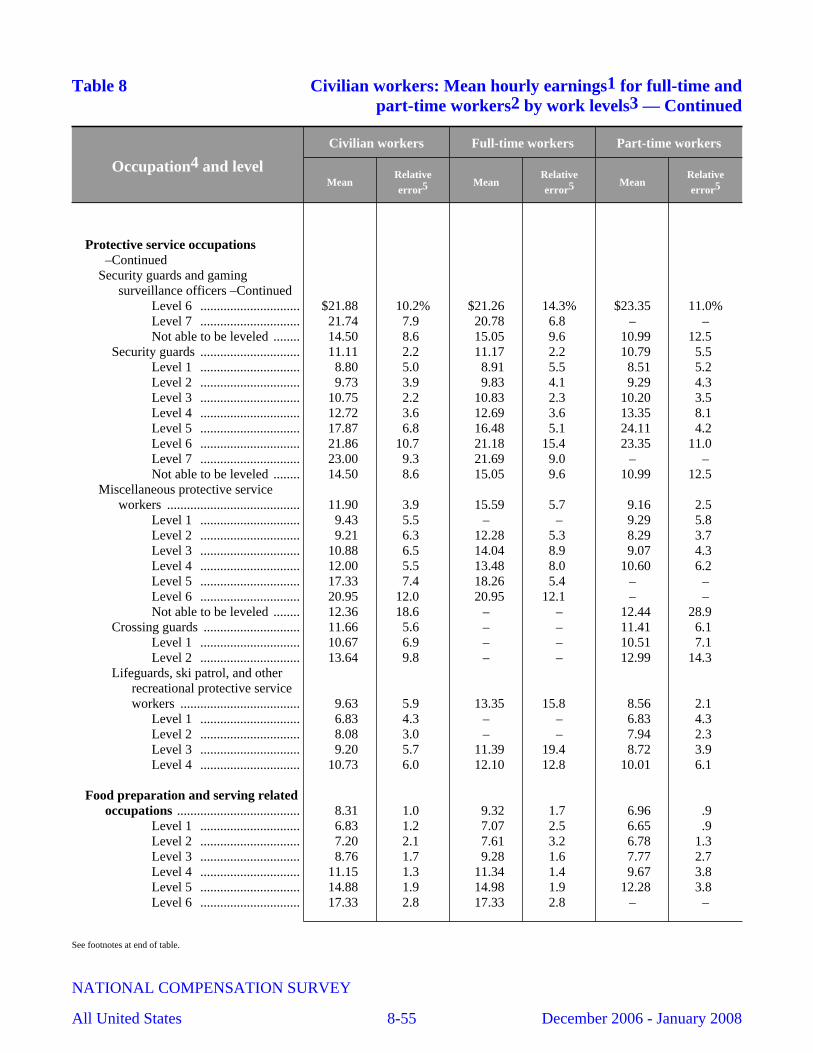
Table 8 Civilian workers: Mean hourly earnings1 for full-time andpart-time workers2 by work levels3 — Continued
Occupation4 and level
Civilian workers Full-time workers Part-time workers
MeanRelativeerror5 Mean
Relativeerror5 Mean
Relativeerror5
Protective service occupations–Continued
Security guards and gamingsurveillance officers –Continued
Level 6 .............................. $21.88 10.2% $21.26 14.3% $23.35 11.0%Level 7 .............................. 21.74 7.9 20.78 6.8 – –Not able to be leveled ........ 14.50 8.6 15.05 9.6 10.99 12.5
Security guards .............................. 11.11 2.2 11.17 2.2 10.79 5.5 Level 1 .............................. 8.80 5.0 8.91 5.5 8.51 5.2 Level 2 .............................. 9.73 3.9 9.83 4.1 9.29 4.3 Level 3 .............................. 10.75 2.2 10.83 2.3 10.20 3.5 Level 4 .............................. 12.72 3.6 12.69 3.6 13.35 8.1 Level 5 .............................. 17.87 6.8 16.48 5.1 24.11 4.2 Level 6 .............................. 21.86 10.7 21.18 15.4 23.35 11.0 Level 7 .............................. 23.00 9.3 21.69 9.0 – –Not able to be leveled ........ 14.50 8.6 15.05 9.6 10.99 12.5
Miscellaneous protective serviceworkers ........................................ 11.90 3.9 15.59 5.7 9.16 2.5
Level 1 .............................. 9.43 5.5 – – 9.29 5.8 Level 2 .............................. 9.21 6.3 12.28 5.3 8.29 3.7 Level 3 .............................. 10.88 6.5 14.04 8.9 9.07 4.3 Level 4 .............................. 12.00 5.5 13.48 8.0 10.60 6.2 Level 5 .............................. 17.33 7.4 18.26 5.4 – –Level 6 .............................. 20.95 12.0 20.95 12.1 – –Not able to be leveled ........ 12.36 18.6 – – 12.44 28.9
Crossing guards ............................. 11.66 5.6 – – 11.41 6.1 Level 1 .............................. 10.67 6.9 – – 10.51 7.1 Level 2 .............................. 13.64 9.8 – – 12.99 14.3
Lifeguards, ski patrol, and otherrecreational protective serviceworkers .................................... 9.63 5.9 13.35 15.8 8.56 2.1
Level 1 .............................. 6.83 4.3 – – 6.83 4.3 Level 2 .............................. 8.08 3.0 – – 7.94 2.3 Level 3 .............................. 9.20 5.7 11.39 19.4 8.72 3.9 Level 4 .............................. 10.73 6.0 12.10 12.8 10.01 6.1
Food preparation and serving relatedoccupations ..................................... 8.31 1.0 9.32 1.7 6.96 .9
Level 1 .............................. 6.83 1.2 7.07 2.5 6.65 .9 Level 2 .............................. 7.20 2.1 7.61 3.2 6.78 1.3 Level 3 .............................. 8.76 1.7 9.28 1.6 7.77 2.7 Level 4 .............................. 11.15 1.3 11.34 1.4 9.67 3.8 Level 5 .............................. 14.88 1.9 14.98 1.9 12.28 3.8 Level 6 .............................. 17.33 2.8 17.33 2.8 – –
See footnotes at end of table.
NATIONAL COMPENSATION SURVEY
All United States 8-55 December 2006 - January 2008
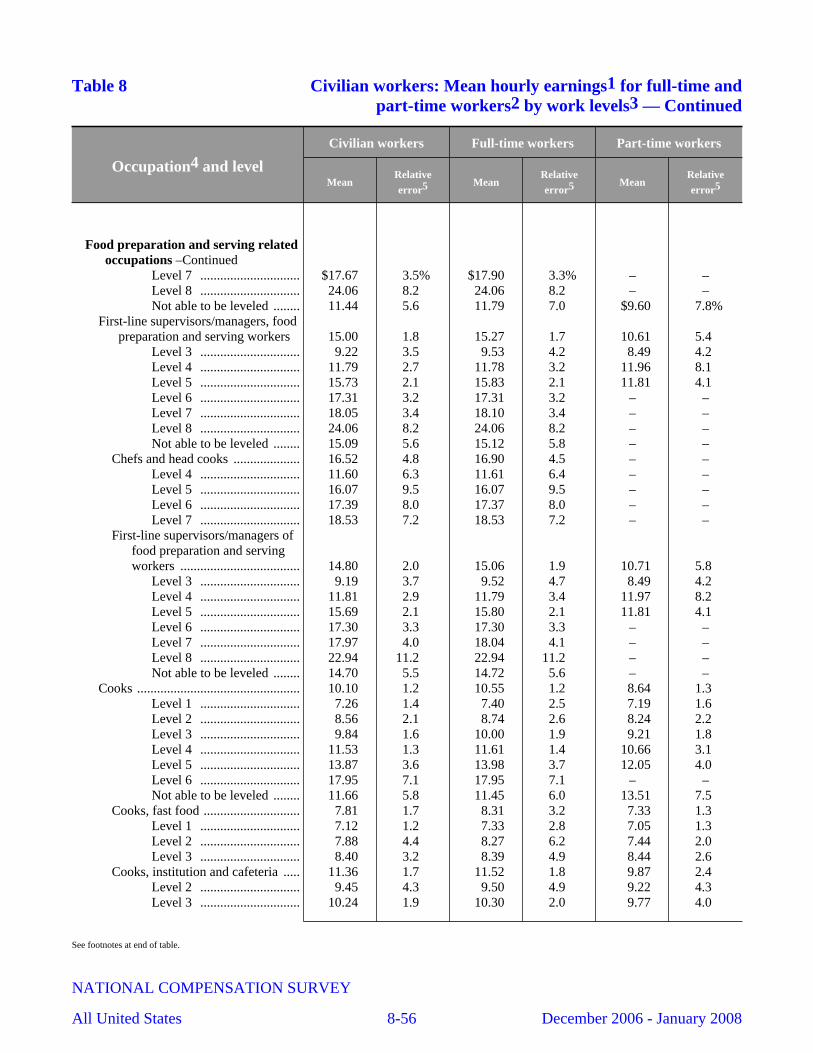
Table 8 Civilian workers: Mean hourly earnings1 for full-time andpart-time workers2 by work levels3 — Continued
Occupation4 and level
Civilian workers Full-time workers Part-time workers
MeanRelativeerror5 Mean
Relativeerror5 Mean
Relativeerror5
Food preparation and serving relatedoccupations –Continued
Level 7 .............................. $17.67 3.5% $17.90 3.3% – –Level 8 .............................. 24.06 8.2 24.06 8.2 – –Not able to be leveled ........ 11.44 5.6 11.79 7.0 $9.60 7.8%
First-line supervisors/managers, foodpreparation and serving workers 15.00 1.8 15.27 1.7 10.61 5.4
Level 3 .............................. 9.22 3.5 9.53 4.2 8.49 4.2 Level 4 .............................. 11.79 2.7 11.78 3.2 11.96 8.1 Level 5 .............................. 15.73 2.1 15.83 2.1 11.81 4.1 Level 6 .............................. 17.31 3.2 17.31 3.2 – –Level 7 .............................. 18.05 3.4 18.10 3.4 – –Level 8 .............................. 24.06 8.2 24.06 8.2 – –Not able to be leveled ........ 15.09 5.6 15.12 5.8 – –
Chefs and head cooks .................... 16.52 4.8 16.90 4.5 – –Level 4 .............................. 11.60 6.3 11.61 6.4 – –Level 5 .............................. 16.07 9.5 16.07 9.5 – –Level 6 .............................. 17.39 8.0 17.37 8.0 – –Level 7 .............................. 18.53 7.2 18.53 7.2 – –
First-line supervisors/managers offood preparation and servingworkers .................................... 14.80 2.0 15.06 1.9 10.71 5.8
Level 3 .............................. 9.19 3.7 9.52 4.7 8.49 4.2 Level 4 .............................. 11.81 2.9 11.79 3.4 11.97 8.2 Level 5 .............................. 15.69 2.1 15.80 2.1 11.81 4.1 Level 6 .............................. 17.30 3.3 17.30 3.3 – –Level 7 .............................. 17.97 4.0 18.04 4.1 – –Level 8 .............................. 22.94 11.2 22.94 11.2 – –Not able to be leveled ........ 14.70 5.5 14.72 5.6 – –
Cooks ................................................. 10.10 1.2 10.55 1.2 8.64 1.3 Level 1 .............................. 7.26 1.4 7.40 2.5 7.19 1.6 Level 2 .............................. 8.56 2.1 8.74 2.6 8.24 2.2 Level 3 .............................. 9.84 1.6 10.00 1.9 9.21 1.8 Level 4 .............................. 11.53 1.3 11.61 1.4 10.66 3.1 Level 5 .............................. 13.87 3.6 13.98 3.7 12.05 4.0 Level 6 .............................. 17.95 7.1 17.95 7.1 – –Not able to be leveled ........ 11.66 5.8 11.45 6.0 13.51 7.5
Cooks, fast food ............................. 7.81 1.7 8.31 3.2 7.33 1.3 Level 1 .............................. 7.12 1.2 7.33 2.8 7.05 1.3 Level 2 .............................. 7.88 4.4 8.27 6.2 7.44 2.0 Level 3 .............................. 8.40 3.2 8.39 4.9 8.44 2.6
Cooks, institution and cafeteria ..... 11.36 1.7 11.52 1.8 9.87 2.4 Level 2 .............................. 9.45 4.3 9.50 4.9 9.22 4.3 Level 3 .............................. 10.24 1.9 10.30 2.0 9.77 4.0
See footnotes at end of table.
NATIONAL COMPENSATION SURVEY
All United States 8-56 December 2006 - January 2008
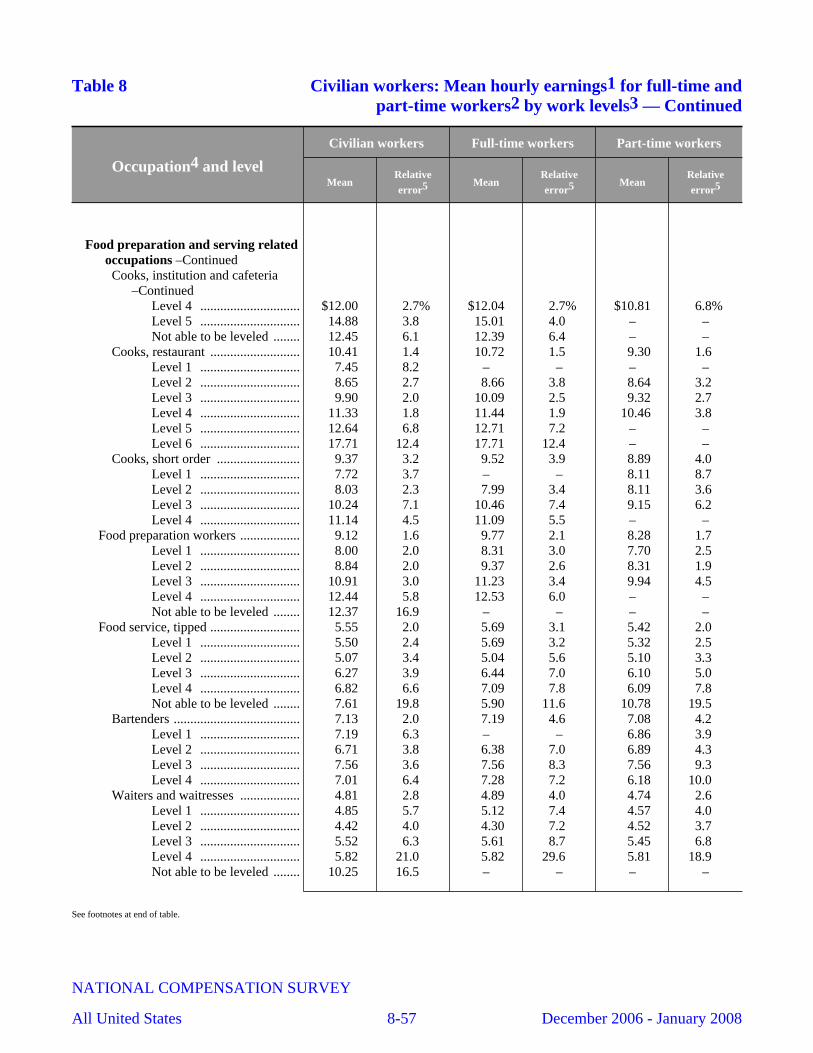
Table 8 Civilian workers: Mean hourly earnings1 for full-time andpart-time workers2 by work levels3 — Continued
Occupation4 and level
Civilian workers Full-time workers Part-time workers
MeanRelativeerror5 Mean
Relativeerror5 Mean
Relativeerror5
Food preparation and serving relatedoccupations –ContinuedCooks, institution and cafeteria
–ContinuedLevel 4 .............................. $12.00 2.7% $12.04 2.7% $10.81 6.8%Level 5 .............................. 14.88 3.8 15.01 4.0 – –Not able to be leveled ........ 12.45 6.1 12.39 6.4 – –
Cooks, restaurant ........................... 10.41 1.4 10.72 1.5 9.30 1.6 Level 1 .............................. 7.45 8.2 – – – –Level 2 .............................. 8.65 2.7 8.66 3.8 8.64 3.2 Level 3 .............................. 9.90 2.0 10.09 2.5 9.32 2.7 Level 4 .............................. 11.33 1.8 11.44 1.9 10.46 3.8 Level 5 .............................. 12.64 6.8 12.71 7.2 – –Level 6 .............................. 17.71 12.4 17.71 12.4 – –
Cooks, short order ......................... 9.37 3.2 9.52 3.9 8.89 4.0 Level 1 .............................. 7.72 3.7 – – 8.11 8.7 Level 2 .............................. 8.03 2.3 7.99 3.4 8.11 3.6 Level 3 .............................. 10.24 7.1 10.46 7.4 9.15 6.2 Level 4 .............................. 11.14 4.5 11.09 5.5 – –
Food preparation workers .................. 9.12 1.6 9.77 2.1 8.28 1.7 Level 1 .............................. 8.00 2.0 8.31 3.0 7.70 2.5 Level 2 .............................. 8.84 2.0 9.37 2.6 8.31 1.9 Level 3 .............................. 10.91 3.0 11.23 3.4 9.94 4.5 Level 4 .............................. 12.44 5.8 12.53 6.0 – –Not able to be leveled ........ 12.37 16.9 – – – –
Food service, tipped ........................... 5.55 2.0 5.69 3.1 5.42 2.0 Level 1 .............................. 5.50 2.4 5.69 3.2 5.32 2.5 Level 2 .............................. 5.07 3.4 5.04 5.6 5.10 3.3 Level 3 .............................. 6.27 3.9 6.44 7.0 6.10 5.0 Level 4 .............................. 6.82 6.6 7.09 7.8 6.09 7.8 Not able to be leveled ........ 7.61 19.8 5.90 11.6 10.78 19.5
Bartenders ...................................... 7.13 2.0 7.19 4.6 7.08 4.2 Level 1 .............................. 7.19 6.3 – – 6.86 3.9 Level 2 .............................. 6.71 3.8 6.38 7.0 6.89 4.3 Level 3 .............................. 7.56 3.6 7.56 8.3 7.56 9.3 Level 4 .............................. 7.01 6.4 7.28 7.2 6.18 10.0
Waiters and waitresses .................. 4.81 2.8 4.89 4.0 4.74 2.6 Level 1 .............................. 4.85 5.7 5.12 7.4 4.57 4.0 Level 2 .............................. 4.42 4.0 4.30 7.2 4.52 3.7 Level 3 .............................. 5.52 6.3 5.61 8.7 5.45 6.8 Level 4 .............................. 5.82 21.0 5.82 29.6 5.81 18.9 Not able to be leveled ........ 10.25 16.5 – – – –
See footnotes at end of table.
NATIONAL COMPENSATION SURVEY
All United States 8-57 December 2006 - January 2008
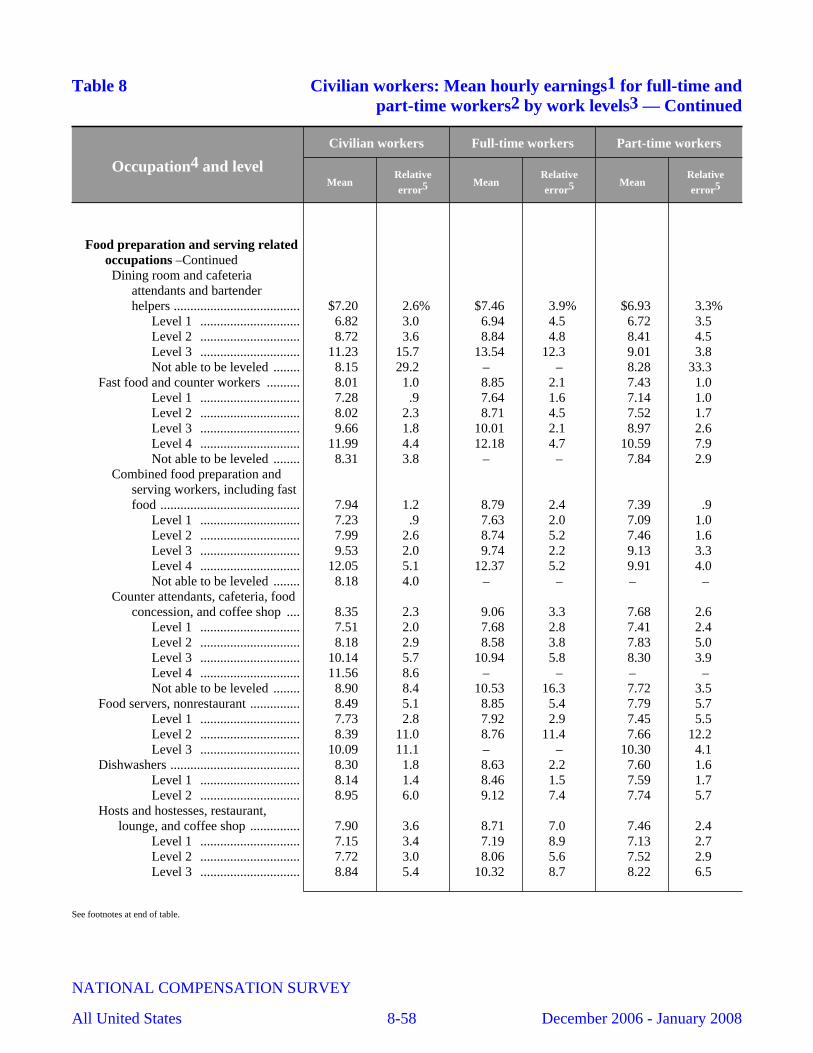
Table 8 Civilian workers: Mean hourly earnings1 for full-time andpart-time workers2 by work levels3 — Continued
Occupation4 and level
Civilian workers Full-time workers Part-time workers
MeanRelativeerror5 Mean
Relativeerror5 Mean
Relativeerror5
Food preparation and serving relatedoccupations –ContinuedDining room and cafeteria
attendants and bartenderhelpers ...................................... $7.20 2.6% $7.46 3.9% $6.93 3.3%
Level 1 .............................. 6.82 3.0 6.94 4.5 6.72 3.5 Level 2 .............................. 8.72 3.6 8.84 4.8 8.41 4.5 Level 3 .............................. 11.23 15.7 13.54 12.3 9.01 3.8 Not able to be leveled ........ 8.15 29.2 – – 8.28 33.3
Fast food and counter workers .......... 8.01 1.0 8.85 2.1 7.43 1.0 Level 1 .............................. 7.28 .9 7.64 1.6 7.14 1.0 Level 2 .............................. 8.02 2.3 8.71 4.5 7.52 1.7 Level 3 .............................. 9.66 1.8 10.01 2.1 8.97 2.6 Level 4 .............................. 11.99 4.4 12.18 4.7 10.59 7.9 Not able to be leveled ........ 8.31 3.8 – – 7.84 2.9
Combined food preparation andserving workers, including fastfood .......................................... 7.94 1.2 8.79 2.4 7.39 .9
Level 1 .............................. 7.23 .9 7.63 2.0 7.09 1.0 Level 2 .............................. 7.99 2.6 8.74 5.2 7.46 1.6 Level 3 .............................. 9.53 2.0 9.74 2.2 9.13 3.3 Level 4 .............................. 12.05 5.1 12.37 5.2 9.91 4.0 Not able to be leveled ........ 8.18 4.0 – – – –
Counter attendants, cafeteria, foodconcession, and coffee shop .... 8.35 2.3 9.06 3.3 7.68 2.6
Level 1 .............................. 7.51 2.0 7.68 2.8 7.41 2.4 Level 2 .............................. 8.18 2.9 8.58 3.8 7.83 5.0 Level 3 .............................. 10.14 5.7 10.94 5.8 8.30 3.9 Level 4 .............................. 11.56 8.6 – – – –Not able to be leveled ........ 8.90 8.4 10.53 16.3 7.72 3.5
Food servers, nonrestaurant ............... 8.49 5.1 8.85 5.4 7.79 5.7 Level 1 .............................. 7.73 2.8 7.92 2.9 7.45 5.5 Level 2 .............................. 8.39 11.0 8.76 11.4 7.66 12.2 Level 3 .............................. 10.09 11.1 – – 10.30 4.1
Dishwashers ....................................... 8.30 1.8 8.63 2.2 7.60 1.6 Level 1 .............................. 8.14 1.4 8.46 1.5 7.59 1.7 Level 2 .............................. 8.95 6.0 9.12 7.4 7.74 5.7
Hosts and hostesses, restaurant,lounge, and coffee shop ............... 7.90 3.6 8.71 7.0 7.46 2.4
Level 1 .............................. 7.15 3.4 7.19 8.9 7.13 2.7 Level 2 .............................. 7.72 3.0 8.06 5.6 7.52 2.9 Level 3 .............................. 8.84 5.4 10.32 8.7 8.22 6.5
See footnotes at end of table.
NATIONAL COMPENSATION SURVEY
All United States 8-58 December 2006 - January 2008

Table 8 Civilian workers: Mean hourly earnings1 for full-time andpart-time workers2 by work levels3 — Continued
Occupation4 and level
Civilian workers Full-time workers Part-time workers
MeanRelativeerror5 Mean
Relativeerror5 Mean
Relativeerror5
Building and grounds cleaning andmaintenance occupations .............. $11.77 2.3% $12.29 2.4% $9.12 1.9%
Level 1 .............................. 9.36 4.2 9.71 5.4 8.31 1.9 Level 2 .............................. 11.15 2.4 11.45 2.4 9.70 2.9 Level 3 .............................. 12.70 1.4 12.87 1.4 10.54 3.8 Level 4 .............................. 14.29 2.9 14.40 3.0 12.45 6.5 Level 5 .............................. 17.30 3.4 17.34 3.4 – –Level 6 .............................. 21.84 7.5 21.88 7.4 – –Level 7 .............................. 25.19 6.9 25.19 6.9 – –Level 8 .............................. 27.03 6.6 27.21 7.4 – –Not able to be leveled ........ 14.64 6.8 14.72 7.1 13.67 13.3
First-line supervisors/managers,building and grounds cleaningand maintenance workers ............ 19.01 5.6 19.06 5.6 12.74 7.8
Level 3 .............................. 11.35 7.5 11.35 7.8 – –Level 4 .............................. 12.54 5.8 12.49 5.9 – –Level 5 .............................. 16.46 5.5 16.48 5.5 – –Level 6 .............................. 22.10 9.4 22.14 9.3 – –Level 7 .............................. 26.79 4.1 26.79 4.1 – –Level 8 .............................. 27.21 7.4 27.21 7.4 – –Not able to be leveled ........ 17.92 4.0 17.94 4.0 – –
First-line supervisors/managers ofhousekeeping and janitorialworkers .................................... 17.39 4.3 17.43 4.3 12.91 7.8
Level 3 .............................. 11.38 7.5 11.38 7.7 – –Level 4 .............................. 12.01 5.7 11.94 5.8 – –Level 5 .............................. 16.71 6.2 16.71 6.2 – –Level 6 .............................. 18.41 2.7 18.47 2.7 – –Level 7 .............................. 27.68 4.2 27.68 4.2 – –Not able to be leveled ........ 17.76 4.7 17.78 4.6 – –
First-line supervisors/managers oflandscaping, lawn service, andgroundskeeping workers .......... 22.82 10.3 22.84 10.3 – –
Level 4 .............................. 16.51 7.4 16.51 7.4 – –Level 5 .............................. 16.13 7.6 16.15 7.6 – –Level 7 .............................. 20.78 9.2 20.78 9.2 – –Not able to be leveled ........ 22.64 9.9 22.64 9.9 – –
Building cleaning workers ................. 10.90 2.5 11.33 2.8 9.04 1.9 Level 1 .............................. 9.38 4.5 9.74 5.8 8.31 2.1 Level 2 .............................. 11.23 2.3 11.54 2.4 9.82 3.2 Level 3 .............................. 12.59 1.5 12.75 1.5 10.55 4.7 Level 4 .............................. 14.56 4.0 14.76 4.3 12.04 7.6 Level 5 .............................. 18.96 4.6 18.93 4.7 – –Level 6 .............................. 19.71 7.9 19.71 7.9 – –
See footnotes at end of table.
NATIONAL COMPENSATION SURVEY
All United States 8-59 December 2006 - January 2008
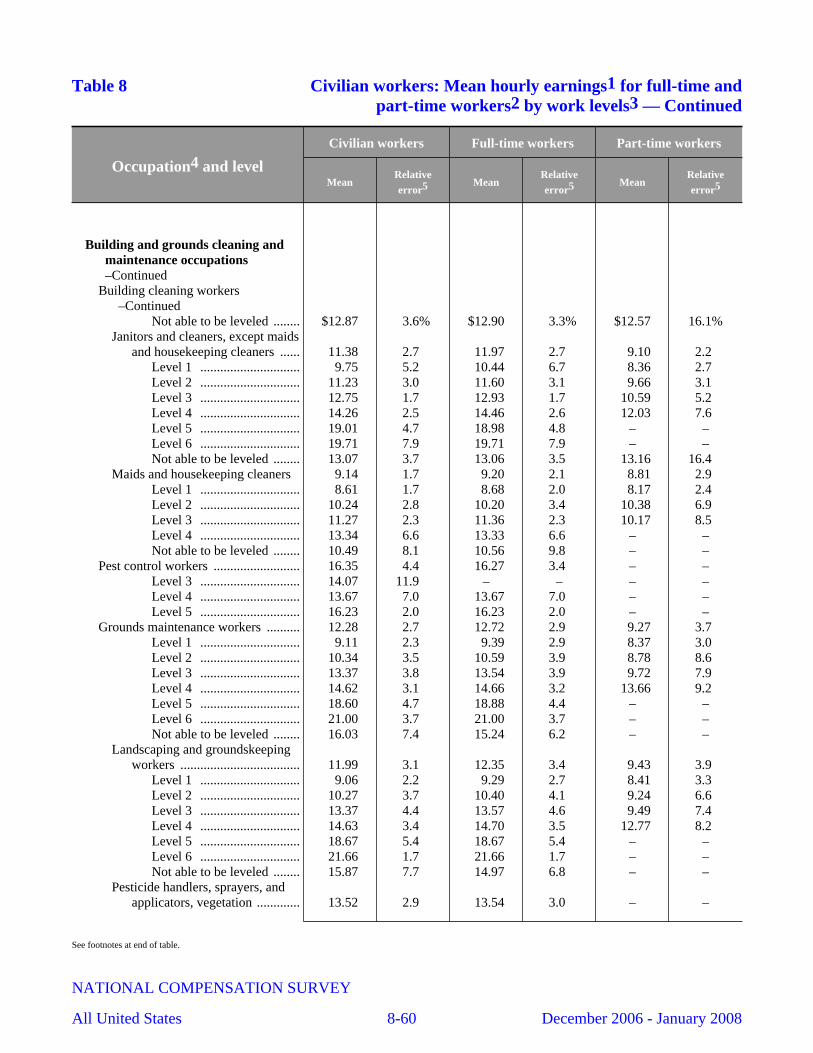
Table 8 Civilian workers: Mean hourly earnings1 for full-time andpart-time workers2 by work levels3 — Continued
Occupation4 and level
Civilian workers Full-time workers Part-time workers
MeanRelativeerror5 Mean
Relativeerror5 Mean
Relativeerror5
Building and grounds cleaning andmaintenance occupations–Continued
Building cleaning workers–Continued
Not able to be leveled ........ $12.87 3.6% $12.90 3.3% $12.57 16.1%Janitors and cleaners, except maids
and housekeeping cleaners ...... 11.38 2.7 11.97 2.7 9.10 2.2 Level 1 .............................. 9.75 5.2 10.44 6.7 8.36 2.7 Level 2 .............................. 11.23 3.0 11.60 3.1 9.66 3.1 Level 3 .............................. 12.75 1.7 12.93 1.7 10.59 5.2 Level 4 .............................. 14.26 2.5 14.46 2.6 12.03 7.6 Level 5 .............................. 19.01 4.7 18.98 4.8 – –Level 6 .............................. 19.71 7.9 19.71 7.9 – –Not able to be leveled ........ 13.07 3.7 13.06 3.5 13.16 16.4
Maids and housekeeping cleaners 9.14 1.7 9.20 2.1 8.81 2.9 Level 1 .............................. 8.61 1.7 8.68 2.0 8.17 2.4 Level 2 .............................. 10.24 2.8 10.20 3.4 10.38 6.9 Level 3 .............................. 11.27 2.3 11.36 2.3 10.17 8.5 Level 4 .............................. 13.34 6.6 13.33 6.6 – –Not able to be leveled ........ 10.49 8.1 10.56 9.8 – –
Pest control workers .......................... 16.35 4.4 16.27 3.4 – –Level 3 .............................. 14.07 11.9 – – – –Level 4 .............................. 13.67 7.0 13.67 7.0 – –Level 5 .............................. 16.23 2.0 16.23 2.0 – –
Grounds maintenance workers .......... 12.28 2.7 12.72 2.9 9.27 3.7 Level 1 .............................. 9.11 2.3 9.39 2.9 8.37 3.0 Level 2 .............................. 10.34 3.5 10.59 3.9 8.78 8.6 Level 3 .............................. 13.37 3.8 13.54 3.9 9.72 7.9 Level 4 .............................. 14.62 3.1 14.66 3.2 13.66 9.2 Level 5 .............................. 18.60 4.7 18.88 4.4 – –Level 6 .............................. 21.00 3.7 21.00 3.7 – –Not able to be leveled ........ 16.03 7.4 15.24 6.2 – –
Landscaping and groundskeepingworkers .................................... 11.99 3.1 12.35 3.4 9.43 3.9
Level 1 .............................. 9.06 2.2 9.29 2.7 8.41 3.3 Level 2 .............................. 10.27 3.7 10.40 4.1 9.24 6.6 Level 3 .............................. 13.37 4.4 13.57 4.6 9.49 7.4 Level 4 .............................. 14.63 3.4 14.70 3.5 12.77 8.2 Level 5 .............................. 18.67 5.4 18.67 5.4 – –Level 6 .............................. 21.66 1.7 21.66 1.7 – –Not able to be leveled ........ 15.87 7.7 14.97 6.8 – –
Pesticide handlers, sprayers, andapplicators, vegetation ............. 13.52 2.9 13.54 3.0 – –
See footnotes at end of table.
NATIONAL COMPENSATION SURVEY
All United States 8-60 December 2006 - January 2008

Table 8 Civilian workers: Mean hourly earnings1 for full-time andpart-time workers2 by work levels3 — Continued
Occupation4 and level
Civilian workers Full-time workers Part-time workers
MeanRelativeerror5 Mean
Relativeerror5 Mean
Relativeerror5
Building and grounds cleaning andmaintenance occupations–ContinuedTree trimmers and pruners ............. $18.78 7.6% $18.78 7.6% – –
Level 5 .............................. 20.25 10.2 20.25 10.2 – –
Personal care and serviceoccupations ..................................... 10.74 5.2 11.33 7.4 $9.36 3.6%
Level 1 .............................. 8.01 5.1 8.43 3.5 7.83 6.8 Level 2 .............................. 7.91 5.5 7.86 7.0 8.01 3.8 Level 3 .............................. 9.08 8.9 9.00 10.8 9.52 2.3 Level 4 .............................. 12.84 2.6 13.24 2.9 11.33 6.8 Level 5 .............................. 17.08 4.4 17.79 4.3 14.14 9.6 Level 6 .............................. 17.81 4.6 17.93 5.8 17.36 6.5 Level 7 .............................. 23.19 9.5 23.44 9.8 20.99 35.1 Level 8 .............................. 22.17 16.2 22.13 16.4 – –Level 9 .............................. 23.68 8.7 25.46 7.3 – –Not able to be leveled ........ 12.51 6.9 12.70 7.3 11.78 14.9
First-line supervisors/managers ofgaming workers ........................... 14.46 3.5 14.45 3.4 – –
Level 2 .............................. 11.82 4.3 11.82 4.3 – –Level 3 .............................. 11.19 2.6 11.19 2.6 – –Level 4 .............................. 12.12 16.9 – – – –Level 6 .............................. 15.22 4.6 15.22 4.6 – –Level 7 .............................. 25.58 1.9 25.75 1.9 – –Not able to be leveled ........ 15.14 11.9 15.14 11.9 – –
Gaming supervisors ....................... 16.57 6.9 16.56 6.9 – –Level 6 .............................. 15.22 4.6 15.22 4.6 – –Level 7 .............................. 25.58 1.9 25.75 1.9 – –Not able to be leveled ........ 15.27 12.6 15.27 12.6 – –
Slot key persons ............................. 11.37 1.8 11.37 1.8 – –Level 2 .............................. 11.82 4.3 11.82 4.3 – –Level 3 .............................. 11.19 2.6 11.19 2.6 – –
First-line supervisors/managers ofpersonal service workers ............. 15.65 3.0 15.77 3.1 13.41 6.0
Level 4 .............................. 12.75 6.3 12.81 7.2 – –Level 5 .............................. 13.12 7.2 13.06 7.7 – –Level 6 .............................. 15.51 4.7 15.65 4.9 – –Level 7 .............................. 16.56 3.2 16.56 3.2 – –Level 8 .............................. 19.09 10.7 19.09 10.7 – –Level 9 .............................. 23.67 8.8 25.46 7.3 – –Not able to be leveled ........ 16.07 9.8 16.07 9.8 – –
Nonfarm animal caretakers ................ 8.84 5.6 9.86 5.1 7.27 4.4 Level 1 .............................. 7.02 4.1 – – 6.92 3.8
See footnotes at end of table.
NATIONAL COMPENSATION SURVEY
All United States 8-61 December 2006 - January 2008
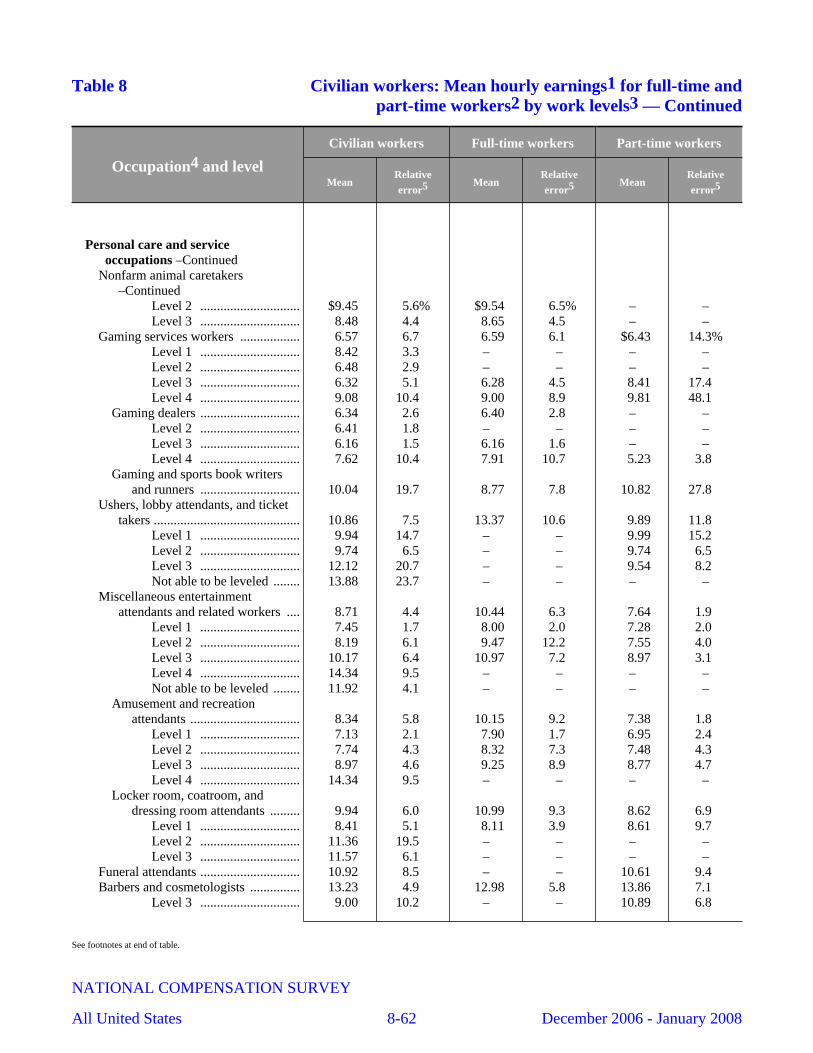
Table 8 Civilian workers: Mean hourly earnings1 for full-time andpart-time workers2 by work levels3 — Continued
Occupation4 and level
Civilian workers Full-time workers Part-time workers
MeanRelativeerror5 Mean
Relativeerror5 Mean
Relativeerror5
Personal care and serviceoccupations –Continued
Nonfarm animal caretakers–Continued
Level 2 .............................. $9.45 5.6% $9.54 6.5% – –Level 3 .............................. 8.48 4.4 8.65 4.5 – –
Gaming services workers .................. 6.57 6.7 6.59 6.1 $6.43 14.3%Level 1 .............................. 8.42 3.3 – – – –Level 2 .............................. 6.48 2.9 – – – –Level 3 .............................. 6.32 5.1 6.28 4.5 8.41 17.4 Level 4 .............................. 9.08 10.4 9.00 8.9 9.81 48.1
Gaming dealers .............................. 6.34 2.6 6.40 2.8 – –Level 2 .............................. 6.41 1.8 – – – –Level 3 .............................. 6.16 1.5 6.16 1.6 – –Level 4 .............................. 7.62 10.4 7.91 10.7 5.23 3.8
Gaming and sports book writersand runners .............................. 10.04 19.7 8.77 7.8 10.82 27.8
Ushers, lobby attendants, and tickettakers ............................................ 10.86 7.5 13.37 10.6 9.89 11.8
Level 1 .............................. 9.94 14.7 – – 9.99 15.2 Level 2 .............................. 9.74 6.5 – – 9.74 6.5 Level 3 .............................. 12.12 20.7 – – 9.54 8.2 Not able to be leveled ........ 13.88 23.7 – – – –
Miscellaneous entertainmentattendants and related workers .... 8.71 4.4 10.44 6.3 7.64 1.9
Level 1 .............................. 7.45 1.7 8.00 2.0 7.28 2.0 Level 2 .............................. 8.19 6.1 9.47 12.2 7.55 4.0 Level 3 .............................. 10.17 6.4 10.97 7.2 8.97 3.1 Level 4 .............................. 14.34 9.5 – – – –Not able to be leveled ........ 11.92 4.1 – – – –
Amusement and recreationattendants ................................. 8.34 5.8 10.15 9.2 7.38 1.8
Level 1 .............................. 7.13 2.1 7.90 1.7 6.95 2.4 Level 2 .............................. 7.74 4.3 8.32 7.3 7.48 4.3 Level 3 .............................. 8.97 4.6 9.25 8.9 8.77 4.7 Level 4 .............................. 14.34 9.5 – – – –
Locker room, coatroom, anddressing room attendants ......... 9.94 6.0 10.99 9.3 8.62 6.9
Level 1 .............................. 8.41 5.1 8.11 3.9 8.61 9.7 Level 2 .............................. 11.36 19.5 – – – –Level 3 .............................. 11.57 6.1 – – – –
Funeral attendants .............................. 10.92 8.5 – – 10.61 9.4 Barbers and cosmetologists ............... 13.23 4.9 12.98 5.8 13.86 7.1
Level 3 .............................. 9.00 10.2 – – 10.89 6.8
See footnotes at end of table.
NATIONAL COMPENSATION SURVEY
All United States 8-62 December 2006 - January 2008
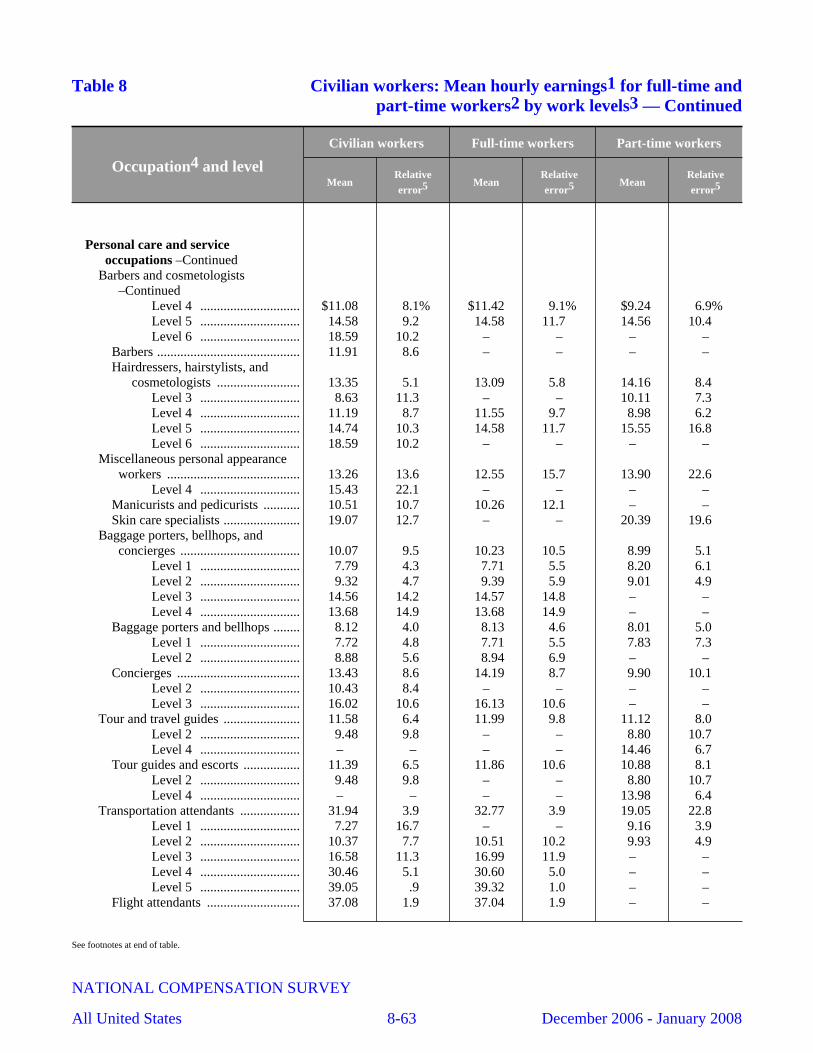
Table 8 Civilian workers: Mean hourly earnings1 for full-time andpart-time workers2 by work levels3 — Continued
Occupation4 and level
Civilian workers Full-time workers Part-time workers
MeanRelativeerror5 Mean
Relativeerror5 Mean
Relativeerror5
Personal care and serviceoccupations –Continued
Barbers and cosmetologists–Continued
Level 4 .............................. $11.08 8.1% $11.42 9.1% $9.24 6.9%Level 5 .............................. 14.58 9.2 14.58 11.7 14.56 10.4 Level 6 .............................. 18.59 10.2 – – – –
Barbers ........................................... 11.91 8.6 – – – –Hairdressers, hairstylists, and
cosmetologists ......................... 13.35 5.1 13.09 5.8 14.16 8.4 Level 3 .............................. 8.63 11.3 – – 10.11 7.3 Level 4 .............................. 11.19 8.7 11.55 9.7 8.98 6.2 Level 5 .............................. 14.74 10.3 14.58 11.7 15.55 16.8 Level 6 .............................. 18.59 10.2 – – – –
Miscellaneous personal appearanceworkers ........................................ 13.26 13.6 12.55 15.7 13.90 22.6
Level 4 .............................. 15.43 22.1 – – – –Manicurists and pedicurists ........... 10.51 10.7 10.26 12.1 – –Skin care specialists ....................... 19.07 12.7 – – 20.39 19.6
Baggage porters, bellhops, andconcierges .................................... 10.07 9.5 10.23 10.5 8.99 5.1
Level 1 .............................. 7.79 4.3 7.71 5.5 8.20 6.1 Level 2 .............................. 9.32 4.7 9.39 5.9 9.01 4.9 Level 3 .............................. 14.56 14.2 14.57 14.8 – –Level 4 .............................. 13.68 14.9 13.68 14.9 – –
Baggage porters and bellhops ........ 8.12 4.0 8.13 4.6 8.01 5.0 Level 1 .............................. 7.72 4.8 7.71 5.5 7.83 7.3 Level 2 .............................. 8.88 5.6 8.94 6.9 – –
Concierges ..................................... 13.43 8.6 14.19 8.7 9.90 10.1 Level 2 .............................. 10.43 8.4 – – – –Level 3 .............................. 16.02 10.6 16.13 10.6 – –
Tour and travel guides ....................... 11.58 6.4 11.99 9.8 11.12 8.0 Level 2 .............................. 9.48 9.8 – – 8.80 10.7 Level 4 .............................. – – – – 14.46 6.7
Tour guides and escorts ................. 11.39 6.5 11.86 10.6 10.88 8.1 Level 2 .............................. 9.48 9.8 – – 8.80 10.7 Level 4 .............................. – – – – 13.98 6.4
Transportation attendants .................. 31.94 3.9 32.77 3.9 19.05 22.8 Level 1 .............................. 7.27 16.7 – – 9.16 3.9 Level 2 .............................. 10.37 7.7 10.51 10.2 9.93 4.9 Level 3 .............................. 16.58 11.3 16.99 11.9 – –Level 4 .............................. 30.46 5.1 30.60 5.0 – –Level 5 .............................. 39.05 .9 39.32 1.0 – –
Flight attendants ............................ 37.08 1.9 37.04 1.9 – –
See footnotes at end of table.
NATIONAL COMPENSATION SURVEY
All United States 8-63 December 2006 - January 2008
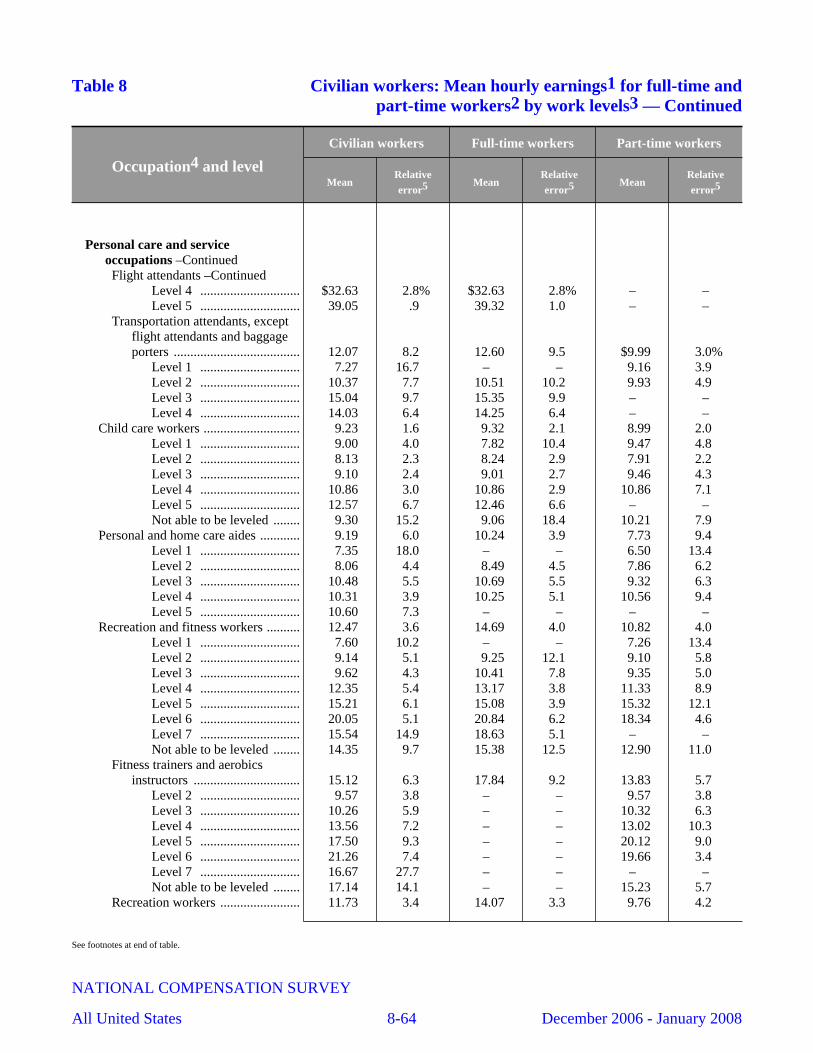
Table 8 Civilian workers: Mean hourly earnings1 for full-time andpart-time workers2 by work levels3 — Continued
Occupation4 and level
Civilian workers Full-time workers Part-time workers
MeanRelativeerror5 Mean
Relativeerror5 Mean
Relativeerror5
Personal care and serviceoccupations –ContinuedFlight attendants –Continued
Level 4 .............................. $32.63 2.8% $32.63 2.8% – –Level 5 .............................. 39.05 .9 39.32 1.0 – –
Transportation attendants, exceptflight attendants and baggageporters ...................................... 12.07 8.2 12.60 9.5 $9.99 3.0%
Level 1 .............................. 7.27 16.7 – – 9.16 3.9 Level 2 .............................. 10.37 7.7 10.51 10.2 9.93 4.9 Level 3 .............................. 15.04 9.7 15.35 9.9 – –Level 4 .............................. 14.03 6.4 14.25 6.4 – –
Child care workers ............................. 9.23 1.6 9.32 2.1 8.99 2.0 Level 1 .............................. 9.00 4.0 7.82 10.4 9.47 4.8 Level 2 .............................. 8.13 2.3 8.24 2.9 7.91 2.2 Level 3 .............................. 9.10 2.4 9.01 2.7 9.46 4.3 Level 4 .............................. 10.86 3.0 10.86 2.9 10.86 7.1 Level 5 .............................. 12.57 6.7 12.46 6.6 – –Not able to be leveled ........ 9.30 15.2 9.06 18.4 10.21 7.9
Personal and home care aides ............ 9.19 6.0 10.24 3.9 7.73 9.4 Level 1 .............................. 7.35 18.0 – – 6.50 13.4 Level 2 .............................. 8.06 4.4 8.49 4.5 7.86 6.2 Level 3 .............................. 10.48 5.5 10.69 5.5 9.32 6.3 Level 4 .............................. 10.31 3.9 10.25 5.1 10.56 9.4 Level 5 .............................. 10.60 7.3 – – – –
Recreation and fitness workers .......... 12.47 3.6 14.69 4.0 10.82 4.0 Level 1 .............................. 7.60 10.2 – – 7.26 13.4 Level 2 .............................. 9.14 5.1 9.25 12.1 9.10 5.8 Level 3 .............................. 9.62 4.3 10.41 7.8 9.35 5.0 Level 4 .............................. 12.35 5.4 13.17 3.8 11.33 8.9 Level 5 .............................. 15.21 6.1 15.08 3.9 15.32 12.1 Level 6 .............................. 20.05 5.1 20.84 6.2 18.34 4.6 Level 7 .............................. 15.54 14.9 18.63 5.1 – –Not able to be leveled ........ 14.35 9.7 15.38 12.5 12.90 11.0
Fitness trainers and aerobicsinstructors ................................ 15.12 6.3 17.84 9.2 13.83 5.7
Level 2 .............................. 9.57 3.8 – – 9.57 3.8 Level 3 .............................. 10.26 5.9 – – 10.32 6.3 Level 4 .............................. 13.56 7.2 – – 13.02 10.3 Level 5 .............................. 17.50 9.3 – – 20.12 9.0 Level 6 .............................. 21.26 7.4 – – 19.66 3.4 Level 7 .............................. 16.67 27.7 – – – –Not able to be leveled ........ 17.14 14.1 – – 15.23 5.7
Recreation workers ........................ 11.73 3.4 14.07 3.3 9.76 4.2
See footnotes at end of table.
NATIONAL COMPENSATION SURVEY
All United States 8-64 December 2006 - January 2008
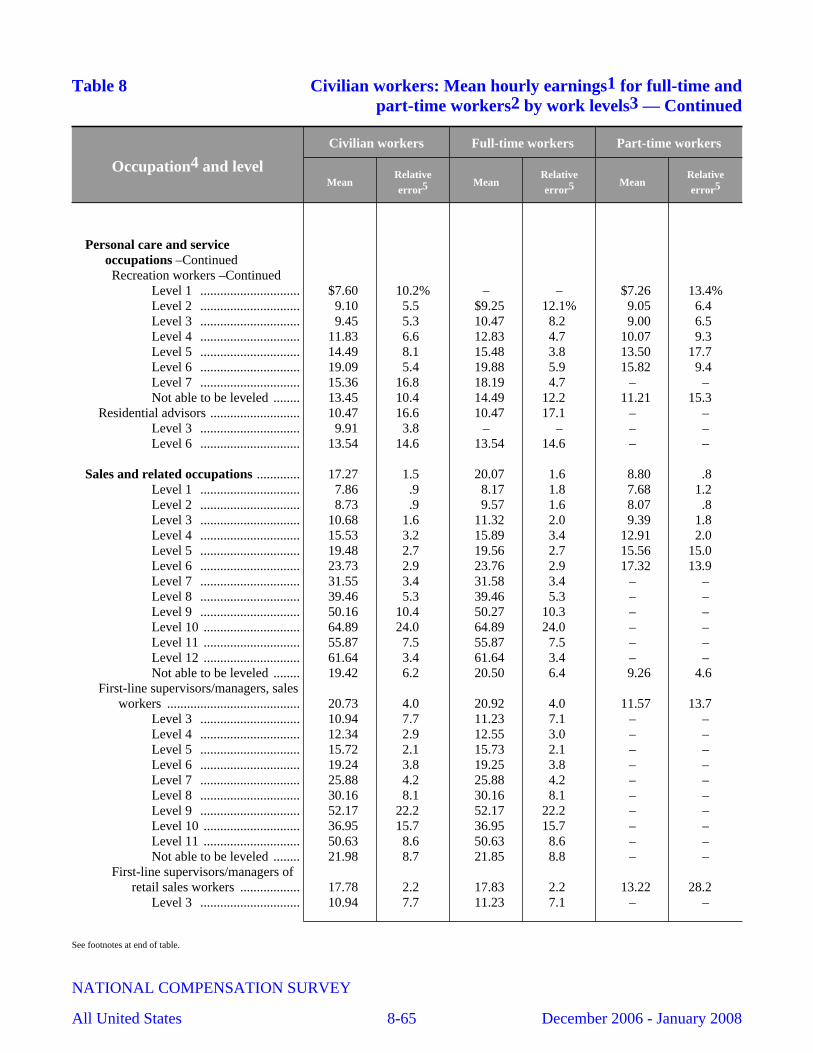
Table 8 Civilian workers: Mean hourly earnings1 for full-time andpart-time workers2 by work levels3 — Continued
Occupation4 and level
Civilian workers Full-time workers Part-time workers
MeanRelativeerror5 Mean
Relativeerror5 Mean
Relativeerror5
Personal care and serviceoccupations –ContinuedRecreation workers –Continued
Level 1 .............................. $7.60 10.2% – – $7.26 13.4%Level 2 .............................. 9.10 5.5 $9.25 12.1% 9.05 6.4 Level 3 .............................. 9.45 5.3 10.47 8.2 9.00 6.5 Level 4 .............................. 11.83 6.6 12.83 4.7 10.07 9.3 Level 5 .............................. 14.49 8.1 15.48 3.8 13.50 17.7 Level 6 .............................. 19.09 5.4 19.88 5.9 15.82 9.4 Level 7 .............................. 15.36 16.8 18.19 4.7 – –Not able to be leveled ........ 13.45 10.4 14.49 12.2 11.21 15.3
Residential advisors ........................... 10.47 16.6 10.47 17.1 – –Level 3 .............................. 9.91 3.8 – – – –Level 6 .............................. 13.54 14.6 13.54 14.6 – –
Sales and related occupations ............. 17.27 1.5 20.07 1.6 8.80 .8 Level 1 .............................. 7.86 .9 8.17 1.8 7.68 1.2 Level 2 .............................. 8.73 .9 9.57 1.6 8.07 .8 Level 3 .............................. 10.68 1.6 11.32 2.0 9.39 1.8 Level 4 .............................. 15.53 3.2 15.89 3.4 12.91 2.0 Level 5 .............................. 19.48 2.7 19.56 2.7 15.56 15.0 Level 6 .............................. 23.73 2.9 23.76 2.9 17.32 13.9 Level 7 .............................. 31.55 3.4 31.58 3.4 – –Level 8 .............................. 39.46 5.3 39.46 5.3 – –Level 9 .............................. 50.16 10.4 50.27 10.3 – –Level 10 ............................. 64.89 24.0 64.89 24.0 – –Level 11 ............................. 55.87 7.5 55.87 7.5 – –Level 12 ............................. 61.64 3.4 61.64 3.4 – –Not able to be leveled ........ 19.42 6.2 20.50 6.4 9.26 4.6
First-line supervisors/managers, salesworkers ........................................ 20.73 4.0 20.92 4.0 11.57 13.7
Level 3 .............................. 10.94 7.7 11.23 7.1 – –Level 4 .............................. 12.34 2.9 12.55 3.0 – –Level 5 .............................. 15.72 2.1 15.73 2.1 – –Level 6 .............................. 19.24 3.8 19.25 3.8 – –Level 7 .............................. 25.88 4.2 25.88 4.2 – –Level 8 .............................. 30.16 8.1 30.16 8.1 – –Level 9 .............................. 52.17 22.2 52.17 22.2 – –Level 10 ............................. 36.95 15.7 36.95 15.7 – –Level 11 ............................. 50.63 8.6 50.63 8.6 – –Not able to be leveled ........ 21.98 8.7 21.85 8.8 – –
First-line supervisors/managers ofretail sales workers .................. 17.78 2.2 17.83 2.2 13.22 28.2
Level 3 .............................. 10.94 7.7 11.23 7.1 – –
See footnotes at end of table.
NATIONAL COMPENSATION SURVEY
All United States 8-65 December 2006 - January 2008
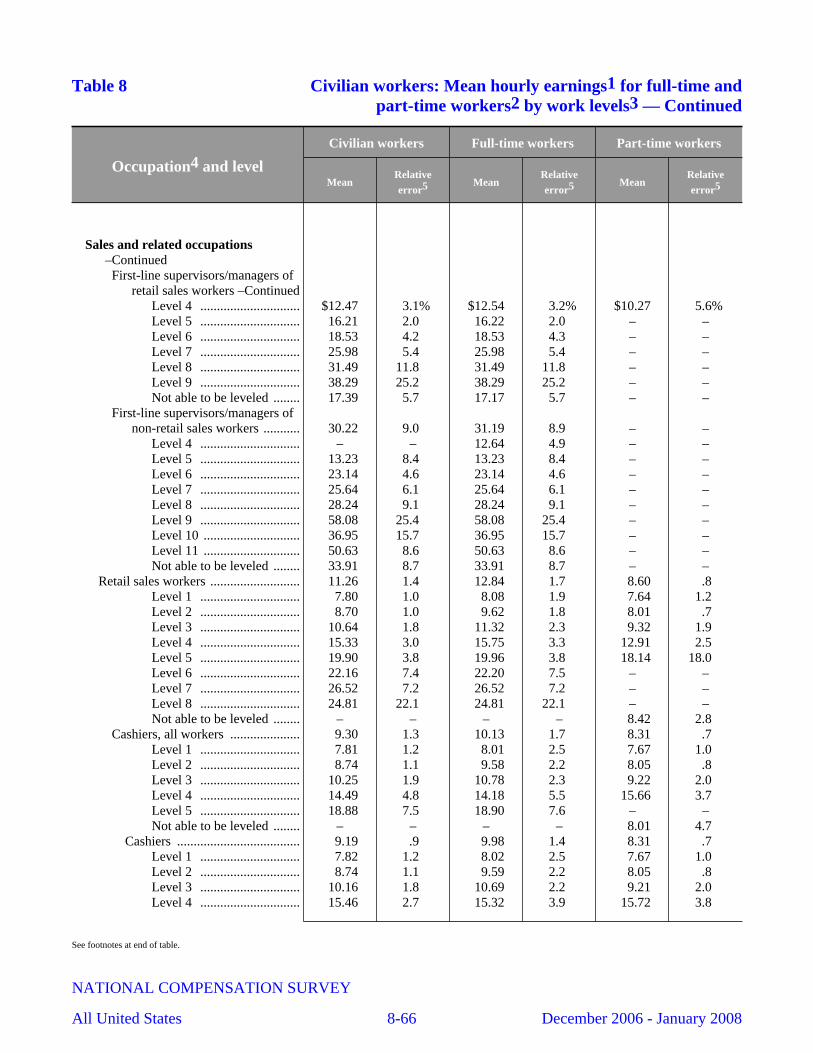
Table 8 Civilian workers: Mean hourly earnings1 for full-time andpart-time workers2 by work levels3 — Continued
Occupation4 and level
Civilian workers Full-time workers Part-time workers
MeanRelativeerror5 Mean
Relativeerror5 Mean
Relativeerror5
Sales and related occupations–ContinuedFirst-line supervisors/managers of
retail sales workers –ContinuedLevel 4 .............................. $12.47 3.1% $12.54 3.2% $10.27 5.6%Level 5 .............................. 16.21 2.0 16.22 2.0 – –Level 6 .............................. 18.53 4.2 18.53 4.3 – –Level 7 .............................. 25.98 5.4 25.98 5.4 – –Level 8 .............................. 31.49 11.8 31.49 11.8 – –Level 9 .............................. 38.29 25.2 38.29 25.2 – –Not able to be leveled ........ 17.39 5.7 17.17 5.7 – –
First-line supervisors/managers ofnon-retail sales workers ........... 30.22 9.0 31.19 8.9 – –
Level 4 .............................. – – 12.64 4.9 – –Level 5 .............................. 13.23 8.4 13.23 8.4 – –Level 6 .............................. 23.14 4.6 23.14 4.6 – –Level 7 .............................. 25.64 6.1 25.64 6.1 – –Level 8 .............................. 28.24 9.1 28.24 9.1 – –Level 9 .............................. 58.08 25.4 58.08 25.4 – –Level 10 ............................. 36.95 15.7 36.95 15.7 – –Level 11 ............................. 50.63 8.6 50.63 8.6 – –Not able to be leveled ........ 33.91 8.7 33.91 8.7 – –
Retail sales workers ........................... 11.26 1.4 12.84 1.7 8.60 .8 Level 1 .............................. 7.80 1.0 8.08 1.9 7.64 1.2 Level 2 .............................. 8.70 1.0 9.62 1.8 8.01 .7 Level 3 .............................. 10.64 1.8 11.32 2.3 9.32 1.9 Level 4 .............................. 15.33 3.0 15.75 3.3 12.91 2.5 Level 5 .............................. 19.90 3.8 19.96 3.8 18.14 18.0 Level 6 .............................. 22.16 7.4 22.20 7.5 – –Level 7 .............................. 26.52 7.2 26.52 7.2 – –Level 8 .............................. 24.81 22.1 24.81 22.1 – –Not able to be leveled ........ – – – – 8.42 2.8
Cashiers, all workers ..................... 9.30 1.3 10.13 1.7 8.31 .7 Level 1 .............................. 7.81 1.2 8.01 2.5 7.67 1.0 Level 2 .............................. 8.74 1.1 9.58 2.2 8.05 .8 Level 3 .............................. 10.25 1.9 10.78 2.3 9.22 2.0 Level 4 .............................. 14.49 4.8 14.18 5.5 15.66 3.7 Level 5 .............................. 18.88 7.5 18.90 7.6 – –Not able to be leveled ........ – – – – 8.01 4.7
Cashiers ..................................... 9.19 .9 9.98 1.4 8.31 .7 Level 1 .............................. 7.82 1.2 8.02 2.5 7.67 1.0 Level 2 .............................. 8.74 1.1 9.59 2.2 8.05 .8 Level 3 .............................. 10.16 1.8 10.69 2.2 9.21 2.0 Level 4 .............................. 15.46 2.7 15.32 3.9 15.72 3.8
See footnotes at end of table.
NATIONAL COMPENSATION SURVEY
All United States 8-66 December 2006 - January 2008
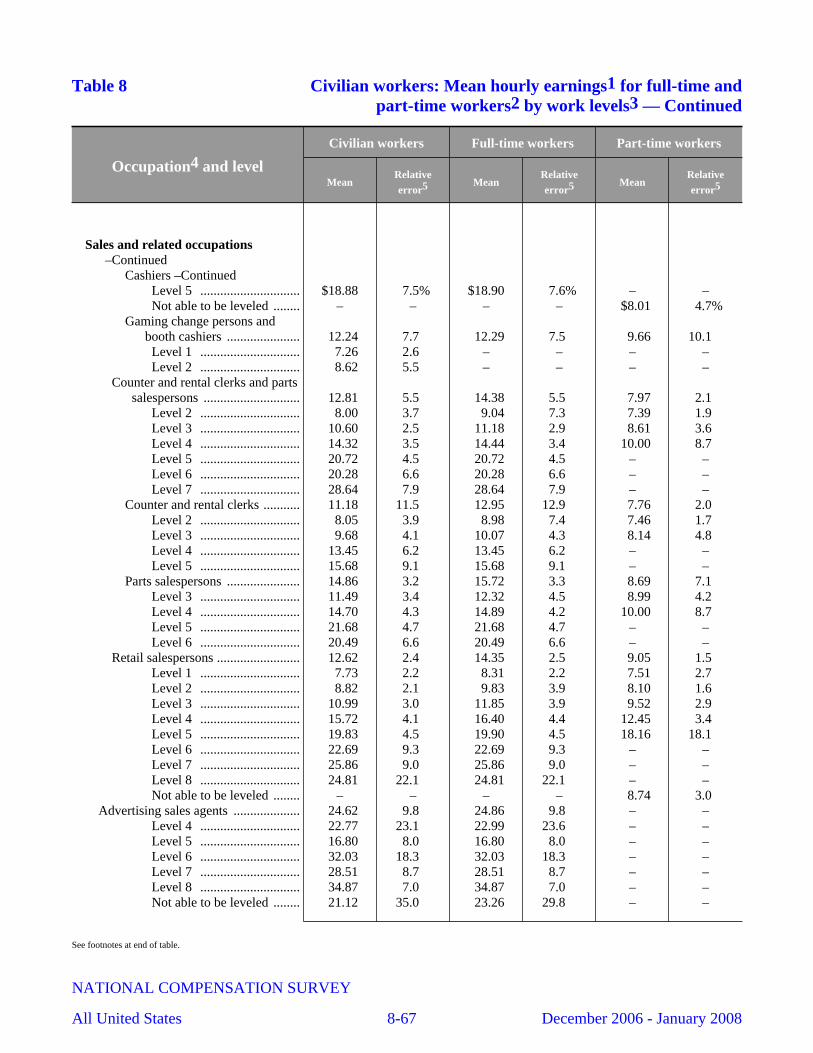
Table 8 Civilian workers: Mean hourly earnings1 for full-time andpart-time workers2 by work levels3 — Continued
Occupation4 and level
Civilian workers Full-time workers Part-time workers
MeanRelativeerror5 Mean
Relativeerror5 Mean
Relativeerror5
Sales and related occupations–Continued
Cashiers –ContinuedLevel 5 .............................. $18.88 7.5% $18.90 7.6% – –Not able to be leveled ........ – – – – $8.01 4.7%
Gaming change persons andbooth cashiers ...................... 12.24 7.7 12.29 7.5 9.66 10.1 Level 1 .............................. 7.26 2.6 – – – –Level 2 .............................. 8.62 5.5 – – – –
Counter and rental clerks and partssalespersons ............................. 12.81 5.5 14.38 5.5 7.97 2.1
Level 2 .............................. 8.00 3.7 9.04 7.3 7.39 1.9 Level 3 .............................. 10.60 2.5 11.18 2.9 8.61 3.6 Level 4 .............................. 14.32 3.5 14.44 3.4 10.00 8.7 Level 5 .............................. 20.72 4.5 20.72 4.5 – –Level 6 .............................. 20.28 6.6 20.28 6.6 – –Level 7 .............................. 28.64 7.9 28.64 7.9 – –
Counter and rental clerks ........... 11.18 11.5 12.95 12.9 7.76 2.0 Level 2 .............................. 8.05 3.9 8.98 7.4 7.46 1.7 Level 3 .............................. 9.68 4.1 10.07 4.3 8.14 4.8 Level 4 .............................. 13.45 6.2 13.45 6.2 – –Level 5 .............................. 15.68 9.1 15.68 9.1 – –
Parts salespersons ...................... 14.86 3.2 15.72 3.3 8.69 7.1 Level 3 .............................. 11.49 3.4 12.32 4.5 8.99 4.2 Level 4 .............................. 14.70 4.3 14.89 4.2 10.00 8.7 Level 5 .............................. 21.68 4.7 21.68 4.7 – –Level 6 .............................. 20.49 6.6 20.49 6.6 – –
Retail salespersons ......................... 12.62 2.4 14.35 2.5 9.05 1.5 Level 1 .............................. 7.73 2.2 8.31 2.2 7.51 2.7 Level 2 .............................. 8.82 2.1 9.83 3.9 8.10 1.6 Level 3 .............................. 10.99 3.0 11.85 3.9 9.52 2.9 Level 4 .............................. 15.72 4.1 16.40 4.4 12.45 3.4 Level 5 .............................. 19.83 4.5 19.90 4.5 18.16 18.1 Level 6 .............................. 22.69 9.3 22.69 9.3 – –Level 7 .............................. 25.86 9.0 25.86 9.0 – –Level 8 .............................. 24.81 22.1 24.81 22.1 – –Not able to be leveled ........ – – – – 8.74 3.0
Advertising sales agents .................... 24.62 9.8 24.86 9.8 – –Level 4 .............................. 22.77 23.1 22.99 23.6 – –Level 5 .............................. 16.80 8.0 16.80 8.0 – –Level 6 .............................. 32.03 18.3 32.03 18.3 – –Level 7 .............................. 28.51 8.7 28.51 8.7 – –Level 8 .............................. 34.87 7.0 34.87 7.0 – –Not able to be leveled ........ 21.12 35.0 23.26 29.8 – –
See footnotes at end of table.
NATIONAL COMPENSATION SURVEY
All United States 8-67 December 2006 - January 2008

Table 8 Civilian workers: Mean hourly earnings1 for full-time andpart-time workers2 by work levels3 — Continued
Occupation4 and level
Civilian workers Full-time workers Part-time workers
MeanRelativeerror5 Mean
Relativeerror5 Mean
Relativeerror5
Sales and related occupations–Continued
Insurance sales agents ........................ $27.43 7.6% $27.50 7.6% – –Level 4 .............................. 16.03 7.8 16.05 7.9 – –Level 5 .............................. 19.78 7.1 19.78 7.1 – –Level 6 .............................. 18.40 10.3 18.53 10.6 – –Level 7 .............................. 31.10 23.8 31.10 23.8 – –Level 8 .............................. 46.22 10.3 46.22 10.3 – –Level 9 .............................. 39.50 15.1 39.50 15.1 – –Not able to be leveled ........ 36.60 14.5 37.00 14.0 – –
Securities, commodities, andfinancial services sales agents ..... 61.87 8.3 62.55 8.3 – –
Level 4 .............................. 15.73 5.5 16.37 5.0 – –Level 5 .............................. 15.92 5.1 15.78 5.0 – –Level 6 .............................. 28.71 16.0 28.71 16.0 – –Level 7 .............................. 39.29 18.3 39.67 18.2 – –Level 8 .............................. 64.21 20.5 64.21 20.5 – –Level 9 .............................. 114.89 19.9 114.89 19.9 – –Level 10 ............................. 65.50 18.6 65.50 18.6 – –Level 11 ............................. 69.19 16.8 69.19 16.8 – –Level 12 ............................. 65.31 5.1 65.31 5.1 – –Not able to be leveled ........ 82.74 14.2 82.74 14.2 – –
Travel agents ..................................... 14.73 10.8 15.00 12.1 $11.12 2.9%Level 4 .............................. 12.82 11.2 12.92 11.2 – –Level 5 .............................. 15.95 5.2 16.77 4.4 – –
Sales representatives, wholesale andmanufacturing .............................. 31.68 5.0 31.83 5.0 12.31 11.0
Level 4 .............................. 18.47 6.3 18.52 6.3 – –Level 5 .............................. 22.51 7.7 22.64 7.7 – –Level 6 .............................. 27.34 6.3 27.33 6.4 – –Level 7 .............................. 35.25 6.6 35.25 6.6 – –Level 8 .............................. 37.77 7.3 37.77 7.3 – –Level 9 .............................. 37.95 4.1 37.95 4.1 – –Level 10 ............................. 85.28 33.4 85.28 33.4 – –Level 11 ............................. 49.05 7.3 49.05 7.3 – –Level 12 ............................. 63.84 6.0 63.84 6.0 – –Not able to be leveled ........ 29.04 10.3 29.70 10.1 – –
Sales representatives, wholesaleand manufacturing, technicaland scientific products ............. 41.62 13.2 41.70 13.2 – –
Level 4 .............................. 14.47 7.9 14.47 7.9 – –Level 5 .............................. 24.83 9.3 25.21 9.2 – –Level 6 .............................. 30.81 28.9 30.81 28.9 – –Level 7 .............................. 39.19 8.9 39.19 8.9 – –
See footnotes at end of table.
NATIONAL COMPENSATION SURVEY
All United States 8-68 December 2006 - January 2008
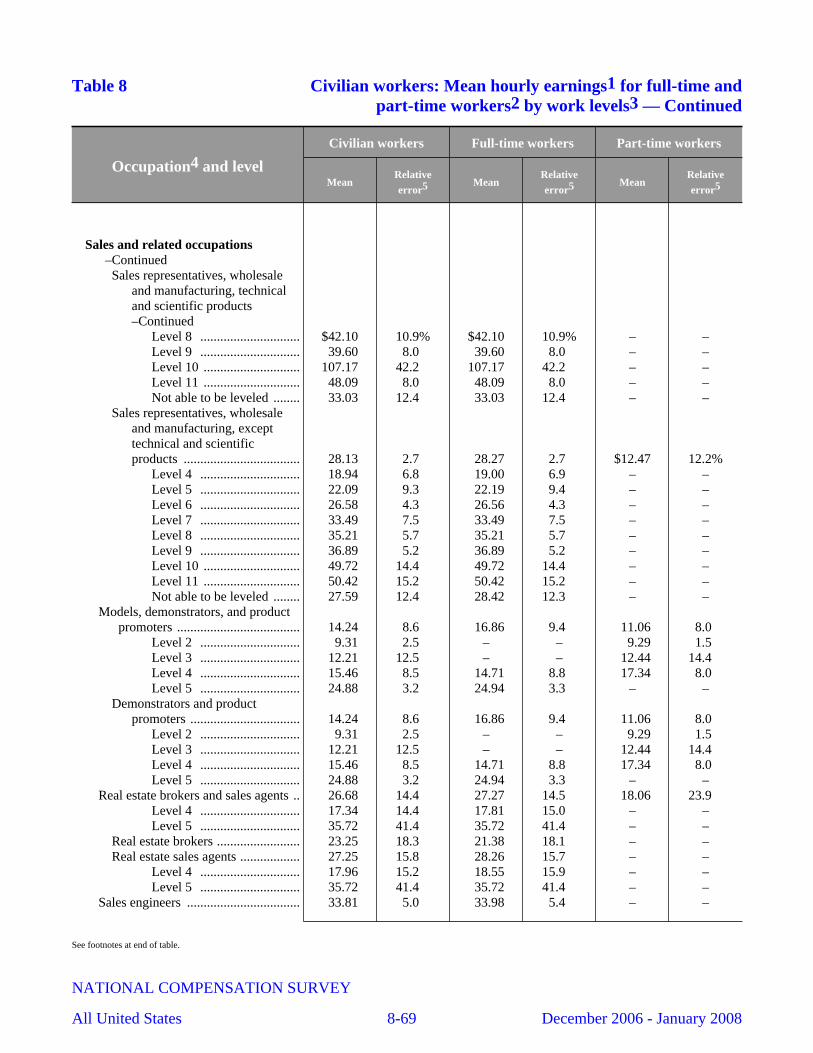
Table 8 Civilian workers: Mean hourly earnings1 for full-time andpart-time workers2 by work levels3 — Continued
Occupation4 and level
Civilian workers Full-time workers Part-time workers
MeanRelativeerror5 Mean
Relativeerror5 Mean
Relativeerror5
Sales and related occupations–ContinuedSales representatives, wholesale
and manufacturing, technicaland scientific products–Continued
Level 8 .............................. $42.10 10.9% $42.10 10.9% – –Level 9 .............................. 39.60 8.0 39.60 8.0 – –Level 10 ............................. 107.17 42.2 107.17 42.2 – –Level 11 ............................. 48.09 8.0 48.09 8.0 – –Not able to be leveled ........ 33.03 12.4 33.03 12.4 – –
Sales representatives, wholesaleand manufacturing, excepttechnical and scientificproducts ................................... 28.13 2.7 28.27 2.7 $12.47 12.2%
Level 4 .............................. 18.94 6.8 19.00 6.9 – –Level 5 .............................. 22.09 9.3 22.19 9.4 – –Level 6 .............................. 26.58 4.3 26.56 4.3 – –Level 7 .............................. 33.49 7.5 33.49 7.5 – –Level 8 .............................. 35.21 5.7 35.21 5.7 – –Level 9 .............................. 36.89 5.2 36.89 5.2 – –Level 10 ............................. 49.72 14.4 49.72 14.4 – –Level 11 ............................. 50.42 15.2 50.42 15.2 – –Not able to be leveled ........ 27.59 12.4 28.42 12.3 – –
Models, demonstrators, and productpromoters ..................................... 14.24 8.6 16.86 9.4 11.06 8.0
Level 2 .............................. 9.31 2.5 – – 9.29 1.5 Level 3 .............................. 12.21 12.5 – – 12.44 14.4 Level 4 .............................. 15.46 8.5 14.71 8.8 17.34 8.0 Level 5 .............................. 24.88 3.2 24.94 3.3 – –
Demonstrators and productpromoters ................................. 14.24 8.6 16.86 9.4 11.06 8.0
Level 2 .............................. 9.31 2.5 – – 9.29 1.5 Level 3 .............................. 12.21 12.5 – – 12.44 14.4 Level 4 .............................. 15.46 8.5 14.71 8.8 17.34 8.0 Level 5 .............................. 24.88 3.2 24.94 3.3 – –
Real estate brokers and sales agents .. 26.68 14.4 27.27 14.5 18.06 23.9 Level 4 .............................. 17.34 14.4 17.81 15.0 – –Level 5 .............................. 35.72 41.4 35.72 41.4 – –
Real estate brokers ......................... 23.25 18.3 21.38 18.1 – –Real estate sales agents .................. 27.25 15.8 28.26 15.7 – –
Level 4 .............................. 17.96 15.2 18.55 15.9 – –Level 5 .............................. 35.72 41.4 35.72 41.4 – –
Sales engineers .................................. 33.81 5.0 33.98 5.4 – –
See footnotes at end of table.
NATIONAL COMPENSATION SURVEY
All United States 8-69 December 2006 - January 2008
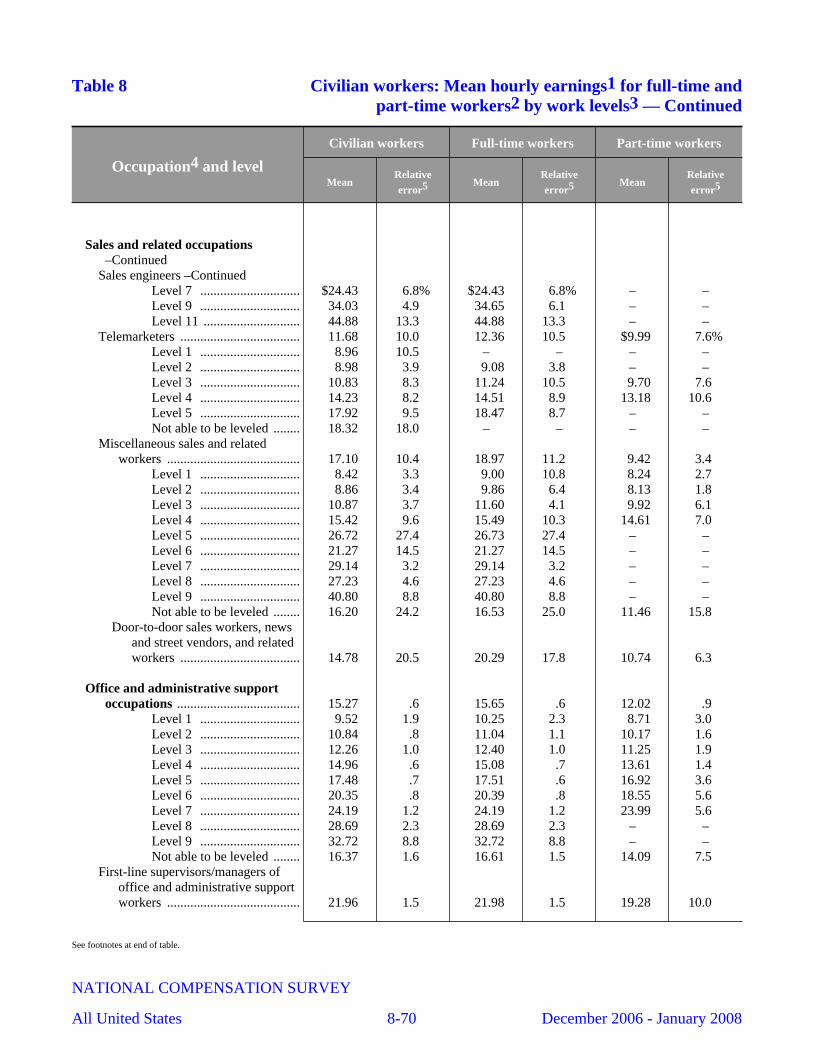
Table 8 Civilian workers: Mean hourly earnings1 for full-time andpart-time workers2 by work levels3 — Continued
Occupation4 and level
Civilian workers Full-time workers Part-time workers
MeanRelativeerror5 Mean
Relativeerror5 Mean
Relativeerror5
Sales and related occupations–Continued
Sales engineers –ContinuedLevel 7 .............................. $24.43 6.8% $24.43 6.8% – –Level 9 .............................. 34.03 4.9 34.65 6.1 – –Level 11 ............................. 44.88 13.3 44.88 13.3 – –
Telemarketers .................................... 11.68 10.0 12.36 10.5 $9.99 7.6%Level 1 .............................. 8.96 10.5 – – – –Level 2 .............................. 8.98 3.9 9.08 3.8 – –Level 3 .............................. 10.83 8.3 11.24 10.5 9.70 7.6 Level 4 .............................. 14.23 8.2 14.51 8.9 13.18 10.6 Level 5 .............................. 17.92 9.5 18.47 8.7 – –Not able to be leveled ........ 18.32 18.0 – – – –
Miscellaneous sales and relatedworkers ........................................ 17.10 10.4 18.97 11.2 9.42 3.4
Level 1 .............................. 8.42 3.3 9.00 10.8 8.24 2.7 Level 2 .............................. 8.86 3.4 9.86 6.4 8.13 1.8 Level 3 .............................. 10.87 3.7 11.60 4.1 9.92 6.1 Level 4 .............................. 15.42 9.6 15.49 10.3 14.61 7.0 Level 5 .............................. 26.72 27.4 26.73 27.4 – –Level 6 .............................. 21.27 14.5 21.27 14.5 – –Level 7 .............................. 29.14 3.2 29.14 3.2 – –Level 8 .............................. 27.23 4.6 27.23 4.6 – –Level 9 .............................. 40.80 8.8 40.80 8.8 – –Not able to be leveled ........ 16.20 24.2 16.53 25.0 11.46 15.8
Door-to-door sales workers, newsand street vendors, and relatedworkers .................................... 14.78 20.5 20.29 17.8 10.74 6.3
Office and administrative supportoccupations ..................................... 15.27 .6 15.65 .6 12.02 .9
Level 1 .............................. 9.52 1.9 10.25 2.3 8.71 3.0 Level 2 .............................. 10.84 .8 11.04 1.1 10.17 1.6 Level 3 .............................. 12.26 1.0 12.40 1.0 11.25 1.9 Level 4 .............................. 14.96 .6 15.08 .7 13.61 1.4 Level 5 .............................. 17.48 .7 17.51 .6 16.92 3.6 Level 6 .............................. 20.35 .8 20.39 .8 18.55 5.6 Level 7 .............................. 24.19 1.2 24.19 1.2 23.99 5.6 Level 8 .............................. 28.69 2.3 28.69 2.3 – –Level 9 .............................. 32.72 8.8 32.72 8.8 – –Not able to be leveled ........ 16.37 1.6 16.61 1.5 14.09 7.5
First-line supervisors/managers ofoffice and administrative supportworkers ........................................ 21.96 1.5 21.98 1.5 19.28 10.0
See footnotes at end of table.
NATIONAL COMPENSATION SURVEY
All United States 8-70 December 2006 - January 2008
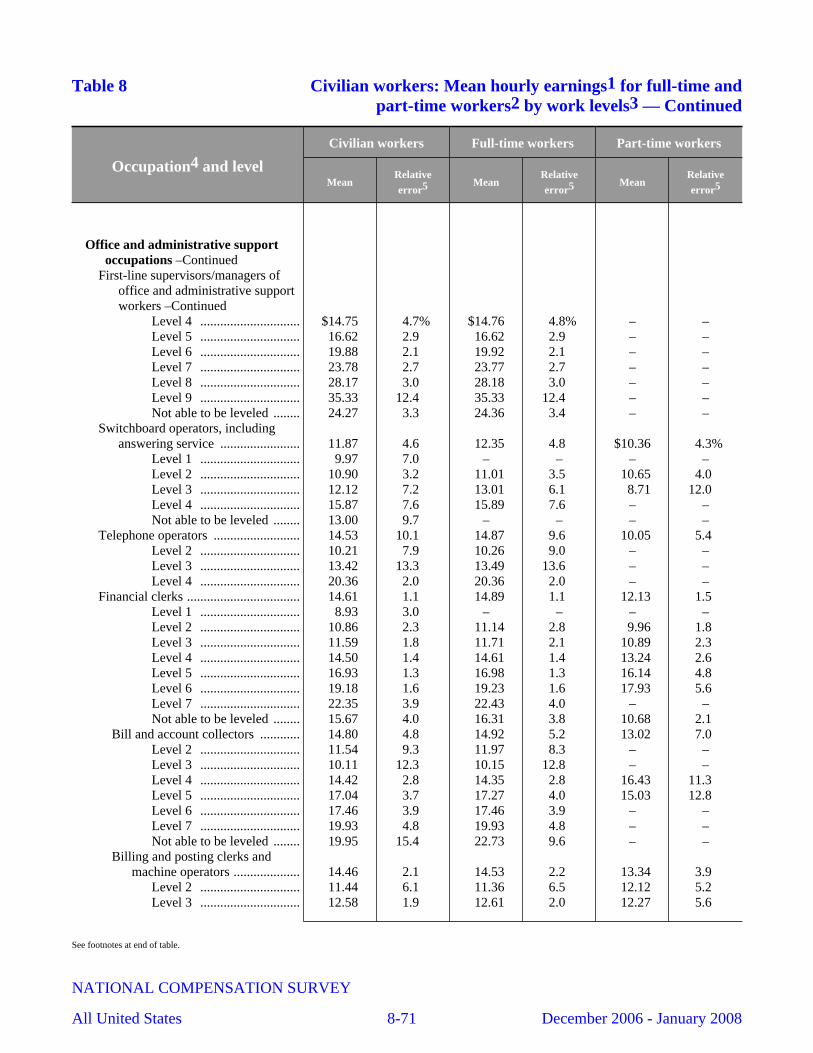
Table 8 Civilian workers: Mean hourly earnings1 for full-time andpart-time workers2 by work levels3 — Continued
Occupation4 and level
Civilian workers Full-time workers Part-time workers
MeanRelativeerror5 Mean
Relativeerror5 Mean
Relativeerror5
Office and administrative supportoccupations –Continued
First-line supervisors/managers ofoffice and administrative supportworkers –Continued
Level 4 .............................. $14.75 4.7% $14.76 4.8% – –Level 5 .............................. 16.62 2.9 16.62 2.9 – –Level 6 .............................. 19.88 2.1 19.92 2.1 – –Level 7 .............................. 23.78 2.7 23.77 2.7 – –Level 8 .............................. 28.17 3.0 28.18 3.0 – –Level 9 .............................. 35.33 12.4 35.33 12.4 – –Not able to be leveled ........ 24.27 3.3 24.36 3.4 – –
Switchboard operators, includinganswering service ........................ 11.87 4.6 12.35 4.8 $10.36 4.3%
Level 1 .............................. 9.97 7.0 – – – –Level 2 .............................. 10.90 3.2 11.01 3.5 10.65 4.0 Level 3 .............................. 12.12 7.2 13.01 6.1 8.71 12.0 Level 4 .............................. 15.87 7.6 15.89 7.6 – –Not able to be leveled ........ 13.00 9.7 – – – –
Telephone operators .......................... 14.53 10.1 14.87 9.6 10.05 5.4 Level 2 .............................. 10.21 7.9 10.26 9.0 – –Level 3 .............................. 13.42 13.3 13.49 13.6 – –Level 4 .............................. 20.36 2.0 20.36 2.0 – –
Financial clerks .................................. 14.61 1.1 14.89 1.1 12.13 1.5 Level 1 .............................. 8.93 3.0 – – – –Level 2 .............................. 10.86 2.3 11.14 2.8 9.96 1.8 Level 3 .............................. 11.59 1.8 11.71 2.1 10.89 2.3 Level 4 .............................. 14.50 1.4 14.61 1.4 13.24 2.6 Level 5 .............................. 16.93 1.3 16.98 1.3 16.14 4.8 Level 6 .............................. 19.18 1.6 19.23 1.6 17.93 5.6 Level 7 .............................. 22.35 3.9 22.43 4.0 – –Not able to be leveled ........ 15.67 4.0 16.31 3.8 10.68 2.1
Bill and account collectors ............ 14.80 4.8 14.92 5.2 13.02 7.0 Level 2 .............................. 11.54 9.3 11.97 8.3 – –Level 3 .............................. 10.11 12.3 10.15 12.8 – –Level 4 .............................. 14.42 2.8 14.35 2.8 16.43 11.3 Level 5 .............................. 17.04 3.7 17.27 4.0 15.03 12.8 Level 6 .............................. 17.46 3.9 17.46 3.9 – –Level 7 .............................. 19.93 4.8 19.93 4.8 – –Not able to be leveled ........ 19.95 15.4 22.73 9.6 – –
Billing and posting clerks andmachine operators .................... 14.46 2.1 14.53 2.2 13.34 3.9
Level 2 .............................. 11.44 6.1 11.36 6.5 12.12 5.2 Level 3 .............................. 12.58 1.9 12.61 2.0 12.27 5.6
See footnotes at end of table.
NATIONAL COMPENSATION SURVEY
All United States 8-71 December 2006 - January 2008
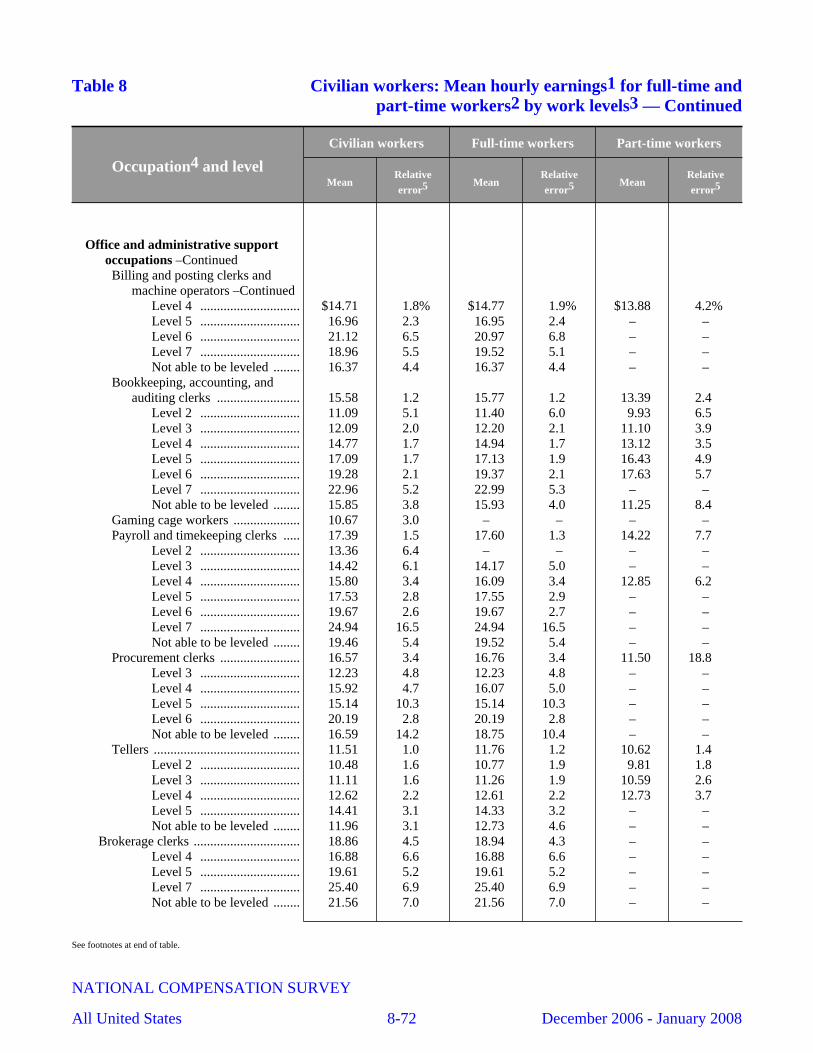
Table 8 Civilian workers: Mean hourly earnings1 for full-time andpart-time workers2 by work levels3 — Continued
Occupation4 and level
Civilian workers Full-time workers Part-time workers
MeanRelativeerror5 Mean
Relativeerror5 Mean
Relativeerror5
Office and administrative supportoccupations –ContinuedBilling and posting clerks and
machine operators –ContinuedLevel 4 .............................. $14.71 1.8% $14.77 1.9% $13.88 4.2%Level 5 .............................. 16.96 2.3 16.95 2.4 – –Level 6 .............................. 21.12 6.5 20.97 6.8 – –Level 7 .............................. 18.96 5.5 19.52 5.1 – –Not able to be leveled ........ 16.37 4.4 16.37 4.4 – –
Bookkeeping, accounting, andauditing clerks ......................... 15.58 1.2 15.77 1.2 13.39 2.4
Level 2 .............................. 11.09 5.1 11.40 6.0 9.93 6.5 Level 3 .............................. 12.09 2.0 12.20 2.1 11.10 3.9 Level 4 .............................. 14.77 1.7 14.94 1.7 13.12 3.5 Level 5 .............................. 17.09 1.7 17.13 1.9 16.43 4.9 Level 6 .............................. 19.28 2.1 19.37 2.1 17.63 5.7 Level 7 .............................. 22.96 5.2 22.99 5.3 – –Not able to be leveled ........ 15.85 3.8 15.93 4.0 11.25 8.4
Gaming cage workers .................... 10.67 3.0 – – – –Payroll and timekeeping clerks ..... 17.39 1.5 17.60 1.3 14.22 7.7
Level 2 .............................. 13.36 6.4 – – – –Level 3 .............................. 14.42 6.1 14.17 5.0 – –Level 4 .............................. 15.80 3.4 16.09 3.4 12.85 6.2 Level 5 .............................. 17.53 2.8 17.55 2.9 – –Level 6 .............................. 19.67 2.6 19.67 2.7 – –Level 7 .............................. 24.94 16.5 24.94 16.5 – –Not able to be leveled ........ 19.46 5.4 19.52 5.4 – –
Procurement clerks ........................ 16.57 3.4 16.76 3.4 11.50 18.8 Level 3 .............................. 12.23 4.8 12.23 4.8 – –Level 4 .............................. 15.92 4.7 16.07 5.0 – –Level 5 .............................. 15.14 10.3 15.14 10.3 – –Level 6 .............................. 20.19 2.8 20.19 2.8 – –Not able to be leveled ........ 16.59 14.2 18.75 10.4 – –
Tellers ............................................ 11.51 1.0 11.76 1.2 10.62 1.4 Level 2 .............................. 10.48 1.6 10.77 1.9 9.81 1.8 Level 3 .............................. 11.11 1.6 11.26 1.9 10.59 2.6 Level 4 .............................. 12.62 2.2 12.61 2.2 12.73 3.7 Level 5 .............................. 14.41 3.1 14.33 3.2 – –Not able to be leveled ........ 11.96 3.1 12.73 4.6 – –
Brokerage clerks ................................ 18.86 4.5 18.94 4.3 – –Level 4 .............................. 16.88 6.6 16.88 6.6 – –Level 5 .............................. 19.61 5.2 19.61 5.2 – –Level 7 .............................. 25.40 6.9 25.40 6.9 – –Not able to be leveled ........ 21.56 7.0 21.56 7.0 – –
See footnotes at end of table.
NATIONAL COMPENSATION SURVEY
All United States 8-72 December 2006 - January 2008

Table 8 Civilian workers: Mean hourly earnings1 for full-time andpart-time workers2 by work levels3 — Continued
Occupation4 and level
Civilian workers Full-time workers Part-time workers
MeanRelativeerror5 Mean
Relativeerror5 Mean
Relativeerror5
Office and administrative supportoccupations –Continued
Correspondence clerks ....................... $15.53 6.5% $16.27 4.2% – –Level 4 .............................. 16.55 5.4 16.55 5.4 – –Level 5 .............................. 17.96 7.9 17.96 7.9 – –Not able to be leveled ........ 16.62 11.9 17.51 14.2 – –
Court, municipal, and license clerks .. 16.27 3.1 16.35 2.9 $15.13 19.9%Level 3 .............................. 11.13 7.9 11.86 6.1 8.36 10.2 Level 4 .............................. 13.26 2.2 13.20 2.2 14.27 10.0 Level 5 .............................. 17.40 2.7 17.48 2.8 15.45 6.8 Level 6 .............................. 20.65 8.6 19.25 5.8 – –Not able to be leveled ........ 18.43 4.8 18.62 4.8 – –
Credit authorizers, checkers, andclerks ............................................ 15.31 5.8 14.78 3.8 – –
Level 3 .............................. 11.60 5.6 11.35 2.8 – –Level 4 .............................. 14.28 4.1 14.26 4.1 – –Level 5 .............................. 14.74 5.3 14.74 5.3 – –Level 6 .............................. 17.67 5.6 17.68 5.6 – –Not able to be leveled ........ 21.99 15.4 17.08 6.8 – –
Customer service representatives ...... 15.52 1.7 15.79 1.8 11.72 3.2 Level 1 .............................. 8.81 7.2 – – 7.68 6.1 Level 2 .............................. 10.84 6.1 11.02 7.4 10.01 5.5 Level 3 .............................. 11.86 3.2 11.99 3.6 10.10 3.4 Level 4 .............................. 15.55 2.4 15.69 2.5 12.53 4.7 Level 5 .............................. 17.90 2.9 17.97 3.0 15.11 4.1 Level 6 .............................. 21.26 2.3 21.29 2.3 19.92 6.3 Level 7 .............................. 22.88 4.8 22.81 4.7 – –Level 8 .............................. 27.20 9.7 27.20 9.7 – –Not able to be leveled ........ 15.30 3.5 15.65 3.4 12.63 6.3
Eligibility interviewers, governmentprograms ...................................... 16.84 2.4 16.88 2.3 – –
Level 3 .............................. 10.47 11.6 10.47 11.6 – –Level 4 .............................. 13.58 5.4 13.86 4.7 – –Level 5 .............................. 15.68 2.4 15.68 2.4 – –Level 6 .............................. 18.90 2.3 18.90 2.3 – –Level 7 .............................. 19.55 4.3 19.55 4.3 – –Not able to be leveled ........ 18.03 10.6 17.77 10.9 – –
File clerks .......................................... 12.14 4.0 12.83 3.9 10.30 4.5 Level 1 .............................. 9.98 8.0 11.22 10.2 8.55 3.0 Level 2 .............................. 10.81 3.8 11.10 3.2 10.39 7.9 Level 3 .............................. 12.28 3.2 12.56 4.0 11.43 6.7 Level 4 .............................. 15.62 2.0 15.59 2.3 – –Level 5 .............................. 13.83 14.9 13.83 14.9 – –Not able to be leveled ........ 12.36 8.7 12.43 8.7 – –
See footnotes at end of table.
NATIONAL COMPENSATION SURVEY
All United States 8-73 December 2006 - January 2008
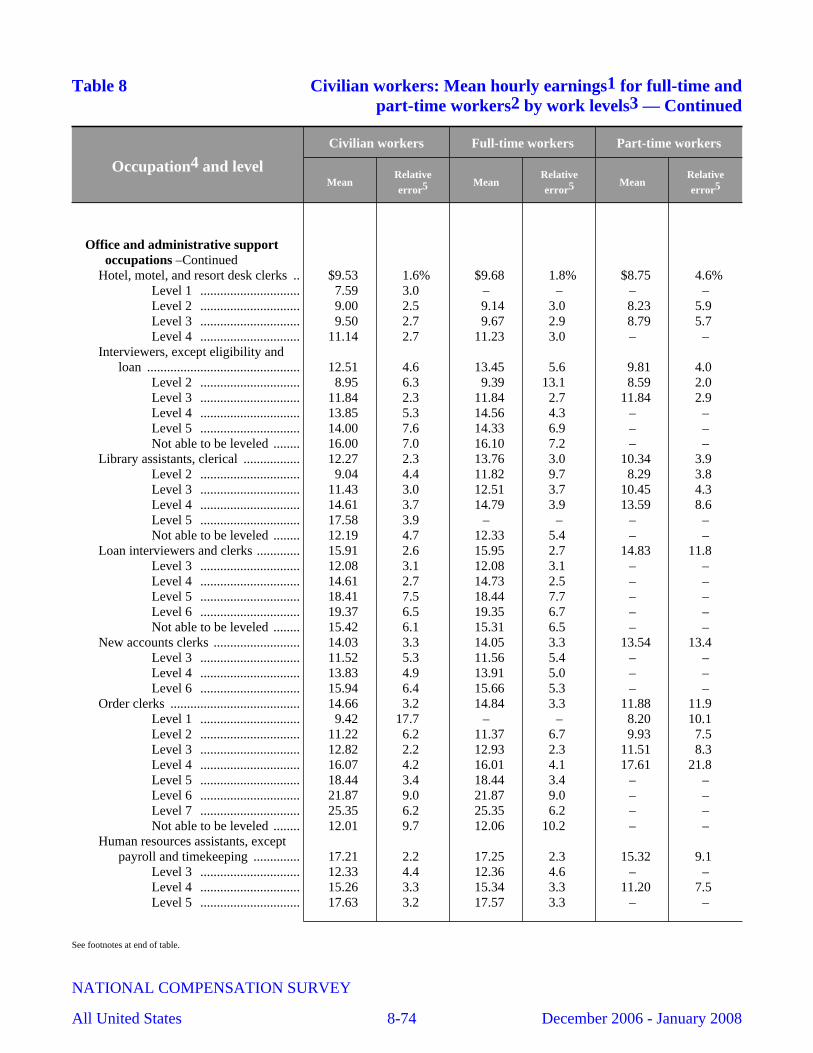
Table 8 Civilian workers: Mean hourly earnings1 for full-time andpart-time workers2 by work levels3 — Continued
Occupation4 and level
Civilian workers Full-time workers Part-time workers
MeanRelativeerror5 Mean
Relativeerror5 Mean
Relativeerror5
Office and administrative supportoccupations –Continued
Hotel, motel, and resort desk clerks .. $9.53 1.6% $9.68 1.8% $8.75 4.6%Level 1 .............................. 7.59 3.0 – – – –Level 2 .............................. 9.00 2.5 9.14 3.0 8.23 5.9 Level 3 .............................. 9.50 2.7 9.67 2.9 8.79 5.7 Level 4 .............................. 11.14 2.7 11.23 3.0 – –
Interviewers, except eligibility andloan .............................................. 12.51 4.6 13.45 5.6 9.81 4.0
Level 2 .............................. 8.95 6.3 9.39 13.1 8.59 2.0 Level 3 .............................. 11.84 2.3 11.84 2.7 11.84 2.9 Level 4 .............................. 13.85 5.3 14.56 4.3 – –Level 5 .............................. 14.00 7.6 14.33 6.9 – –Not able to be leveled ........ 16.00 7.0 16.10 7.2 – –
Library assistants, clerical ................. 12.27 2.3 13.76 3.0 10.34 3.9 Level 2 .............................. 9.04 4.4 11.82 9.7 8.29 3.8 Level 3 .............................. 11.43 3.0 12.51 3.7 10.45 4.3 Level 4 .............................. 14.61 3.7 14.79 3.9 13.59 8.6 Level 5 .............................. 17.58 3.9 – – – –Not able to be leveled ........ 12.19 4.7 12.33 5.4 – –
Loan interviewers and clerks ............. 15.91 2.6 15.95 2.7 14.83 11.8 Level 3 .............................. 12.08 3.1 12.08 3.1 – –Level 4 .............................. 14.61 2.7 14.73 2.5 – –Level 5 .............................. 18.41 7.5 18.44 7.7 – –Level 6 .............................. 19.37 6.5 19.35 6.7 – –Not able to be leveled ........ 15.42 6.1 15.31 6.5 – –
New accounts clerks .......................... 14.03 3.3 14.05 3.3 13.54 13.4 Level 3 .............................. 11.52 5.3 11.56 5.4 – –Level 4 .............................. 13.83 4.9 13.91 5.0 – –Level 6 .............................. 15.94 6.4 15.66 5.3 – –
Order clerks ....................................... 14.66 3.2 14.84 3.3 11.88 11.9 Level 1 .............................. 9.42 17.7 – – 8.20 10.1 Level 2 .............................. 11.22 6.2 11.37 6.7 9.93 7.5 Level 3 .............................. 12.82 2.2 12.93 2.3 11.51 8.3 Level 4 .............................. 16.07 4.2 16.01 4.1 17.61 21.8 Level 5 .............................. 18.44 3.4 18.44 3.4 – –Level 6 .............................. 21.87 9.0 21.87 9.0 – –Level 7 .............................. 25.35 6.2 25.35 6.2 – –Not able to be leveled ........ 12.01 9.7 12.06 10.2 – –
Human resources assistants, exceptpayroll and timekeeping .............. 17.21 2.2 17.25 2.3 15.32 9.1
Level 3 .............................. 12.33 4.4 12.36 4.6 – –Level 4 .............................. 15.26 3.3 15.34 3.3 11.20 7.5 Level 5 .............................. 17.63 3.2 17.57 3.3 – –
See footnotes at end of table.
NATIONAL COMPENSATION SURVEY
All United States 8-74 December 2006 - January 2008
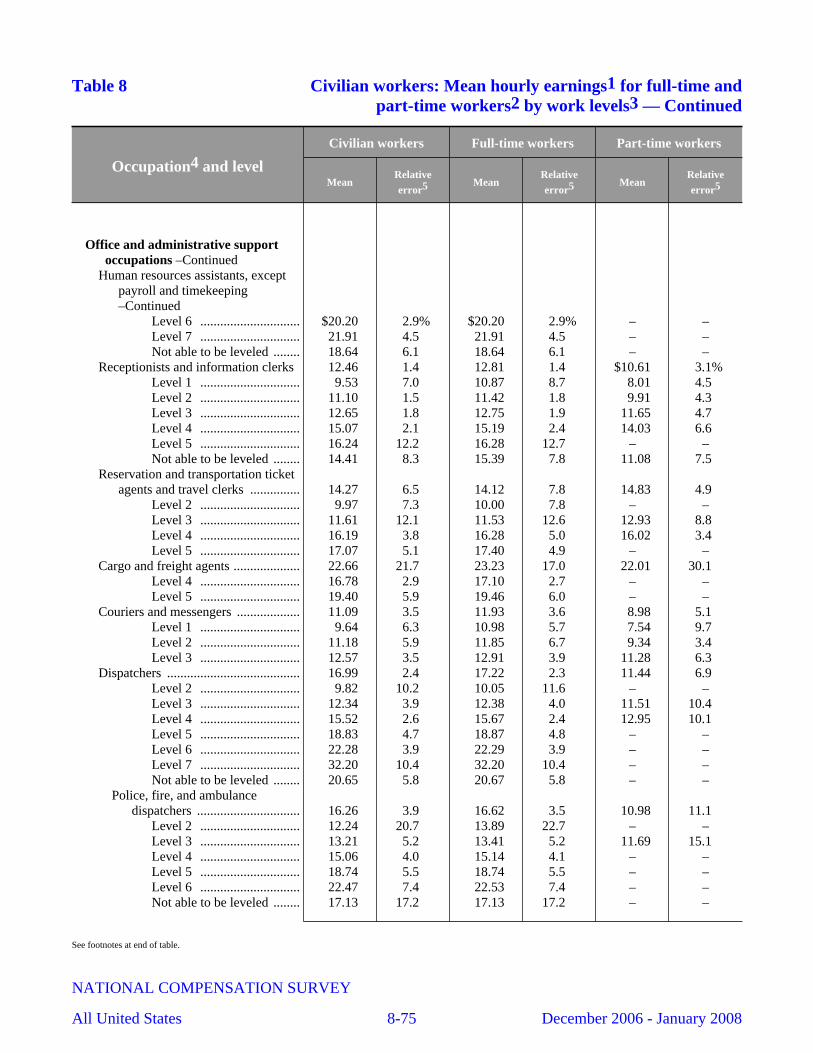
Table 8 Civilian workers: Mean hourly earnings1 for full-time andpart-time workers2 by work levels3 — Continued
Occupation4 and level
Civilian workers Full-time workers Part-time workers
MeanRelativeerror5 Mean
Relativeerror5 Mean
Relativeerror5
Office and administrative supportoccupations –Continued
Human resources assistants, exceptpayroll and timekeeping–Continued
Level 6 .............................. $20.20 2.9% $20.20 2.9% – –Level 7 .............................. 21.91 4.5 21.91 4.5 – –Not able to be leveled ........ 18.64 6.1 18.64 6.1 – –
Receptionists and information clerks 12.46 1.4 12.81 1.4 $10.61 3.1%Level 1 .............................. 9.53 7.0 10.87 8.7 8.01 4.5 Level 2 .............................. 11.10 1.5 11.42 1.8 9.91 4.3 Level 3 .............................. 12.65 1.8 12.75 1.9 11.65 4.7 Level 4 .............................. 15.07 2.1 15.19 2.4 14.03 6.6 Level 5 .............................. 16.24 12.2 16.28 12.7 – –Not able to be leveled ........ 14.41 8.3 15.39 7.8 11.08 7.5
Reservation and transportation ticketagents and travel clerks ............... 14.27 6.5 14.12 7.8 14.83 4.9
Level 2 .............................. 9.97 7.3 10.00 7.8 – –Level 3 .............................. 11.61 12.1 11.53 12.6 12.93 8.8 Level 4 .............................. 16.19 3.8 16.28 5.0 16.02 3.4 Level 5 .............................. 17.07 5.1 17.40 4.9 – –
Cargo and freight agents .................... 22.66 21.7 23.23 17.0 22.01 30.1 Level 4 .............................. 16.78 2.9 17.10 2.7 – –Level 5 .............................. 19.40 5.9 19.46 6.0 – –
Couriers and messengers ................... 11.09 3.5 11.93 3.6 8.98 5.1 Level 1 .............................. 9.64 6.3 10.98 5.7 7.54 9.7 Level 2 .............................. 11.18 5.9 11.85 6.7 9.34 3.4 Level 3 .............................. 12.57 3.5 12.91 3.9 11.28 6.3
Dispatchers ........................................ 16.99 2.4 17.22 2.3 11.44 6.9 Level 2 .............................. 9.82 10.2 10.05 11.6 – –Level 3 .............................. 12.34 3.9 12.38 4.0 11.51 10.4 Level 4 .............................. 15.52 2.6 15.67 2.4 12.95 10.1 Level 5 .............................. 18.83 4.7 18.87 4.8 – –Level 6 .............................. 22.28 3.9 22.29 3.9 – –Level 7 .............................. 32.20 10.4 32.20 10.4 – –Not able to be leveled ........ 20.65 5.8 20.67 5.8 – –
Police, fire, and ambulancedispatchers ............................... 16.26 3.9 16.62 3.5 10.98 11.1
Level 2 .............................. 12.24 20.7 13.89 22.7 – –Level 3 .............................. 13.21 5.2 13.41 5.2 11.69 15.1 Level 4 .............................. 15.06 4.0 15.14 4.1 – –Level 5 .............................. 18.74 5.5 18.74 5.5 – –Level 6 .............................. 22.47 7.4 22.53 7.4 – –Not able to be leveled ........ 17.13 17.2 17.13 17.2 – –
See footnotes at end of table.
NATIONAL COMPENSATION SURVEY
All United States 8-75 December 2006 - January 2008
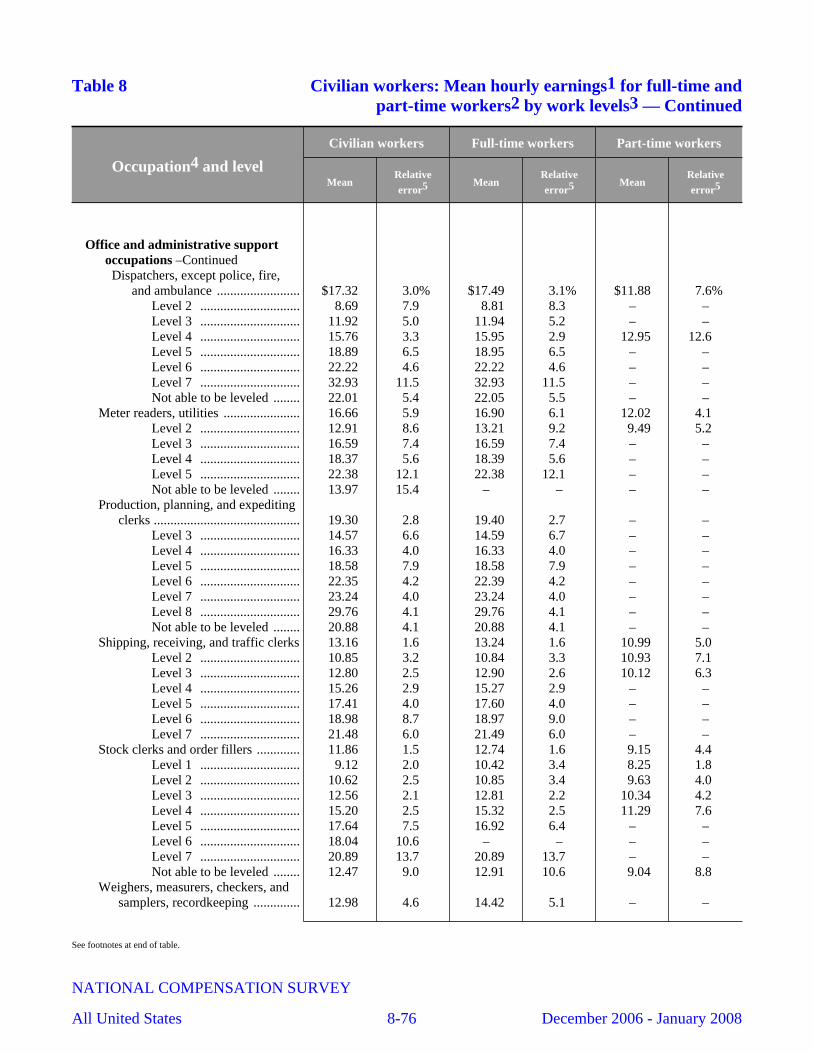
Table 8 Civilian workers: Mean hourly earnings1 for full-time andpart-time workers2 by work levels3 — Continued
Occupation4 and level
Civilian workers Full-time workers Part-time workers
MeanRelativeerror5 Mean
Relativeerror5 Mean
Relativeerror5
Office and administrative supportoccupations –ContinuedDispatchers, except police, fire,
and ambulance ......................... $17.32 3.0% $17.49 3.1% $11.88 7.6%Level 2 .............................. 8.69 7.9 8.81 8.3 – –Level 3 .............................. 11.92 5.0 11.94 5.2 – –Level 4 .............................. 15.76 3.3 15.95 2.9 12.95 12.6 Level 5 .............................. 18.89 6.5 18.95 6.5 – –Level 6 .............................. 22.22 4.6 22.22 4.6 – –Level 7 .............................. 32.93 11.5 32.93 11.5 – –Not able to be leveled ........ 22.01 5.4 22.05 5.5 – –
Meter readers, utilities ....................... 16.66 5.9 16.90 6.1 12.02 4.1 Level 2 .............................. 12.91 8.6 13.21 9.2 9.49 5.2 Level 3 .............................. 16.59 7.4 16.59 7.4 – –Level 4 .............................. 18.37 5.6 18.39 5.6 – –Level 5 .............................. 22.38 12.1 22.38 12.1 – –Not able to be leveled ........ 13.97 15.4 – – – –
Production, planning, and expeditingclerks ............................................ 19.30 2.8 19.40 2.7 – –
Level 3 .............................. 14.57 6.6 14.59 6.7 – –Level 4 .............................. 16.33 4.0 16.33 4.0 – –Level 5 .............................. 18.58 7.9 18.58 7.9 – –Level 6 .............................. 22.35 4.2 22.39 4.2 – –Level 7 .............................. 23.24 4.0 23.24 4.0 – –Level 8 .............................. 29.76 4.1 29.76 4.1 – –Not able to be leveled ........ 20.88 4.1 20.88 4.1 – –
Shipping, receiving, and traffic clerks 13.16 1.6 13.24 1.6 10.99 5.0 Level 2 .............................. 10.85 3.2 10.84 3.3 10.93 7.1 Level 3 .............................. 12.80 2.5 12.90 2.6 10.12 6.3 Level 4 .............................. 15.26 2.9 15.27 2.9 – –Level 5 .............................. 17.41 4.0 17.60 4.0 – –Level 6 .............................. 18.98 8.7 18.97 9.0 – –Level 7 .............................. 21.48 6.0 21.49 6.0 – –
Stock clerks and order fillers ............. 11.86 1.5 12.74 1.6 9.15 4.4 Level 1 .............................. 9.12 2.0 10.42 3.4 8.25 1.8 Level 2 .............................. 10.62 2.5 10.85 3.4 9.63 4.0 Level 3 .............................. 12.56 2.1 12.81 2.2 10.34 4.2 Level 4 .............................. 15.20 2.5 15.32 2.5 11.29 7.6 Level 5 .............................. 17.64 7.5 16.92 6.4 – –Level 6 .............................. 18.04 10.6 – – – –Level 7 .............................. 20.89 13.7 20.89 13.7 – –Not able to be leveled ........ 12.47 9.0 12.91 10.6 9.04 8.8
Weighers, measurers, checkers, andsamplers, recordkeeping .............. 12.98 4.6 14.42 5.1 – –
See footnotes at end of table.
NATIONAL COMPENSATION SURVEY
All United States 8-76 December 2006 - January 2008
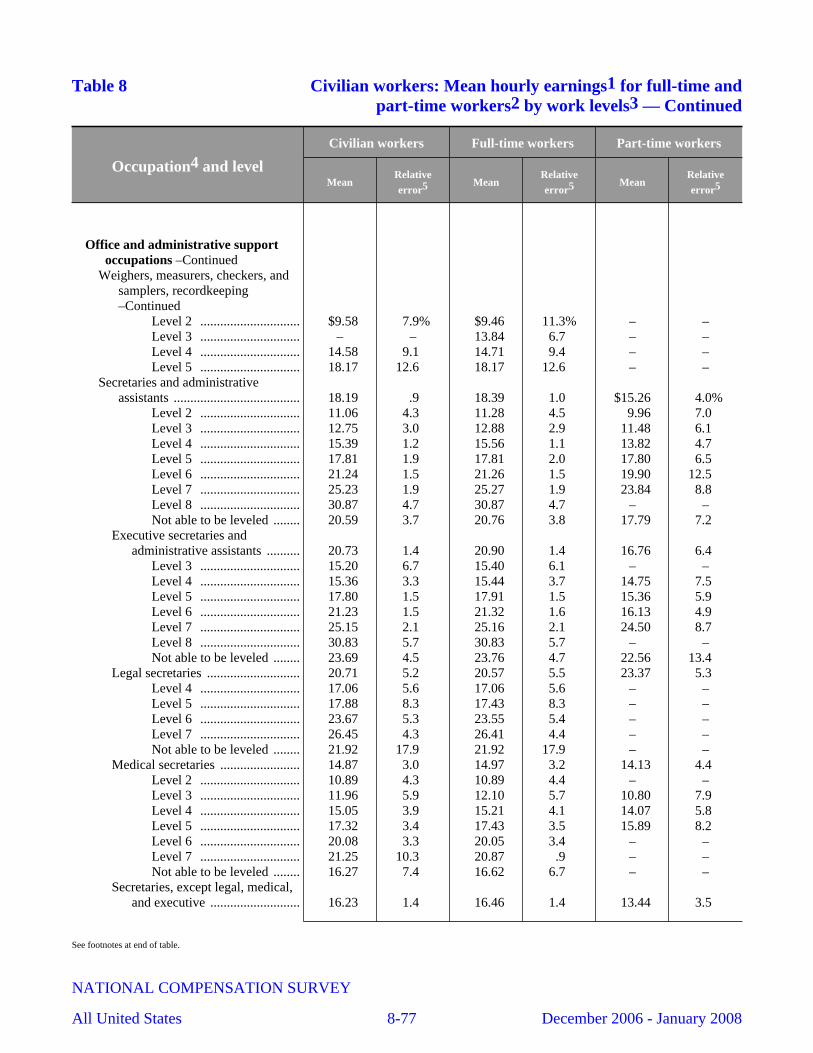
Table 8 Civilian workers: Mean hourly earnings1 for full-time andpart-time workers2 by work levels3 — Continued
Occupation4 and level
Civilian workers Full-time workers Part-time workers
MeanRelativeerror5 Mean
Relativeerror5 Mean
Relativeerror5
Office and administrative supportoccupations –Continued
Weighers, measurers, checkers, andsamplers, recordkeeping–Continued
Level 2 .............................. $9.58 7.9% $9.46 11.3% – –Level 3 .............................. – – 13.84 6.7 – –Level 4 .............................. 14.58 9.1 14.71 9.4 – –Level 5 .............................. 18.17 12.6 18.17 12.6 – –
Secretaries and administrativeassistants ...................................... 18.19 .9 18.39 1.0 $15.26 4.0%
Level 2 .............................. 11.06 4.3 11.28 4.5 9.96 7.0 Level 3 .............................. 12.75 3.0 12.88 2.9 11.48 6.1 Level 4 .............................. 15.39 1.2 15.56 1.1 13.82 4.7 Level 5 .............................. 17.81 1.9 17.81 2.0 17.80 6.5 Level 6 .............................. 21.24 1.5 21.26 1.5 19.90 12.5 Level 7 .............................. 25.23 1.9 25.27 1.9 23.84 8.8 Level 8 .............................. 30.87 4.7 30.87 4.7 – –Not able to be leveled ........ 20.59 3.7 20.76 3.8 17.79 7.2
Executive secretaries andadministrative assistants .......... 20.73 1.4 20.90 1.4 16.76 6.4
Level 3 .............................. 15.20 6.7 15.40 6.1 – –Level 4 .............................. 15.36 3.3 15.44 3.7 14.75 7.5 Level 5 .............................. 17.80 1.5 17.91 1.5 15.36 5.9 Level 6 .............................. 21.23 1.5 21.32 1.6 16.13 4.9 Level 7 .............................. 25.15 2.1 25.16 2.1 24.50 8.7 Level 8 .............................. 30.83 5.7 30.83 5.7 – –Not able to be leveled ........ 23.69 4.5 23.76 4.7 22.56 13.4
Legal secretaries ............................ 20.71 5.2 20.57 5.5 23.37 5.3 Level 4 .............................. 17.06 5.6 17.06 5.6 – –Level 5 .............................. 17.88 8.3 17.43 8.3 – –Level 6 .............................. 23.67 5.3 23.55 5.4 – –Level 7 .............................. 26.45 4.3 26.41 4.4 – –Not able to be leveled ........ 21.92 17.9 21.92 17.9 – –
Medical secretaries ........................ 14.87 3.0 14.97 3.2 14.13 4.4 Level 2 .............................. 10.89 4.3 10.89 4.4 – –Level 3 .............................. 11.96 5.9 12.10 5.7 10.80 7.9 Level 4 .............................. 15.05 3.9 15.21 4.1 14.07 5.8 Level 5 .............................. 17.32 3.4 17.43 3.5 15.89 8.2 Level 6 .............................. 20.08 3.3 20.05 3.4 – –Level 7 .............................. 21.25 10.3 20.87 .9 – –Not able to be leveled ........ 16.27 7.4 16.62 6.7 – –
Secretaries, except legal, medical,and executive ........................... 16.23 1.4 16.46 1.4 13.44 3.5
See footnotes at end of table.
NATIONAL COMPENSATION SURVEY
All United States 8-77 December 2006 - January 2008

Table 8 Civilian workers: Mean hourly earnings1 for full-time andpart-time workers2 by work levels3 — Continued
Occupation4 and level
Civilian workers Full-time workers Part-time workers
MeanRelativeerror5 Mean
Relativeerror5 Mean
Relativeerror5
Office and administrative supportoccupations –ContinuedSecretaries, except legal, medical,
and executive –ContinuedLevel 2 .............................. $11.12 6.4% $11.67 6.4% $9.83 8.2%Level 3 .............................. 13.02 2.8 13.19 2.9 11.23 4.2 Level 4 .............................. 15.35 1.4 15.55 1.2 13.31 5.8 Level 5 .............................. 17.94 3.2 18.08 3.4 15.92 4.8 Level 6 .............................. 19.50 2.5 19.48 2.5 – –Level 7 .............................. 22.53 7.0 22.53 7.0 – –Not able to be leveled ........ 18.58 6.8 18.78 7.1 15.80 9.2
Computer operators ........................... 16.05 6.2 16.17 6.5 12.83 8.9 Level 3 .............................. 12.21 4.7 12.36 4.7 – –Level 4 .............................. 12.73 9.7 12.66 10.0 – –Level 5 .............................. 17.37 4.1 17.37 4.1 – –Level 6 .............................. 19.14 2.0 19.14 2.0 – –Level 7 .............................. 21.18 11.9 21.18 11.9 – –Not able to be leveled ........ 19.55 4.2 19.61 4.1 – –
Data entry and informationprocessing workers ...................... 13.97 1.8 14.04 1.8 13.50 7.0
Level 1 .............................. 9.48 5.8 – – – –Level 2 .............................. 11.56 2.4 11.71 2.7 10.77 5.6 Level 3 .............................. 12.91 3.9 12.80 4.1 13.39 9.5 Level 4 .............................. 15.17 2.0 15.01 2.0 17.07 13.8 Level 5 .............................. 17.78 2.9 17.73 3.1 – –Not able to be leveled ........ 15.67 8.5 16.01 9.6 14.07 11.2
Data entry keyers ........................... 13.20 2.4 13.14 1.9 13.54 8.1 Level 2 .............................. 11.45 2.5 11.50 2.8 11.10 4.4 Level 3 .............................. 12.43 3.4 12.22 3.0 13.26 10.2 Level 4 .............................. 14.71 2.6 14.42 2.5 17.20 14.3 Level 5 .............................. 18.33 6.5 18.33 6.5 – –Not able to be leveled ........ 15.23 11.5 15.60 13.0 – –
Word processors and typists .......... 15.97 3.3 16.25 3.8 13.30 8.3 Level 2 .............................. 11.99 5.9 12.74 6.0 10.24 12.7 Level 3 .............................. 15.15 7.7 15.16 8.4 14.93 18.2 Level 4 .............................. 16.04 3.0 16.05 3.0 – –Level 5 .............................. 17.47 2.3 17.34 2.5 – –Not able to be leveled ........ 16.89 8.3 17.19 9.9 – –
Desktop publishers ............................ 18.89 6.4 18.36 6.4 – –Level 4 .............................. 15.35 3.3 15.34 3.5 – –Level 5 .............................. 16.94 8.4 15.95 8.6 – –Level 6 .............................. 25.45 5.5 25.45 5.5 – –
Insurance claims and policyprocessing clerks ......................... 15.90 2.1 15.96 2.2 14.83 6.5
See footnotes at end of table.
NATIONAL COMPENSATION SURVEY
All United States 8-78 December 2006 - January 2008

Table 8 Civilian workers: Mean hourly earnings1 for full-time andpart-time workers2 by work levels3 — Continued
Occupation4 and level
Civilian workers Full-time workers Part-time workers
MeanRelativeerror5 Mean
Relativeerror5 Mean
Relativeerror5
Office and administrative supportoccupations –Continued
Insurance claims and policyprocessing clerks –Continued
Level 2 .............................. $12.17 5.9% $11.94 4.9% – –Level 3 .............................. 11.83 3.3 11.89 3.5 – –Level 4 .............................. 14.66 2.5 14.62 2.6 $15.74 8.6%Level 5 .............................. 16.61 2.2 16.69 2.4 – –Level 6 .............................. 18.84 4.4 18.98 4.4 – –Level 7 .............................. 25.28 6.4 25.28 6.4 – –Not able to be leveled ........ 17.14 10.5 16.96 10.1 – –
Mail clerks and mail machineoperators, except postal service ... 12.20 4.4 12.24 5.0 11.87 7.1
Level 1 .............................. 9.58 5.9 9.51 6.1 10.57 11.0 Level 2 .............................. 12.22 2.9 12.53 3.0 10.87 7.3 Level 3 .............................. 12.52 4.8 12.61 5.2 11.68 6.7 Level 4 .............................. 17.12 13.7 17.12 13.7 – –Not able to be leveled ........ 12.40 8.6 11.82 7.1 – –
Office clerks, general ......................... 14.12 1.2 14.45 1.3 12.12 2.1 Level 1 .............................. 11.21 6.0 10.79 10.1 11.51 7.5 Level 2 .............................. 10.87 1.7 10.85 1.9 10.94 4.7 Level 3 .............................. 12.61 2.0 12.71 2.0 12.02 4.7 Level 4 .............................. 14.43 1.1 14.64 1.1 12.65 3.3 Level 5 .............................. 17.63 1.9 17.59 1.9 18.96 12.2 Level 6 .............................. 22.52 3.3 22.52 3.3 – –Level 7 .............................. 22.39 4.4 22.37 4.8 – –Not able to be leveled ........ 14.44 4.8 14.83 5.7 12.54 6.9
Office machine operators, exceptcomputer ...................................... 12.59 3.1 12.73 3.3 10.38 6.3
Level 1 .............................. 9.18 4.3 9.20 4.5 – –Level 2 .............................. 10.91 3.1 10.96 3.8 10.78 6.4 Level 3 .............................. 13.00 4.1 13.00 4.1 – –Level 4 .............................. 14.26 5.8 14.27 5.9 – –Not able to be leveled ........ 13.67 8.9 14.28 8.8 – –
Proofreaders and copy markers ......... 12.38 7.7 13.44 4.7 – –Statistical assistants ........................... 18.70 6.3 18.96 6.7 – –
Level 4 .............................. – – 16.67 7.4 – –Level 6 .............................. 21.15 14.4 21.22 14.7 – –Not able to be leveled ........ 13.87 8.9 13.90 8.9 – –
Farming, fishing, and forestryoccupations ..................................... 12.56 6.7 12.69 7.3 11.97 18.1
Level 1 .............................. 9.55 8.1 8.87 4.5 12.16 19.2 Level 2 .............................. 8.98 14.8 9.89 16.5 – –
See footnotes at end of table.
NATIONAL COMPENSATION SURVEY
All United States 8-79 December 2006 - January 2008
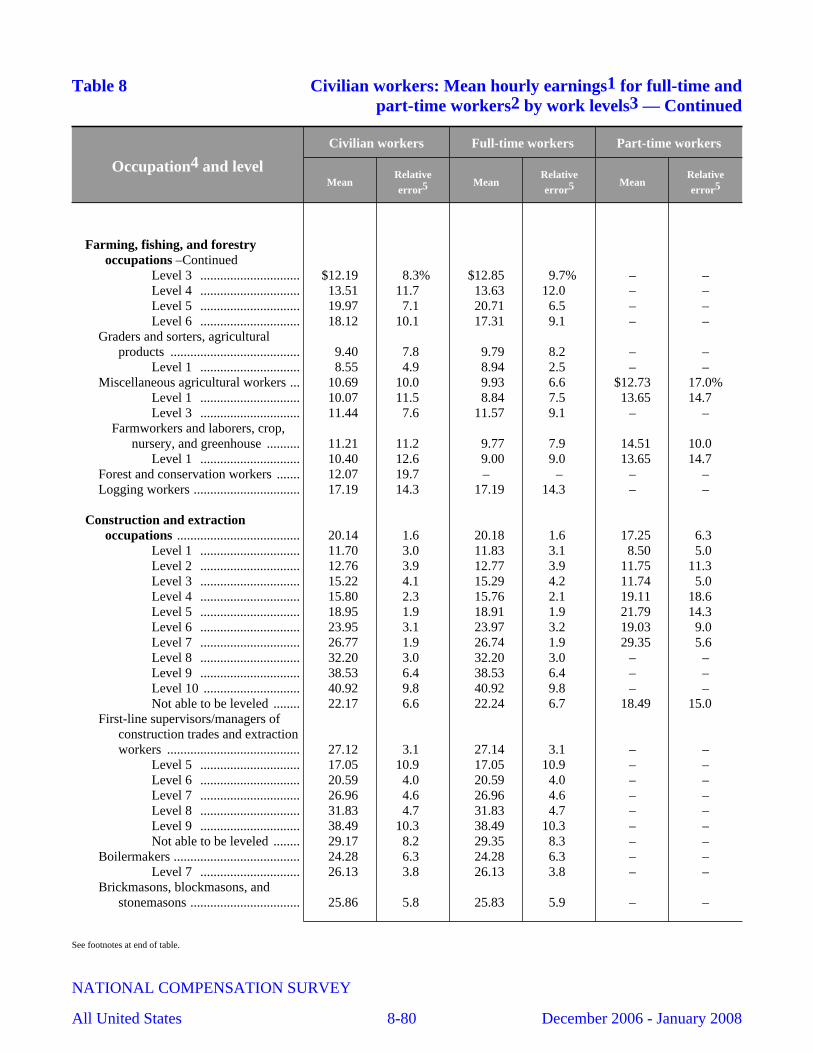
Table 8 Civilian workers: Mean hourly earnings1 for full-time andpart-time workers2 by work levels3 — Continued
Occupation4 and level
Civilian workers Full-time workers Part-time workers
MeanRelativeerror5 Mean
Relativeerror5 Mean
Relativeerror5
Farming, fishing, and forestryoccupations –Continued
Level 3 .............................. $12.19 8.3% $12.85 9.7% – –Level 4 .............................. 13.51 11.7 13.63 12.0 – –Level 5 .............................. 19.97 7.1 20.71 6.5 – –Level 6 .............................. 18.12 10.1 17.31 9.1 – –
Graders and sorters, agriculturalproducts ....................................... 9.40 7.8 9.79 8.2 – –
Level 1 .............................. 8.55 4.9 8.94 2.5 – –Miscellaneous agricultural workers ... 10.69 10.0 9.93 6.6 $12.73 17.0%
Level 1 .............................. 10.07 11.5 8.84 7.5 13.65 14.7 Level 3 .............................. 11.44 7.6 11.57 9.1 – –
Farmworkers and laborers, crop,nursery, and greenhouse .......... 11.21 11.2 9.77 7.9 14.51 10.0
Level 1 .............................. 10.40 12.6 9.00 9.0 13.65 14.7 Forest and conservation workers ....... 12.07 19.7 – – – –Logging workers ................................ 17.19 14.3 17.19 14.3 – –
Construction and extractionoccupations ..................................... 20.14 1.6 20.18 1.6 17.25 6.3
Level 1 .............................. 11.70 3.0 11.83 3.1 8.50 5.0 Level 2 .............................. 12.76 3.9 12.77 3.9 11.75 11.3 Level 3 .............................. 15.22 4.1 15.29 4.2 11.74 5.0 Level 4 .............................. 15.80 2.3 15.76 2.1 19.11 18.6 Level 5 .............................. 18.95 1.9 18.91 1.9 21.79 14.3 Level 6 .............................. 23.95 3.1 23.97 3.2 19.03 9.0 Level 7 .............................. 26.77 1.9 26.74 1.9 29.35 5.6 Level 8 .............................. 32.20 3.0 32.20 3.0 – –Level 9 .............................. 38.53 6.4 38.53 6.4 – –Level 10 ............................. 40.92 9.8 40.92 9.8 – –Not able to be leveled ........ 22.17 6.6 22.24 6.7 18.49 15.0
First-line supervisors/managers ofconstruction trades and extractionworkers ........................................ 27.12 3.1 27.14 3.1 – –
Level 5 .............................. 17.05 10.9 17.05 10.9 – –Level 6 .............................. 20.59 4.0 20.59 4.0 – –Level 7 .............................. 26.96 4.6 26.96 4.6 – –Level 8 .............................. 31.83 4.7 31.83 4.7 – –Level 9 .............................. 38.49 10.3 38.49 10.3 – –Not able to be leveled ........ 29.17 8.2 29.35 8.3 – –
Boilermakers ...................................... 24.28 6.3 24.28 6.3 – –Level 7 .............................. 26.13 3.8 26.13 3.8 – –
Brickmasons, blockmasons, andstonemasons ................................. 25.86 5.8 25.83 5.9 – –
See footnotes at end of table.
NATIONAL COMPENSATION SURVEY
All United States 8-80 December 2006 - January 2008

Table 8 Civilian workers: Mean hourly earnings1 for full-time andpart-time workers2 by work levels3 — Continued
Occupation4 and level
Civilian workers Full-time workers Part-time workers
MeanRelativeerror5 Mean
Relativeerror5 Mean
Relativeerror5
Construction and extractionoccupations –Continued
Brickmasons, blockmasons, andstonemasons –Continued
Level 5 .............................. $20.30 6.3% $20.30 6.3% – –Level 6 .............................. 24.33 8.5 24.33 8.5 – –Level 7 .............................. 27.68 3.8 27.46 3.9 – –
Brickmasons and blockmasons ...... 26.37 5.7 26.36 5.8 – –Level 5 .............................. 20.33 6.4 20.33 6.4 – –Level 6 .............................. 24.63 11.8 24.63 11.8 – –Level 7 .............................. 27.68 3.8 27.46 3.9 – –
Carpenters .......................................... 20.92 2.8 20.93 2.8 $20.36 13.7%Level 2 .............................. 13.42 6.3 13.42 6.3 – –Level 3 .............................. 13.82 11.0 14.05 12.3 – –Level 4 .............................. 15.88 6.1 15.90 6.2 – –Level 5 .............................. 19.00 4.1 19.00 4.1 – –Level 6 .............................. 23.45 7.7 23.48 7.7 – –Level 7 .............................. 24.62 2.8 24.54 2.7 – –Level 8 .............................. 28.25 13.7 28.25 13.7 – –Not able to be leveled ........ 21.30 9.1 21.86 8.7 – –
Carpet, floor, and tile installers andfinishers ....................................... 20.48 9.9 20.48 9.9 – –
Level 4 .............................. 18.08 5.3 18.08 5.3 – –Level 5 .............................. 17.28 7.4 17.28 7.4 – –Level 7 .............................. 26.43 20.5 26.43 20.5 – –
Carpet installers ............................. 25.75 16.9 25.75 16.9 – –Tile and marble setters ................... 18.71 8.2 18.71 8.2 – –
Cement masons, concrete finishers,and terrazzo workers .................... 19.75 4.1 19.79 4.1 – –
Level 3 .............................. 18.04 7.8 18.04 7.8 – –Level 4 .............................. 15.93 9.8 15.93 9.8 – –Level 5 .............................. 19.75 5.2 19.90 5.1 – –Level 6 .............................. 24.63 9.8 24.63 9.8 – –Level 7 .............................. 25.23 9.1 25.23 9.1 – –Not able to be leveled ........ 16.41 5.8 16.41 5.8 – –
Cement masons and concretefinishers ................................... 19.72 4.0 19.76 4.0 – –
Level 3 .............................. 18.04 7.8 18.04 7.8 – –Level 4 .............................. 15.93 9.8 15.93 9.8 – –Level 5 .............................. 19.75 5.2 19.90 5.1 – –Level 6 .............................. 24.63 9.8 24.63 9.8 – –Level 7 .............................. 25.26 9.8 25.26 9.8 – –Not able to be leveled ........ 16.41 5.8 16.41 5.8 – –
Construction laborers ......................... 15.81 4.9 15.73 5.0 19.69 9.9
See footnotes at end of table.
NATIONAL COMPENSATION SURVEY
All United States 8-81 December 2006 - January 2008

Table 8 Civilian workers: Mean hourly earnings1 for full-time andpart-time workers2 by work levels3 — Continued
Occupation4 and level
Civilian workers Full-time workers Part-time workers
MeanRelativeerror5 Mean
Relativeerror5 Mean
Relativeerror5
Construction and extractionoccupations –Continued
Construction laborers –ContinuedLevel 1 .............................. $12.12 5.4% $12.24 5.6% $8.53 5.8%Level 2 .............................. 13.05 8.1 13.06 8.1 – –Level 3 .............................. 19.13 6.2 19.13 6.2 – –Level 4 .............................. 21.15 6.8 20.84 6.3 – –Level 5 .............................. 22.53 5.2 22.00 5.8 – –Level 6 .............................. 21.80 9.1 21.80 9.1 – –Not able to be leveled ........ 13.14 10.0 13.14 10.0 – –
Construction equipment operators ..... 19.46 3.9 19.50 3.9 – –Level 3 .............................. 13.03 6.2 13.09 6.3 – –Level 4 .............................. 15.67 3.7 15.69 3.7 – –Level 5 .............................. 20.29 6.2 20.29 6.2 – –Level 6 .............................. 26.91 8.4 26.91 8.4 – –Level 7 .............................. 27.64 6.9 27.64 6.9 – –Not able to be leveled ........ 22.58 7.7 22.58 7.7 – –
Paving, surfacing, and tampingequipment operators ................ 16.04 5.8 16.06 5.8 – –
Level 3 .............................. 13.01 7.1 13.01 7.1 – –Level 4 .............................. 15.19 8.5 15.27 8.5 – –Level 5 .............................. 15.31 8.8 15.31 8.8 – –
Operating engineers and otherconstruction equipmentoperators .................................. 20.49 4.7 20.53 4.7 – –
Level 3 .............................. 13.05 8.7 13.15 8.9 – –Level 4 .............................. 15.83 4.5 15.83 4.5 – –Level 5 .............................. 21.39 6.4 21.39 6.4 – –Level 6 .............................. 28.28 9.2 28.28 9.2 – –Level 7 .............................. 28.13 7.1 28.13 7.1 – –Not able to be leveled ........ 22.85 8.5 22.85 8.5 – –
Drywall installers, ceiling tileinstallers, and tapers .................... 19.12 6.8 19.14 6.9 – –
Level 4 .............................. 16.55 15.7 16.55 15.7 – –Level 5 .............................. 19.15 9.1 19.17 9.2 – –Level 6 .............................. 21.34 13.2 21.34 13.2 – –Level 7 .............................. 20.23 10.4 20.23 10.4 – –Not able to be leveled ........ 20.52 19.5 20.56 19.8 – –
Drywall and ceiling tile installers .. 19.02 7.4 19.03 7.5 – –Level 5 .............................. 19.18 9.9 19.20 10.0 – –Level 7 .............................. 20.70 9.0 20.70 9.0 – –Not able to be leveled ........ 21.21 18.9 – – – –
Tapers ............................................ 19.49 7.4 19.49 7.4 – –Electricians ........................................ 23.31 4.6 23.31 4.6 22.74 16.1
See footnotes at end of table.
NATIONAL COMPENSATION SURVEY
All United States 8-82 December 2006 - January 2008
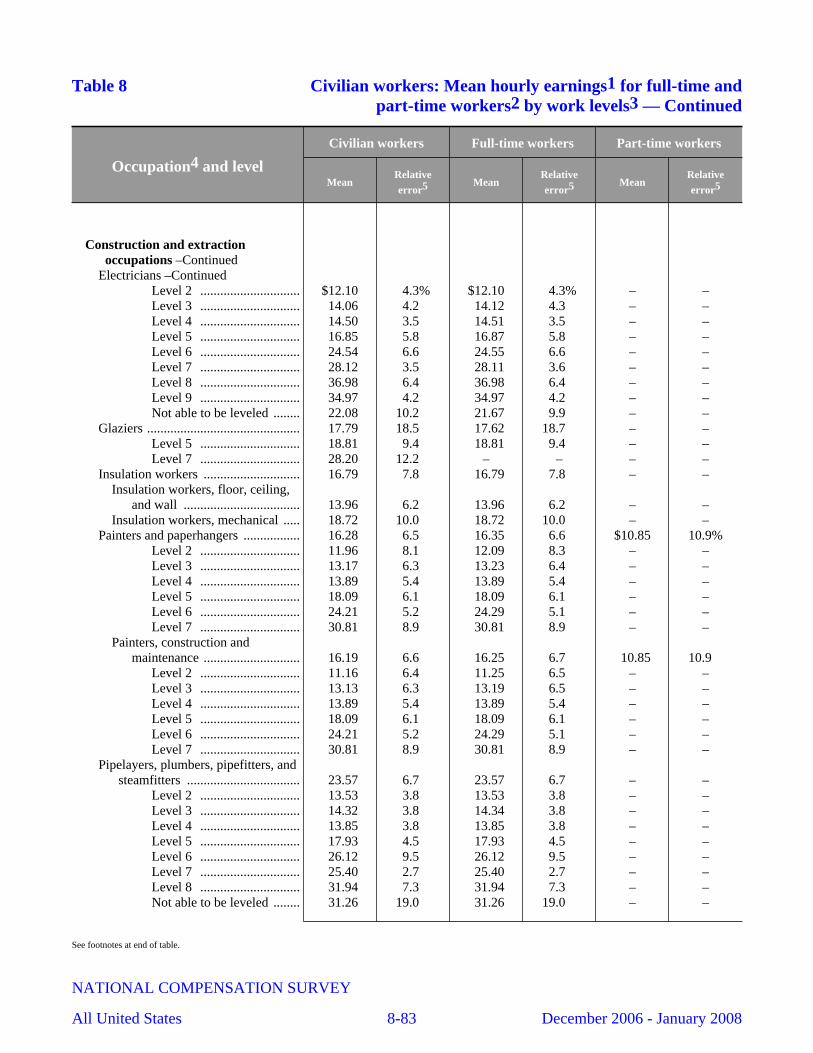
Table 8 Civilian workers: Mean hourly earnings1 for full-time andpart-time workers2 by work levels3 — Continued
Occupation4 and level
Civilian workers Full-time workers Part-time workers
MeanRelativeerror5 Mean
Relativeerror5 Mean
Relativeerror5
Construction and extractionoccupations –Continued
Electricians –ContinuedLevel 2 .............................. $12.10 4.3% $12.10 4.3% – –Level 3 .............................. 14.06 4.2 14.12 4.3 – –Level 4 .............................. 14.50 3.5 14.51 3.5 – –Level 5 .............................. 16.85 5.8 16.87 5.8 – –Level 6 .............................. 24.54 6.6 24.55 6.6 – –Level 7 .............................. 28.12 3.5 28.11 3.6 – –Level 8 .............................. 36.98 6.4 36.98 6.4 – –Level 9 .............................. 34.97 4.2 34.97 4.2 – –Not able to be leveled ........ 22.08 10.2 21.67 9.9 – –
Glaziers .............................................. 17.79 18.5 17.62 18.7 – –Level 5 .............................. 18.81 9.4 18.81 9.4 – –Level 7 .............................. 28.20 12.2 – – – –
Insulation workers ............................. 16.79 7.8 16.79 7.8 – –Insulation workers, floor, ceiling,
and wall ................................... 13.96 6.2 13.96 6.2 – –Insulation workers, mechanical ..... 18.72 10.0 18.72 10.0 – –
Painters and paperhangers ................. 16.28 6.5 16.35 6.6 $10.85 10.9%Level 2 .............................. 11.96 8.1 12.09 8.3 – –Level 3 .............................. 13.17 6.3 13.23 6.4 – –Level 4 .............................. 13.89 5.4 13.89 5.4 – –Level 5 .............................. 18.09 6.1 18.09 6.1 – –Level 6 .............................. 24.21 5.2 24.29 5.1 – –Level 7 .............................. 30.81 8.9 30.81 8.9 – –
Painters, construction andmaintenance ............................. 16.19 6.6 16.25 6.7 10.85 10.9
Level 2 .............................. 11.16 6.4 11.25 6.5 – –Level 3 .............................. 13.13 6.3 13.19 6.5 – –Level 4 .............................. 13.89 5.4 13.89 5.4 – –Level 5 .............................. 18.09 6.1 18.09 6.1 – –Level 6 .............................. 24.21 5.2 24.29 5.1 – –Level 7 .............................. 30.81 8.9 30.81 8.9 – –
Pipelayers, plumbers, pipefitters, andsteamfitters .................................. 23.57 6.7 23.57 6.7 – –
Level 2 .............................. 13.53 3.8 13.53 3.8 – –Level 3 .............................. 14.32 3.8 14.34 3.8 – –Level 4 .............................. 13.85 3.8 13.85 3.8 – –Level 5 .............................. 17.93 4.5 17.93 4.5 – –Level 6 .............................. 26.12 9.5 26.12 9.5 – –Level 7 .............................. 25.40 2.7 25.40 2.7 – –Level 8 .............................. 31.94 7.3 31.94 7.3 – –Not able to be leveled ........ 31.26 19.0 31.26 19.0 – –
See footnotes at end of table.
NATIONAL COMPENSATION SURVEY
All United States 8-83 December 2006 - January 2008
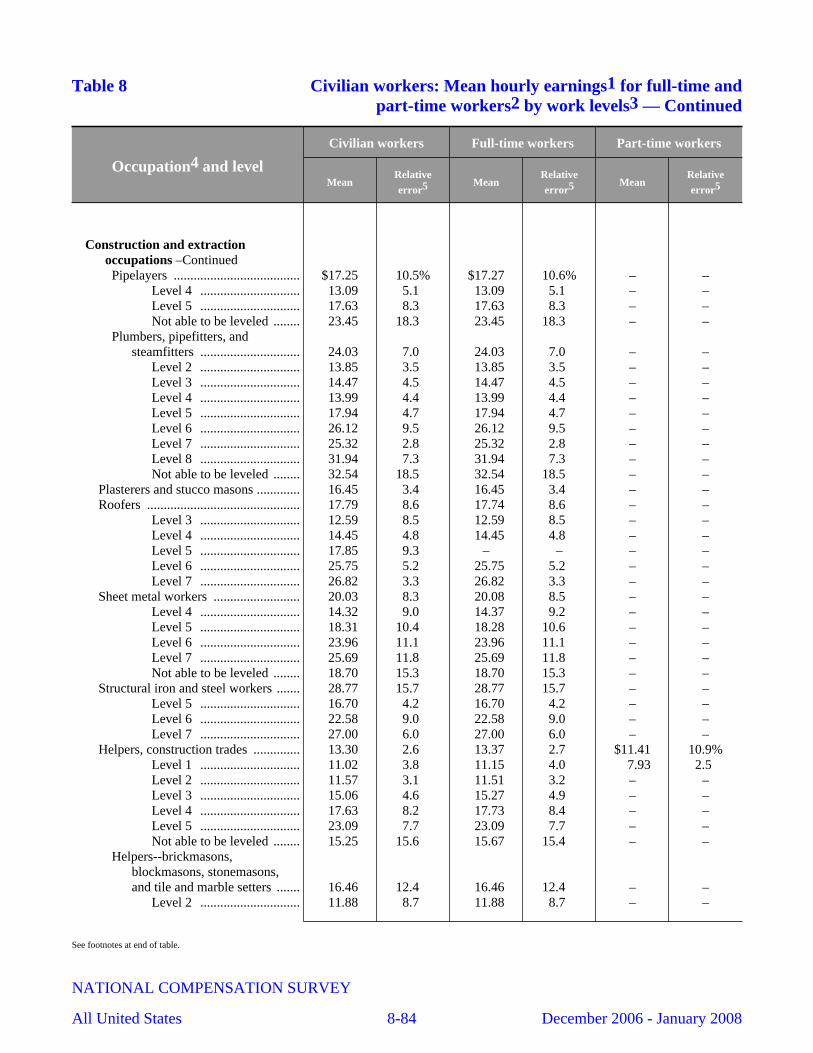
Table 8 Civilian workers: Mean hourly earnings1 for full-time andpart-time workers2 by work levels3 — Continued
Occupation4 and level
Civilian workers Full-time workers Part-time workers
MeanRelativeerror5 Mean
Relativeerror5 Mean
Relativeerror5
Construction and extractionoccupations –ContinuedPipelayers ...................................... $17.25 10.5% $17.27 10.6% – –
Level 4 .............................. 13.09 5.1 13.09 5.1 – –Level 5 .............................. 17.63 8.3 17.63 8.3 – –Not able to be leveled ........ 23.45 18.3 23.45 18.3 – –
Plumbers, pipefitters, andsteamfitters .............................. 24.03 7.0 24.03 7.0 – –
Level 2 .............................. 13.85 3.5 13.85 3.5 – –Level 3 .............................. 14.47 4.5 14.47 4.5 – –Level 4 .............................. 13.99 4.4 13.99 4.4 – –Level 5 .............................. 17.94 4.7 17.94 4.7 – –Level 6 .............................. 26.12 9.5 26.12 9.5 – –Level 7 .............................. 25.32 2.8 25.32 2.8 – –Level 8 .............................. 31.94 7.3 31.94 7.3 – –Not able to be leveled ........ 32.54 18.5 32.54 18.5 – –
Plasterers and stucco masons ............. 16.45 3.4 16.45 3.4 – –Roofers .............................................. 17.79 8.6 17.74 8.6 – –
Level 3 .............................. 12.59 8.5 12.59 8.5 – –Level 4 .............................. 14.45 4.8 14.45 4.8 – –Level 5 .............................. 17.85 9.3 – – – –Level 6 .............................. 25.75 5.2 25.75 5.2 – –Level 7 .............................. 26.82 3.3 26.82 3.3 – –
Sheet metal workers .......................... 20.03 8.3 20.08 8.5 – –Level 4 .............................. 14.32 9.0 14.37 9.2 – –Level 5 .............................. 18.31 10.4 18.28 10.6 – –Level 6 .............................. 23.96 11.1 23.96 11.1 – –Level 7 .............................. 25.69 11.8 25.69 11.8 – –Not able to be leveled ........ 18.70 15.3 18.70 15.3 – –
Structural iron and steel workers ....... 28.77 15.7 28.77 15.7 – –Level 5 .............................. 16.70 4.2 16.70 4.2 – –Level 6 .............................. 22.58 9.0 22.58 9.0 – –Level 7 .............................. 27.00 6.0 27.00 6.0 – –
Helpers, construction trades .............. 13.30 2.6 13.37 2.7 $11.41 10.9%Level 1 .............................. 11.02 3.8 11.15 4.0 7.93 2.5 Level 2 .............................. 11.57 3.1 11.51 3.2 – –Level 3 .............................. 15.06 4.6 15.27 4.9 – –Level 4 .............................. 17.63 8.2 17.73 8.4 – –Level 5 .............................. 23.09 7.7 23.09 7.7 – –Not able to be leveled ........ 15.25 15.6 15.67 15.4 – –
Helpers--brickmasons,blockmasons, stonemasons,and tile and marble setters ....... 16.46 12.4 16.46 12.4 – –
Level 2 .............................. 11.88 8.7 11.88 8.7 – –
See footnotes at end of table.
NATIONAL COMPENSATION SURVEY
All United States 8-84 December 2006 - January 2008

Table 8 Civilian workers: Mean hourly earnings1 for full-time andpart-time workers2 by work levels3 — Continued
Occupation4 and level
Civilian workers Full-time workers Part-time workers
MeanRelativeerror5 Mean
Relativeerror5 Mean
Relativeerror5
Construction and extractionoccupations –ContinuedHelpers--carpenters ........................ $13.60 5.4% $13.66 5.8% – –
Level 2 .............................. 12.09 11.7 12.09 11.7 – –Level 3 .............................. 14.66 3.4 14.95 4.5 – –
Helpers--electricians ...................... 10.81 3.6 10.77 3.7 – –Level 1 .............................. 9.89 5.9 9.89 5.9 – –Level 2 .............................. 10.46 4.9 10.37 5.1 – –
Helpers--painters, paperhangers,plasterers, and stucco masons .. 10.69 4.4 10.73 4.6 – –
Level 1 .............................. 10.34 5.7 10.40 5.8 – –Helpers--pipelayers, plumbers,
pipefitters, and steamfitters ..... 12.98 4.0 12.97 3.7 – –Level 1 .............................. 13.76 7.7 13.76 7.7 – –Level 2 .............................. 12.01 5.9 12.01 5.9 – –Level 3 .............................. 13.81 8.4 – – – –
Helpers--roofers ............................. 10.10 3.7 10.24 3.8 – –Construction and building inspectors 24.55 3.7 24.86 3.6 $17.06 7.1%
Level 5 .............................. 18.91 7.6 19.18 7.1 – –Level 6 .............................. 19.61 3.2 19.73 3.3 – –Level 7 .............................. 27.98 6.7 28.00 6.7 – –Level 8 .............................. 28.00 4.6 28.00 4.6 – –Level 9 .............................. 32.87 7.0 32.87 7.0 – –Not able to be leveled ........ 21.99 10.1 22.10 10.6 – –
Elevator installers and repairers ........ 39.19 12.8 39.19 12.8 – –Hazardous materials removal
workers ........................................ 19.43 25.5 19.49 25.7 – –Highway maintenance workers ......... 16.16 3.7 16.24 3.8 11.66 3.3
Level 1 .............................. 10.68 7.7 10.48 9.9 – –Level 2 .............................. 16.60 16.4 16.76 16.5 – –Level 3 .............................. 13.32 2.9 13.36 2.9 – –Level 4 .............................. 16.08 4.4 16.08 4.4 – –Level 5 .............................. 18.10 3.1 18.10 3.1 – –Level 6 .............................. 18.94 3.2 18.97 3.2 – –
Septic tank servicers and sewer pipecleaners ........................................ 17.98 10.9 18.03 10.9 – –
Miscellaneous construction andrelated workers ............................ 17.03 5.2 17.08 5.3 – –
Level 2 .............................. 11.22 3.7 11.22 3.7 – –Level 3 .............................. 12.80 5.8 12.81 5.9 – –Level 4 .............................. 14.72 6.4 14.79 6.6 – –Level 5 .............................. 16.91 6.7 17.09 6.9 – –Level 6 .............................. 21.42 11.2 21.42 11.2 – –Level 7 .............................. 21.77 7.0 21.77 7.0 – –
See footnotes at end of table.
NATIONAL COMPENSATION SURVEY
All United States 8-85 December 2006 - January 2008
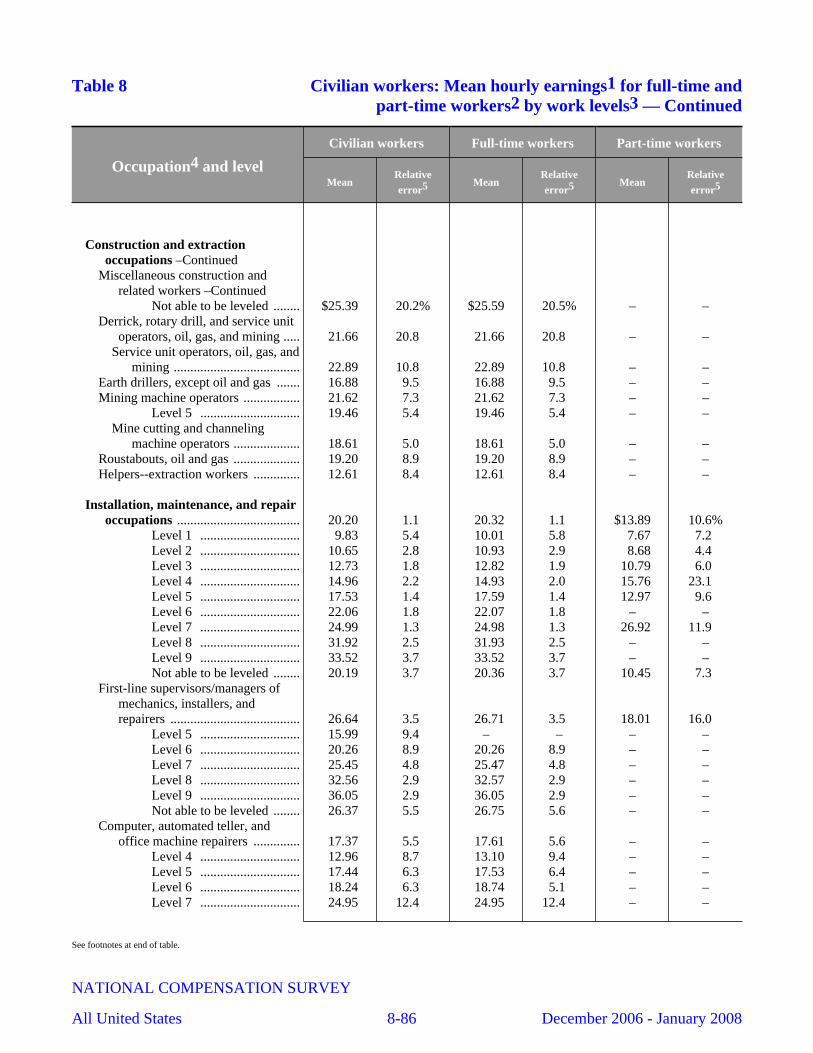
Table 8 Civilian workers: Mean hourly earnings1 for full-time andpart-time workers2 by work levels3 — Continued
Occupation4 and level
Civilian workers Full-time workers Part-time workers
MeanRelativeerror5 Mean
Relativeerror5 Mean
Relativeerror5
Construction and extractionoccupations –Continued
Miscellaneous construction andrelated workers –Continued
Not able to be leveled ........ $25.39 20.2% $25.59 20.5% – –Derrick, rotary drill, and service unit
operators, oil, gas, and mining ..... 21.66 20.8 21.66 20.8 – –Service unit operators, oil, gas, and
mining ...................................... 22.89 10.8 22.89 10.8 – –Earth drillers, except oil and gas ....... 16.88 9.5 16.88 9.5 – –Mining machine operators ................. 21.62 7.3 21.62 7.3 – –
Level 5 .............................. 19.46 5.4 19.46 5.4 – –Mine cutting and channeling
machine operators .................... 18.61 5.0 18.61 5.0 – –Roustabouts, oil and gas .................... 19.20 8.9 19.20 8.9 – –Helpers--extraction workers .............. 12.61 8.4 12.61 8.4 – –
Installation, maintenance, and repairoccupations ..................................... 20.20 1.1 20.32 1.1 $13.89 10.6%
Level 1 .............................. 9.83 5.4 10.01 5.8 7.67 7.2 Level 2 .............................. 10.65 2.8 10.93 2.9 8.68 4.4 Level 3 .............................. 12.73 1.8 12.82 1.9 10.79 6.0 Level 4 .............................. 14.96 2.2 14.93 2.0 15.76 23.1 Level 5 .............................. 17.53 1.4 17.59 1.4 12.97 9.6 Level 6 .............................. 22.06 1.8 22.07 1.8 – –Level 7 .............................. 24.99 1.3 24.98 1.3 26.92 11.9 Level 8 .............................. 31.92 2.5 31.93 2.5 – –Level 9 .............................. 33.52 3.7 33.52 3.7 – –Not able to be leveled ........ 20.19 3.7 20.36 3.7 10.45 7.3
First-line supervisors/managers ofmechanics, installers, andrepairers ....................................... 26.64 3.5 26.71 3.5 18.01 16.0
Level 5 .............................. 15.99 9.4 – – – –Level 6 .............................. 20.26 8.9 20.26 8.9 – –Level 7 .............................. 25.45 4.8 25.47 4.8 – –Level 8 .............................. 32.56 2.9 32.57 2.9 – –Level 9 .............................. 36.05 2.9 36.05 2.9 – –Not able to be leveled ........ 26.37 5.5 26.75 5.6 – –
Computer, automated teller, andoffice machine repairers .............. 17.37 5.5 17.61 5.6 – –
Level 4 .............................. 12.96 8.7 13.10 9.4 – –Level 5 .............................. 17.44 6.3 17.53 6.4 – –Level 6 .............................. 18.24 6.3 18.74 5.1 – –Level 7 .............................. 24.95 12.4 24.95 12.4 – –
See footnotes at end of table.
NATIONAL COMPENSATION SURVEY
All United States 8-86 December 2006 - January 2008

Table 8 Civilian workers: Mean hourly earnings1 for full-time andpart-time workers2 by work levels3 — Continued
Occupation4 and level
Civilian workers Full-time workers Part-time workers
MeanRelativeerror5 Mean
Relativeerror5 Mean
Relativeerror5
Installation, maintenance, and repairoccupations –Continued
Radio and telecommunicationsequipment installers and repairers $26.95 2.7% $26.90 2.7% – –
Level 4 .............................. 23.01 15.9 20.18 15.7 – –Level 5 .............................. 20.57 8.4 20.57 8.4 – –Level 6 .............................. 27.33 2.6 27.33 2.6 – –Level 7 .............................. 30.65 1.5 30.65 1.5 – –Not able to be leveled ........ 25.51 6.2 25.51 6.2 – –
Telecommunications equipmentinstallers and repairers, exceptline installers ............................ 26.94 2.7 26.89 2.8 – –
Level 4 .............................. 23.01 15.9 20.18 15.7 – –Level 5 .............................. 20.57 8.4 20.57 8.4 – –Level 6 .............................. 27.34 2.6 27.34 2.6 – –Level 7 .............................. 30.68 1.5 30.68 1.5 – –Not able to be leveled ........ 25.51 6.2 25.51 6.2 – –
Miscellaneous electrical andelectronic equipment mechanics,installers, and repairers ................ 19.35 5.1 19.44 5.1 – –
Level 4 .............................. 14.60 5.8 14.80 5.9 – –Level 5 .............................. 16.65 4.3 16.63 4.3 – –Level 6 .............................. 23.36 5.2 23.36 5.2 – –Level 7 .............................. 24.64 7.4 24.67 7.4 – –Level 9 .............................. 34.96 5.2 34.96 5.2 – –Not able to be leveled ........ 14.91 13.7 14.96 13.9 – –
Avionics technicians ...................... 14.22 27.3 14.22 27.3 – –Electric motor, power tool, and
related repairers ....................... 14.05 6.1 14.05 6.1 – –Electrical and electronics installers
and repairers, transportationequipment ................................ 23.92 5.9 24.10 6.1 – –
Electrical and electronics repairers,commercial and industrialequipment ................................ 21.42 6.5 21.42 6.5 – –
Level 4 .............................. 13.19 8.6 13.19 8.6 – –Level 5 .............................. 15.07 7.3 15.07 7.3 – –Level 6 .............................. 21.36 11.2 21.36 11.2 – –Level 7 .............................. 22.87 6.6 22.87 6.6 – –Not able to be leveled ........ 21.71 3.9 21.71 3.9 – –
Electrical and electronics repairers,powerhouse, substation, andrelay ......................................... 29.65 5.9 29.65 5.9 – –
Level 5 .............................. 20.61 4.9 20.61 4.9 – –
See footnotes at end of table.
NATIONAL COMPENSATION SURVEY
All United States 8-87 December 2006 - January 2008
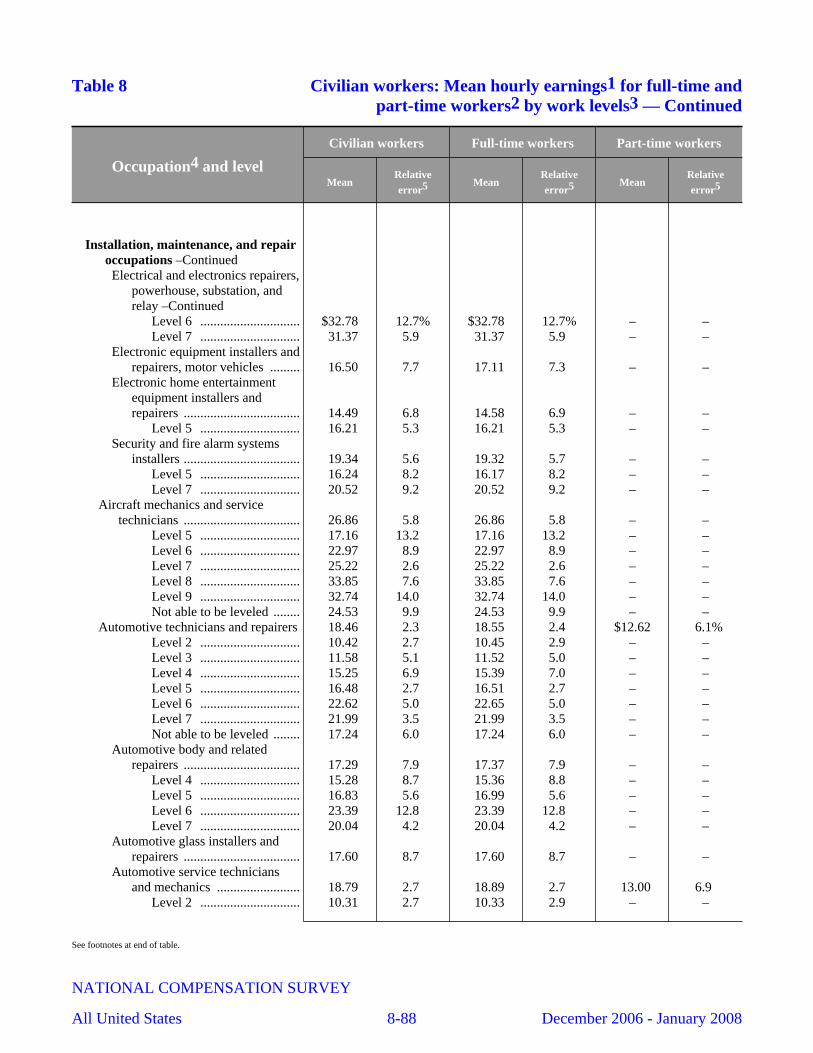
Table 8 Civilian workers: Mean hourly earnings1 for full-time andpart-time workers2 by work levels3 — Continued
Occupation4 and level
Civilian workers Full-time workers Part-time workers
MeanRelativeerror5 Mean
Relativeerror5 Mean
Relativeerror5
Installation, maintenance, and repairoccupations –ContinuedElectrical and electronics repairers,
powerhouse, substation, andrelay –Continued
Level 6 .............................. $32.78 12.7% $32.78 12.7% – –Level 7 .............................. 31.37 5.9 31.37 5.9 – –
Electronic equipment installers andrepairers, motor vehicles ......... 16.50 7.7 17.11 7.3 – –
Electronic home entertainmentequipment installers andrepairers ................................... 14.49 6.8 14.58 6.9 – –
Level 5 .............................. 16.21 5.3 16.21 5.3 – –Security and fire alarm systems
installers ................................... 19.34 5.6 19.32 5.7 – –Level 5 .............................. 16.24 8.2 16.17 8.2 – –Level 7 .............................. 20.52 9.2 20.52 9.2 – –
Aircraft mechanics and servicetechnicians ................................... 26.86 5.8 26.86 5.8 – –
Level 5 .............................. 17.16 13.2 17.16 13.2 – –Level 6 .............................. 22.97 8.9 22.97 8.9 – –Level 7 .............................. 25.22 2.6 25.22 2.6 – –Level 8 .............................. 33.85 7.6 33.85 7.6 – –Level 9 .............................. 32.74 14.0 32.74 14.0 – –Not able to be leveled ........ 24.53 9.9 24.53 9.9 – –
Automotive technicians and repairers 18.46 2.3 18.55 2.4 $12.62 6.1%Level 2 .............................. 10.42 2.7 10.45 2.9 – –Level 3 .............................. 11.58 5.1 11.52 5.0 – –Level 4 .............................. 15.25 6.9 15.39 7.0 – –Level 5 .............................. 16.48 2.7 16.51 2.7 – –Level 6 .............................. 22.62 5.0 22.65 5.0 – –Level 7 .............................. 21.99 3.5 21.99 3.5 – –Not able to be leveled ........ 17.24 6.0 17.24 6.0 – –
Automotive body and relatedrepairers ................................... 17.29 7.9 17.37 7.9 – –
Level 4 .............................. 15.28 8.7 15.36 8.8 – –Level 5 .............................. 16.83 5.6 16.99 5.6 – –Level 6 .............................. 23.39 12.8 23.39 12.8 – –Level 7 .............................. 20.04 4.2 20.04 4.2 – –
Automotive glass installers andrepairers ................................... 17.60 8.7 17.60 8.7 – –
Automotive service techniciansand mechanics ......................... 18.79 2.7 18.89 2.7 13.00 6.9
Level 2 .............................. 10.31 2.7 10.33 2.9 – –
See footnotes at end of table.
NATIONAL COMPENSATION SURVEY
All United States 8-88 December 2006 - January 2008
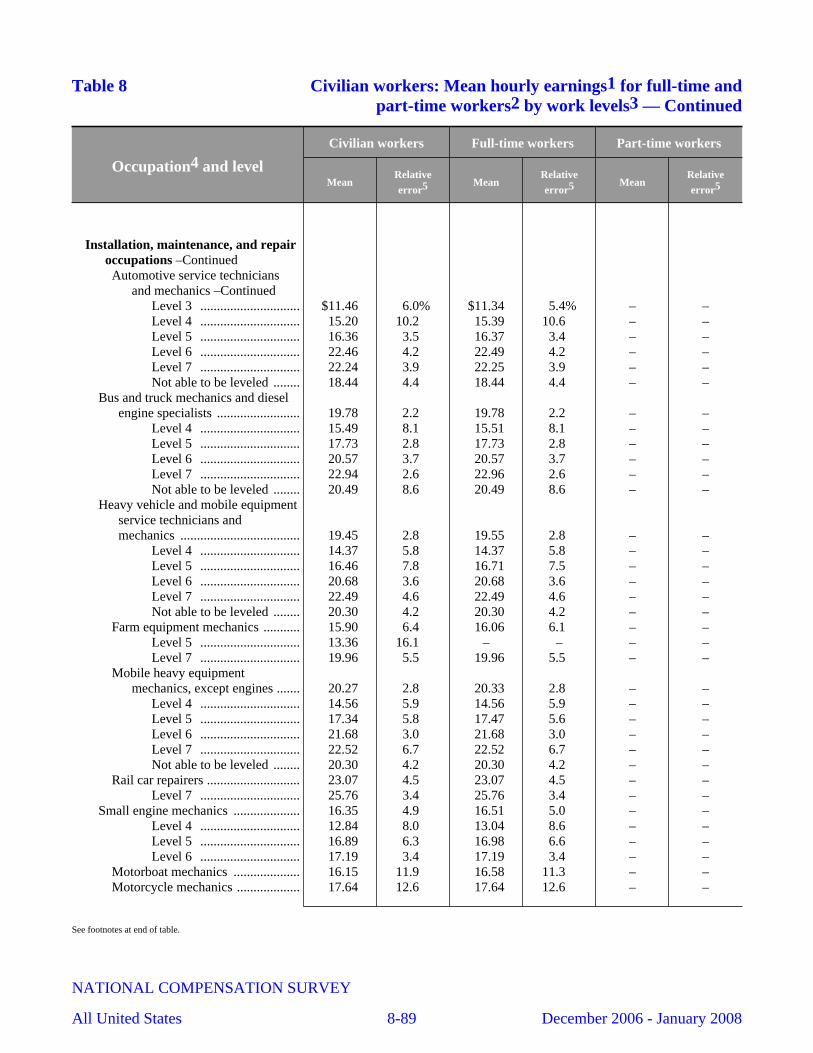
Table 8 Civilian workers: Mean hourly earnings1 for full-time andpart-time workers2 by work levels3 — Continued
Occupation4 and level
Civilian workers Full-time workers Part-time workers
MeanRelativeerror5 Mean
Relativeerror5 Mean
Relativeerror5
Installation, maintenance, and repairoccupations –ContinuedAutomotive service technicians
and mechanics –ContinuedLevel 3 .............................. $11.46 6.0% $11.34 5.4% – –Level 4 .............................. 15.20 10.2 15.39 10.6 – –Level 5 .............................. 16.36 3.5 16.37 3.4 – –Level 6 .............................. 22.46 4.2 22.49 4.2 – –Level 7 .............................. 22.24 3.9 22.25 3.9 – –Not able to be leveled ........ 18.44 4.4 18.44 4.4 – –
Bus and truck mechanics and dieselengine specialists ......................... 19.78 2.2 19.78 2.2 – –
Level 4 .............................. 15.49 8.1 15.51 8.1 – –Level 5 .............................. 17.73 2.8 17.73 2.8 – –Level 6 .............................. 20.57 3.7 20.57 3.7 – –Level 7 .............................. 22.94 2.6 22.96 2.6 – –Not able to be leveled ........ 20.49 8.6 20.49 8.6 – –
Heavy vehicle and mobile equipmentservice technicians andmechanics .................................... 19.45 2.8 19.55 2.8 – –
Level 4 .............................. 14.37 5.8 14.37 5.8 – –Level 5 .............................. 16.46 7.8 16.71 7.5 – –Level 6 .............................. 20.68 3.6 20.68 3.6 – –Level 7 .............................. 22.49 4.6 22.49 4.6 – –Not able to be leveled ........ 20.30 4.2 20.30 4.2 – –
Farm equipment mechanics ........... 15.90 6.4 16.06 6.1 – –Level 5 .............................. 13.36 16.1 – – – –Level 7 .............................. 19.96 5.5 19.96 5.5 – –
Mobile heavy equipmentmechanics, except engines ....... 20.27 2.8 20.33 2.8 – –
Level 4 .............................. 14.56 5.9 14.56 5.9 – –Level 5 .............................. 17.34 5.8 17.47 5.6 – –Level 6 .............................. 21.68 3.0 21.68 3.0 – –Level 7 .............................. 22.52 6.7 22.52 6.7 – –Not able to be leveled ........ 20.30 4.2 20.30 4.2 – –
Rail car repairers ............................ 23.07 4.5 23.07 4.5 – –Level 7 .............................. 25.76 3.4 25.76 3.4 – –
Small engine mechanics .................... 16.35 4.9 16.51 5.0 – –Level 4 .............................. 12.84 8.0 13.04 8.6 – –Level 5 .............................. 16.89 6.3 16.98 6.6 – –Level 6 .............................. 17.19 3.4 17.19 3.4 – –
Motorboat mechanics .................... 16.15 11.9 16.58 11.3 – –Motorcycle mechanics ................... 17.64 12.6 17.64 12.6 – –
See footnotes at end of table.
NATIONAL COMPENSATION SURVEY
All United States 8-89 December 2006 - January 2008
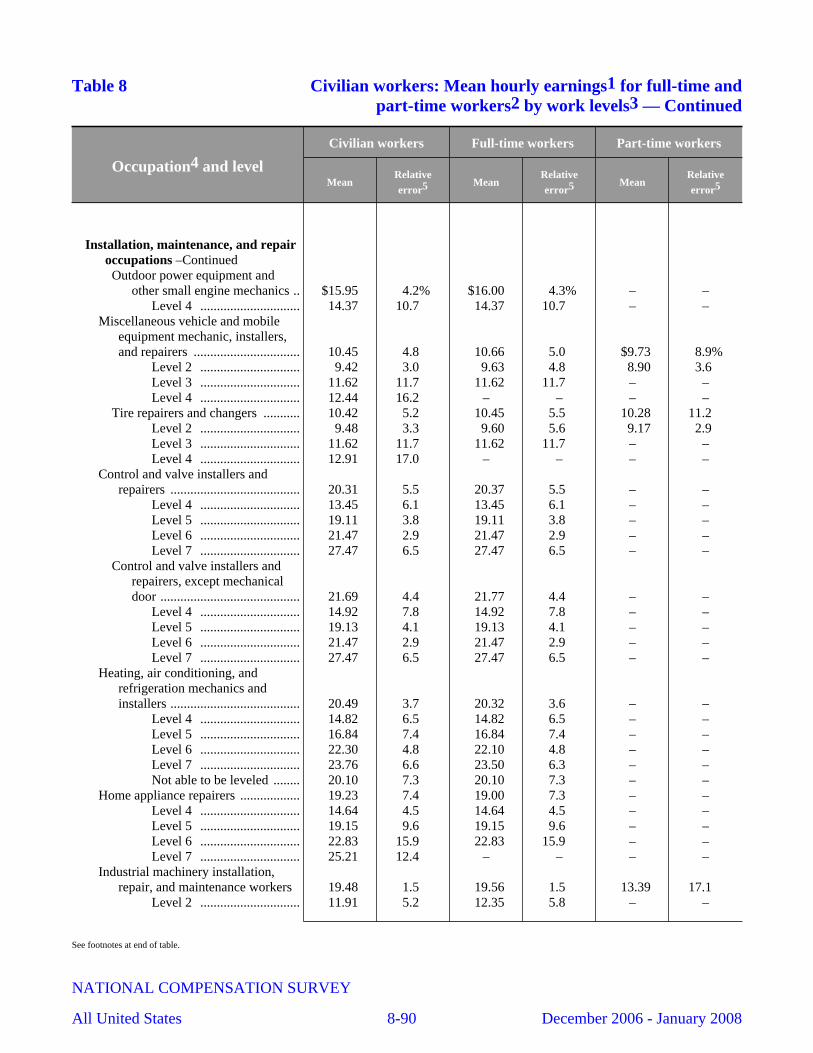
Table 8 Civilian workers: Mean hourly earnings1 for full-time andpart-time workers2 by work levels3 — Continued
Occupation4 and level
Civilian workers Full-time workers Part-time workers
MeanRelativeerror5 Mean
Relativeerror5 Mean
Relativeerror5
Installation, maintenance, and repairoccupations –ContinuedOutdoor power equipment and
other small engine mechanics .. $15.95 4.2% $16.00 4.3% – –Level 4 .............................. 14.37 10.7 14.37 10.7 – –
Miscellaneous vehicle and mobileequipment mechanic, installers,and repairers ................................ 10.45 4.8 10.66 5.0 $9.73 8.9%
Level 2 .............................. 9.42 3.0 9.63 4.8 8.90 3.6 Level 3 .............................. 11.62 11.7 11.62 11.7 – –Level 4 .............................. 12.44 16.2 – – – –
Tire repairers and changers ........... 10.42 5.2 10.45 5.5 10.28 11.2 Level 2 .............................. 9.48 3.3 9.60 5.6 9.17 2.9 Level 3 .............................. 11.62 11.7 11.62 11.7 – –Level 4 .............................. 12.91 17.0 – – – –
Control and valve installers andrepairers ....................................... 20.31 5.5 20.37 5.5 – –
Level 4 .............................. 13.45 6.1 13.45 6.1 – –Level 5 .............................. 19.11 3.8 19.11 3.8 – –Level 6 .............................. 21.47 2.9 21.47 2.9 – –Level 7 .............................. 27.47 6.5 27.47 6.5 – –
Control and valve installers andrepairers, except mechanicaldoor .......................................... 21.69 4.4 21.77 4.4 – –
Level 4 .............................. 14.92 7.8 14.92 7.8 – –Level 5 .............................. 19.13 4.1 19.13 4.1 – –Level 6 .............................. 21.47 2.9 21.47 2.9 – –Level 7 .............................. 27.47 6.5 27.47 6.5 – –
Heating, air conditioning, andrefrigeration mechanics andinstallers ....................................... 20.49 3.7 20.32 3.6 – –
Level 4 .............................. 14.82 6.5 14.82 6.5 – –Level 5 .............................. 16.84 7.4 16.84 7.4 – –Level 6 .............................. 22.30 4.8 22.10 4.8 – –Level 7 .............................. 23.76 6.6 23.50 6.3 – –Not able to be leveled ........ 20.10 7.3 20.10 7.3 – –
Home appliance repairers .................. 19.23 7.4 19.00 7.3 – –Level 4 .............................. 14.64 4.5 14.64 4.5 – –Level 5 .............................. 19.15 9.6 19.15 9.6 – –Level 6 .............................. 22.83 15.9 22.83 15.9 – –Level 7 .............................. 25.21 12.4 – – – –
Industrial machinery installation,repair, and maintenance workers 19.48 1.5 19.56 1.5 13.39 17.1
Level 2 .............................. 11.91 5.2 12.35 5.8 – –
See footnotes at end of table.
NATIONAL COMPENSATION SURVEY
All United States 8-90 December 2006 - January 2008
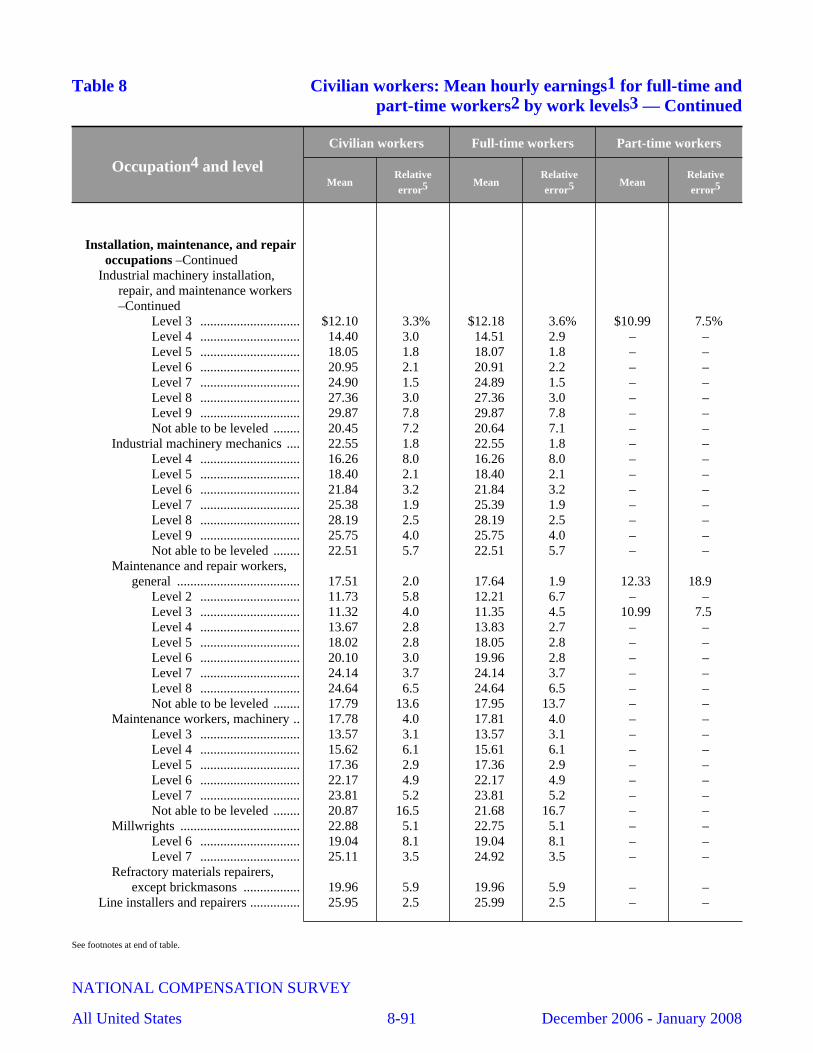
Table 8 Civilian workers: Mean hourly earnings1 for full-time andpart-time workers2 by work levels3 — Continued
Occupation4 and level
Civilian workers Full-time workers Part-time workers
MeanRelativeerror5 Mean
Relativeerror5 Mean
Relativeerror5
Installation, maintenance, and repairoccupations –Continued
Industrial machinery installation,repair, and maintenance workers–Continued
Level 3 .............................. $12.10 3.3% $12.18 3.6% $10.99 7.5%Level 4 .............................. 14.40 3.0 14.51 2.9 – –Level 5 .............................. 18.05 1.8 18.07 1.8 – –Level 6 .............................. 20.95 2.1 20.91 2.2 – –Level 7 .............................. 24.90 1.5 24.89 1.5 – –Level 8 .............................. 27.36 3.0 27.36 3.0 – –Level 9 .............................. 29.87 7.8 29.87 7.8 – –Not able to be leveled ........ 20.45 7.2 20.64 7.1 – –
Industrial machinery mechanics .... 22.55 1.8 22.55 1.8 – –Level 4 .............................. 16.26 8.0 16.26 8.0 – –Level 5 .............................. 18.40 2.1 18.40 2.1 – –Level 6 .............................. 21.84 3.2 21.84 3.2 – –Level 7 .............................. 25.38 1.9 25.39 1.9 – –Level 8 .............................. 28.19 2.5 28.19 2.5 – –Level 9 .............................. 25.75 4.0 25.75 4.0 – –Not able to be leveled ........ 22.51 5.7 22.51 5.7 – –
Maintenance and repair workers,general ..................................... 17.51 2.0 17.64 1.9 12.33 18.9
Level 2 .............................. 11.73 5.8 12.21 6.7 – –Level 3 .............................. 11.32 4.0 11.35 4.5 10.99 7.5 Level 4 .............................. 13.67 2.8 13.83 2.7 – –Level 5 .............................. 18.02 2.8 18.05 2.8 – –Level 6 .............................. 20.10 3.0 19.96 2.8 – –Level 7 .............................. 24.14 3.7 24.14 3.7 – –Level 8 .............................. 24.64 6.5 24.64 6.5 – –Not able to be leveled ........ 17.79 13.6 17.95 13.7 – –
Maintenance workers, machinery .. 17.78 4.0 17.81 4.0 – –Level 3 .............................. 13.57 3.1 13.57 3.1 – –Level 4 .............................. 15.62 6.1 15.61 6.1 – –Level 5 .............................. 17.36 2.9 17.36 2.9 – –Level 6 .............................. 22.17 4.9 22.17 4.9 – –Level 7 .............................. 23.81 5.2 23.81 5.2 – –Not able to be leveled ........ 20.87 16.5 21.68 16.7 – –
Millwrights .................................... 22.88 5.1 22.75 5.1 – –Level 6 .............................. 19.04 8.1 19.04 8.1 – –Level 7 .............................. 25.11 3.5 24.92 3.5 – –
Refractory materials repairers,except brickmasons ................. 19.96 5.9 19.96 5.9 – –
Line installers and repairers ............... 25.95 2.5 25.99 2.5 – –
See footnotes at end of table.
NATIONAL COMPENSATION SURVEY
All United States 8-91 December 2006 - January 2008
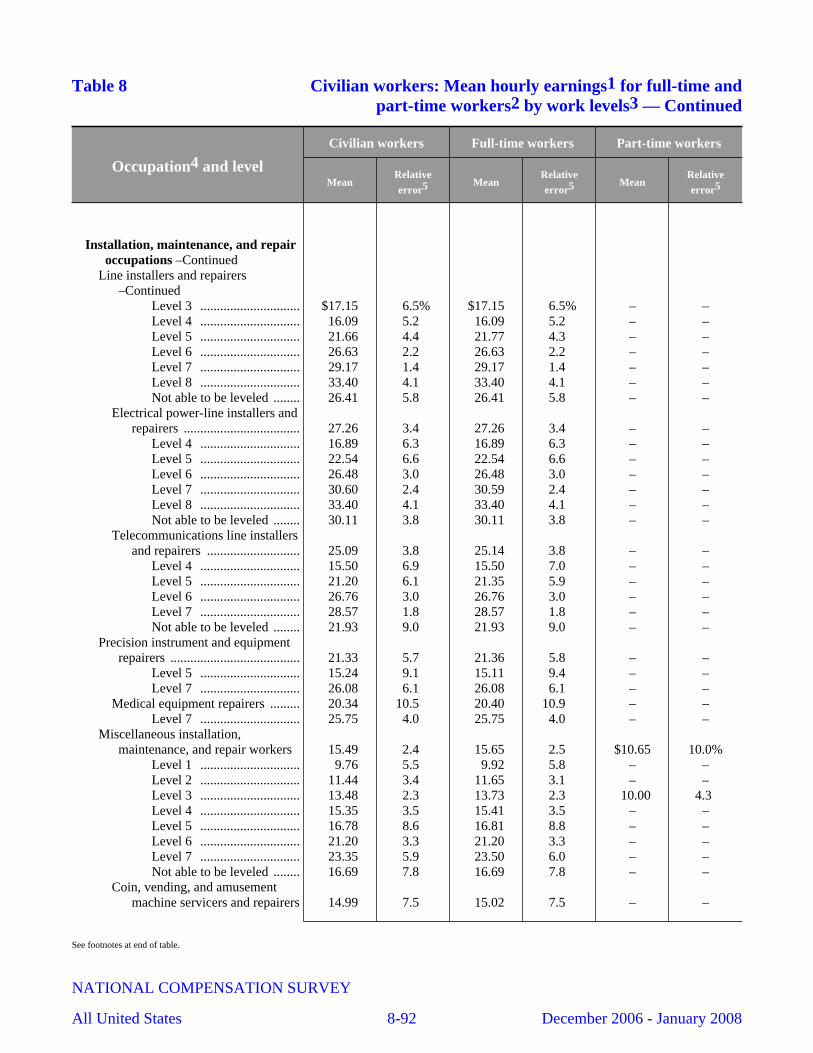
Table 8 Civilian workers: Mean hourly earnings1 for full-time andpart-time workers2 by work levels3 — Continued
Occupation4 and level
Civilian workers Full-time workers Part-time workers
MeanRelativeerror5 Mean
Relativeerror5 Mean
Relativeerror5
Installation, maintenance, and repairoccupations –Continued
Line installers and repairers–Continued
Level 3 .............................. $17.15 6.5% $17.15 6.5% – –Level 4 .............................. 16.09 5.2 16.09 5.2 – –Level 5 .............................. 21.66 4.4 21.77 4.3 – –Level 6 .............................. 26.63 2.2 26.63 2.2 – –Level 7 .............................. 29.17 1.4 29.17 1.4 – –Level 8 .............................. 33.40 4.1 33.40 4.1 – –Not able to be leveled ........ 26.41 5.8 26.41 5.8 – –
Electrical power-line installers andrepairers ................................... 27.26 3.4 27.26 3.4 – –
Level 4 .............................. 16.89 6.3 16.89 6.3 – –Level 5 .............................. 22.54 6.6 22.54 6.6 – –Level 6 .............................. 26.48 3.0 26.48 3.0 – –Level 7 .............................. 30.60 2.4 30.59 2.4 – –Level 8 .............................. 33.40 4.1 33.40 4.1 – –Not able to be leveled ........ 30.11 3.8 30.11 3.8 – –
Telecommunications line installersand repairers ............................ 25.09 3.8 25.14 3.8 – –
Level 4 .............................. 15.50 6.9 15.50 7.0 – –Level 5 .............................. 21.20 6.1 21.35 5.9 – –Level 6 .............................. 26.76 3.0 26.76 3.0 – –Level 7 .............................. 28.57 1.8 28.57 1.8 – –Not able to be leveled ........ 21.93 9.0 21.93 9.0 – –
Precision instrument and equipmentrepairers ....................................... 21.33 5.7 21.36 5.8 – –
Level 5 .............................. 15.24 9.1 15.11 9.4 – –Level 7 .............................. 26.08 6.1 26.08 6.1 – –
Medical equipment repairers ......... 20.34 10.5 20.40 10.9 – –Level 7 .............................. 25.75 4.0 25.75 4.0 – –
Miscellaneous installation,maintenance, and repair workers 15.49 2.4 15.65 2.5 $10.65 10.0%
Level 1 .............................. 9.76 5.5 9.92 5.8 – –Level 2 .............................. 11.44 3.4 11.65 3.1 – –Level 3 .............................. 13.48 2.3 13.73 2.3 10.00 4.3 Level 4 .............................. 15.35 3.5 15.41 3.5 – –Level 5 .............................. 16.78 8.6 16.81 8.8 – –Level 6 .............................. 21.20 3.3 21.20 3.3 – –Level 7 .............................. 23.35 5.9 23.50 6.0 – –Not able to be leveled ........ 16.69 7.8 16.69 7.8 – –
Coin, vending, and amusementmachine servicers and repairers 14.99 7.5 15.02 7.5 – –
See footnotes at end of table.
NATIONAL COMPENSATION SURVEY
All United States 8-92 December 2006 - January 2008
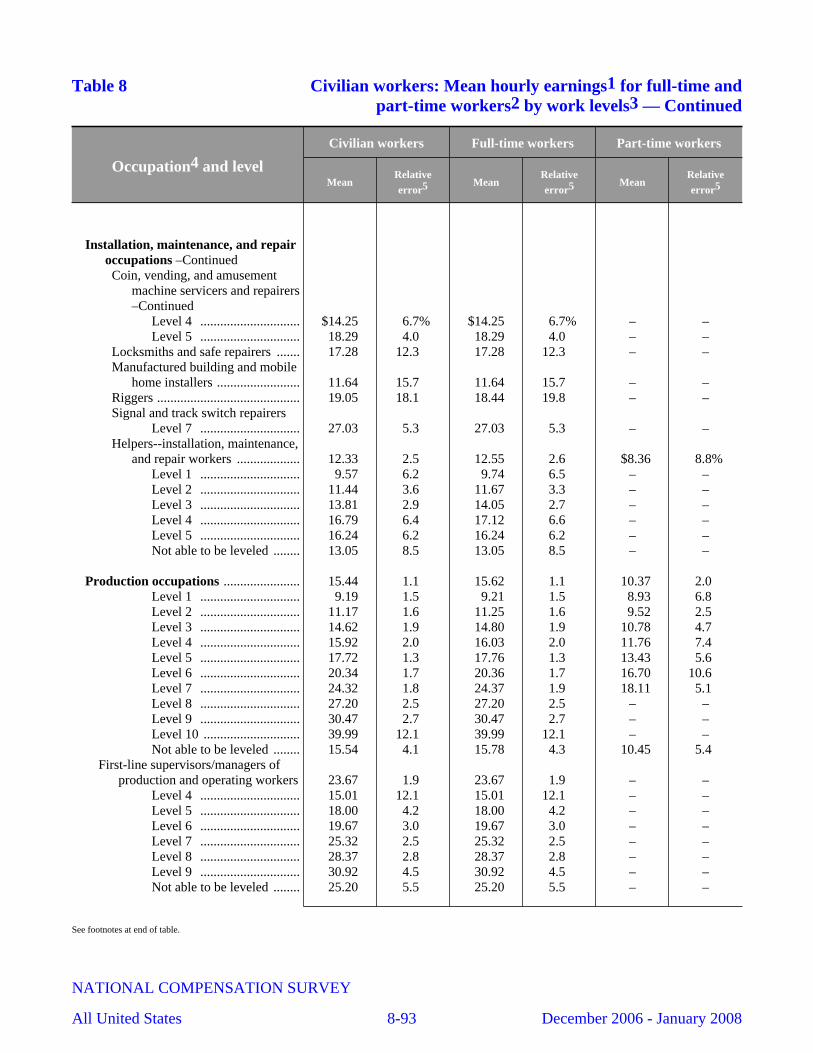
Table 8 Civilian workers: Mean hourly earnings1 for full-time andpart-time workers2 by work levels3 — Continued
Occupation4 and level
Civilian workers Full-time workers Part-time workers
MeanRelativeerror5 Mean
Relativeerror5 Mean
Relativeerror5
Installation, maintenance, and repairoccupations –ContinuedCoin, vending, and amusement
machine servicers and repairers–Continued
Level 4 .............................. $14.25 6.7% $14.25 6.7% – –Level 5 .............................. 18.29 4.0 18.29 4.0 – –
Locksmiths and safe repairers ....... 17.28 12.3 17.28 12.3 – –Manufactured building and mobile
home installers ......................... 11.64 15.7 11.64 15.7 – –Riggers ........................................... 19.05 18.1 18.44 19.8 – –Signal and track switch repairers
Level 7 .............................. 27.03 5.3 27.03 5.3 – –Helpers--installation, maintenance,
and repair workers ................... 12.33 2.5 12.55 2.6 $8.36 8.8%Level 1 .............................. 9.57 6.2 9.74 6.5 – –Level 2 .............................. 11.44 3.6 11.67 3.3 – –Level 3 .............................. 13.81 2.9 14.05 2.7 – –Level 4 .............................. 16.79 6.4 17.12 6.6 – –Level 5 .............................. 16.24 6.2 16.24 6.2 – –Not able to be leveled ........ 13.05 8.5 13.05 8.5 – –
Production occupations ....................... 15.44 1.1 15.62 1.1 10.37 2.0 Level 1 .............................. 9.19 1.5 9.21 1.5 8.93 6.8 Level 2 .............................. 11.17 1.6 11.25 1.6 9.52 2.5 Level 3 .............................. 14.62 1.9 14.80 1.9 10.78 4.7 Level 4 .............................. 15.92 2.0 16.03 2.0 11.76 7.4 Level 5 .............................. 17.72 1.3 17.76 1.3 13.43 5.6 Level 6 .............................. 20.34 1.7 20.36 1.7 16.70 10.6 Level 7 .............................. 24.32 1.8 24.37 1.9 18.11 5.1 Level 8 .............................. 27.20 2.5 27.20 2.5 – –Level 9 .............................. 30.47 2.7 30.47 2.7 – –Level 10 ............................. 39.99 12.1 39.99 12.1 – –Not able to be leveled ........ 15.54 4.1 15.78 4.3 10.45 5.4
First-line supervisors/managers ofproduction and operating workers 23.67 1.9 23.67 1.9 – –
Level 4 .............................. 15.01 12.1 15.01 12.1 – –Level 5 .............................. 18.00 4.2 18.00 4.2 – –Level 6 .............................. 19.67 3.0 19.67 3.0 – –Level 7 .............................. 25.32 2.5 25.32 2.5 – –Level 8 .............................. 28.37 2.8 28.37 2.8 – –Level 9 .............................. 30.92 4.5 30.92 4.5 – –Not able to be leveled ........ 25.20 5.5 25.20 5.5 – –
See footnotes at end of table.
NATIONAL COMPENSATION SURVEY
All United States 8-93 December 2006 - January 2008
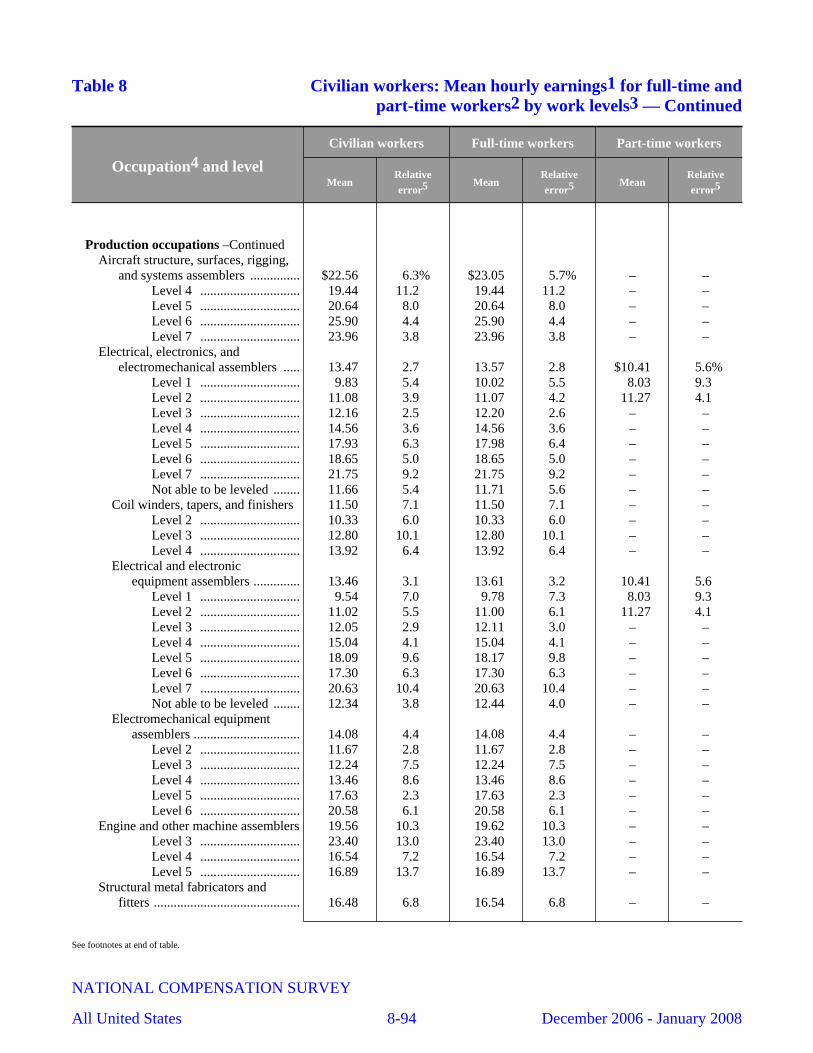
Table 8 Civilian workers: Mean hourly earnings1 for full-time andpart-time workers2 by work levels3 — Continued
Occupation4 and level
Civilian workers Full-time workers Part-time workers
MeanRelativeerror5 Mean
Relativeerror5 Mean
Relativeerror5
Production occupations –ContinuedAircraft structure, surfaces, rigging,
and systems assemblers ............... $22.56 6.3% $23.05 5.7% – –Level 4 .............................. 19.44 11.2 19.44 11.2 – –Level 5 .............................. 20.64 8.0 20.64 8.0 – –Level 6 .............................. 25.90 4.4 25.90 4.4 – –Level 7 .............................. 23.96 3.8 23.96 3.8 – –
Electrical, electronics, andelectromechanical assemblers ..... 13.47 2.7 13.57 2.8 $10.41 5.6%
Level 1 .............................. 9.83 5.4 10.02 5.5 8.03 9.3 Level 2 .............................. 11.08 3.9 11.07 4.2 11.27 4.1 Level 3 .............................. 12.16 2.5 12.20 2.6 – –Level 4 .............................. 14.56 3.6 14.56 3.6 – –Level 5 .............................. 17.93 6.3 17.98 6.4 – –Level 6 .............................. 18.65 5.0 18.65 5.0 – –Level 7 .............................. 21.75 9.2 21.75 9.2 – –Not able to be leveled ........ 11.66 5.4 11.71 5.6 – –
Coil winders, tapers, and finishers 11.50 7.1 11.50 7.1 – –Level 2 .............................. 10.33 6.0 10.33 6.0 – –Level 3 .............................. 12.80 10.1 12.80 10.1 – –Level 4 .............................. 13.92 6.4 13.92 6.4 – –
Electrical and electronicequipment assemblers .............. 13.46 3.1 13.61 3.2 10.41 5.6
Level 1 .............................. 9.54 7.0 9.78 7.3 8.03 9.3 Level 2 .............................. 11.02 5.5 11.00 6.1 11.27 4.1 Level 3 .............................. 12.05 2.9 12.11 3.0 – –Level 4 .............................. 15.04 4.1 15.04 4.1 – –Level 5 .............................. 18.09 9.6 18.17 9.8 – –Level 6 .............................. 17.30 6.3 17.30 6.3 – –Level 7 .............................. 20.63 10.4 20.63 10.4 – –Not able to be leveled ........ 12.34 3.8 12.44 4.0 – –
Electromechanical equipmentassemblers ................................ 14.08 4.4 14.08 4.4 – –
Level 2 .............................. 11.67 2.8 11.67 2.8 – –Level 3 .............................. 12.24 7.5 12.24 7.5 – –Level 4 .............................. 13.46 8.6 13.46 8.6 – –Level 5 .............................. 17.63 2.3 17.63 2.3 – –Level 6 .............................. 20.58 6.1 20.58 6.1 – –
Engine and other machine assemblers 19.56 10.3 19.62 10.3 – –Level 3 .............................. 23.40 13.0 23.40 13.0 – –Level 4 .............................. 16.54 7.2 16.54 7.2 – –Level 5 .............................. 16.89 13.7 16.89 13.7 – –
Structural metal fabricators andfitters ............................................ 16.48 6.8 16.54 6.8 – –
See footnotes at end of table.
NATIONAL COMPENSATION SURVEY
All United States 8-94 December 2006 - January 2008

Table 8 Civilian workers: Mean hourly earnings1 for full-time andpart-time workers2 by work levels3 — Continued
Occupation4 and level
Civilian workers Full-time workers Part-time workers
MeanRelativeerror5 Mean
Relativeerror5 Mean
Relativeerror5
Production occupations –ContinuedStructural metal fabricators and
fitters –ContinuedLevel 2 .............................. $10.78 8.7% $10.78 8.7% – –Level 3 .............................. 12.74 4.6 13.01 5.4 – –Level 4 .............................. 17.79 10.4 17.79 10.4 – –Level 5 .............................. 16.11 3.0 16.11 3.0 – –Level 7 .............................. 26.48 4.0 26.48 4.0 – –
Miscellaneous assemblers andfabricators .................................... 15.27 4.0 15.42 4.0 $10.47 5.9%
Level 1 .............................. 9.09 5.3 9.08 5.7 9.14 6.0 Level 2 .............................. 11.46 2.9 11.53 2.9 9.40 5.7 Level 3 .............................. 19.49 5.5 19.60 5.6 14.48 11.4 Level 4 .............................. 18.47 6.8 18.49 6.8 – –Level 5 .............................. 18.86 9.2 18.92 9.1 – –Level 6 .............................. 19.68 5.9 19.68 5.9 – –Level 7 .............................. 21.18 6.0 21.18 6.0 – –Not able to be leveled ........ 12.82 6.4 12.90 6.5 – –
Fiberglass laminators andfabricators ................................ 13.13 7.1 13.17 7.2 – –
Team assemblers ........................... 18.04 9.9 18.04 9.9 – –Level 2 .............................. 10.77 5.1 10.77 5.1 – –Level 3 .............................. 22.57 9.3 22.57 9.4 – –Level 4 .............................. 18.65 13.0 18.65 13.0 – –Level 5 .............................. 17.65 5.9 17.65 5.9 – –Not able to be leveled ........ 13.28 15.2 13.28 15.2 – –
Bakers ................................................ 12.47 6.8 12.98 7.1 10.21 3.2 Level 2 .............................. 10.19 3.1 10.06 4.3 10.54 5.6 Level 3 .............................. 10.30 6.6 10.29 7.2 10.43 7.6 Level 4 .............................. 12.38 8.0 13.19 8.8 – –Level 5 .............................. 15.27 6.9 15.29 6.9 – –
Butchers and other meat, poultry, andfish processing workers ............... 12.26 5.0 12.37 4.9 11.04 11.8
Level 1 .............................. 8.67 6.6 8.74 6.7 8.04 20.3 Level 2 .............................. 9.78 2.9 9.86 3.0 – –Level 3 .............................. 12.27 4.3 12.30 4.6 11.93 15.9 Level 4 .............................. 13.87 3.3 13.81 3.5 – –Level 5 .............................. 14.31 11.4 14.48 13.3 – –Level 6 .............................. 18.21 5.6 18.21 5.6 – –Level 7 .............................. 19.74 4.9 19.92 5.6 – –Not able to be leveled ........ 13.24 16.4 – – – –
Butchers and meat cutters .............. 15.06 5.2 15.27 5.6 13.33 7.2 Level 3 .............................. 13.23 9.1 13.32 10.2 12.69 18.3 Level 4 .............................. 14.56 4.4 14.52 4.8 – –
See footnotes at end of table.
NATIONAL COMPENSATION SURVEY
All United States 8-95 December 2006 - January 2008
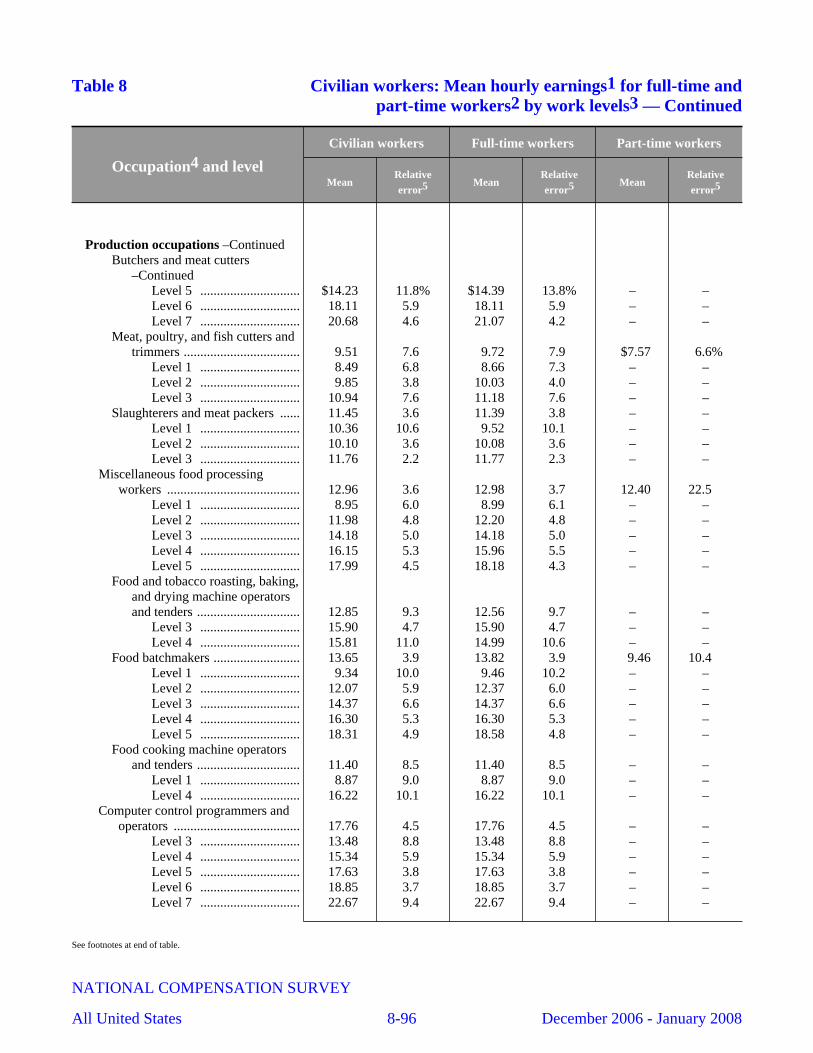
Table 8 Civilian workers: Mean hourly earnings1 for full-time andpart-time workers2 by work levels3 — Continued
Occupation4 and level
Civilian workers Full-time workers Part-time workers
MeanRelativeerror5 Mean
Relativeerror5 Mean
Relativeerror5
Production occupations –ContinuedButchers and meat cutters
–ContinuedLevel 5 .............................. $14.23 11.8% $14.39 13.8% – –Level 6 .............................. 18.11 5.9 18.11 5.9 – –Level 7 .............................. 20.68 4.6 21.07 4.2 – –
Meat, poultry, and fish cutters andtrimmers ................................... 9.51 7.6 9.72 7.9 $7.57 6.6%
Level 1 .............................. 8.49 6.8 8.66 7.3 – –Level 2 .............................. 9.85 3.8 10.03 4.0 – –Level 3 .............................. 10.94 7.6 11.18 7.6 – –
Slaughterers and meat packers ...... 11.45 3.6 11.39 3.8 – –Level 1 .............................. 10.36 10.6 9.52 10.1 – –Level 2 .............................. 10.10 3.6 10.08 3.6 – –Level 3 .............................. 11.76 2.2 11.77 2.3 – –
Miscellaneous food processingworkers ........................................ 12.96 3.6 12.98 3.7 12.40 22.5
Level 1 .............................. 8.95 6.0 8.99 6.1 – –Level 2 .............................. 11.98 4.8 12.20 4.8 – –Level 3 .............................. 14.18 5.0 14.18 5.0 – –Level 4 .............................. 16.15 5.3 15.96 5.5 – –Level 5 .............................. 17.99 4.5 18.18 4.3 – –
Food and tobacco roasting, baking,and drying machine operatorsand tenders ............................... 12.85 9.3 12.56 9.7 – –
Level 3 .............................. 15.90 4.7 15.90 4.7 – –Level 4 .............................. 15.81 11.0 14.99 10.6 – –
Food batchmakers .......................... 13.65 3.9 13.82 3.9 9.46 10.4 Level 1 .............................. 9.34 10.0 9.46 10.2 – –Level 2 .............................. 12.07 5.9 12.37 6.0 – –Level 3 .............................. 14.37 6.6 14.37 6.6 – –Level 4 .............................. 16.30 5.3 16.30 5.3 – –Level 5 .............................. 18.31 4.9 18.58 4.8 – –
Food cooking machine operatorsand tenders ............................... 11.40 8.5 11.40 8.5 – –
Level 1 .............................. 8.87 9.0 8.87 9.0 – –Level 4 .............................. 16.22 10.1 16.22 10.1 – –
Computer control programmers andoperators ...................................... 17.76 4.5 17.76 4.5 – –
Level 3 .............................. 13.48 8.8 13.48 8.8 – –Level 4 .............................. 15.34 5.9 15.34 5.9 – –Level 5 .............................. 17.63 3.8 17.63 3.8 – –Level 6 .............................. 18.85 3.7 18.85 3.7 – –Level 7 .............................. 22.67 9.4 22.67 9.4 – –
See footnotes at end of table.
NATIONAL COMPENSATION SURVEY
All United States 8-96 December 2006 - January 2008
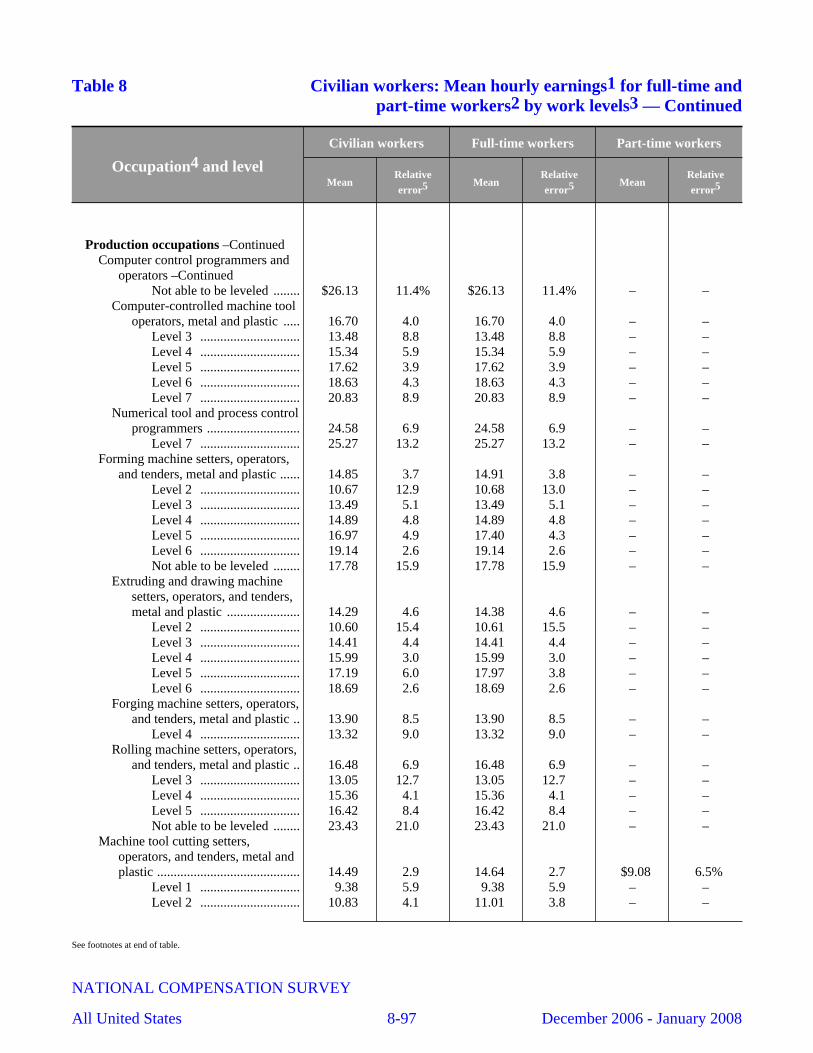
Table 8 Civilian workers: Mean hourly earnings1 for full-time andpart-time workers2 by work levels3 — Continued
Occupation4 and level
Civilian workers Full-time workers Part-time workers
MeanRelativeerror5 Mean
Relativeerror5 Mean
Relativeerror5
Production occupations –ContinuedComputer control programmers and
operators –ContinuedNot able to be leveled ........ $26.13 11.4% $26.13 11.4% – –
Computer-controlled machine tooloperators, metal and plastic ..... 16.70 4.0 16.70 4.0 – –
Level 3 .............................. 13.48 8.8 13.48 8.8 – –Level 4 .............................. 15.34 5.9 15.34 5.9 – –Level 5 .............................. 17.62 3.9 17.62 3.9 – –Level 6 .............................. 18.63 4.3 18.63 4.3 – –Level 7 .............................. 20.83 8.9 20.83 8.9 – –
Numerical tool and process controlprogrammers ............................ 24.58 6.9 24.58 6.9 – –
Level 7 .............................. 25.27 13.2 25.27 13.2 – –Forming machine setters, operators,
and tenders, metal and plastic ...... 14.85 3.7 14.91 3.8 – –Level 2 .............................. 10.67 12.9 10.68 13.0 – –Level 3 .............................. 13.49 5.1 13.49 5.1 – –Level 4 .............................. 14.89 4.8 14.89 4.8 – –Level 5 .............................. 16.97 4.9 17.40 4.3 – –Level 6 .............................. 19.14 2.6 19.14 2.6 – –Not able to be leveled ........ 17.78 15.9 17.78 15.9 – –
Extruding and drawing machinesetters, operators, and tenders,metal and plastic ...................... 14.29 4.6 14.38 4.6 – –
Level 2 .............................. 10.60 15.4 10.61 15.5 – –Level 3 .............................. 14.41 4.4 14.41 4.4 – –Level 4 .............................. 15.99 3.0 15.99 3.0 – –Level 5 .............................. 17.19 6.0 17.97 3.8 – –Level 6 .............................. 18.69 2.6 18.69 2.6 – –
Forging machine setters, operators,and tenders, metal and plastic .. 13.90 8.5 13.90 8.5 – –
Level 4 .............................. 13.32 9.0 13.32 9.0 – –Rolling machine setters, operators,
and tenders, metal and plastic .. 16.48 6.9 16.48 6.9 – –Level 3 .............................. 13.05 12.7 13.05 12.7 – –Level 4 .............................. 15.36 4.1 15.36 4.1 – –Level 5 .............................. 16.42 8.4 16.42 8.4 – –Not able to be leveled ........ 23.43 21.0 23.43 21.0 – –
Machine tool cutting setters,operators, and tenders, metal andplastic ........................................... 14.49 2.9 14.64 2.7 $9.08 6.5%
Level 1 .............................. 9.38 5.9 9.38 5.9 – –Level 2 .............................. 10.83 4.1 11.01 3.8 – –
See footnotes at end of table.
NATIONAL COMPENSATION SURVEY
All United States 8-97 December 2006 - January 2008
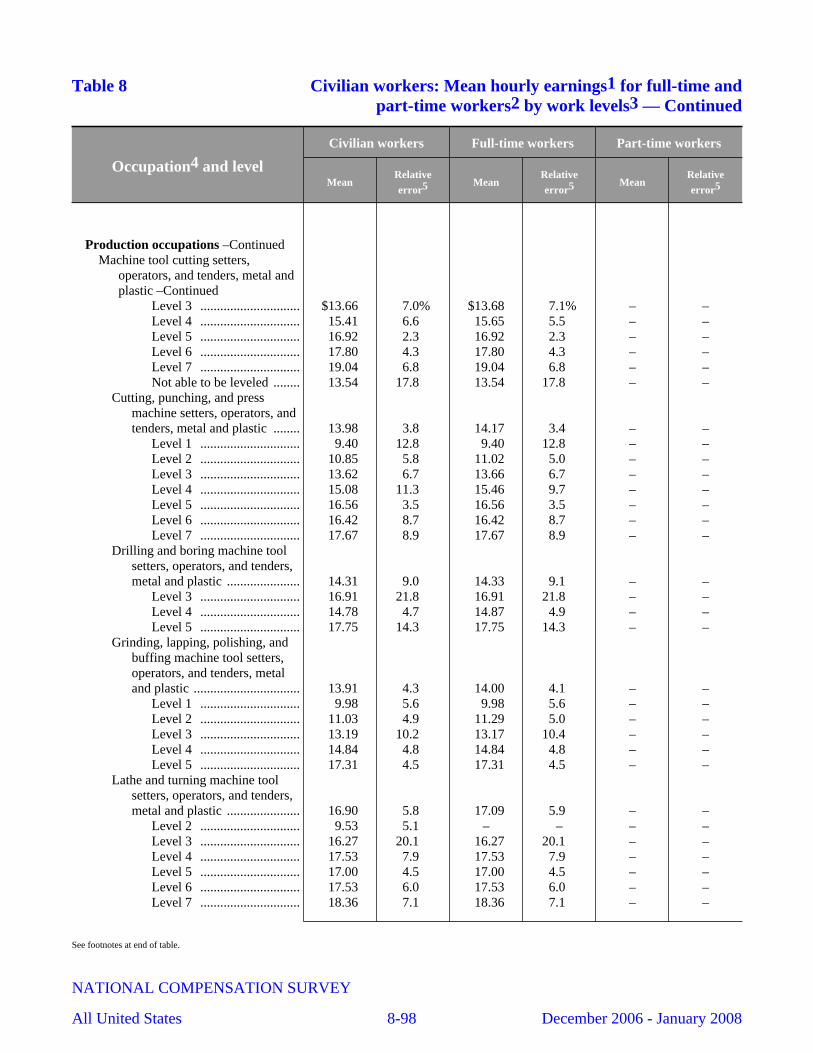
Table 8 Civilian workers: Mean hourly earnings1 for full-time andpart-time workers2 by work levels3 — Continued
Occupation4 and level
Civilian workers Full-time workers Part-time workers
MeanRelativeerror5 Mean
Relativeerror5 Mean
Relativeerror5
Production occupations –ContinuedMachine tool cutting setters,
operators, and tenders, metal andplastic –Continued
Level 3 .............................. $13.66 7.0% $13.68 7.1% – –Level 4 .............................. 15.41 6.6 15.65 5.5 – –Level 5 .............................. 16.92 2.3 16.92 2.3 – –Level 6 .............................. 17.80 4.3 17.80 4.3 – –Level 7 .............................. 19.04 6.8 19.04 6.8 – –Not able to be leveled ........ 13.54 17.8 13.54 17.8 – –
Cutting, punching, and pressmachine setters, operators, andtenders, metal and plastic ........ 13.98 3.8 14.17 3.4 – –
Level 1 .............................. 9.40 12.8 9.40 12.8 – –Level 2 .............................. 10.85 5.8 11.02 5.0 – –Level 3 .............................. 13.62 6.7 13.66 6.7 – –Level 4 .............................. 15.08 11.3 15.46 9.7 – –Level 5 .............................. 16.56 3.5 16.56 3.5 – –Level 6 .............................. 16.42 8.7 16.42 8.7 – –Level 7 .............................. 17.67 8.9 17.67 8.9 – –
Drilling and boring machine toolsetters, operators, and tenders,metal and plastic ...................... 14.31 9.0 14.33 9.1 – –
Level 3 .............................. 16.91 21.8 16.91 21.8 – –Level 4 .............................. 14.78 4.7 14.87 4.9 – –Level 5 .............................. 17.75 14.3 17.75 14.3 – –
Grinding, lapping, polishing, andbuffing machine tool setters,operators, and tenders, metaland plastic ................................ 13.91 4.3 14.00 4.1 – –
Level 1 .............................. 9.98 5.6 9.98 5.6 – –Level 2 .............................. 11.03 4.9 11.29 5.0 – –Level 3 .............................. 13.19 10.2 13.17 10.4 – –Level 4 .............................. 14.84 4.8 14.84 4.8 – –Level 5 .............................. 17.31 4.5 17.31 4.5 – –
Lathe and turning machine toolsetters, operators, and tenders,metal and plastic ...................... 16.90 5.8 17.09 5.9 – –
Level 2 .............................. 9.53 5.1 – – – –Level 3 .............................. 16.27 20.1 16.27 20.1 – –Level 4 .............................. 17.53 7.9 17.53 7.9 – –Level 5 .............................. 17.00 4.5 17.00 4.5 – –Level 6 .............................. 17.53 6.0 17.53 6.0 – –Level 7 .............................. 18.36 7.1 18.36 7.1 – –
See footnotes at end of table.
NATIONAL COMPENSATION SURVEY
All United States 8-98 December 2006 - January 2008
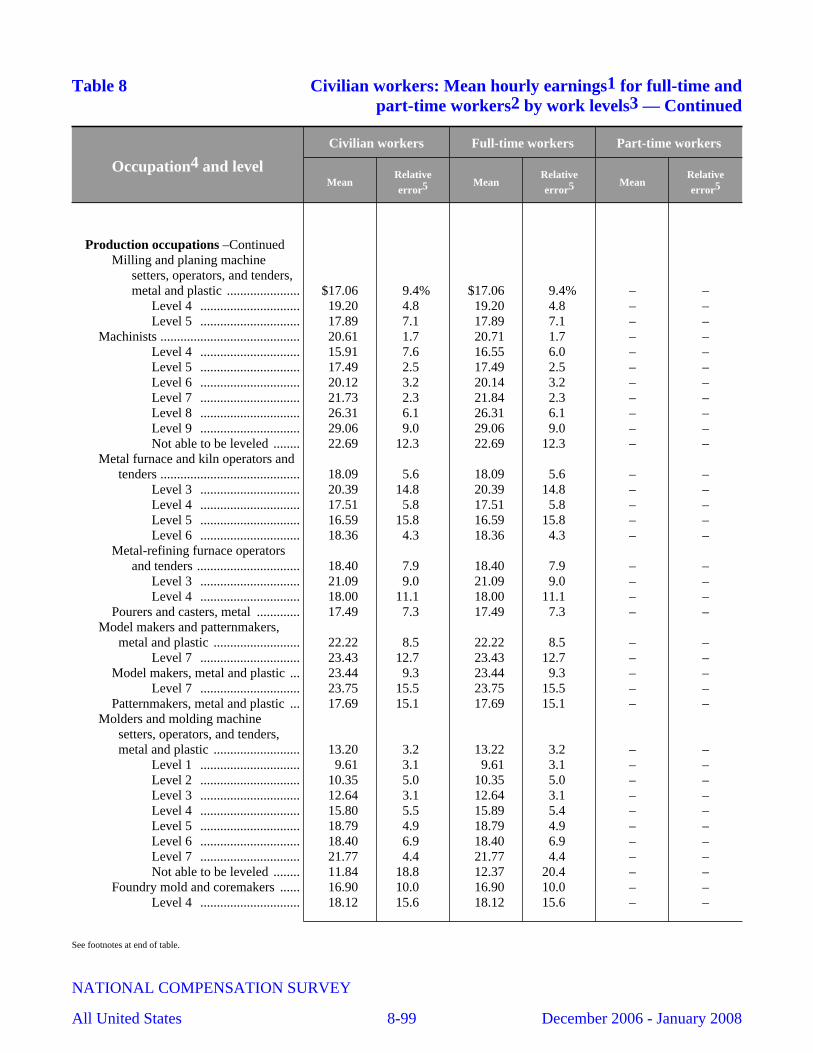
Table 8 Civilian workers: Mean hourly earnings1 for full-time andpart-time workers2 by work levels3 — Continued
Occupation4 and level
Civilian workers Full-time workers Part-time workers
MeanRelativeerror5 Mean
Relativeerror5 Mean
Relativeerror5
Production occupations –ContinuedMilling and planing machine
setters, operators, and tenders,metal and plastic ...................... $17.06 9.4% $17.06 9.4% – –
Level 4 .............................. 19.20 4.8 19.20 4.8 – –Level 5 .............................. 17.89 7.1 17.89 7.1 – –
Machinists .......................................... 20.61 1.7 20.71 1.7 – –Level 4 .............................. 15.91 7.6 16.55 6.0 – –Level 5 .............................. 17.49 2.5 17.49 2.5 – –Level 6 .............................. 20.12 3.2 20.14 3.2 – –Level 7 .............................. 21.73 2.3 21.84 2.3 – –Level 8 .............................. 26.31 6.1 26.31 6.1 – –Level 9 .............................. 29.06 9.0 29.06 9.0 – –Not able to be leveled ........ 22.69 12.3 22.69 12.3 – –
Metal furnace and kiln operators andtenders .......................................... 18.09 5.6 18.09 5.6 – –
Level 3 .............................. 20.39 14.8 20.39 14.8 – –Level 4 .............................. 17.51 5.8 17.51 5.8 – –Level 5 .............................. 16.59 15.8 16.59 15.8 – –Level 6 .............................. 18.36 4.3 18.36 4.3 – –
Metal-refining furnace operatorsand tenders ............................... 18.40 7.9 18.40 7.9 – –
Level 3 .............................. 21.09 9.0 21.09 9.0 – –Level 4 .............................. 18.00 11.1 18.00 11.1 – –
Pourers and casters, metal ............. 17.49 7.3 17.49 7.3 – –Model makers and patternmakers,
metal and plastic .......................... 22.22 8.5 22.22 8.5 – –Level 7 .............................. 23.43 12.7 23.43 12.7 – –
Model makers, metal and plastic ... 23.44 9.3 23.44 9.3 – –Level 7 .............................. 23.75 15.5 23.75 15.5 – –
Patternmakers, metal and plastic ... 17.69 15.1 17.69 15.1 – –Molders and molding machine
setters, operators, and tenders,metal and plastic .......................... 13.20 3.2 13.22 3.2 – –
Level 1 .............................. 9.61 3.1 9.61 3.1 – –Level 2 .............................. 10.35 5.0 10.35 5.0 – –Level 3 .............................. 12.64 3.1 12.64 3.1 – –Level 4 .............................. 15.80 5.5 15.89 5.4 – –Level 5 .............................. 18.79 4.9 18.79 4.9 – –Level 6 .............................. 18.40 6.9 18.40 6.9 – –Level 7 .............................. 21.77 4.4 21.77 4.4 – –Not able to be leveled ........ 11.84 18.8 12.37 20.4 – –
Foundry mold and coremakers ...... 16.90 10.0 16.90 10.0 – –Level 4 .............................. 18.12 15.6 18.12 15.6 – –
See footnotes at end of table.
NATIONAL COMPENSATION SURVEY
All United States 8-99 December 2006 - January 2008

Table 8 Civilian workers: Mean hourly earnings1 for full-time andpart-time workers2 by work levels3 — Continued
Occupation4 and level
Civilian workers Full-time workers Part-time workers
MeanRelativeerror5 Mean
Relativeerror5 Mean
Relativeerror5
Production occupations –ContinuedMolding, coremaking, and casting
machine setters, operators, andtenders, metal and plastic ........ $12.98 3.3% $13.00 3.3% – –
Level 1 .............................. 9.57 2.9 9.57 2.9 – –Level 2 .............................. 10.35 5.0 10.35 5.0 – –Level 3 .............................. 12.62 3.2 12.62 3.2 – –Level 4 .............................. 15.38 5.9 15.47 5.8 – –Level 5 .............................. 18.93 5.0 18.93 5.0 – –Level 6 .............................. 18.15 8.0 18.15 8.0 – –Level 7 .............................. 21.77 4.4 21.77 4.4 – –Not able to be leveled ........ 11.84 18.8 12.37 20.4 – –
Multiple machine tool setters,operators, and tenders, metal andplastic ........................................... 16.57 3.7 16.57 3.7 – –
Level 2 .............................. 11.40 7.7 11.40 7.7 – –Level 3 .............................. 14.98 6.6 14.98 6.6 – –Level 4 .............................. 18.27 6.3 18.27 6.3 – –Level 5 .............................. 18.82 6.9 18.82 6.9 – –Level 6 .............................. 19.64 7.4 19.64 7.4 – –Level 7 .............................. 20.48 6.5 20.48 6.5 – –
Tool and die makers .......................... 24.19 2.0 24.19 2.0 – –Level 5 .............................. 19.27 4.0 19.27 4.0 – –Level 6 .............................. 22.14 4.9 22.14 4.9 – –Level 7 .............................. 25.47 2.1 25.47 2.1 – –Level 8 .............................. 25.82 4.4 25.82 4.4 – –Not able to be leveled ........ 20.88 8.9 20.88 8.9 – –
Welding, soldering, and brazingworkers ........................................ 17.03 2.5 17.04 2.5 – –
Level 2 .............................. 11.54 5.1 11.54 5.1 – –Level 3 .............................. 14.06 5.0 14.06 5.0 – –Level 4 .............................. 15.63 4.0 15.65 4.0 – –Level 5 .............................. 17.04 4.0 17.03 4.0 – –Level 6 .............................. 19.77 3.4 19.77 3.4 – –Level 7 .............................. 22.49 6.7 22.49 6.7 – –Not able to be leveled ........ 17.74 8.6 17.85 8.5 – –
Welders, cutters, solderers, andbrazers ...................................... 17.14 2.8 17.15 2.8 – –
Level 2 .............................. 11.72 5.7 11.72 5.7 – –Level 3 .............................. 12.89 3.6 12.89 3.6 – –Level 4 .............................. 15.79 4.2 15.81 4.3 – –Level 5 .............................. 16.98 4.4 16.98 4.4 – –Level 6 .............................. 19.56 3.5 19.56 3.5 – –Level 7 .............................. 22.62 6.8 22.62 6.8 – –
See footnotes at end of table.
NATIONAL COMPENSATION SURVEY
All United States 8-100 December 2006 - January 2008

Table 8 Civilian workers: Mean hourly earnings1 for full-time andpart-time workers2 by work levels3 — Continued
Occupation4 and level
Civilian workers Full-time workers Part-time workers
MeanRelativeerror5 Mean
Relativeerror5 Mean
Relativeerror5
Production occupations –ContinuedWelders, cutters, solderers, and
brazers –ContinuedNot able to be leveled ........ $18.08 11.7% $18.25 11.8% – –
Welding, soldering, and brazingmachine setters, operators, andtenders ...................................... 16.29 5.4 16.29 5.4 – –
Level 2 .............................. 11.27 9.0 11.27 9.0 – –Level 3 .............................. 17.76 18.0 17.76 18.0 – –Level 4 .............................. 14.17 10.0 14.17 10.0 – –Level 5 .............................. 17.55 4.0 17.55 4.0 – –Level 6 .............................. 21.57 8.7 21.57 8.7 – –
Miscellaneous metalworkers andplastic workers ............................. 15.22 5.6 15.27 5.6 – –
Level 2 .............................. 11.65 6.8 11.65 6.8 – –Level 3 .............................. 13.40 8.3 13.61 8.0 – –Level 4 .............................. 15.93 2.4 15.93 2.4 – –Level 5 .............................. 17.11 5.3 17.11 5.3 – –Level 6 .............................. 19.74 4.8 19.74 4.8 – –Level 7 .............................. 22.32 6.2 22.32 6.2 – –Not able to be leveled ........ 19.22 18.7 19.22 18.7 – –
Heat treating equipment setters,operators, and tenders, metaland plastic ................................ 16.72 10.2 16.72 10.2 – –
Level 4 .............................. 16.97 6.8 16.97 6.8 – –Level 5 .............................. 17.86 6.6 17.86 6.6 – –
Lay-out workers, metal and plastic 18.41 13.4 18.41 13.4 – –Level 5 .............................. 19.30 23.3 19.30 23.3 – –
Plating and coating machinesetters, operators, and tenders,metal and plastic ...................... 15.40 8.1 15.58 7.8 – –
Level 2 .............................. 10.33 8.2 10.33 8.2 – –Level 3 .............................. 12.28 12.0 12.79 11.1 – –Level 4 .............................. 15.88 4.6 15.88 4.6 – –Level 5 .............................. 16.65 10.0 16.65 10.0 – –Not able to be leveled ........ 22.41 16.5 22.41 16.5 – –
Tool grinders, filers, andsharpeners ................................ 16.83 7.0 16.83 7.0 – –
Level 3 .............................. 12.14 13.6 12.14 13.6 – –Level 7 .............................. 25.28 11.6 25.28 11.6 – –
Bookbinders and bindery workers ..... 13.22 3.5 13.84 3.4 $8.45 6.5%Level 1 .............................. 9.21 13.0 – – – –Level 2 .............................. 12.45 12.8 12.62 13.4 – –Level 3 .............................. 11.11 6.3 11.42 6.6 – –
See footnotes at end of table.
NATIONAL COMPENSATION SURVEY
All United States 8-101 December 2006 - January 2008

Table 8 Civilian workers: Mean hourly earnings1 for full-time andpart-time workers2 by work levels3 — Continued
Occupation4 and level
Civilian workers Full-time workers Part-time workers
MeanRelativeerror5 Mean
Relativeerror5 Mean
Relativeerror5
Production occupations –ContinuedBookbinders and bindery workers
–ContinuedLevel 4 .............................. $13.29 4.4% $13.29 4.4% – –Level 5 .............................. 17.70 7.0 17.70 7.0 – –Not able to be leveled ........ 11.87 6.1 – – – –
Bindery workers ............................ 13.15 3.5 13.77 3.4 $8.45 6.5%Level 1 .............................. 9.21 13.0 – – – –Level 2 .............................. 12.45 12.8 12.62 13.4 – –Level 3 .............................. 11.11 6.3 11.42 6.6 – –Level 4 .............................. 13.29 4.4 13.29 4.4 – –Level 5 .............................. 17.70 7.0 17.70 7.0 – –Not able to be leveled ........ 11.87 6.1 – – – –
Printers ............................................... 16.60 3.5 16.69 3.6 13.87 7.6 Level 2 .............................. 11.40 3.3 11.46 3.4 – –Level 3 .............................. 13.76 4.1 13.81 4.3 – –Level 4 .............................. 15.51 3.9 15.52 3.9 – –Level 5 .............................. 17.44 2.0 17.58 2.0 – –Level 6 .............................. 21.06 2.7 21.20 2.6 – –Level 7 .............................. 21.04 3.7 20.99 3.7 – –Not able to be leveled ........ 17.68 13.8 17.87 14.6 – –
Job printers .................................... 17.28 6.0 17.28 6.0 – –Level 5 .............................. 18.51 5.5 18.51 5.5 – –Level 7 .............................. 21.41 3.6 21.41 3.6 – –
Prepress technicians and workers .. 16.87 3.2 17.21 3.2 12.10 8.4 Level 3 .............................. 13.51 7.1 13.95 7.0 – –Level 4 .............................. 15.40 14.7 15.69 15.5 – –Level 5 .............................. 16.26 3.8 16.53 3.7 – –Level 6 .............................. 21.27 6.0 21.27 6.0 – –Level 7 .............................. 22.77 3.6 22.77 3.6 – –
Printing machine operators ............ 16.40 4.8 16.42 4.9 15.52 10.9 Level 2 .............................. 11.65 3.4 11.74 3.5 – –Level 3 .............................. 13.57 5.0 13.45 5.1 – –Level 4 .............................. 15.47 4.1 15.46 4.1 – –Level 5 .............................. 18.20 3.2 18.23 3.2 – –Level 6 .............................. 21.05 3.5 21.26 3.5 – –Level 7 .............................. 20.63 4.5 20.55 4.6 – –Not able to be leveled ........ 18.33 11.6 18.33 11.6 – –
Laundry and dry-cleaning workers .... 10.19 4.7 10.33 4.9 8.82 7.1 Level 1 .............................. 9.08 2.5 9.24 2.6 7.91 4.3 Level 2 .............................. 9.92 2.6 9.93 2.8 9.84 3.7 Level 3 .............................. 14.80 7.7 14.77 8.1 – –
Pressers, textile, garment, and relatedmaterials ...................................... 9.48 6.5 9.42 7.1 10.33 2.3
See footnotes at end of table.
NATIONAL COMPENSATION SURVEY
All United States 8-102 December 2006 - January 2008
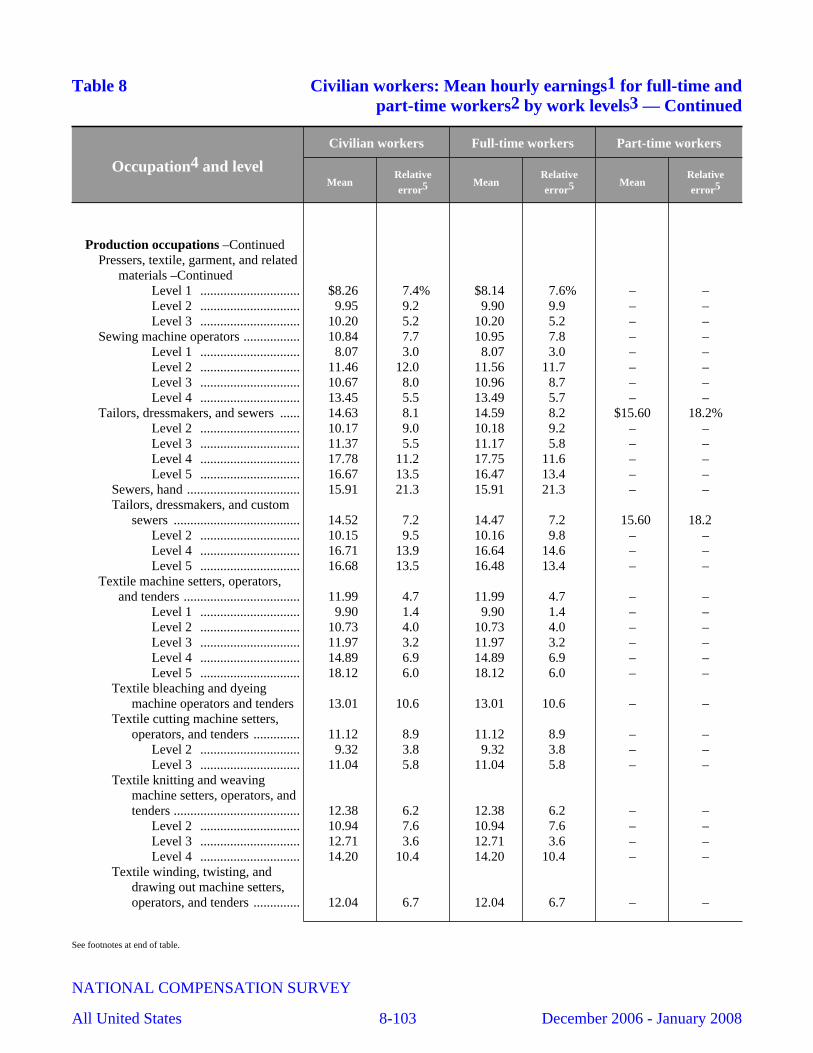
Table 8 Civilian workers: Mean hourly earnings1 for full-time andpart-time workers2 by work levels3 — Continued
Occupation4 and level
Civilian workers Full-time workers Part-time workers
MeanRelativeerror5 Mean
Relativeerror5 Mean
Relativeerror5
Production occupations –ContinuedPressers, textile, garment, and related
materials –ContinuedLevel 1 .............................. $8.26 7.4% $8.14 7.6% – –Level 2 .............................. 9.95 9.2 9.90 9.9 – –Level 3 .............................. 10.20 5.2 10.20 5.2 – –
Sewing machine operators ................. 10.84 7.7 10.95 7.8 – –Level 1 .............................. 8.07 3.0 8.07 3.0 – –Level 2 .............................. 11.46 12.0 11.56 11.7 – –Level 3 .............................. 10.67 8.0 10.96 8.7 – –Level 4 .............................. 13.45 5.5 13.49 5.7 – –
Tailors, dressmakers, and sewers ...... 14.63 8.1 14.59 8.2 $15.60 18.2%Level 2 .............................. 10.17 9.0 10.18 9.2 – –Level 3 .............................. 11.37 5.5 11.17 5.8 – –Level 4 .............................. 17.78 11.2 17.75 11.6 – –Level 5 .............................. 16.67 13.5 16.47 13.4 – –
Sewers, hand .................................. 15.91 21.3 15.91 21.3 – –Tailors, dressmakers, and custom
sewers ...................................... 14.52 7.2 14.47 7.2 15.60 18.2 Level 2 .............................. 10.15 9.5 10.16 9.8 – –Level 4 .............................. 16.71 13.9 16.64 14.6 – –Level 5 .............................. 16.68 13.5 16.48 13.4 – –
Textile machine setters, operators,and tenders ................................... 11.99 4.7 11.99 4.7 – –
Level 1 .............................. 9.90 1.4 9.90 1.4 – –Level 2 .............................. 10.73 4.0 10.73 4.0 – –Level 3 .............................. 11.97 3.2 11.97 3.2 – –Level 4 .............................. 14.89 6.9 14.89 6.9 – –Level 5 .............................. 18.12 6.0 18.12 6.0 – –
Textile bleaching and dyeingmachine operators and tenders 13.01 10.6 13.01 10.6 – –
Textile cutting machine setters,operators, and tenders .............. 11.12 8.9 11.12 8.9 – –
Level 2 .............................. 9.32 3.8 9.32 3.8 – –Level 3 .............................. 11.04 5.8 11.04 5.8 – –
Textile knitting and weavingmachine setters, operators, andtenders ...................................... 12.38 6.2 12.38 6.2 – –
Level 2 .............................. 10.94 7.6 10.94 7.6 – –Level 3 .............................. 12.71 3.6 12.71 3.6 – –Level 4 .............................. 14.20 10.4 14.20 10.4 – –
Textile winding, twisting, anddrawing out machine setters,operators, and tenders .............. 12.04 6.7 12.04 6.7 – –
See footnotes at end of table.
NATIONAL COMPENSATION SURVEY
All United States 8-103 December 2006 - January 2008
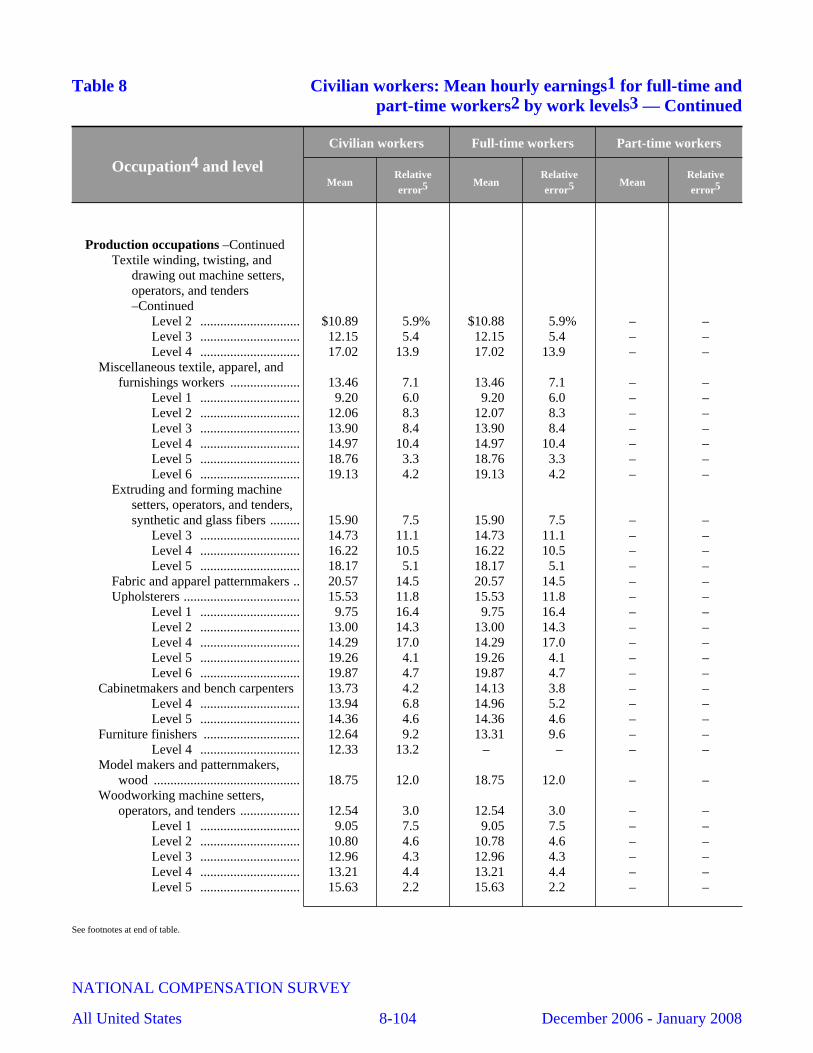
Table 8 Civilian workers: Mean hourly earnings1 for full-time andpart-time workers2 by work levels3 — Continued
Occupation4 and level
Civilian workers Full-time workers Part-time workers
MeanRelativeerror5 Mean
Relativeerror5 Mean
Relativeerror5
Production occupations –ContinuedTextile winding, twisting, and
drawing out machine setters,operators, and tenders–Continued
Level 2 .............................. $10.89 5.9% $10.88 5.9% – –Level 3 .............................. 12.15 5.4 12.15 5.4 – –Level 4 .............................. 17.02 13.9 17.02 13.9 – –
Miscellaneous textile, apparel, andfurnishings workers ..................... 13.46 7.1 13.46 7.1 – –
Level 1 .............................. 9.20 6.0 9.20 6.0 – –Level 2 .............................. 12.06 8.3 12.07 8.3 – –Level 3 .............................. 13.90 8.4 13.90 8.4 – –Level 4 .............................. 14.97 10.4 14.97 10.4 – –Level 5 .............................. 18.76 3.3 18.76 3.3 – –Level 6 .............................. 19.13 4.2 19.13 4.2 – –
Extruding and forming machinesetters, operators, and tenders,synthetic and glass fibers ......... 15.90 7.5 15.90 7.5 – –
Level 3 .............................. 14.73 11.1 14.73 11.1 – –Level 4 .............................. 16.22 10.5 16.22 10.5 – –Level 5 .............................. 18.17 5.1 18.17 5.1 – –
Fabric and apparel patternmakers .. 20.57 14.5 20.57 14.5 – –Upholsterers ................................... 15.53 11.8 15.53 11.8 – –
Level 1 .............................. 9.75 16.4 9.75 16.4 – –Level 2 .............................. 13.00 14.3 13.00 14.3 – –Level 4 .............................. 14.29 17.0 14.29 17.0 – –Level 5 .............................. 19.26 4.1 19.26 4.1 – –Level 6 .............................. 19.87 4.7 19.87 4.7 – –
Cabinetmakers and bench carpenters 13.73 4.2 14.13 3.8 – –Level 4 .............................. 13.94 6.8 14.96 5.2 – –Level 5 .............................. 14.36 4.6 14.36 4.6 – –
Furniture finishers ............................. 12.64 9.2 13.31 9.6 – –Level 4 .............................. 12.33 13.2 – – – –
Model makers and patternmakers,wood ............................................ 18.75 12.0 18.75 12.0 – –
Woodworking machine setters,operators, and tenders .................. 12.54 3.0 12.54 3.0 – –
Level 1 .............................. 9.05 7.5 9.05 7.5 – –Level 2 .............................. 10.80 4.6 10.78 4.6 – –Level 3 .............................. 12.96 4.3 12.96 4.3 – –Level 4 .............................. 13.21 4.4 13.21 4.4 – –Level 5 .............................. 15.63 2.2 15.63 2.2 – –
See footnotes at end of table.
NATIONAL COMPENSATION SURVEY
All United States 8-104 December 2006 - January 2008
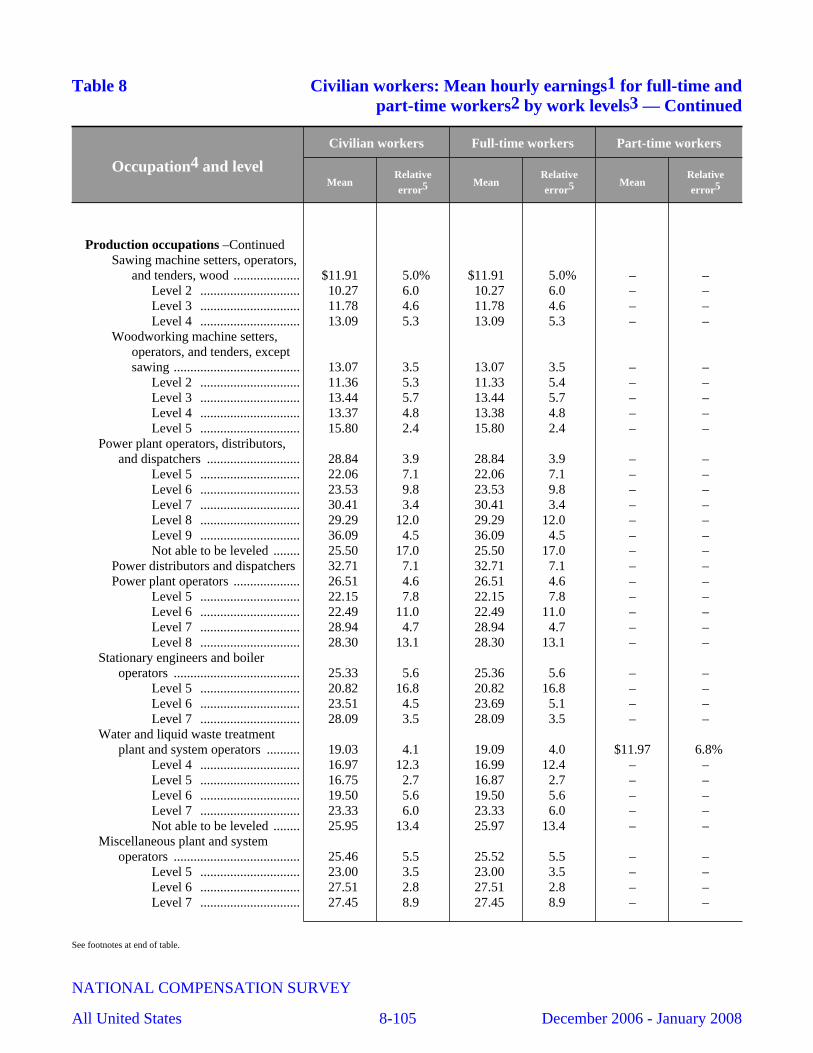
Table 8 Civilian workers: Mean hourly earnings1 for full-time andpart-time workers2 by work levels3 — Continued
Occupation4 and level
Civilian workers Full-time workers Part-time workers
MeanRelativeerror5 Mean
Relativeerror5 Mean
Relativeerror5
Production occupations –ContinuedSawing machine setters, operators,
and tenders, wood .................... $11.91 5.0% $11.91 5.0% – –Level 2 .............................. 10.27 6.0 10.27 6.0 – –Level 3 .............................. 11.78 4.6 11.78 4.6 – –Level 4 .............................. 13.09 5.3 13.09 5.3 – –
Woodworking machine setters,operators, and tenders, exceptsawing ...................................... 13.07 3.5 13.07 3.5 – –
Level 2 .............................. 11.36 5.3 11.33 5.4 – –Level 3 .............................. 13.44 5.7 13.44 5.7 – –Level 4 .............................. 13.37 4.8 13.38 4.8 – –Level 5 .............................. 15.80 2.4 15.80 2.4 – –
Power plant operators, distributors,and dispatchers ............................ 28.84 3.9 28.84 3.9 – –
Level 5 .............................. 22.06 7.1 22.06 7.1 – –Level 6 .............................. 23.53 9.8 23.53 9.8 – –Level 7 .............................. 30.41 3.4 30.41 3.4 – –Level 8 .............................. 29.29 12.0 29.29 12.0 – –Level 9 .............................. 36.09 4.5 36.09 4.5 – –Not able to be leveled ........ 25.50 17.0 25.50 17.0 – –
Power distributors and dispatchers 32.71 7.1 32.71 7.1 – –Power plant operators .................... 26.51 4.6 26.51 4.6 – –
Level 5 .............................. 22.15 7.8 22.15 7.8 – –Level 6 .............................. 22.49 11.0 22.49 11.0 – –Level 7 .............................. 28.94 4.7 28.94 4.7 – –Level 8 .............................. 28.30 13.1 28.30 13.1 – –
Stationary engineers and boileroperators ...................................... 25.33 5.6 25.36 5.6 – –
Level 5 .............................. 20.82 16.8 20.82 16.8 – –Level 6 .............................. 23.51 4.5 23.69 5.1 – –Level 7 .............................. 28.09 3.5 28.09 3.5 – –
Water and liquid waste treatmentplant and system operators .......... 19.03 4.1 19.09 4.0 $11.97 6.8%
Level 4 .............................. 16.97 12.3 16.99 12.4 – –Level 5 .............................. 16.75 2.7 16.87 2.7 – –Level 6 .............................. 19.50 5.6 19.50 5.6 – –Level 7 .............................. 23.33 6.0 23.33 6.0 – –Not able to be leveled ........ 25.95 13.4 25.97 13.4 – –
Miscellaneous plant and systemoperators ...................................... 25.46 5.5 25.52 5.5 – –
Level 5 .............................. 23.00 3.5 23.00 3.5 – –Level 6 .............................. 27.51 2.8 27.51 2.8 – –Level 7 .............................. 27.45 8.9 27.45 8.9 – –
See footnotes at end of table.
NATIONAL COMPENSATION SURVEY
All United States 8-105 December 2006 - January 2008
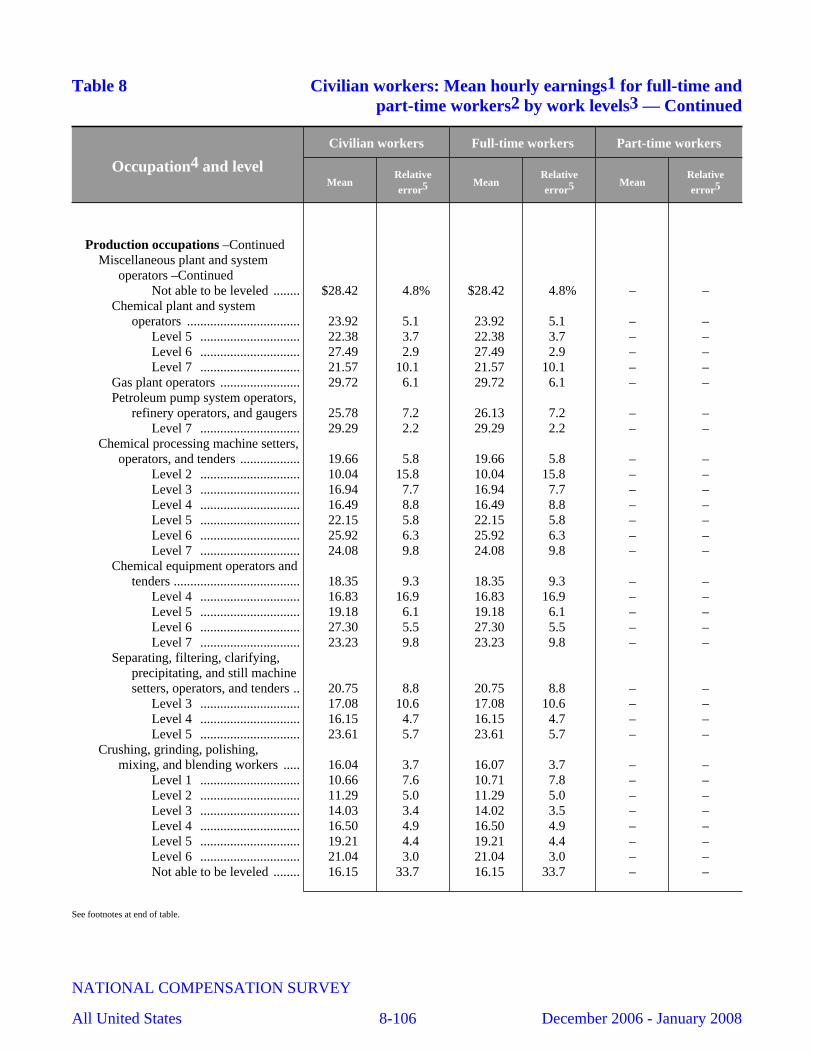
Table 8 Civilian workers: Mean hourly earnings1 for full-time andpart-time workers2 by work levels3 — Continued
Occupation4 and level
Civilian workers Full-time workers Part-time workers
MeanRelativeerror5 Mean
Relativeerror5 Mean
Relativeerror5
Production occupations –ContinuedMiscellaneous plant and system
operators –ContinuedNot able to be leveled ........ $28.42 4.8% $28.42 4.8% – –
Chemical plant and systemoperators .................................. 23.92 5.1 23.92 5.1 – –
Level 5 .............................. 22.38 3.7 22.38 3.7 – –Level 6 .............................. 27.49 2.9 27.49 2.9 – –Level 7 .............................. 21.57 10.1 21.57 10.1 – –
Gas plant operators ........................ 29.72 6.1 29.72 6.1 – –Petroleum pump system operators,
refinery operators, and gaugers 25.78 7.2 26.13 7.2 – –Level 7 .............................. 29.29 2.2 29.29 2.2 – –
Chemical processing machine setters,operators, and tenders .................. 19.66 5.8 19.66 5.8 – –
Level 2 .............................. 10.04 15.8 10.04 15.8 – –Level 3 .............................. 16.94 7.7 16.94 7.7 – –Level 4 .............................. 16.49 8.8 16.49 8.8 – –Level 5 .............................. 22.15 5.8 22.15 5.8 – –Level 6 .............................. 25.92 6.3 25.92 6.3 – –Level 7 .............................. 24.08 9.8 24.08 9.8 – –
Chemical equipment operators andtenders ...................................... 18.35 9.3 18.35 9.3 – –
Level 4 .............................. 16.83 16.9 16.83 16.9 – –Level 5 .............................. 19.18 6.1 19.18 6.1 – –Level 6 .............................. 27.30 5.5 27.30 5.5 – –Level 7 .............................. 23.23 9.8 23.23 9.8 – –
Separating, filtering, clarifying,precipitating, and still machinesetters, operators, and tenders .. 20.75 8.8 20.75 8.8 – –
Level 3 .............................. 17.08 10.6 17.08 10.6 – –Level 4 .............................. 16.15 4.7 16.15 4.7 – –Level 5 .............................. 23.61 5.7 23.61 5.7 – –
Crushing, grinding, polishing,mixing, and blending workers ..... 16.04 3.7 16.07 3.7 – –
Level 1 .............................. 10.66 7.6 10.71 7.8 – –Level 2 .............................. 11.29 5.0 11.29 5.0 – –Level 3 .............................. 14.03 3.4 14.02 3.5 – –Level 4 .............................. 16.50 4.9 16.50 4.9 – –Level 5 .............................. 19.21 4.4 19.21 4.4 – –Level 6 .............................. 21.04 3.0 21.04 3.0 – –Not able to be leveled ........ 16.15 33.7 16.15 33.7 – –
See footnotes at end of table.
NATIONAL COMPENSATION SURVEY
All United States 8-106 December 2006 - January 2008
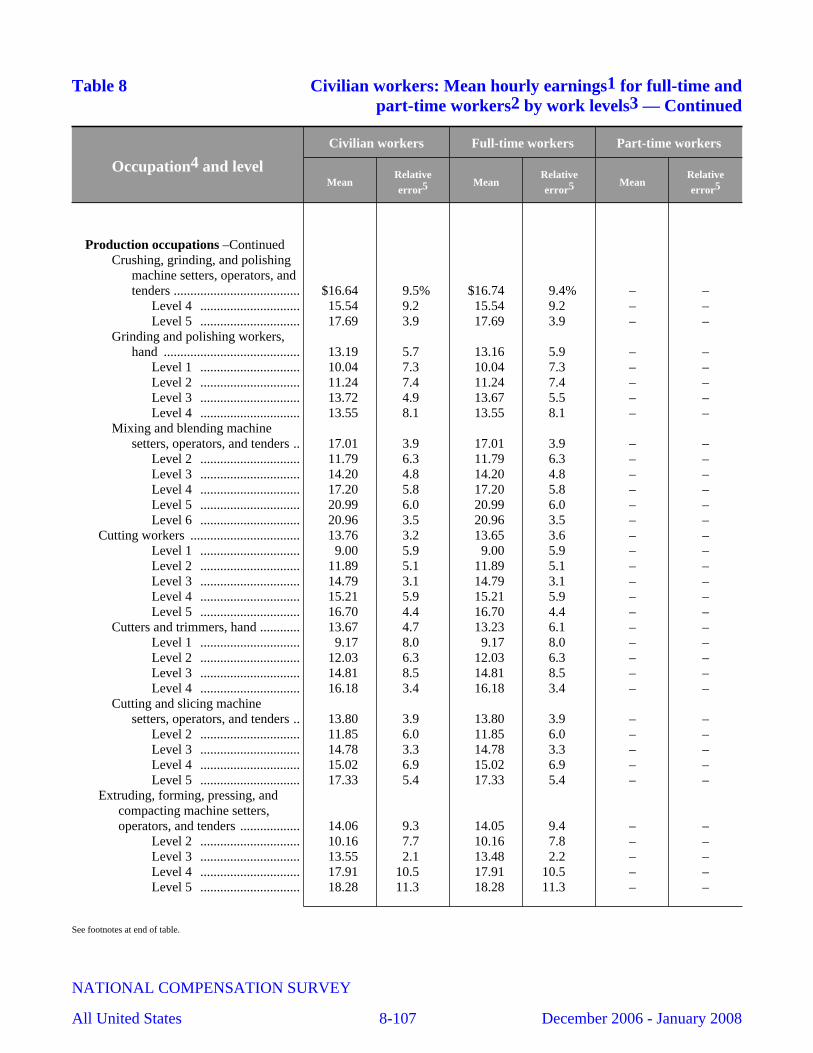
Table 8 Civilian workers: Mean hourly earnings1 for full-time andpart-time workers2 by work levels3 — Continued
Occupation4 and level
Civilian workers Full-time workers Part-time workers
MeanRelativeerror5 Mean
Relativeerror5 Mean
Relativeerror5
Production occupations –ContinuedCrushing, grinding, and polishing
machine setters, operators, andtenders ...................................... $16.64 9.5% $16.74 9.4% – –
Level 4 .............................. 15.54 9.2 15.54 9.2 – –Level 5 .............................. 17.69 3.9 17.69 3.9 – –
Grinding and polishing workers,hand ......................................... 13.19 5.7 13.16 5.9 – –
Level 1 .............................. 10.04 7.3 10.04 7.3 – –Level 2 .............................. 11.24 7.4 11.24 7.4 – –Level 3 .............................. 13.72 4.9 13.67 5.5 – –Level 4 .............................. 13.55 8.1 13.55 8.1 – –
Mixing and blending machinesetters, operators, and tenders .. 17.01 3.9 17.01 3.9 – –
Level 2 .............................. 11.79 6.3 11.79 6.3 – –Level 3 .............................. 14.20 4.8 14.20 4.8 – –Level 4 .............................. 17.20 5.8 17.20 5.8 – –Level 5 .............................. 20.99 6.0 20.99 6.0 – –Level 6 .............................. 20.96 3.5 20.96 3.5 – –
Cutting workers ................................. 13.76 3.2 13.65 3.6 – –Level 1 .............................. 9.00 5.9 9.00 5.9 – –Level 2 .............................. 11.89 5.1 11.89 5.1 – –Level 3 .............................. 14.79 3.1 14.79 3.1 – –Level 4 .............................. 15.21 5.9 15.21 5.9 – –Level 5 .............................. 16.70 4.4 16.70 4.4 – –
Cutters and trimmers, hand ............ 13.67 4.7 13.23 6.1 – –Level 1 .............................. 9.17 8.0 9.17 8.0 – –Level 2 .............................. 12.03 6.3 12.03 6.3 – –Level 3 .............................. 14.81 8.5 14.81 8.5 – –Level 4 .............................. 16.18 3.4 16.18 3.4 – –
Cutting and slicing machinesetters, operators, and tenders .. 13.80 3.9 13.80 3.9 – –
Level 2 .............................. 11.85 6.0 11.85 6.0 – –Level 3 .............................. 14.78 3.3 14.78 3.3 – –Level 4 .............................. 15.02 6.9 15.02 6.9 – –Level 5 .............................. 17.33 5.4 17.33 5.4 – –
Extruding, forming, pressing, andcompacting machine setters,operators, and tenders .................. 14.06 9.3 14.05 9.4 – –
Level 2 .............................. 10.16 7.7 10.16 7.8 – –Level 3 .............................. 13.55 2.1 13.48 2.2 – –Level 4 .............................. 17.91 10.5 17.91 10.5 – –Level 5 .............................. 18.28 11.3 18.28 11.3 – –
See footnotes at end of table.
NATIONAL COMPENSATION SURVEY
All United States 8-107 December 2006 - January 2008
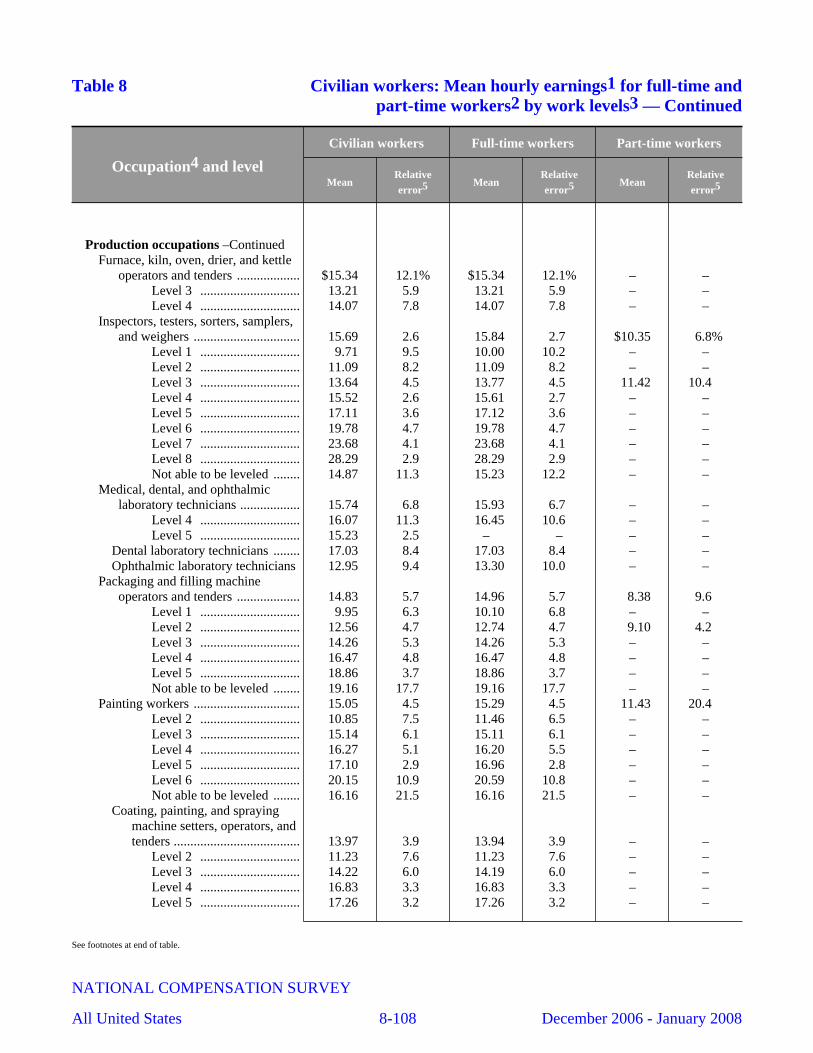
Table 8 Civilian workers: Mean hourly earnings1 for full-time andpart-time workers2 by work levels3 — Continued
Occupation4 and level
Civilian workers Full-time workers Part-time workers
MeanRelativeerror5 Mean
Relativeerror5 Mean
Relativeerror5
Production occupations –ContinuedFurnace, kiln, oven, drier, and kettle
operators and tenders ................... $15.34 12.1% $15.34 12.1% – –Level 3 .............................. 13.21 5.9 13.21 5.9 – –Level 4 .............................. 14.07 7.8 14.07 7.8 – –
Inspectors, testers, sorters, samplers,and weighers ................................ 15.69 2.6 15.84 2.7 $10.35 6.8%
Level 1 .............................. 9.71 9.5 10.00 10.2 – –Level 2 .............................. 11.09 8.2 11.09 8.2 – –Level 3 .............................. 13.64 4.5 13.77 4.5 11.42 10.4 Level 4 .............................. 15.52 2.6 15.61 2.7 – –Level 5 .............................. 17.11 3.6 17.12 3.6 – –Level 6 .............................. 19.78 4.7 19.78 4.7 – –Level 7 .............................. 23.68 4.1 23.68 4.1 – –Level 8 .............................. 28.29 2.9 28.29 2.9 – –Not able to be leveled ........ 14.87 11.3 15.23 12.2 – –
Medical, dental, and ophthalmiclaboratory technicians .................. 15.74 6.8 15.93 6.7 – –
Level 4 .............................. 16.07 11.3 16.45 10.6 – –Level 5 .............................. 15.23 2.5 – – – –
Dental laboratory technicians ........ 17.03 8.4 17.03 8.4 – –Ophthalmic laboratory technicians 12.95 9.4 13.30 10.0 – –
Packaging and filling machineoperators and tenders ................... 14.83 5.7 14.96 5.7 8.38 9.6
Level 1 .............................. 9.95 6.3 10.10 6.8 – –Level 2 .............................. 12.56 4.7 12.74 4.7 9.10 4.2 Level 3 .............................. 14.26 5.3 14.26 5.3 – –Level 4 .............................. 16.47 4.8 16.47 4.8 – –Level 5 .............................. 18.86 3.7 18.86 3.7 – –Not able to be leveled ........ 19.16 17.7 19.16 17.7 – –
Painting workers ................................ 15.05 4.5 15.29 4.5 11.43 20.4 Level 2 .............................. 10.85 7.5 11.46 6.5 – –Level 3 .............................. 15.14 6.1 15.11 6.1 – –Level 4 .............................. 16.27 5.1 16.20 5.5 – –Level 5 .............................. 17.10 2.9 16.96 2.8 – –Level 6 .............................. 20.15 10.9 20.59 10.8 – –Not able to be leveled ........ 16.16 21.5 16.16 21.5 – –
Coating, painting, and sprayingmachine setters, operators, andtenders ...................................... 13.97 3.9 13.94 3.9 – –
Level 2 .............................. 11.23 7.6 11.23 7.6 – –Level 3 .............................. 14.22 6.0 14.19 6.0 – –Level 4 .............................. 16.83 3.3 16.83 3.3 – –Level 5 .............................. 17.26 3.2 17.26 3.2 – –
See footnotes at end of table.
NATIONAL COMPENSATION SURVEY
All United States 8-108 December 2006 - January 2008
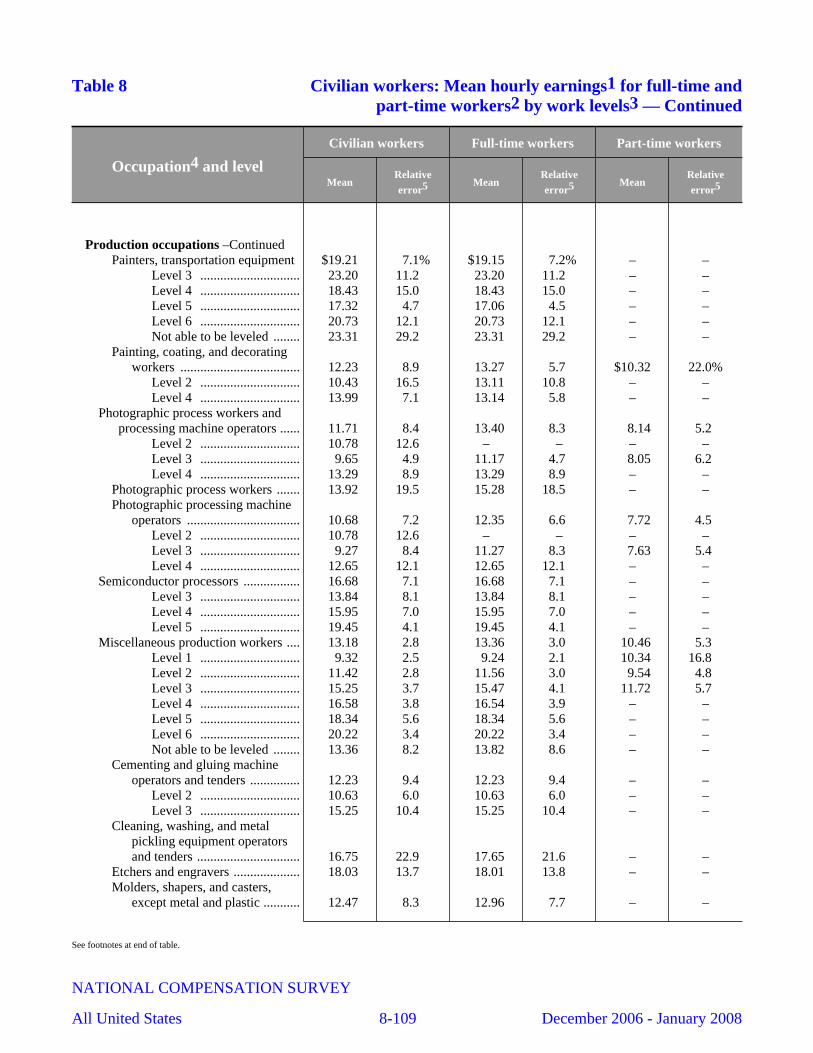
Table 8 Civilian workers: Mean hourly earnings1 for full-time andpart-time workers2 by work levels3 — Continued
Occupation4 and level
Civilian workers Full-time workers Part-time workers
MeanRelativeerror5 Mean
Relativeerror5 Mean
Relativeerror5
Production occupations –ContinuedPainters, transportation equipment $19.21 7.1% $19.15 7.2% – –
Level 3 .............................. 23.20 11.2 23.20 11.2 – –Level 4 .............................. 18.43 15.0 18.43 15.0 – –Level 5 .............................. 17.32 4.7 17.06 4.5 – –Level 6 .............................. 20.73 12.1 20.73 12.1 – –Not able to be leveled ........ 23.31 29.2 23.31 29.2 – –
Painting, coating, and decoratingworkers .................................... 12.23 8.9 13.27 5.7 $10.32 22.0%
Level 2 .............................. 10.43 16.5 13.11 10.8 – –Level 4 .............................. 13.99 7.1 13.14 5.8 – –
Photographic process workers andprocessing machine operators ...... 11.71 8.4 13.40 8.3 8.14 5.2
Level 2 .............................. 10.78 12.6 – – – –Level 3 .............................. 9.65 4.9 11.17 4.7 8.05 6.2 Level 4 .............................. 13.29 8.9 13.29 8.9 – –
Photographic process workers ....... 13.92 19.5 15.28 18.5 – –Photographic processing machine
operators .................................. 10.68 7.2 12.35 6.6 7.72 4.5 Level 2 .............................. 10.78 12.6 – – – –Level 3 .............................. 9.27 8.4 11.27 8.3 7.63 5.4 Level 4 .............................. 12.65 12.1 12.65 12.1 – –
Semiconductor processors ................. 16.68 7.1 16.68 7.1 – –Level 3 .............................. 13.84 8.1 13.84 8.1 – –Level 4 .............................. 15.95 7.0 15.95 7.0 – –Level 5 .............................. 19.45 4.1 19.45 4.1 – –
Miscellaneous production workers .... 13.18 2.8 13.36 3.0 10.46 5.3 Level 1 .............................. 9.32 2.5 9.24 2.1 10.34 16.8 Level 2 .............................. 11.42 2.8 11.56 3.0 9.54 4.8 Level 3 .............................. 15.25 3.7 15.47 4.1 11.72 5.7 Level 4 .............................. 16.58 3.8 16.54 3.9 – –Level 5 .............................. 18.34 5.6 18.34 5.6 – –Level 6 .............................. 20.22 3.4 20.22 3.4 – –Not able to be leveled ........ 13.36 8.2 13.82 8.6 – –
Cementing and gluing machineoperators and tenders ............... 12.23 9.4 12.23 9.4 – –
Level 2 .............................. 10.63 6.0 10.63 6.0 – –Level 3 .............................. 15.25 10.4 15.25 10.4 – –
Cleaning, washing, and metalpickling equipment operatorsand tenders ............................... 16.75 22.9 17.65 21.6 – –
Etchers and engravers .................... 18.03 13.7 18.01 13.8 – –Molders, shapers, and casters,
except metal and plastic ........... 12.47 8.3 12.96 7.7 – –
See footnotes at end of table.
NATIONAL COMPENSATION SURVEY
All United States 8-109 December 2006 - January 2008
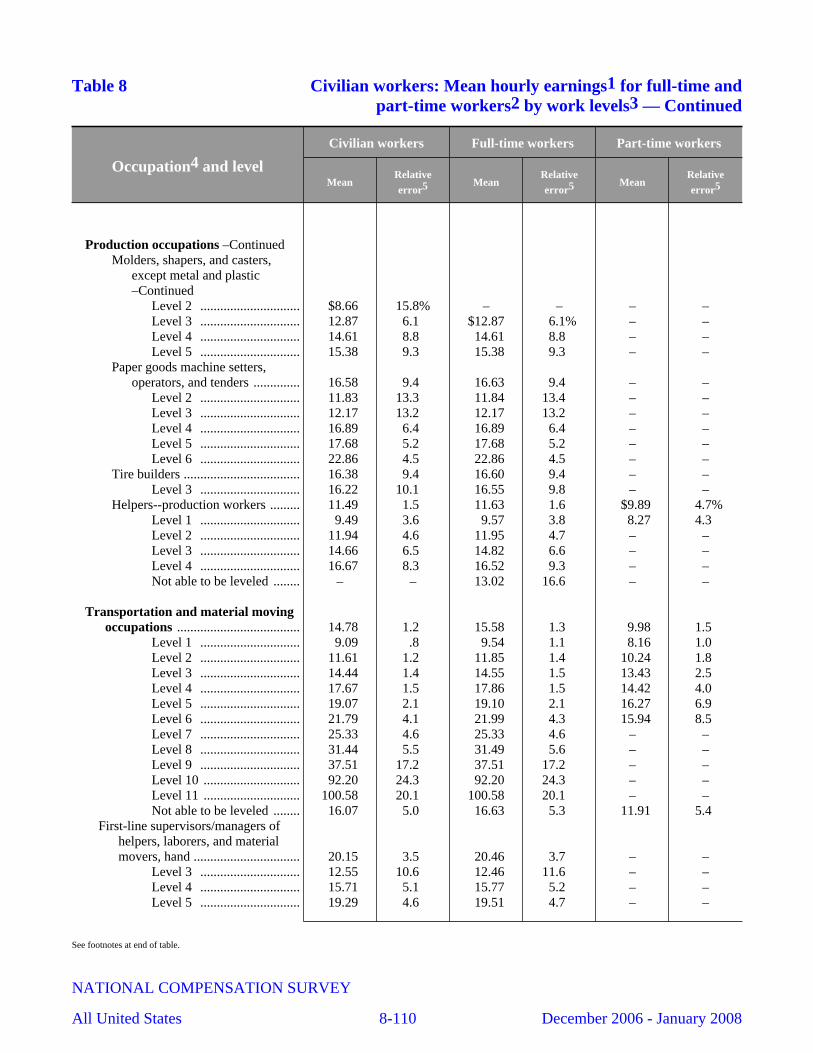
Table 8 Civilian workers: Mean hourly earnings1 for full-time andpart-time workers2 by work levels3 — Continued
Occupation4 and level
Civilian workers Full-time workers Part-time workers
MeanRelativeerror5 Mean
Relativeerror5 Mean
Relativeerror5
Production occupations –ContinuedMolders, shapers, and casters,
except metal and plastic–Continued
Level 2 .............................. $8.66 15.8% – – – –Level 3 .............................. 12.87 6.1 $12.87 6.1% – –Level 4 .............................. 14.61 8.8 14.61 8.8 – –Level 5 .............................. 15.38 9.3 15.38 9.3 – –
Paper goods machine setters,operators, and tenders .............. 16.58 9.4 16.63 9.4 – –
Level 2 .............................. 11.83 13.3 11.84 13.4 – –Level 3 .............................. 12.17 13.2 12.17 13.2 – –Level 4 .............................. 16.89 6.4 16.89 6.4 – –Level 5 .............................. 17.68 5.2 17.68 5.2 – –Level 6 .............................. 22.86 4.5 22.86 4.5 – –
Tire builders ................................... 16.38 9.4 16.60 9.4 – –Level 3 .............................. 16.22 10.1 16.55 9.8 – –
Helpers--production workers ......... 11.49 1.5 11.63 1.6 $9.89 4.7%Level 1 .............................. 9.49 3.6 9.57 3.8 8.27 4.3 Level 2 .............................. 11.94 4.6 11.95 4.7 – –Level 3 .............................. 14.66 6.5 14.82 6.6 – –Level 4 .............................. 16.67 8.3 16.52 9.3 – –Not able to be leveled ........ – – 13.02 16.6 – –
Transportation and material movingoccupations ..................................... 14.78 1.2 15.58 1.3 9.98 1.5
Level 1 .............................. 9.09 .8 9.54 1.1 8.16 1.0 Level 2 .............................. 11.61 1.2 11.85 1.4 10.24 1.8 Level 3 .............................. 14.44 1.4 14.55 1.5 13.43 2.5 Level 4 .............................. 17.67 1.5 17.86 1.5 14.42 4.0 Level 5 .............................. 19.07 2.1 19.10 2.1 16.27 6.9 Level 6 .............................. 21.79 4.1 21.99 4.3 15.94 8.5 Level 7 .............................. 25.33 4.6 25.33 4.6 – –Level 8 .............................. 31.44 5.5 31.49 5.6 – –Level 9 .............................. 37.51 17.2 37.51 17.2 – –Level 10 ............................. 92.20 24.3 92.20 24.3 – –Level 11 ............................. 100.58 20.1 100.58 20.1 – –Not able to be leveled ........ 16.07 5.0 16.63 5.3 11.91 5.4
First-line supervisors/managers ofhelpers, laborers, and materialmovers, hand ................................ 20.15 3.5 20.46 3.7 – –
Level 3 .............................. 12.55 10.6 12.46 11.6 – –Level 4 .............................. 15.71 5.1 15.77 5.2 – –Level 5 .............................. 19.29 4.6 19.51 4.7 – –
See footnotes at end of table.
NATIONAL COMPENSATION SURVEY
All United States 8-110 December 2006 - January 2008
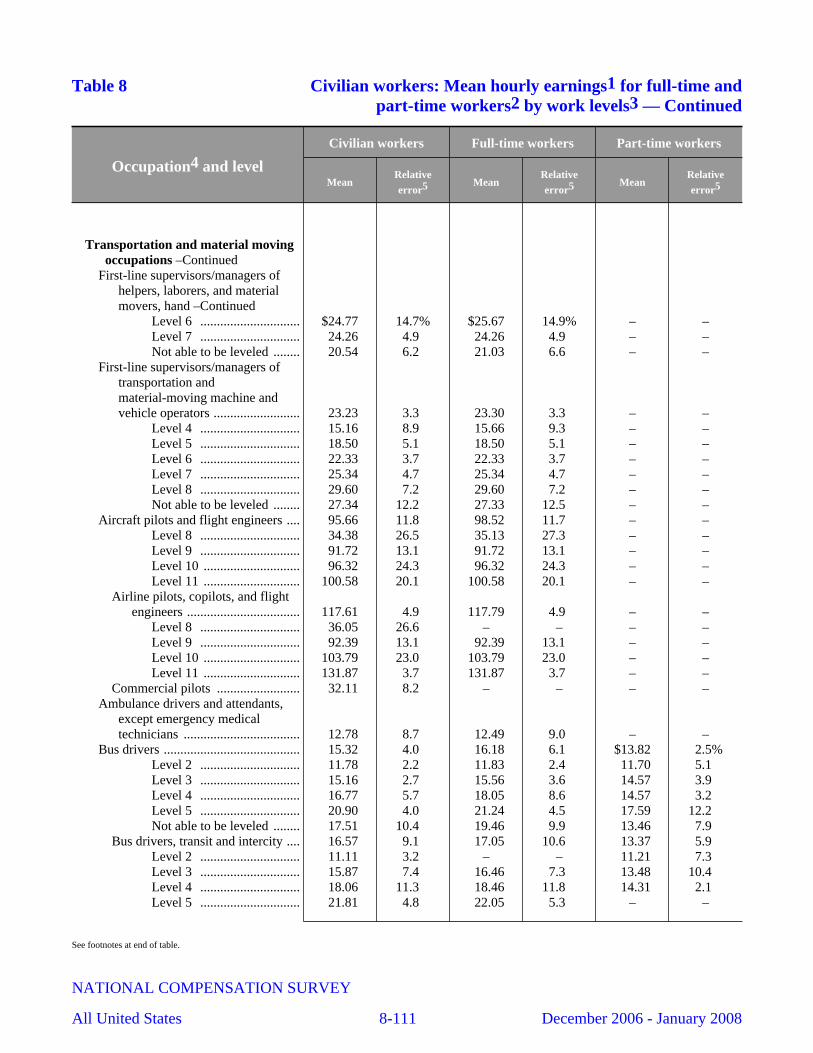
Table 8 Civilian workers: Mean hourly earnings1 for full-time andpart-time workers2 by work levels3 — Continued
Occupation4 and level
Civilian workers Full-time workers Part-time workers
MeanRelativeerror5 Mean
Relativeerror5 Mean
Relativeerror5
Transportation and material movingoccupations –Continued
First-line supervisors/managers ofhelpers, laborers, and materialmovers, hand –Continued
Level 6 .............................. $24.77 14.7% $25.67 14.9% – –Level 7 .............................. 24.26 4.9 24.26 4.9 – –Not able to be leveled ........ 20.54 6.2 21.03 6.6 – –
First-line supervisors/managers oftransportation andmaterial-moving machine andvehicle operators .......................... 23.23 3.3 23.30 3.3 – –
Level 4 .............................. 15.16 8.9 15.66 9.3 – –Level 5 .............................. 18.50 5.1 18.50 5.1 – –Level 6 .............................. 22.33 3.7 22.33 3.7 – –Level 7 .............................. 25.34 4.7 25.34 4.7 – –Level 8 .............................. 29.60 7.2 29.60 7.2 – –Not able to be leveled ........ 27.34 12.2 27.33 12.5 – –
Aircraft pilots and flight engineers .... 95.66 11.8 98.52 11.7 – –Level 8 .............................. 34.38 26.5 35.13 27.3 – –Level 9 .............................. 91.72 13.1 91.72 13.1 – –Level 10 ............................. 96.32 24.3 96.32 24.3 – –Level 11 ............................. 100.58 20.1 100.58 20.1 – –
Airline pilots, copilots, and flightengineers .................................. 117.61 4.9 117.79 4.9 – –
Level 8 .............................. 36.05 26.6 – – – –Level 9 .............................. 92.39 13.1 92.39 13.1 – –Level 10 ............................. 103.79 23.0 103.79 23.0 – –Level 11 ............................. 131.87 3.7 131.87 3.7 – –
Commercial pilots ......................... 32.11 8.2 – – – –Ambulance drivers and attendants,
except emergency medicaltechnicians ................................... 12.78 8.7 12.49 9.0 – –
Bus drivers ......................................... 15.32 4.0 16.18 6.1 $13.82 2.5%Level 2 .............................. 11.78 2.2 11.83 2.4 11.70 5.1 Level 3 .............................. 15.16 2.7 15.56 3.6 14.57 3.9 Level 4 .............................. 16.77 5.7 18.05 8.6 14.57 3.2 Level 5 .............................. 20.90 4.0 21.24 4.5 17.59 12.2 Not able to be leveled ........ 17.51 10.4 19.46 9.9 13.46 7.9
Bus drivers, transit and intercity .... 16.57 9.1 17.05 10.6 13.37 5.9 Level 2 .............................. 11.11 3.2 – – 11.21 7.3 Level 3 .............................. 15.87 7.4 16.46 7.3 13.48 10.4 Level 4 .............................. 18.06 11.3 18.46 11.8 14.31 2.1 Level 5 .............................. 21.81 4.8 22.05 5.3 – –
See footnotes at end of table.
NATIONAL COMPENSATION SURVEY
All United States 8-111 December 2006 - January 2008
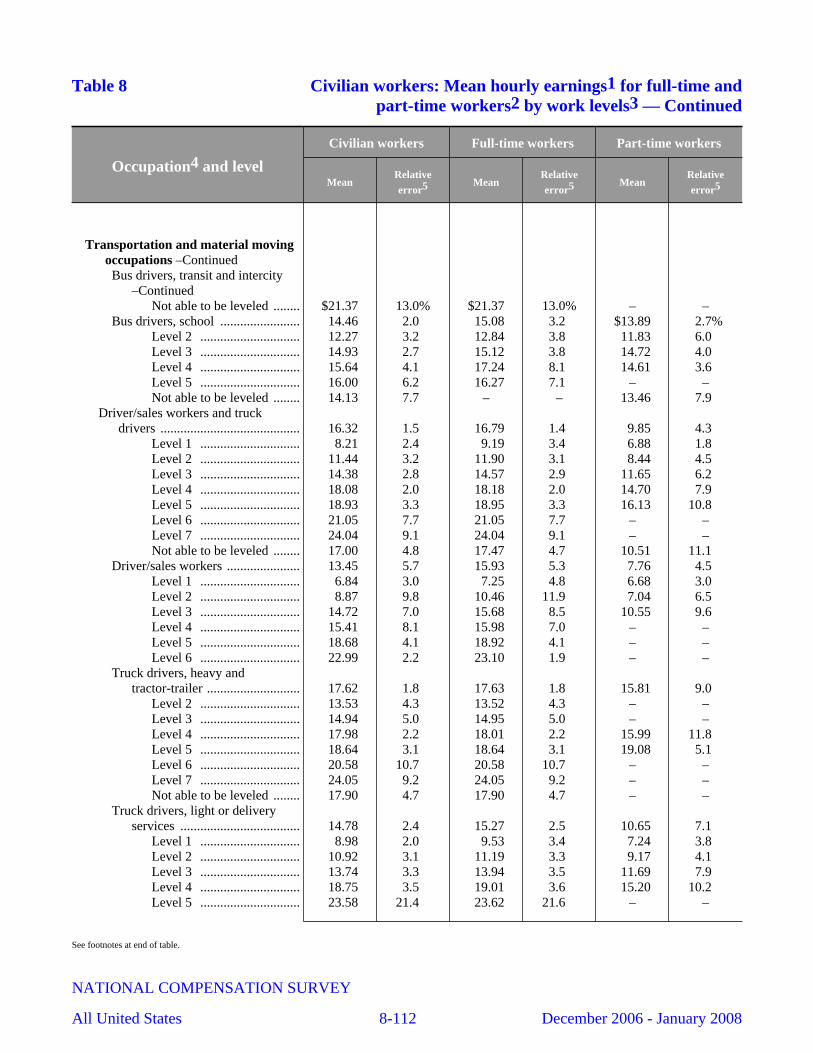
Table 8 Civilian workers: Mean hourly earnings1 for full-time andpart-time workers2 by work levels3 — Continued
Occupation4 and level
Civilian workers Full-time workers Part-time workers
MeanRelativeerror5 Mean
Relativeerror5 Mean
Relativeerror5
Transportation and material movingoccupations –ContinuedBus drivers, transit and intercity
–ContinuedNot able to be leveled ........ $21.37 13.0% $21.37 13.0% – –
Bus drivers, school ........................ 14.46 2.0 15.08 3.2 $13.89 2.7%Level 2 .............................. 12.27 3.2 12.84 3.8 11.83 6.0 Level 3 .............................. 14.93 2.7 15.12 3.8 14.72 4.0 Level 4 .............................. 15.64 4.1 17.24 8.1 14.61 3.6 Level 5 .............................. 16.00 6.2 16.27 7.1 – –Not able to be leveled ........ 14.13 7.7 – – 13.46 7.9
Driver/sales workers and truckdrivers .......................................... 16.32 1.5 16.79 1.4 9.85 4.3
Level 1 .............................. 8.21 2.4 9.19 3.4 6.88 1.8 Level 2 .............................. 11.44 3.2 11.90 3.1 8.44 4.5 Level 3 .............................. 14.38 2.8 14.57 2.9 11.65 6.2 Level 4 .............................. 18.08 2.0 18.18 2.0 14.70 7.9 Level 5 .............................. 18.93 3.3 18.95 3.3 16.13 10.8 Level 6 .............................. 21.05 7.7 21.05 7.7 – –Level 7 .............................. 24.04 9.1 24.04 9.1 – –Not able to be leveled ........ 17.00 4.8 17.47 4.7 10.51 11.1
Driver/sales workers ...................... 13.45 5.7 15.93 5.3 7.76 4.5 Level 1 .............................. 6.84 3.0 7.25 4.8 6.68 3.0 Level 2 .............................. 8.87 9.8 10.46 11.9 7.04 6.5 Level 3 .............................. 14.72 7.0 15.68 8.5 10.55 9.6 Level 4 .............................. 15.41 8.1 15.98 7.0 – –Level 5 .............................. 18.68 4.1 18.92 4.1 – –Level 6 .............................. 22.99 2.2 23.10 1.9 – –
Truck drivers, heavy andtractor-trailer ............................ 17.62 1.8 17.63 1.8 15.81 9.0
Level 2 .............................. 13.53 4.3 13.52 4.3 – –Level 3 .............................. 14.94 5.0 14.95 5.0 – –Level 4 .............................. 17.98 2.2 18.01 2.2 15.99 11.8 Level 5 .............................. 18.64 3.1 18.64 3.1 19.08 5.1 Level 6 .............................. 20.58 10.7 20.58 10.7 – –Level 7 .............................. 24.05 9.2 24.05 9.2 – –Not able to be leveled ........ 17.90 4.7 17.90 4.7 – –
Truck drivers, light or deliveryservices .................................... 14.78 2.4 15.27 2.5 10.65 7.1
Level 1 .............................. 8.98 2.0 9.53 3.4 7.24 3.8 Level 2 .............................. 10.92 3.1 11.19 3.3 9.17 4.1 Level 3 .............................. 13.74 3.3 13.94 3.5 11.69 7.9 Level 4 .............................. 18.75 3.5 19.01 3.6 15.20 10.2 Level 5 .............................. 23.58 21.4 23.62 21.6 – –
See footnotes at end of table.
NATIONAL COMPENSATION SURVEY
All United States 8-112 December 2006 - January 2008
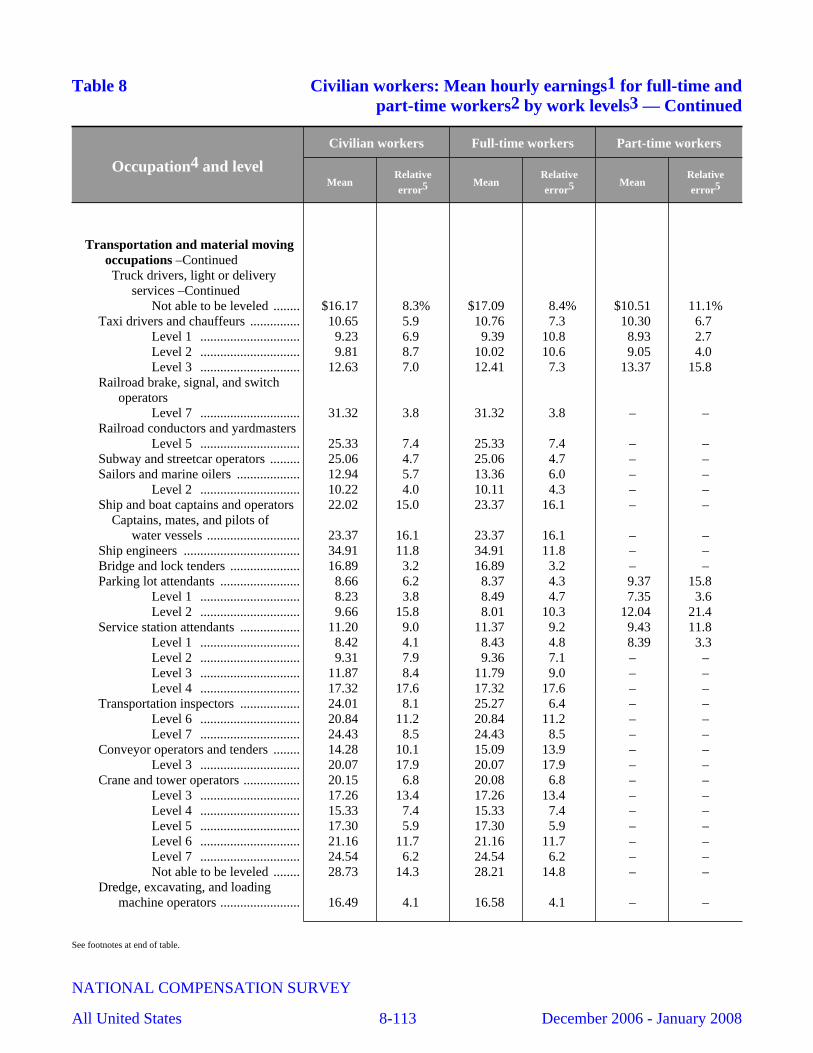
Table 8 Civilian workers: Mean hourly earnings1 for full-time andpart-time workers2 by work levels3 — Continued
Occupation4 and level
Civilian workers Full-time workers Part-time workers
MeanRelativeerror5 Mean
Relativeerror5 Mean
Relativeerror5
Transportation and material movingoccupations –ContinuedTruck drivers, light or delivery
services –ContinuedNot able to be leveled ........ $16.17 8.3% $17.09 8.4% $10.51 11.1%
Taxi drivers and chauffeurs ............... 10.65 5.9 10.76 7.3 10.30 6.7 Level 1 .............................. 9.23 6.9 9.39 10.8 8.93 2.7 Level 2 .............................. 9.81 8.7 10.02 10.6 9.05 4.0 Level 3 .............................. 12.63 7.0 12.41 7.3 13.37 15.8
Railroad brake, signal, and switchoperators
Level 7 .............................. 31.32 3.8 31.32 3.8 – –Railroad conductors and yardmasters
Level 5 .............................. 25.33 7.4 25.33 7.4 – –Subway and streetcar operators ......... 25.06 4.7 25.06 4.7 – –Sailors and marine oilers ................... 12.94 5.7 13.36 6.0 – –
Level 2 .............................. 10.22 4.0 10.11 4.3 – –Ship and boat captains and operators 22.02 15.0 23.37 16.1 – –
Captains, mates, and pilots ofwater vessels ............................ 23.37 16.1 23.37 16.1 – –
Ship engineers ................................... 34.91 11.8 34.91 11.8 – –Bridge and lock tenders ..................... 16.89 3.2 16.89 3.2 – –Parking lot attendants ........................ 8.66 6.2 8.37 4.3 9.37 15.8
Level 1 .............................. 8.23 3.8 8.49 4.7 7.35 3.6 Level 2 .............................. 9.66 15.8 8.01 10.3 12.04 21.4
Service station attendants .................. 11.20 9.0 11.37 9.2 9.43 11.8 Level 1 .............................. 8.42 4.1 8.43 4.8 8.39 3.3 Level 2 .............................. 9.31 7.9 9.36 7.1 – –Level 3 .............................. 11.87 8.4 11.79 9.0 – –Level 4 .............................. 17.32 17.6 17.32 17.6 – –
Transportation inspectors .................. 24.01 8.1 25.27 6.4 – –Level 6 .............................. 20.84 11.2 20.84 11.2 – –Level 7 .............................. 24.43 8.5 24.43 8.5 – –
Conveyor operators and tenders ........ 14.28 10.1 15.09 13.9 – –Level 3 .............................. 20.07 17.9 20.07 17.9 – –
Crane and tower operators ................. 20.15 6.8 20.08 6.8 – –Level 3 .............................. 17.26 13.4 17.26 13.4 – –Level 4 .............................. 15.33 7.4 15.33 7.4 – –Level 5 .............................. 17.30 5.9 17.30 5.9 – –Level 6 .............................. 21.16 11.7 21.16 11.7 – –Level 7 .............................. 24.54 6.2 24.54 6.2 – –Not able to be leveled ........ 28.73 14.3 28.21 14.8 – –
Dredge, excavating, and loadingmachine operators ........................ 16.49 4.1 16.58 4.1 – –
See footnotes at end of table.
NATIONAL COMPENSATION SURVEY
All United States 8-113 December 2006 - January 2008
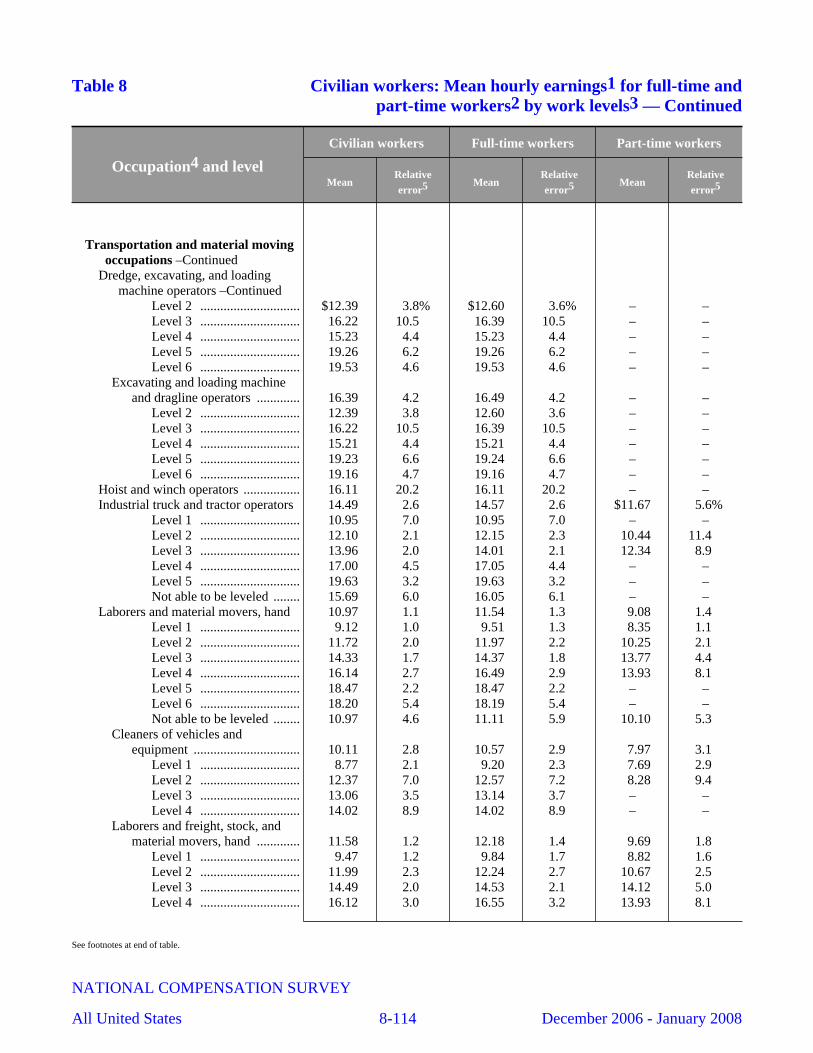
Table 8 Civilian workers: Mean hourly earnings1 for full-time andpart-time workers2 by work levels3 — Continued
Occupation4 and level
Civilian workers Full-time workers Part-time workers
MeanRelativeerror5 Mean
Relativeerror5 Mean
Relativeerror5
Transportation and material movingoccupations –Continued
Dredge, excavating, and loadingmachine operators –Continued
Level 2 .............................. $12.39 3.8% $12.60 3.6% – –Level 3 .............................. 16.22 10.5 16.39 10.5 – –Level 4 .............................. 15.23 4.4 15.23 4.4 – –Level 5 .............................. 19.26 6.2 19.26 6.2 – –Level 6 .............................. 19.53 4.6 19.53 4.6 – –
Excavating and loading machineand dragline operators ............. 16.39 4.2 16.49 4.2 – –
Level 2 .............................. 12.39 3.8 12.60 3.6 – –Level 3 .............................. 16.22 10.5 16.39 10.5 – –Level 4 .............................. 15.21 4.4 15.21 4.4 – –Level 5 .............................. 19.23 6.6 19.24 6.6 – –Level 6 .............................. 19.16 4.7 19.16 4.7 – –
Hoist and winch operators ................. 16.11 20.2 16.11 20.2 – –Industrial truck and tractor operators 14.49 2.6 14.57 2.6 $11.67 5.6%
Level 1 .............................. 10.95 7.0 10.95 7.0 – –Level 2 .............................. 12.10 2.1 12.15 2.3 10.44 11.4 Level 3 .............................. 13.96 2.0 14.01 2.1 12.34 8.9 Level 4 .............................. 17.00 4.5 17.05 4.4 – –Level 5 .............................. 19.63 3.2 19.63 3.2 – –Not able to be leveled ........ 15.69 6.0 16.05 6.1 – –
Laborers and material movers, hand 10.97 1.1 11.54 1.3 9.08 1.4 Level 1 .............................. 9.12 1.0 9.51 1.3 8.35 1.1 Level 2 .............................. 11.72 2.0 11.97 2.2 10.25 2.1 Level 3 .............................. 14.33 1.7 14.37 1.8 13.77 4.4 Level 4 .............................. 16.14 2.7 16.49 2.9 13.93 8.1 Level 5 .............................. 18.47 2.2 18.47 2.2 – –Level 6 .............................. 18.20 5.4 18.19 5.4 – –Not able to be leveled ........ 10.97 4.6 11.11 5.9 10.10 5.3
Cleaners of vehicles andequipment ................................ 10.11 2.8 10.57 2.9 7.97 3.1
Level 1 .............................. 8.77 2.1 9.20 2.3 7.69 2.9 Level 2 .............................. 12.37 7.0 12.57 7.2 8.28 9.4 Level 3 .............................. 13.06 3.5 13.14 3.7 – –Level 4 .............................. 14.02 8.9 14.02 8.9 – –
Laborers and freight, stock, andmaterial movers, hand ............. 11.58 1.2 12.18 1.4 9.69 1.8
Level 1 .............................. 9.47 1.2 9.84 1.7 8.82 1.6 Level 2 .............................. 11.99 2.3 12.24 2.7 10.67 2.5 Level 3 .............................. 14.49 2.0 14.53 2.1 14.12 5.0 Level 4 .............................. 16.12 3.0 16.55 3.2 13.93 8.1
See footnotes at end of table.
NATIONAL COMPENSATION SURVEY
All United States 8-114 December 2006 - January 2008
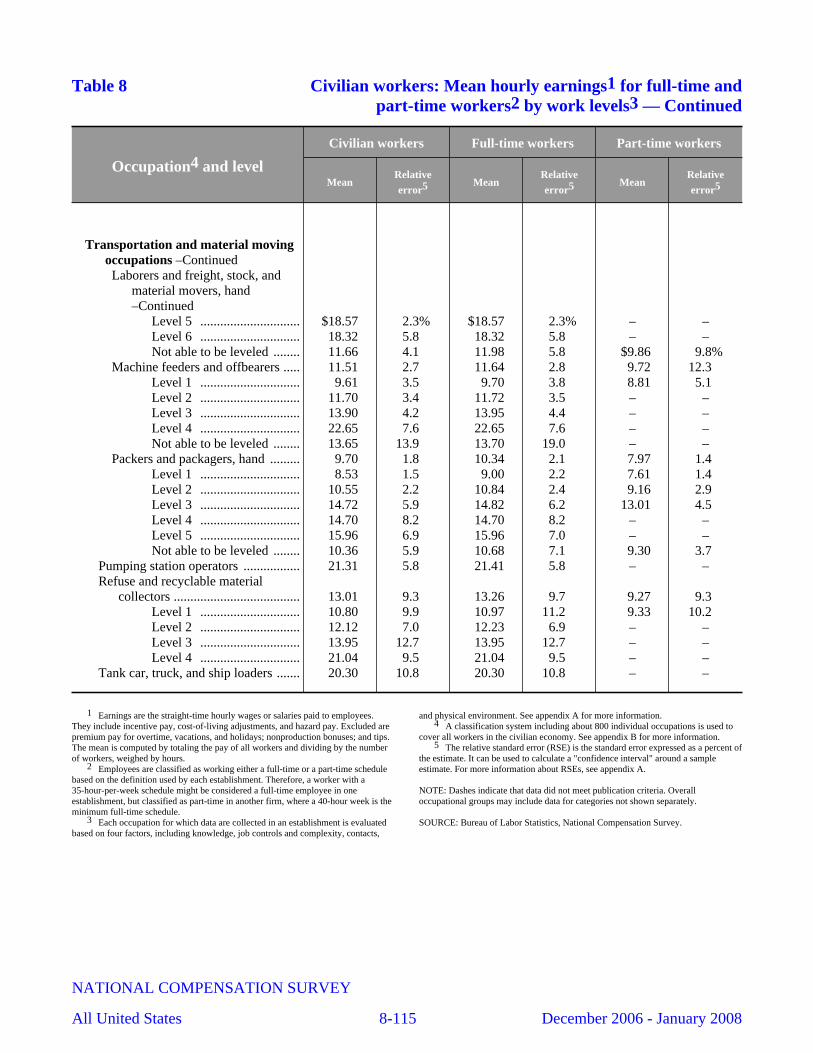
Table 8 Civilian workers: Mean hourly earnings1 for full-time andpart-time workers2 by work levels3 — Continued
Occupation4 and level
Civilian workers Full-time workers Part-time workers
MeanRelativeerror5 Mean
Relativeerror5 Mean
Relativeerror5
Transportation and material movingoccupations –ContinuedLaborers and freight, stock, and
material movers, hand–Continued
Level 5 .............................. $18.57 2.3% $18.57 2.3% – –Level 6 .............................. 18.32 5.8 18.32 5.8 – –Not able to be leveled ........ 11.66 4.1 11.98 5.8 $9.86 9.8%
Machine feeders and offbearers ..... 11.51 2.7 11.64 2.8 9.72 12.3 Level 1 .............................. 9.61 3.5 9.70 3.8 8.81 5.1 Level 2 .............................. 11.70 3.4 11.72 3.5 – –Level 3 .............................. 13.90 4.2 13.95 4.4 – –Level 4 .............................. 22.65 7.6 22.65 7.6 – –Not able to be leveled ........ 13.65 13.9 13.70 19.0 – –
Packers and packagers, hand ......... 9.70 1.8 10.34 2.1 7.97 1.4 Level 1 .............................. 8.53 1.5 9.00 2.2 7.61 1.4 Level 2 .............................. 10.55 2.2 10.84 2.4 9.16 2.9 Level 3 .............................. 14.72 5.9 14.82 6.2 13.01 4.5 Level 4 .............................. 14.70 8.2 14.70 8.2 – –Level 5 .............................. 15.96 6.9 15.96 7.0 – –Not able to be leveled ........ 10.36 5.9 10.68 7.1 9.30 3.7
Pumping station operators ................. 21.31 5.8 21.41 5.8 – –Refuse and recyclable material
collectors ...................................... 13.01 9.3 13.26 9.7 9.27 9.3 Level 1 .............................. 10.80 9.9 10.97 11.2 9.33 10.2 Level 2 .............................. 12.12 7.0 12.23 6.9 – –Level 3 .............................. 13.95 12.7 13.95 12.7 – –Level 4 .............................. 21.04 9.5 21.04 9.5 – –
Tank car, truck, and ship loaders ....... 20.30 10.8 20.30 10.8 – –
1 Earnings are the straight-time hourly wages or salaries paid to employees.They include incentive pay, cost-of-living adjustments, and hazard pay. Excluded arepremium pay for overtime, vacations, and holidays; nonproduction bonuses; and tips.The mean is computed by totaling the pay of all workers and dividing by the numberof workers, weighed by hours.
2 Employees are classified as working either a full-time or a part-time schedulebased on the definition used by each establishment. Therefore, a worker with a35-hour-per-week schedule might be considered a full-time employee in oneestablishment, but classified as part-time in another firm, where a 40-hour week is theminimum full-time schedule.
3 Each occupation for which data are collected in an establishment is evaluatedbased on four factors, including knowledge, job controls and complexity, contacts,
and physical environment. See appendix A for more information.4 A classification system including about 800 individual occupations is used to
cover all workers in the civilian economy. See appendix B for more information.5 The relative standard error (RSE) is the standard error expressed as a percent of
the estimate. It can be used to calculate a "confidence interval" around a sampleestimate. For more information about RSEs, see appendix A.
NOTE: Dashes indicate that data did not meet publication criteria. Overalloccupational groups may include data for categories not shown separately.
SOURCE: Bureau of Labor Statistics, National Compensation Survey.
NATIONAL COMPENSATION SURVEY
All United States 8-115 December 2006 - January 2008