Embed Size (px)
Citation preview
NC-SARA 2017 ENROLLMENT REPORT
Prepared for NC-SARA by
Terri Taylor Straut
September 18, 2017
NC-SARA 2017 Enrollment Report 1 September 18, 2017
Preface The State Authorization Reciprocity Agreement (SARA) has been the catalyst for change in state
authorization and distance education.
Higher education institutions have navigated the complex and confusing regulatory waters of state
authorization since the infancy of correspondence courses. The concept of “authorization” has not
changed significantly despite the incredible technological innovations in education over the past two
decades.
NC-SARA and Its Regional Partners
In 2013, the National Council for State Authorization Agreements (NC-SARA) became a nationwide
coordinating entity, in partnership with the country’s four regional education compacts (NEBHE, MHEC,
SREB, and WICHE) to establish uniform standards and procedures for accepting and monitoring states
participating in each of their respective regions. States participating in SARA through any one compact
are recognized as reciprocal partners with states participating in SARA through any other regional
compact. And institutions are assured that their participation in one region’s SARA initiative will carry
full value in any other SARA state, from any other region.
Imperative of Accountability and Quality Assurance
SARA has created greater capacity for institutional accountability and interstate collaboration to address
student concerns or issues. SARA prioritizes the fulfillment of institutions’ obligations to the students
that they serve by promoting three core values:
Institutional quality and compliance established by being a U.S. degree-granting institution
that is accredited by an accrediting body recognized by the U.S. Secretary of Education
Adherence to clear, concise complaint processes, overseen by a designated state portal entity
A demonstrated financial responsibility index score from the U.S. Department of Education that
is 1.5 or above for non-public institutions
As the focus shifts from the design and implementation of the nationwide framework with 48 states
now participating, NC-SARA publishes findings of its 2017 Distance Education Enrollment Data.
Why is this so valuable?
These data provide a significant advance in the national collection and reporting of such information.
The collection of these data delivers on one of many key goals: Transparency in who is enrolling online
students and where these students are located. Unlike IPEDS, student enrollments are disaggregated by
state, delivering clarity as to where distance education activity takes place. The adoption of SARA by the
states and the institutions within them provides a new and more reliable source of information about
distance education offerings in the U.S. than previously available.
Since the first NC-SARA enrollment data collection in the spring of 2016, in addition to adding eleven
states and the District of Columbia, many institutions were added to the list of those operating under
SARA as their applications were created, submitted and approved by their respective SARA states.
Between the first and second year of reporting, the number of institutions reporting increased by 70.4%.
NC-SARA 2017 Enrollment Report 2 September 18, 2017
Conclusion
Overall Growth
The 2017 data demonstrates the significant growth in SARA membership over the two-year period of
enrollment collection. The total increase in student enrollment because of an increase in institutional
membership year over year was 36.6%.
Points for consideration
IPEDS reporting and definitions
NC-SARA relies on the existing definitions and reporting schedules required by the federal
government’s Integrated Postsecondary Education Data System (IPEDS).
Highly concentrated out-of-state distance education enrollments
The data reveal that the ten institutions with the largest reported enrollment combined
represent 51.4% of enrollments reported. The data support prior analyses of the distance
education industry which reveal that distance education enrollments are highly concentrated in
a relatively few institutions:
Distance education enrollments remain highly concentrated in a relatively small number
of institutions. Almost half of the distance education students are concentrated in just
five percent of the institutions, while the top 47 institutions, only 1.0% of the total, enroll
23.0% of all distance students.
Digital Learning Compass Distance Education Enrollment Report based on 2015 IPEDS data
In-state distance education enrollment
NC-SARA focuses specifically on out-of-state distance education enrollment. While this focus
aligns with the mission of SARA, the distance education picture in the U.S. is much broader. For
example, public institutions are primarily focused on serving students in their own state. An
analysis of the 788 public institutions who are operating under SARA during the 2017 reporting
cycle reveal 83.7% exclusively distance education enrollments in the institutions’ home states,
while just 16.3% of their distance education enrollments are reported in other states.
Participation by sector and equitable accountability
All institutions, public, private non-profit or independent for-profit who are SARA members are
accountable for accurately reporting their distance education students.
The path ahead
Upon recommendation from the regional compacts and their regional steering committees, NC-SARA
will convene, for the third year, a committee to assess and review NC-SARA’s data reporting policies and
procedures to maximize the knowledge that has been gained from the annual data collection cycle.
NC-SARA 2017 Enrollment Report 3 September 18, 2017
NC-SARA’s commitment to transparency in distance education data collection and reporting is setting a
collaborative tone that may help establish a new norm for institutions. Continued improvement in the
processes, systems and communication related to the annual NC-SARA data collection will improve the
process and give all who use these data a renewed confidence in what they tell us about distance
education across state lines.
Marshall A. Hill
Executive Director
NC-SARA
NC-SARA 2017 Enrollment Report 4 September 18, 2017
Table of Contents Preface .......................................................................................................................................................... 1
Executive Summary ....................................................................................................................................... 6
Institutions Reporting ............................................................................................................................... 6
Reported Distance Education Enrollment................................................................................................. 7
Highly Concentrated Distance Education Enrollments ............................................................................. 8
Reporting Challenges ................................................................................................................................ 9
Encouraging Transparency ........................................................................................................................ 9
Introduction ................................................................................................................................................ 10
Purpose ................................................................................................................................................... 10
Background ................................................................................................................................................. 10
About SARA ............................................................................................................................................. 10
About NC-SARA ....................................................................................................................................... 11
Methodology ............................................................................................................................................... 11
NC-SARA and IPEDS Reporting ................................................................................................................ 11
Unique Features of NC-SARA Enrollment Reporting .............................................................................. 12
Reporting Institutions by Sector ............................................................................................................. 12
2017 Distance Education Enrollment .......................................................................................................... 13
Total Reported Distance Education Enrollment ..................................................................................... 13
Reported Enrollment by Sector .............................................................................................................. 14
2017 State Summary Data ...................................................................................................................... 16
Highly Concentrated Distance Education Enrollments ........................................................................... 17
Top Ten Private Non-Profit Institutions .................................................................................................. 18
Top Ten Public Institutions ..................................................................................................................... 19
Prior Year Distance Education Enrollment .................................................................................................. 21
2016 Reported Distance Education Enrollment...................................................................................... 21
2016 State Summary Data ...................................................................................................................... 22
Data Comparison: Spring 2017 vs Spring 2016 ........................................................................................... 24
Number of Institutions Reporting ........................................................................................................... 24
Distance Education Enrollment Reported............................................................................................... 24
Reporting Challenges .................................................................................................................................. 26
Recommendations to Improve Reporting .................................................................................................. 27
Appendix A: Technical Notes ...................................................................................................................... 29
NC-SARA 2017 Enrollment Report 5 September 18, 2017
Definitions ............................................................................................................................................... 29
SARA Institutions Reporting In-State Enrollment ................................................................................... 30
Appendix B: Instructions and Survey .......................................................................................................... 31
Appendix C: About the Author .................................................................................................................... 34
Appendix D: References .............................................................................................................................. 34

NC-SARA 2017 Enrollment Report 6 September 18, 2017
Executive Summary The 2017 NC-SARA Enrollment Report summarizes 2017 institutional reporting to the National Council as
outlined in the State Authorization Reciprocity Agreement (SARA). Distance Education enrollment data
are reported annually each fall by institutions in the Fall Enrollment (EF) component of their submissions
to the federal Integrated Postsecondary Education Data System (IPEDS). IPEDS data collection is
required by the federal government for all institutions that offer federal financial aid. Distance
education data for 2016 were reported to IPEDS in the fall of 2016; those same data, in disaggregated
form, were submitted to NC-SARA in the spring of 2017. Similarly, distance education data for 2015
were reported to IPEDS in the fall of 2015 and to NC-SARA in the spring of 2016. NC-SARA has two years
of data reported.
This report summarizes the 2017 data reported and provides comparisons to the 2016 data reported to
NC-SARA. The process of states joining SARA and institutions within them applying to operate under
SARA is ongoing. Therefore, the annual reporting provides a snapshot of the distance education data as
of each year’s Fall IPEDS reporting.
Institutions Reporting NC-SARA sent requests via email with a link to report fall 2016 enrollments to the institutional contacts
at 1,494 institutions then operating under SARA. NC-SARA received responses from 1,477 institutions
during the annual reporting window in the spring of 2017. The response rate was 98.9%. The number of
institutions operating under SARA increased 70.4% from 867 in 2016. While the response rate in 2016
was 97.6%, of the 846 institutions who completed the survey, 280 or 33.1% reported no distance
education enrollments. In the initial reporting period instructions were given not to report state
enrollments less than 10 because of concerns with student privacy. Thirty-six states were members of
SARA during the 2016 reporting period and 47 states were members during the 2017 reporting period.
Year
Number of Institutions Operating
Under SARA
Number of Institutions
Reporting to NC-SARA
Number of Institutions Reporting Distance
Education Enrollment
2016 867 846 567
2017 1,494 1,477 1,394
Increase 627 631 827
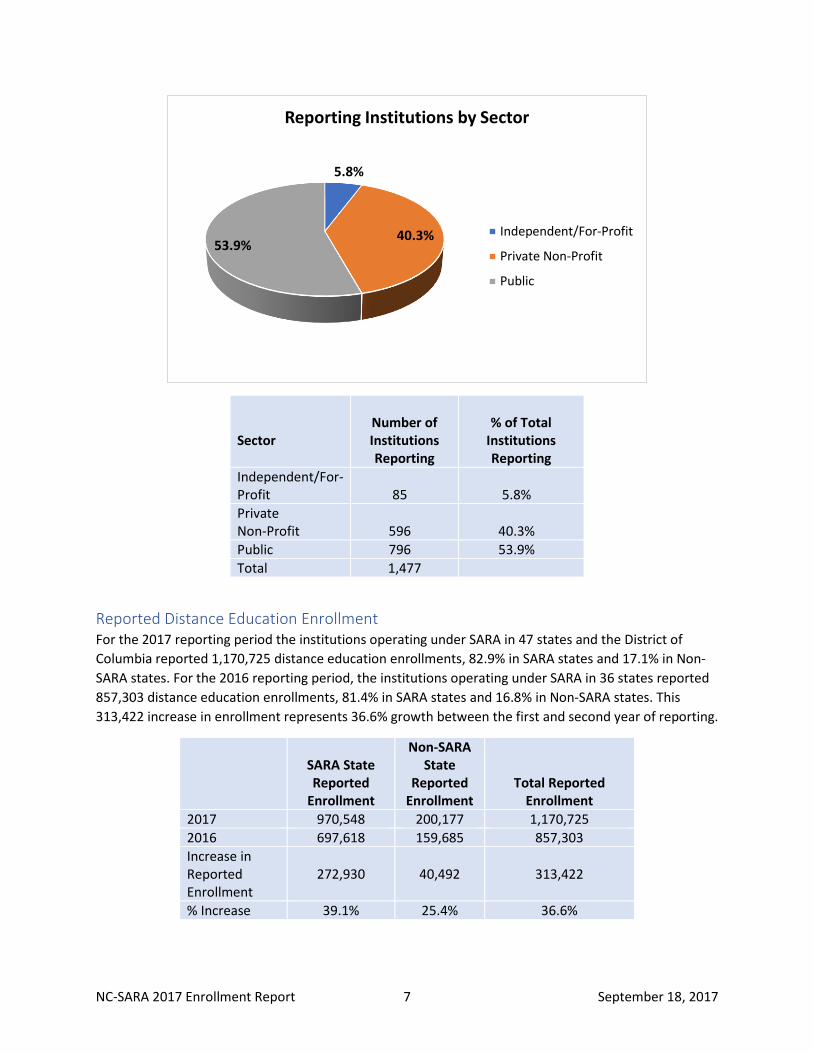
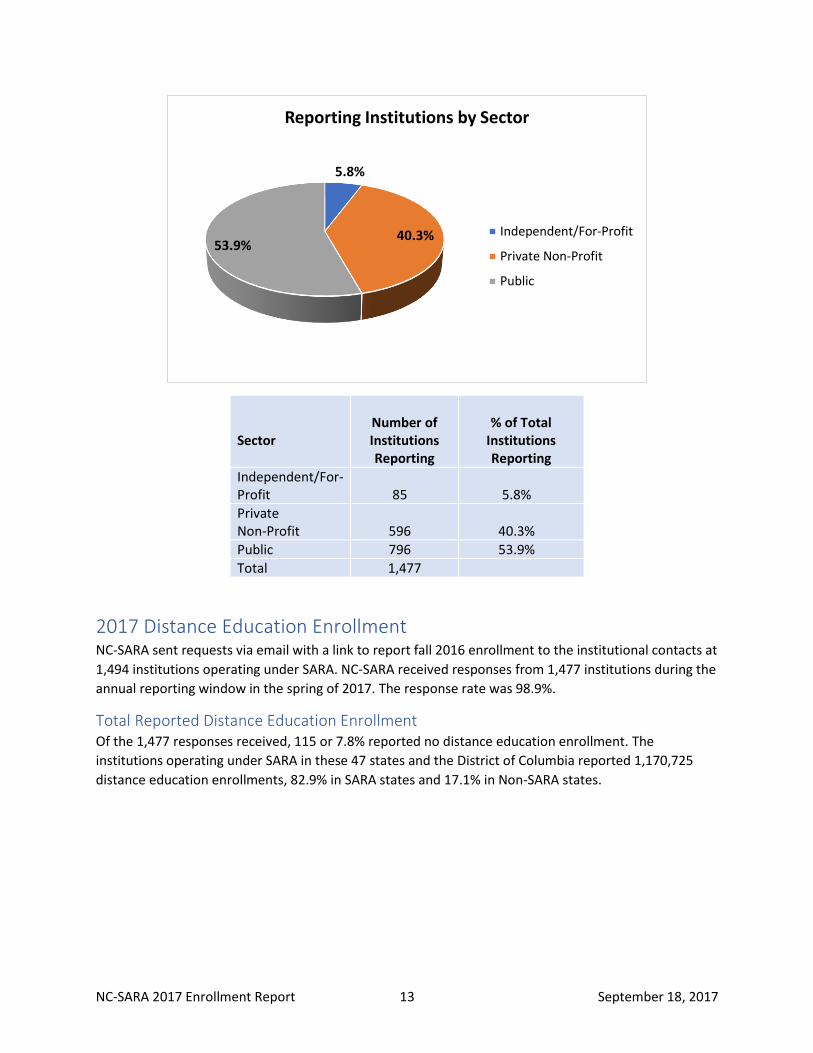
Reporting Institutions by Sector Public institutions made up just over half (53.9%) of all institutions reporting enrollment to NC-SARA in
2017. Private non-profit institutions represent 40.3% and independent for-profit institutions represent
just under 6% of reporting institutions operating under SARA and reporting in 2017.
NC-SARA 2017 Enrollment Report 7 September 18, 2017
Sector
Number of Institutions Reporting
% of Total
Institutions Reporting
Independent/For-Profit 85 5.8%
Private Non-Profit
596
40.3%
Public 796 53.9%
Total 1,477
Reported Distance Education Enrollment For the 2017 reporting period the institutions operating under SARA in 47 states and the District of
Columbia reported 1,170,725 distance education enrollments, 82.9% in SARA states and 17.1% in Non-
SARA states. For the 2016 reporting period, the institutions operating under SARA in 36 states reported
857,303 distance education enrollments, 81.4% in SARA states and 16.8% in Non-SARA states. This
313,422 increase in enrollment represents 36.6% growth between the first and second year of reporting.
SARA State Reported
Enrollment
Non-SARA State
Reported Enrollment
Total Reported Enrollment
2017 970,548 200,177 1,170,725
2016 697,618 159,685 857,303
Increase in Reported Enrollment
272,930
40,492
313,422
% Increase 39.1% 25.4% 36.6%
5.8%
40.3%53.9%
Reporting Institutions by Sector
Independent/For-Profit
Private Non-Profit
Public
NC-SARA 2017 Enrollment Report 8 September 18, 2017
Highly Concentrated Distance Education Enrollments The NC-SARA enrollment reporting supports prior analyses of the distance education industry, affirming
that distance education enrollments are highly concentrated. According to the Digital Learning Compass
Distance Education Enrollment Report based on 2015 IPEDS data, “Distance education enrollments
remain highly concentrated in a relatively small number of institutions. Almost half of the distance
education students are concentrated in just five percent of the institutions, while the top 47 institutions,
only 1.0% of the total, enroll 23.0% (1,385,307) of all distance students”. 1 Details about the distance
education definitions used can be found in Appendix A: Technical Notes.
The 2017 enrollment reported to NC-SARA reveals that the ten institutions with the largest reported
enrollments combined represent 51% (601,395) of enrollments reported to NC-SARA.
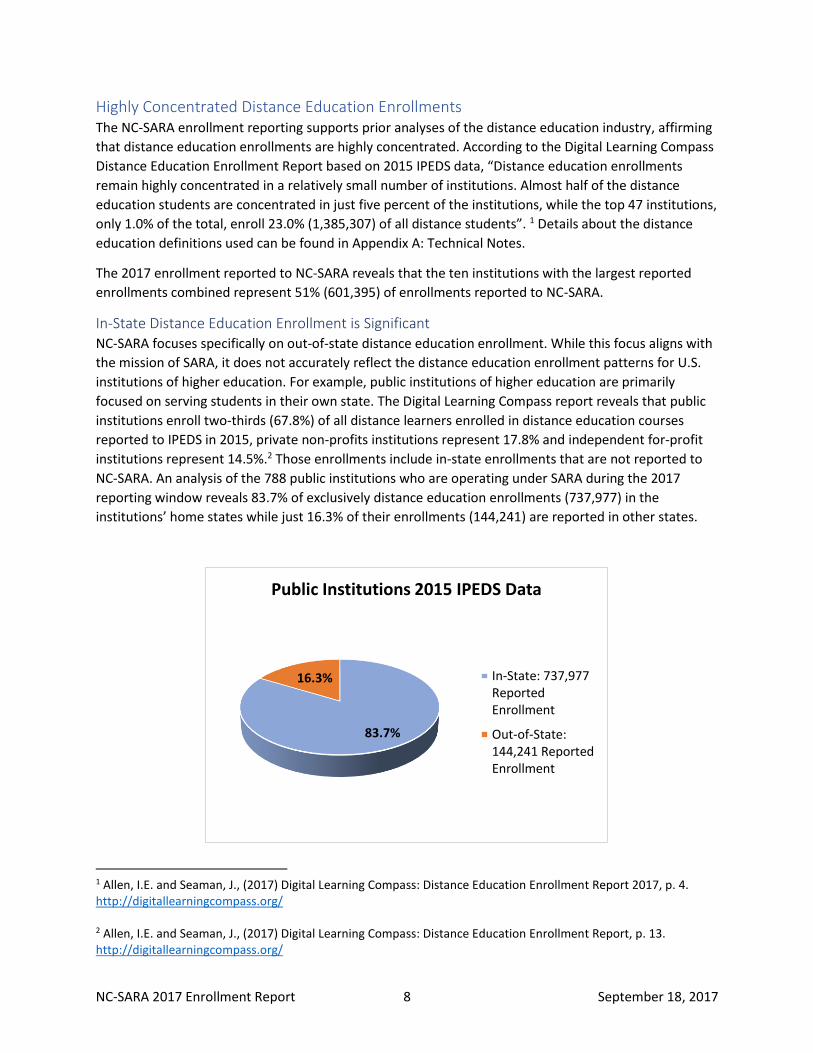
In-State Distance Education Enrollment is Significant NC-SARA focuses specifically on out-of-state distance education enrollment. While this focus aligns with
the mission of SARA, it does not accurately reflect the distance education enrollment patterns for U.S.
institutions of higher education. For example, public institutions of higher education are primarily
focused on serving students in their own state. The Digital Learning Compass report reveals that public
institutions enroll two-thirds (67.8%) of all distance learners enrolled in distance education courses
reported to IPEDS in 2015, private non-profits institutions represent 17.8% and independent for-profit
institutions represent 14.5%.2 Those enrollments include in-state enrollments that are not reported to
NC-SARA. An analysis of the 788 public institutions who are operating under SARA during the 2017
reporting window reveals 83.7% of exclusively distance education enrollments (737,977) in the
institutions’ home states while just 16.3% of their enrollments (144,241) are reported in other states.
1 Allen, I.E. and Seaman, J., (2017) Digital Learning Compass: Distance Education Enrollment Report 2017, p. 4. http://digitallearningcompass.org/ 2 Allen, I.E. and Seaman, J., (2017) Digital Learning Compass: Distance Education Enrollment Report, p. 13. http://digitallearningcompass.org/
83.7%
16.3%
Public Institutions 2015 IPEDS Data
In-State: 737,977ReportedEnrollment
Out-of-State:144,241 ReportedEnrollment
NC-SARA 2017 Enrollment Report 9 September 18, 2017
Reporting Challenges In an attempt to standardize reporting requirements for institutions, NC-SARA relies on IPEDS
definitions, schedules, etc. Unfortunately, it is clear from the comments submitted in 2017 that many
institutions struggle to understand how they should report to IPEDS. And, since SARA’s basic instructions
are to “report as you do for IPEDS, but disaggregate by state, territory, or district in which the students
reside”,3 those misunderstandings affect NC-SARA reporting. Over half (51.7%) of comments provided in
the Comment field of 2017 survey specifically mentioned variations from IPEDS data, definitions and
concerns with how to report military students and those in the five U.S. territories.
Collaboration with the National Center for Educational Statistics to improve the definition of a “Distance
Education Course” and other related definitions used by IPEDS could help improve the consistency and
reliability of all distance education data reported, both to NC-SARA and to IPEDS.
Encouraging Transparency Overall, the reporting process and mechanisms to receive the data worked well for the second NC-SARA
reporting period. The rapid adoption of SARA by the states and the institutions within them provides a
new and likely more reliable source of information about distance education offerings in the U.S. than
was previously available through the Babson Survey Research Group (BSRG) surveys4 and prior IPEDS
Distance Education reporting by the WICHE Cooperative for Educational Technologies (WCET)5 and
others. NC-SARA’s commitment to transparency in distance education data collection and reporting is
setting a collaborative tone that may help establish a new norm for institutions. Continued
improvement in the processes, systems and communication related to the annual NC-SARA data
collection will improve the process and give all who use these data a renewed confidence in what they
tell us about distance education adoption and use across state lines in the U.S.
3 NC-SARA State Authorization Reciprocity Agreements Policy and Operations Manual (2016). Version 16.3., http://www.nc-sara.org/files/docs/NC-SARA_Manual_Final_2016.pdf, p. 34. 4 Allen, I.E. and Seaman, J., (2016) Online Report Card: Tracking Online Education in the United States. http://onlinelearningsurvey.com/reports/onlinereportcard.pdf 5 Poulin, R. and Straut, T. (2016). WCET Distance Education Enrollment Report 2016. http://wcet.wiche.edu/initiatives/research/WCET-Distance-Education-Enrollment-Report-2016
NC-SARA 2017 Enrollment Report 10 September 18, 2017
Introduction
Purpose The National Council for State Authorization Reciprocity Agreements (NC-SARA) has completed two
years of distance education enrollment data collection. The purpose of this report is to provide a
summary and analysis of the fall 2016 enrollment data collected by NC-SARA in the spring of 2017.
Comparisons to the enrollment data collected in the spring of 2016 are included on key points of
interest to SARA stakeholders. In addition, data reporting challenges and recommendations to improve
spring 2018 reporting are included.
Background
About SARA The State Authorization Reciprocity Agreement (SARA) is a voluntary agreement among its member
states and U.S. districts and territories that establishes comparable national standards for interstate
offering of postsecondary distance education courses and programs. It is intended to make it easier for
students to take online courses offered by postsecondary institutions based in another state. SARA is a
voluntary process of state oversight of distance education that assures consistent consumer protection
and relieves the burden of meeting individual state authorization requirements for participating
institutions of higher education.6
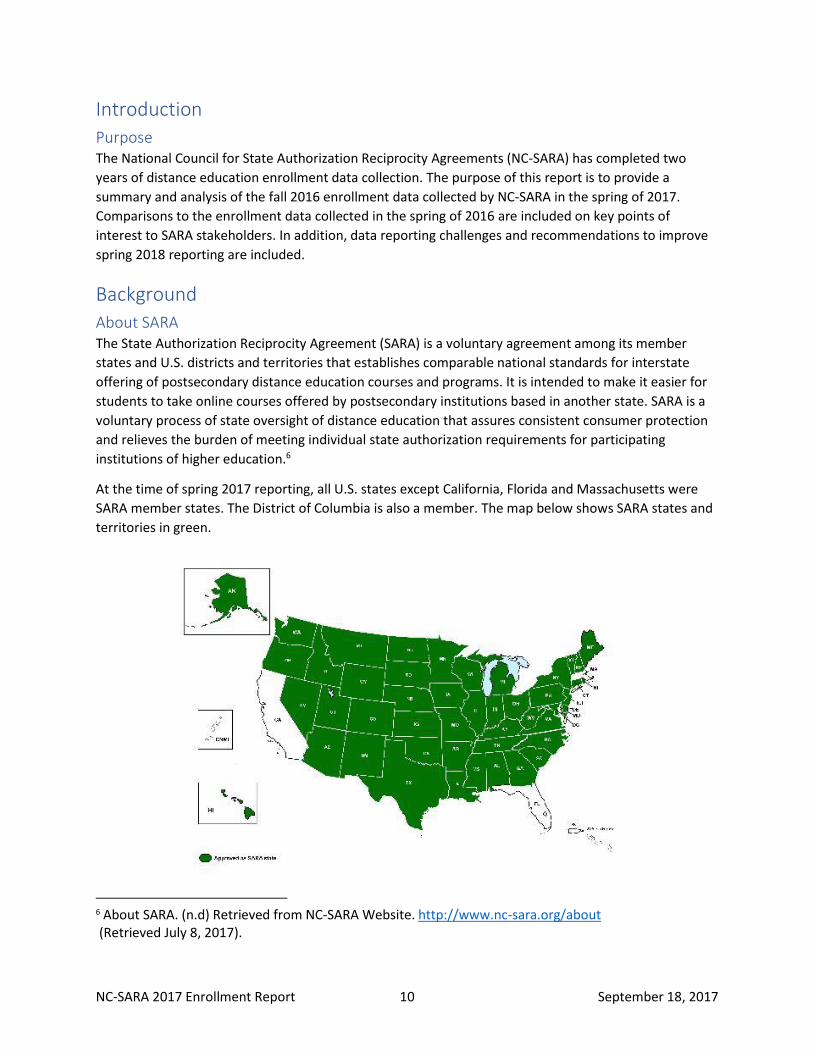
At the time of spring 2017 reporting, all U.S. states except California, Florida and Massachusetts were
SARA member states. The District of Columbia is also a member. The map below shows SARA states and
territories in green.
6 About SARA. (n.d) Retrieved from NC-SARA Website. http://www.nc-sara.org/about (Retrieved July 8, 2017).
NC-SARA 2017 Enrollment Report 11 September 18, 2017
About NC-SARA National Council for State Authorization Reciprocity Agreements (NC-SARA) is a nationwide coordinating
entity established to ensure that the SARA initiative provides a national solution, rather than four
regional solutions. NC-SARA works with the country’s four regional compacts to establish and
implement uniform standards and procedures for accepting and monitoring states participating in each
of their respective regions (New England Board of Higher Education, Midwestern Higher Education
Compact, Southern Regional Education Board, and Western Interstate Commission for Higher
Education). States participating in SARA through any one compact will be recognized as reciprocal
partners with states participating in SARA through any other regional compact. And institutions will be
assured that their participation in one region’s SARA initiative will carry full value in any other SARA
state, from any other region.
Methodology
NC-SARA and IPEDS Reporting NC-SARA relies on the existing definitions and reporting schedules required by the federal government’s
Integrated Postsecondary Education Data System (IPEDS). IPEDS data collection is managed by the U.S.
Department of Education through the National Center for Education Statistics (NCES) and reporting is
required of all institutions of higher education that offer federal financial aid in the U.S. states and
territories. NCES has been requiring institutions to report distance education data since the IPEDS Fall
Enrollment (EF) reporting in 2012.
Acknowledgment of Prior IPEDS Distance Education Analysis Prior to the 2012 IPEDS reporting, the Babson Survey Research Group (BSRG) collected data on online
enrollments annually, beginning in the fall 2002 period.7 BSRG used the distance education definition of
80% of the content delivered online. The BSRG survey is a sampling, not a reporting of the entire
population of institutions of higher education. Analysis by the WICHE Cooperative for Educational
Technology (WCET) provides greater detail about methodology of historic distance education reports
and the differences in the data and definitions used.8 NC-SARA thanks the professionals who developed
and shared the methodology used to create the IPEDS comparisons in this report. Distance Education
definitions are also provided in Appendix A: Technical Notes.
NC-SARA Reporting Schedule Distance education enrollment data are reported by institutions annually, each fall in the Fall Enrollment
(EF) component of their submission to the federal IPEDS data collection. Distance education data for
2016 were reported to IPEDS in the fall of 2016 and to NC-SARA in the spring of 2017. Similarly, distance
education data for 2015 were reported to IPEDS in the fall of 2015 and to NC-SARA in the spring of 2016.
NC-SARA therefore has two years of data reported.
7 Allen, I.E. and Seaman J., (2003). Sizing the Opportunity: The Quality and Extent of Online Education in the United States, Babson Survey Research Group. 8 Poulin, R. and Straut, T. (2016). WCET Distance Education Enrollment Report 2016. http://wcet.wiche.edu/initiatives/research/WCET-Distance-Education-Enrollment-Report-2016
NC-SARA 2017 Enrollment Report 12 September 18, 2017
IPEDS defines a Distance Education Course as “a course in which the instructional content is delivered
exclusively via distance education. Requirements for coming to campus for orientation, testing, or
academic support services do not exclude a course from being classified as distance education.”9
Institutions participating in SARA annually report the number of students enrolled in the institution via
distance education delivered outside the home state of the institution. The data is disaggregated by the
state, territory, or district where the students reside while receiving the instruction. SARA enrollment
data are reported in May-June of each year. The data are reported to NC-SARA annually in the spring
following the due date for institutions to make their fall enrollment reports to IPEDS.
Unique Features of NC-SARA Enrollment Reporting While NC-SARA reporting relies on the existing IPEDS reporting schedules and definitions, there are
some unique features of NC-SARA reporting. These include:
• Institutions do not report distance education enrollments in their own state to NC-SARA. Several
institutions did report in-state distance education enrollment to NC-SARA. NC-SARA removed
the enrollment reported in error in the data published in this report.
• Non-SARA state enrollments are not published individually. Each institution’s Non-SARA state
enrollments are combined by NC-SARA and reported in one field as Non-SARA enrollments.
• For the 2016 data reporting, institutions were instructed not to report enrollments in a state if
there were fewer than 10 students because of concerns about student privacy.
• For the 2017 data reporting that restriction was removed; however, some institutions still did
not report enrollments under 10 for a state. The result is an enrollment undercount, though the
extent of the undercount is not known.
• The process of states joining SARA and institutions within them applying to operate under SARA
is ongoing. Therefore, the annual reporting provides a snapshot of the distance education data
as of each year’s Fall IPEDS reporting.
• The NC-SARA website (www.nc-sara.org) publishes detailed reporting of these data by
institution name.
• The spring 2017 data discussed in this report is available for download from the NC-SARA
website (www.nc-sara.org).
Screenshots of the 2017 instructions and survey are in Appendix B.
Reporting Institutions by Sector Public institutions made up just over half (53.9%) of all institutions reporting enrollment to NC-SARA in
2017. Private non-profit institutions represent 40.3% and independent for-profit institutions represent
just under 6% of reporting institutions operating under SARA and reporting in 2017.
9 U.S. Department of Education, NCES National Center for Education Statistics, IPEDS Glossary for 2016-
2017 Data Collection System https://surveys.nces.ed.gov/IPEDS/Downloads/Forms/IPEDSGlossary.pdf
NC-SARA 2017 Enrollment Report 13 September 18, 2017
Sector
Number of Institutions Reporting
% of Total
Institutions Reporting
Independent/For-Profit 85 5.8%
Private Non-Profit
596
40.3%
Public 796 53.9%
Total 1,477
2017 Distance Education Enrollment NC-SARA sent requests via email with a link to report fall 2016 enrollment to the institutional contacts at
1,494 institutions operating under SARA. NC-SARA received responses from 1,477 institutions during the
annual reporting window in the spring of 2017. The response rate was 98.9%.
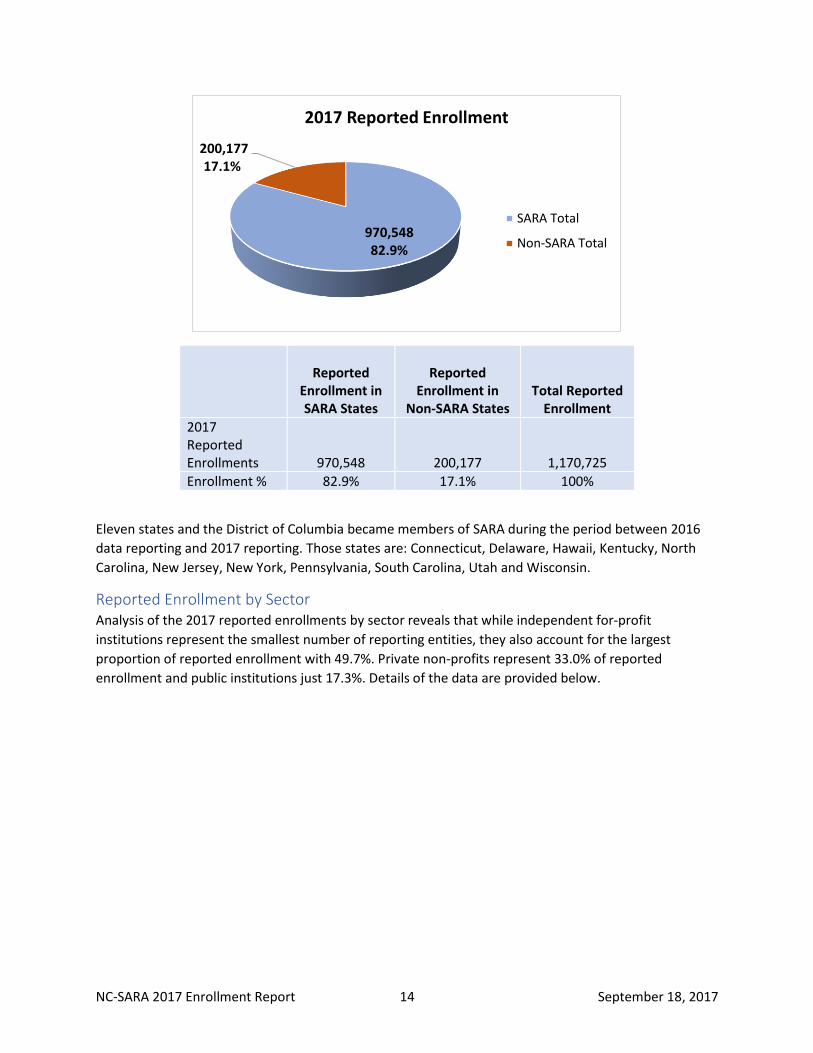
Total Reported Distance Education Enrollment Of the 1,477 responses received, 115 or 7.8% reported no distance education enrollment. The
institutions operating under SARA in these 47 states and the District of Columbia reported 1,170,725
distance education enrollments, 82.9% in SARA states and 17.1% in Non-SARA states.
5.8%
40.3%53.9%
Reporting Institutions by Sector
Independent/For-Profit
Private Non-Profit
Public
NC-SARA 2017 Enrollment Report 14 September 18, 2017
Reported
Enrollment in SARA States
Reported
Enrollment in Non-SARA States
Total Reported Enrollment
2017 Reported Enrollments 970,548 200,177 1,170,725
Enrollment % 82.9% 17.1% 100%
Eleven states and the District of Columbia became members of SARA during the period between 2016
data reporting and 2017 reporting. Those states are: Connecticut, Delaware, Hawaii, Kentucky, North
Carolina, New Jersey, New York, Pennsylvania, South Carolina, Utah and Wisconsin.
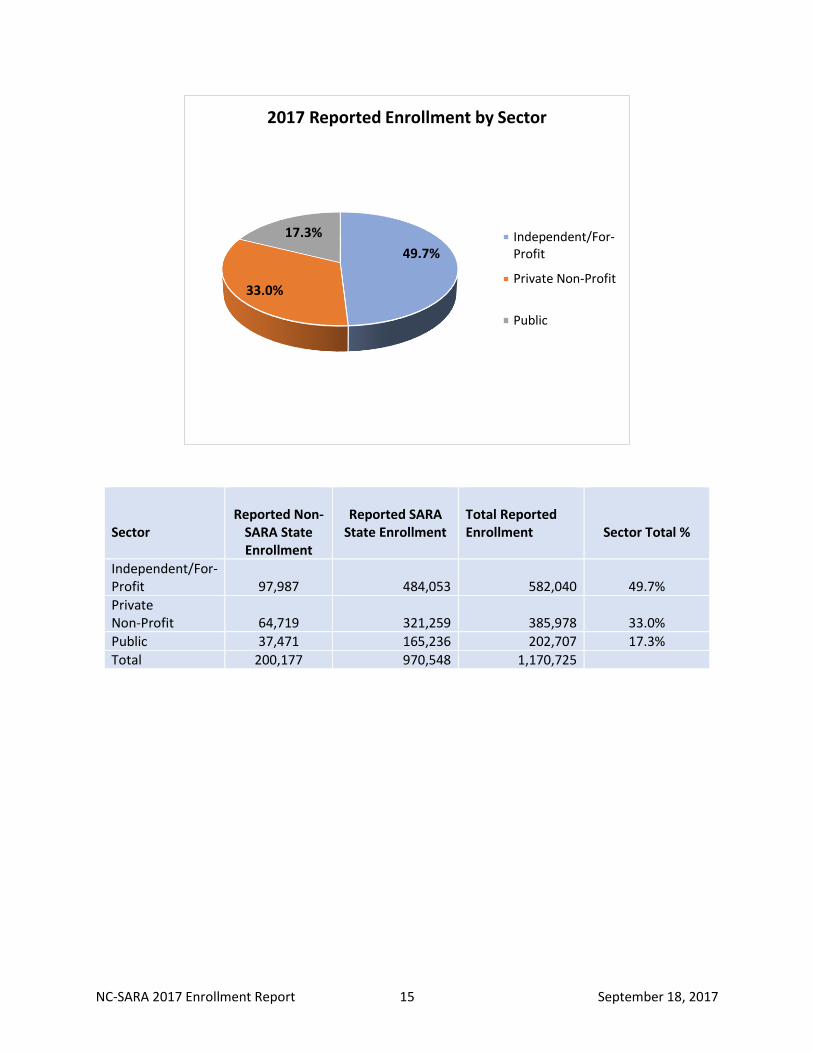
Reported Enrollment by Sector Analysis of the 2017 reported enrollments by sector reveals that while independent for-profit
institutions represent the smallest number of reporting entities, they also account for the largest
proportion of reported enrollment with 49.7%. Private non-profits represent 33.0% of reported
enrollment and public institutions just 17.3%. Details of the data are provided below.
970,54882.9%
200,177 17.1%
2017 Reported Enrollment
SARA Total
Non-SARA Total
NC-SARA 2017 Enrollment Report 15 September 18, 2017
Sector
Reported Non-
SARA State Enrollment
Reported SARA
State Enrollment
Total Reported Enrollment
Sector Total %
Independent/For-Profit 97,987 484,053 582,040 49.7%
Private Non-Profit 64,719 321,259 385,978 33.0%
Public 37,471 165,236 202,707 17.3%
Total 200,177 970,548 1,170,725
49.7%
33.0%
17.3%
2017 Reported Enrollment by Sector
Independent/For-Profit
Private Non-Profit
Public
NC-SARA 2017 Enrollment Report 16 September 18, 2017
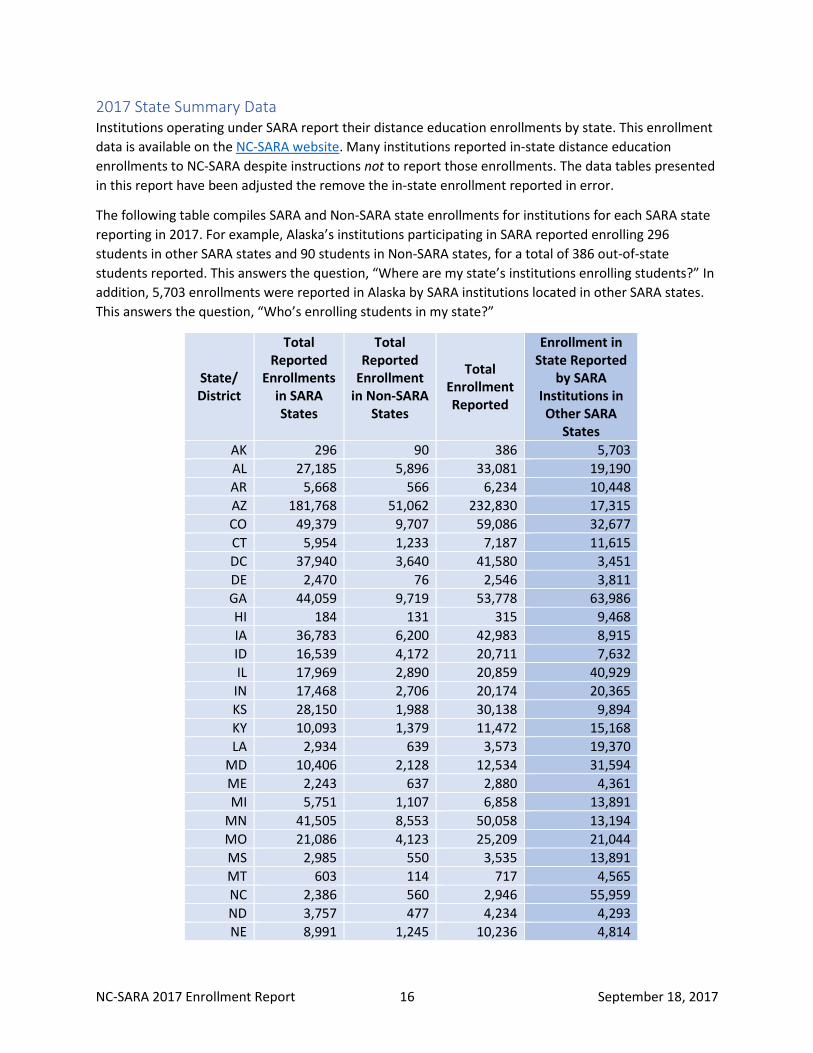
2017 State Summary Data Institutions operating under SARA report their distance education enrollments by state. This enrollment
data is available on the NC-SARA website. Many institutions reported in-state distance education
enrollments to NC-SARA despite instructions not to report those enrollments. The data tables presented
in this report have been adjusted the remove the in-state enrollment reported in error.
The following table compiles SARA and Non-SARA state enrollments for institutions for each SARA state
reporting in 2017. For example, Alaska’s institutions participating in SARA reported enrolling 296
students in other SARA states and 90 students in Non-SARA states, for a total of 386 out-of-state
students reported. This answers the question, “Where are my state’s institutions enrolling students?” In
addition, 5,703 enrollments were reported in Alaska by SARA institutions located in other SARA states.
This answers the question, “Who’s enrolling students in my state?”
State/ District
Total Reported
Enrollments in SARA States
Total Reported
Enrollment in Non-SARA
States
Total Enrollment Reported
Enrollment in State Reported
by SARA Institutions in Other SARA
States
AK 296 90 386 5,703
AL 27,185 5,896 33,081 19,190
AR 5,668 566 6,234 10,448
AZ 181,768 51,062 232,830 17,315
CO 49,379 9,707 59,086 32,677
CT 5,954 1,233 7,187 11,615
DC 37,940 3,640 41,580 3,451
DE 2,470 76 2,546 3,811
GA 44,059 9,719 53,778 63,986
HI 184 131 315 9,468
IA 36,783 6,200 42,983 8,915
ID 16,539 4,172 20,711 7,632
IL 17,969 2,890 20,859 40,929
IN 17,468 2,706 20,174 20,365
KS 28,150 1,988 30,138 9,894
KY 10,093 1,379 11,472 15,168
LA 2,934 639 3,573 19,370
MD 10,406 2,128 12,534 31,594
ME 2,243 637 2,880 4,361
MI 5,751 1,107 6,858 13,891
MN 41,505 8,553 50,058 13,194
MO 21,086 4,123 25,209 21,044
MS 2,985 550 3,535 13,891
MT 603 114 717 4,565
NC 2,386 560 2,946 55,959
ND 3,757 477 4,234 4,293
NE 8,991 1,245 10,236 4,814
NC-SARA 2017 Enrollment Report 17 September 18, 2017
NH 44,816 12,954 57,770 3,342
NJ 9,111 1,850 10,961 28,656
NM 2,968 599 3,567 8,610
NV 283 401 684 15,425
NY 35,147 6,913 42,060 39,111
OH 16,815 2,772 19,587 36,299
OK 3,099 530 3,629 13,224
OR 9,138 3,083 12,221 11,930
PA 23,871 4,208 28,079 39,791
RI 876 454 1,330 2,968
SC 1,752 568 2,320 29,835
SD 3,313 327 3,640 3,119
TN 5,491 611 6,102 30,343
TX 12,270 3,690 15,960 98,911
UT 74,198 14,437 88,635 11,774
VA 48,814 7,718 56,532 51,624
VT 3,274 793 4,067 2,161
WA 2,828 861 3,689 36,923
WI 6,673 796 7,469 16,429
WV 80,832 14,994 95,826 6,110
WY 427 30 457 4,286
Totals 970,548 200,177 1,170,725 958,414
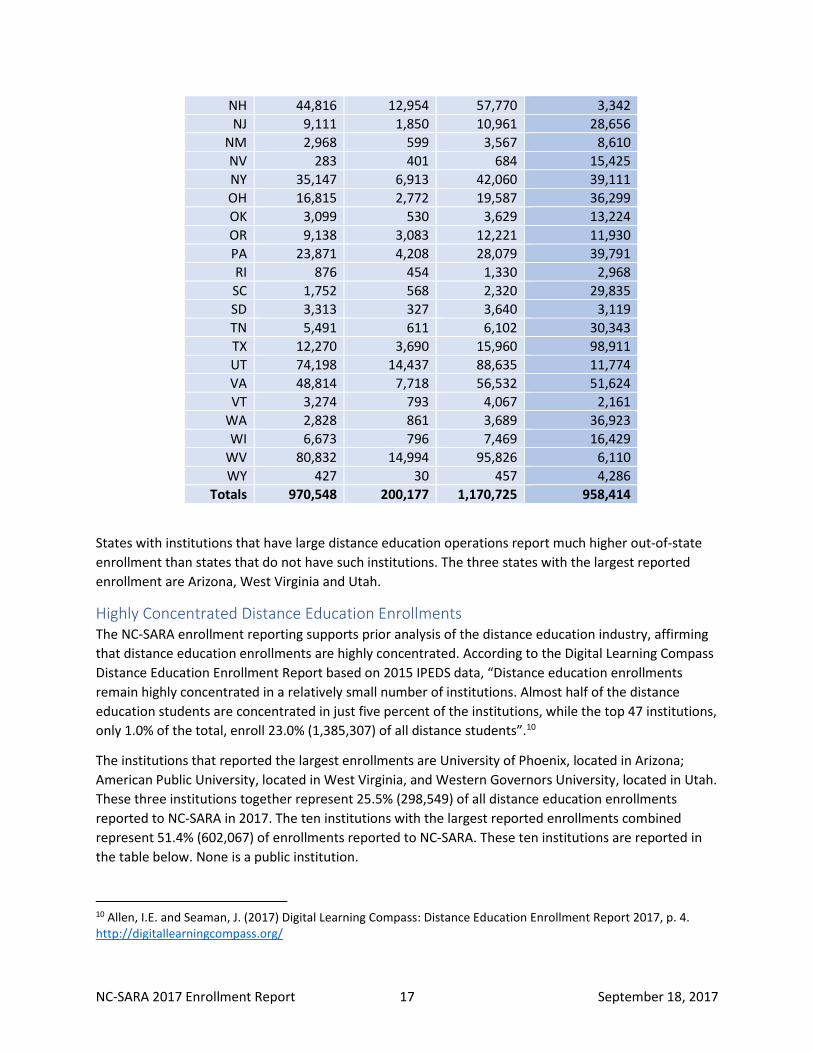
States with institutions that have large distance education operations report much higher out-of-state
enrollment than states that do not have such institutions. The three states with the largest reported
enrollment are Arizona, West Virginia and Utah.
Highly Concentrated Distance Education Enrollments The NC-SARA enrollment reporting supports prior analysis of the distance education industry, affirming
that distance education enrollments are highly concentrated. According to the Digital Learning Compass
Distance Education Enrollment Report based on 2015 IPEDS data, “Distance education enrollments
remain highly concentrated in a relatively small number of institutions. Almost half of the distance
education students are concentrated in just five percent of the institutions, while the top 47 institutions,
only 1.0% of the total, enroll 23.0% (1,385,307) of all distance students”.10
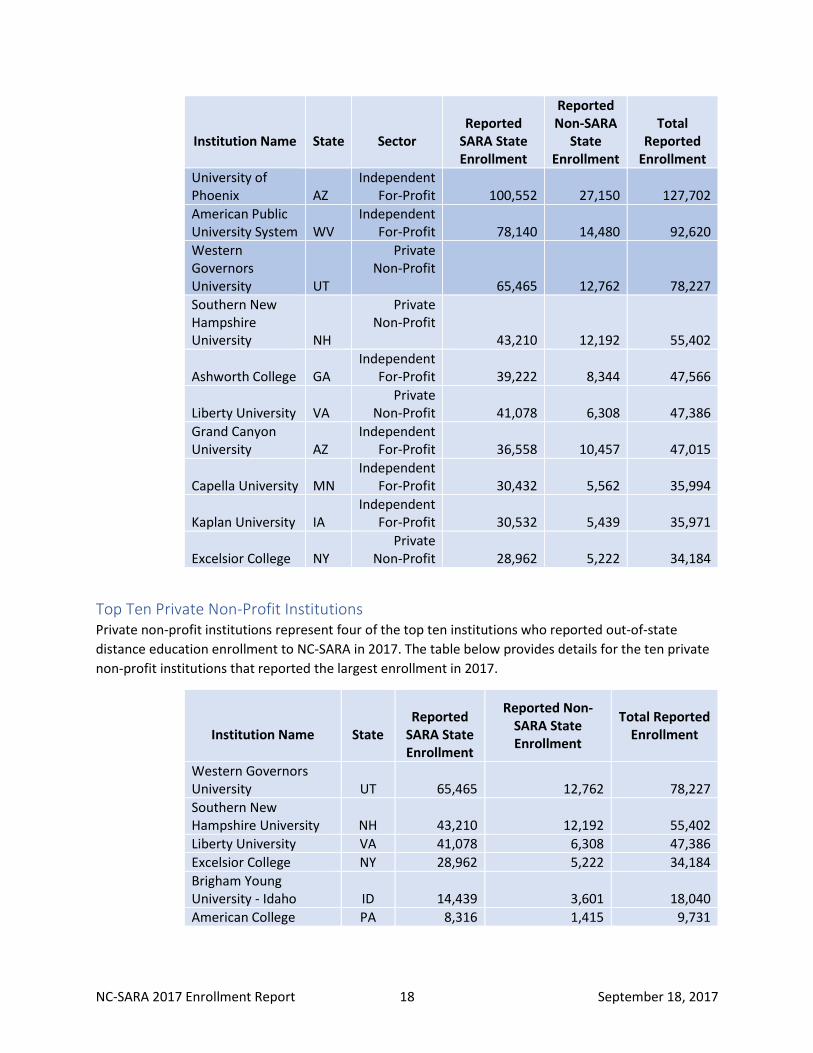
The institutions that reported the largest enrollments are University of Phoenix, located in Arizona;
American Public University, located in West Virginia, and Western Governors University, located in Utah.
These three institutions together represent 25.5% (298,549) of all distance education enrollments
reported to NC-SARA in 2017. The ten institutions with the largest reported enrollments combined
represent 51.4% (602,067) of enrollments reported to NC-SARA. These ten institutions are reported in
the table below. None is a public institution.
10 Allen, I.E. and Seaman, J. (2017) Digital Learning Compass: Distance Education Enrollment Report 2017, p. 4. http://digitallearningcompass.org/
NC-SARA 2017 Enrollment Report 18 September 18, 2017
Institution Name
State
Sector
Reported
SARA State Enrollment
Reported Non-SARA
State Enrollment
Total
Reported Enrollment
University of Phoenix AZ
Independent For-Profit 100,552 27,150 127,702
American Public University System WV
Independent For-Profit 78,140 14,480 92,620
Western Governors University UT
Private Non-Profit
65,465 12,762 78,227
Southern New Hampshire University NH
Private Non-Profit
43,210 12,192 55,402
Ashworth College GA Independent
For-Profit 39,222 8,344 47,566
Liberty University VA Private
Non-Profit 41,078 6,308 47,386
Grand Canyon University AZ
Independent For-Profit 36,558 10,457 47,015
Capella University MN Independent
For-Profit 30,432 5,562 35,994
Kaplan University IA Independent
For-Profit 30,532 5,439 35,971
Excelsior College NY Private
Non-Profit 28,962 5,222 34,184
Top Ten Private Non-Profit Institutions Private non-profit institutions represent four of the top ten institutions who reported out-of-state
distance education enrollment to NC-SARA in 2017. The table below provides details for the ten private
non-profit institutions that reported the largest enrollment in 2017.
Institution Name
State
Reported
SARA State Enrollment
Reported Non-SARA State Enrollment
Total Reported
Enrollment
Western Governors University UT 65,465 12,762 78,227
Southern New Hampshire University NH 43,210 12,192 55,402
Liberty University VA 41,078 6,308 47,386
Excelsior College NY 28,962 5,222 34,184
Brigham Young University - Idaho ID 14,439 3,601 18,040
American College PA 8,316 1,415 9,731
NC-SARA 2017 Enrollment Report 19 September 18, 2017
Columbia College, Columbia MO 4,501 1,619 6,120
Park University MO 4,193 574 4,767
Johns Hopkins University MD 3,654 1,084 4,738
Bellevue University NE 3,880 617 4,497
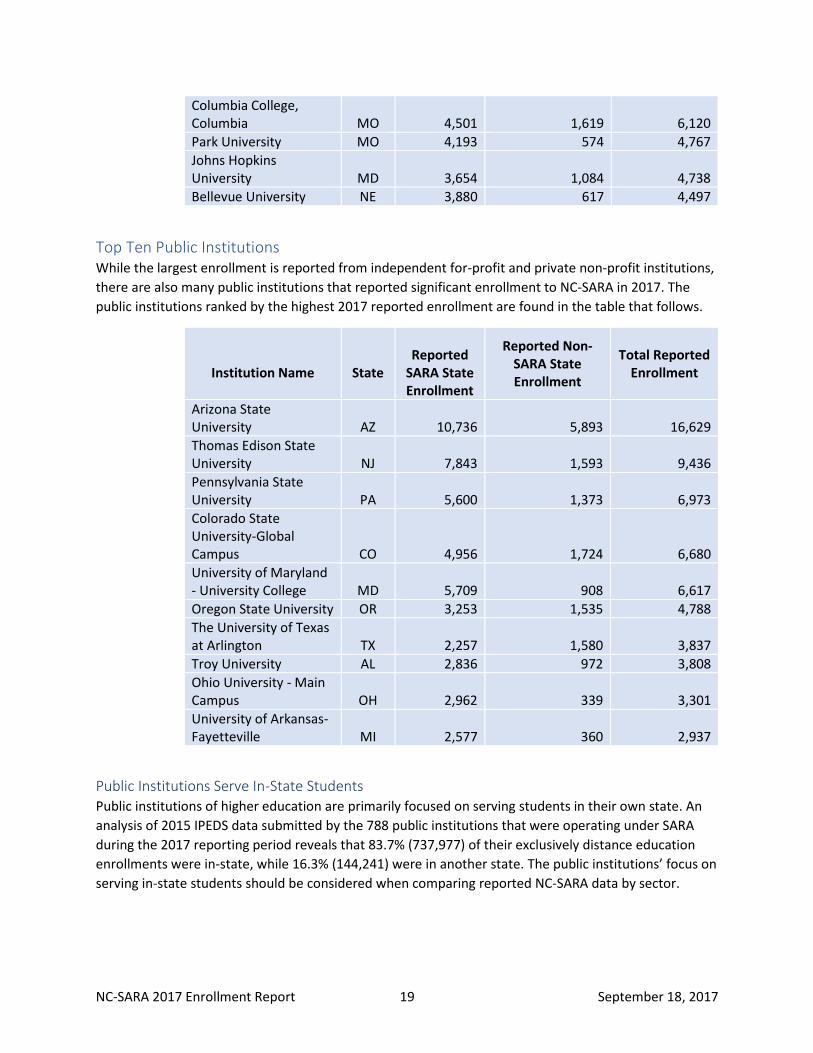
Top Ten Public Institutions While the largest enrollment is reported from independent for-profit and private non-profit institutions,
there are also many public institutions that reported significant enrollment to NC-SARA in 2017. The
public institutions ranked by the highest 2017 reported enrollment are found in the table that follows.
Institution Name
State
Reported
SARA State Enrollment
Reported Non-SARA State Enrollment
Total Reported
Enrollment
Arizona State University AZ 10,736 5,893 16,629
Thomas Edison State University NJ 7,843 1,593 9,436
Pennsylvania State University PA 5,600 1,373 6,973
Colorado State University-Global Campus CO 4,956 1,724 6,680
University of Maryland - University College MD 5,709 908 6,617
Oregon State University OR 3,253 1,535 4,788
The University of Texas at Arlington TX 2,257 1,580 3,837
Troy University AL 2,836 972 3,808
Ohio University - Main Campus OH 2,962 339 3,301
University of Arkansas-Fayetteville MI 2,577 360 2,937
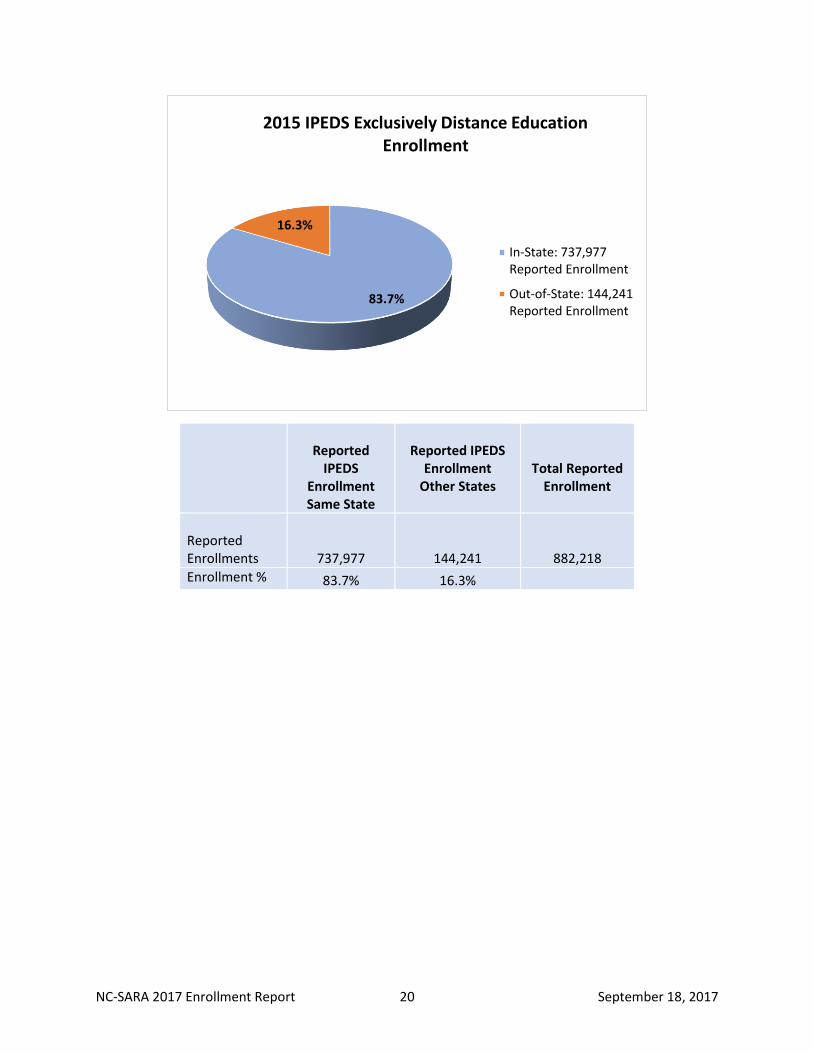
Public Institutions Serve In-State Students Public institutions of higher education are primarily focused on serving students in their own state. An
analysis of 2015 IPEDS data submitted by the 788 public institutions that were operating under SARA
during the 2017 reporting period reveals that 83.7% (737,977) of their exclusively distance education
enrollments were in-state, while 16.3% (144,241) were in another state. The public institutions’ focus on
serving in-state students should be considered when comparing reported NC-SARA data by sector.
NC-SARA 2017 Enrollment Report 20 September 18, 2017
Reported
IPEDS Enrollment Same State
Reported IPEDS
Enrollment Other States
Total Reported Enrollment
Reported Enrollments 737,977 144,241 882,218
Enrollment % 83.7% 16.3%
83.7%
16.3%
2015 IPEDS Exclusively Distance Education Enrollment
In-State: 737,977Reported Enrollment
Out-of-State: 144,241Reported Enrollment
NC-SARA 2017 Enrollment Report 21 September 18, 2017
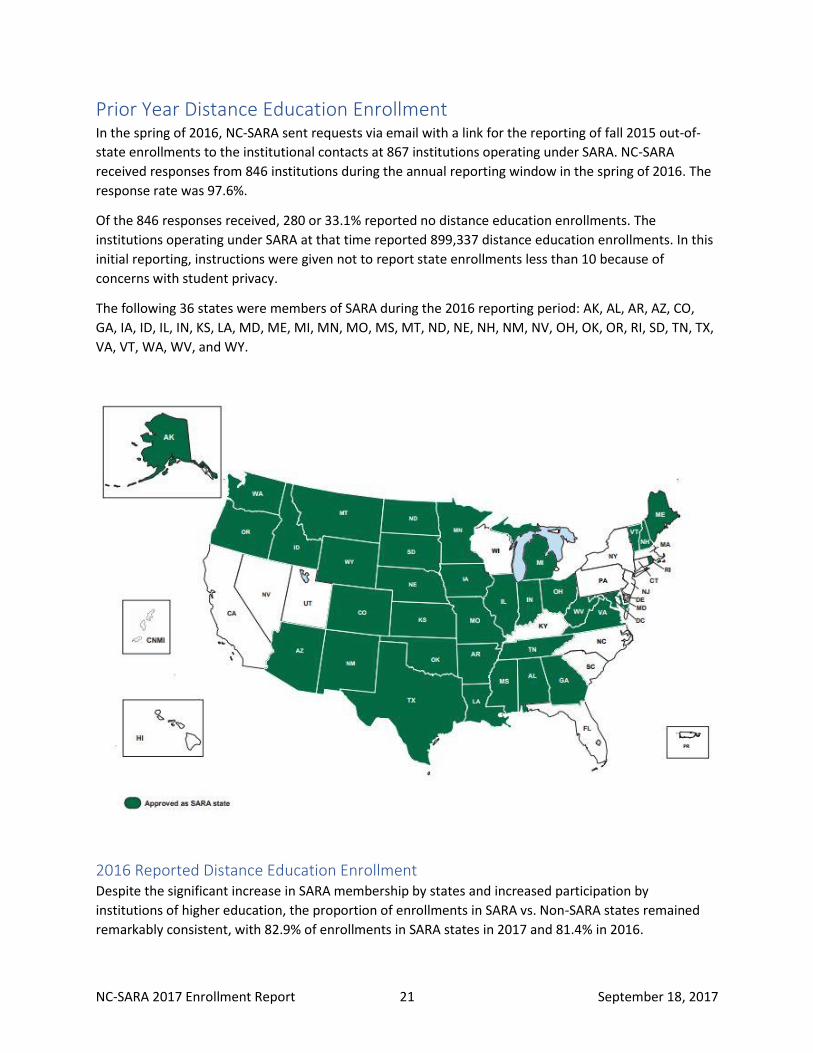
Prior Year Distance Education Enrollment In the spring of 2016, NC-SARA sent requests via email with a link for the reporting of fall 2015 out-of-
state enrollments to the institutional contacts at 867 institutions operating under SARA. NC-SARA
received responses from 846 institutions during the annual reporting window in the spring of 2016. The
response rate was 97.6%.
Of the 846 responses received, 280 or 33.1% reported no distance education enrollments. The
institutions operating under SARA at that time reported 899,337 distance education enrollments. In this
initial reporting, instructions were given not to report state enrollments less than 10 because of
concerns with student privacy.
The following 36 states were members of SARA during the 2016 reporting period: AK, AL, AR, AZ, CO,
GA, IA, ID, IL, IN, KS, LA, MD, ME, MI, MN, MO, MS, MT, ND, NE, NH, NM, NV, OH, OK, OR, RI, SD, TN, TX,
VA, VT, WA, WV, and WY.
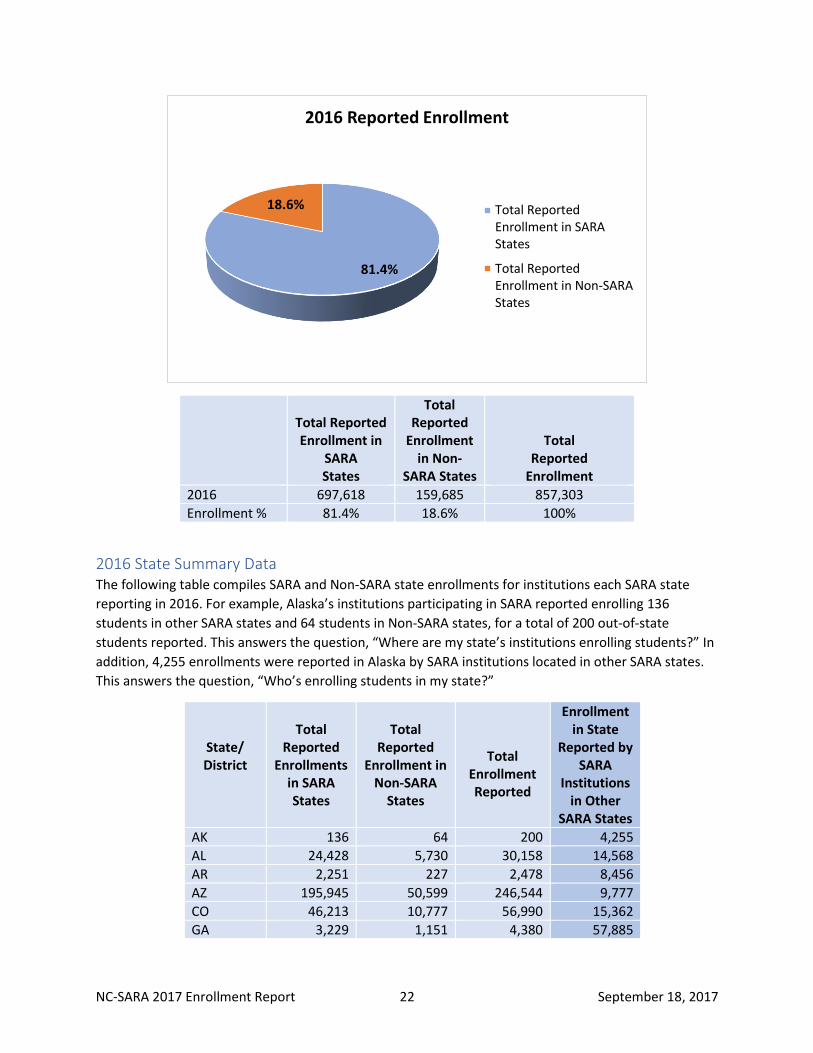
2016 Reported Distance Education Enrollment Despite the significant increase in SARA membership by states and increased participation by
institutions of higher education, the proportion of enrollments in SARA vs. Non-SARA states remained
remarkably consistent, with 82.9% of enrollments in SARA states in 2017 and 81.4% in 2016.
NC-SARA 2017 Enrollment Report 22 September 18, 2017
Total Reported Enrollment in
SARA States
Total Reported
Enrollment in Non-
SARA States
Total Reported
Enrollment
2016 697,618 159,685 857,303
Enrollment % 81.4% 18.6% 100%
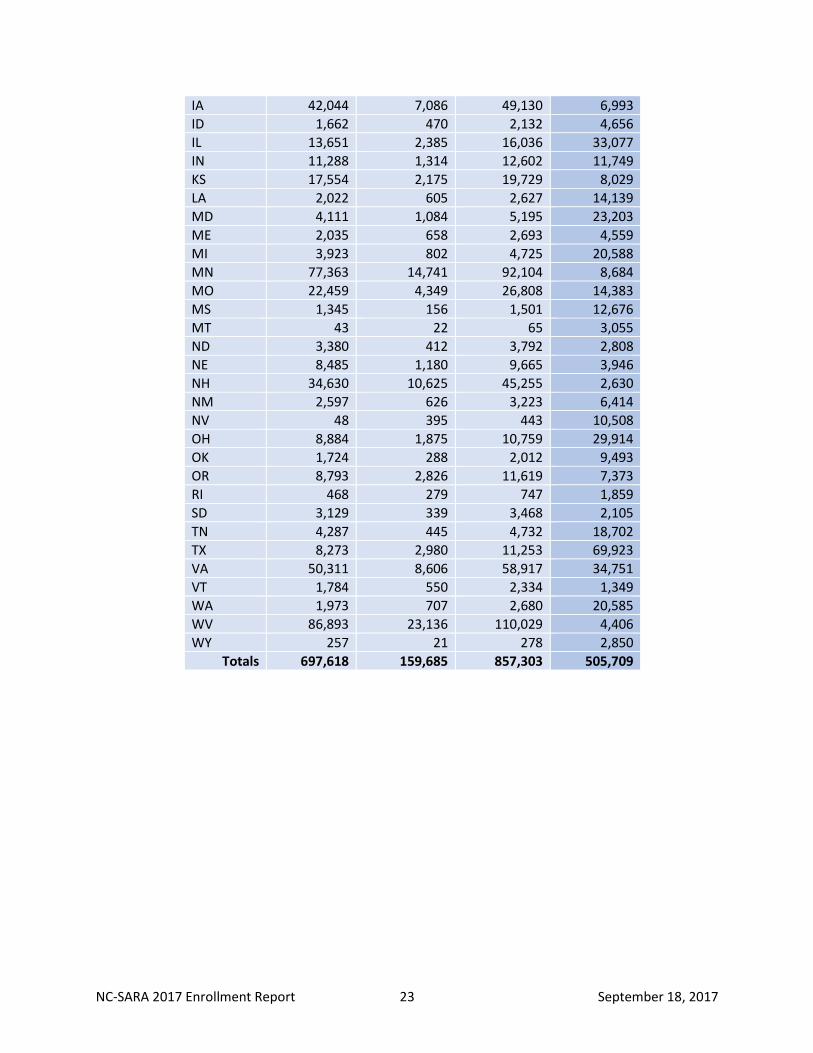
2016 State Summary Data The following table compiles SARA and Non-SARA state enrollments for institutions each SARA state
reporting in 2016. For example, Alaska’s institutions participating in SARA reported enrolling 136
students in other SARA states and 64 students in Non-SARA states, for a total of 200 out-of-state
students reported. This answers the question, “Where are my state’s institutions enrolling students?” In
addition, 4,255 enrollments were reported in Alaska by SARA institutions located in other SARA states.
This answers the question, “Who’s enrolling students in my state?”
State/ District
Total
Reported Enrollments
in SARA States
Total
Reported Enrollment in
Non-SARA States
Total
Enrollment Reported
Enrollment in State
Reported by SARA
Institutions in Other
SARA States
AK 136 64 200 4,255
AL 24,428 5,730 30,158 14,568
AR 2,251 227 2,478 8,456
AZ 195,945 50,599 246,544 9,777
CO 46,213 10,777 56,990 15,362
GA 3,229 1,151 4,380 57,885
81.4%
18.6%
2016 Reported Enrollment
Total ReportedEnrollment in SARAStates
Total ReportedEnrollment in Non-SARAStates
NC-SARA 2017 Enrollment Report 23 September 18, 2017
IA 42,044 7,086 49,130 6,993
ID 1,662 470 2,132 4,656
IL 13,651 2,385 16,036 33,077
IN 11,288 1,314 12,602 11,749
KS 17,554 2,175 19,729 8,029
LA 2,022 605 2,627 14,139
MD 4,111 1,084 5,195 23,203
ME 2,035 658 2,693 4,559
MI 3,923 802 4,725 20,588
MN 77,363 14,741 92,104 8,684
MO 22,459 4,349 26,808 14,383
MS 1,345 156 1,501 12,676
MT 43 22 65 3,055
ND 3,380 412 3,792 2,808
NE 8,485 1,180 9,665 3,946
NH 34,630 10,625 45,255 2,630
NM 2,597 626 3,223 6,414
NV 48 395 443 10,508
OH 8,884 1,875 10,759 29,914
OK 1,724 288 2,012 9,493
OR 8,793 2,826 11,619 7,373
RI 468 279 747 1,859
SD 3,129 339 3,468 2,105
TN 4,287 445 4,732 18,702
TX 8,273 2,980 11,253 69,923
VA 50,311 8,606 58,917 34,751
VT 1,784 550 2,334 1,349
WA 1,973 707 2,680 20,585
WV 86,893 23,136 110,029 4,406
WY 257 21 278 2,850
Totals 697,618 159,685 857,303 505,709
NC-SARA 2017 Enrollment Report 24 September 18, 2017
Data Comparison: Spring 2017 vs Spring 2016
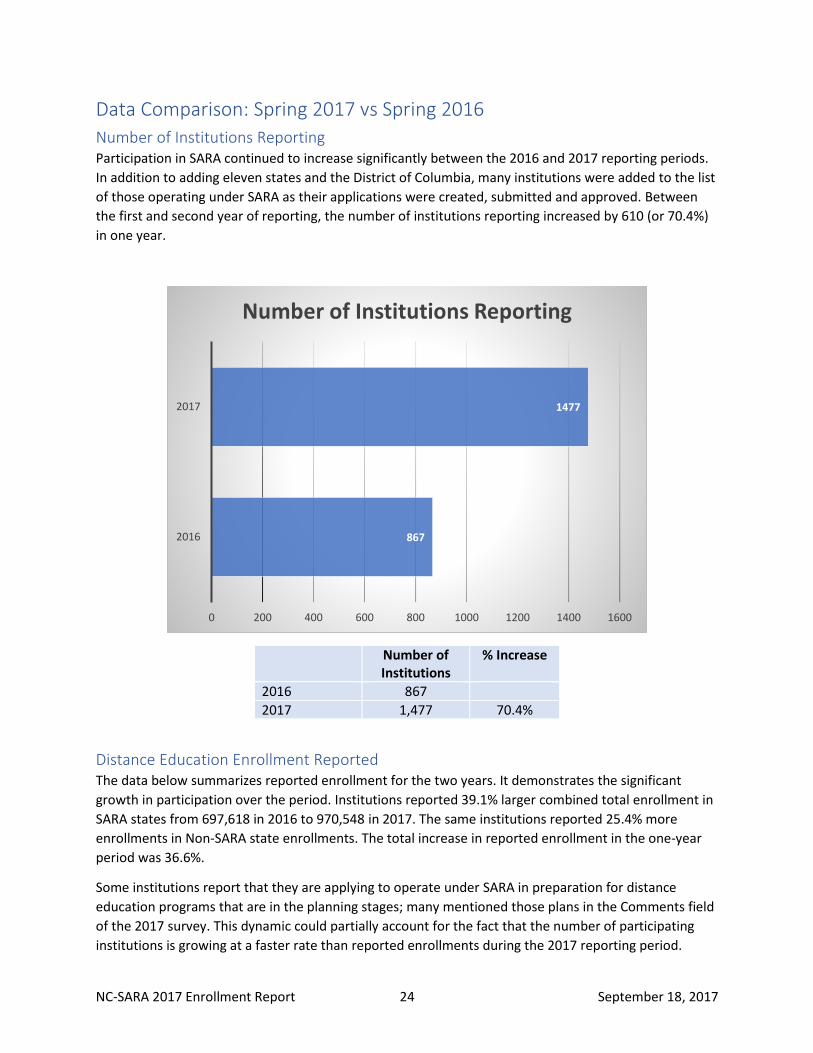
Number of Institutions Reporting Participation in SARA continued to increase significantly between the 2016 and 2017 reporting periods.
In addition to adding eleven states and the District of Columbia, many institutions were added to the list
of those operating under SARA as their applications were created, submitted and approved. Between
the first and second year of reporting, the number of institutions reporting increased by 610 (or 70.4%)
in one year.
Number of Institutions
% Increase
2016 867
2017 1,477 70.4%
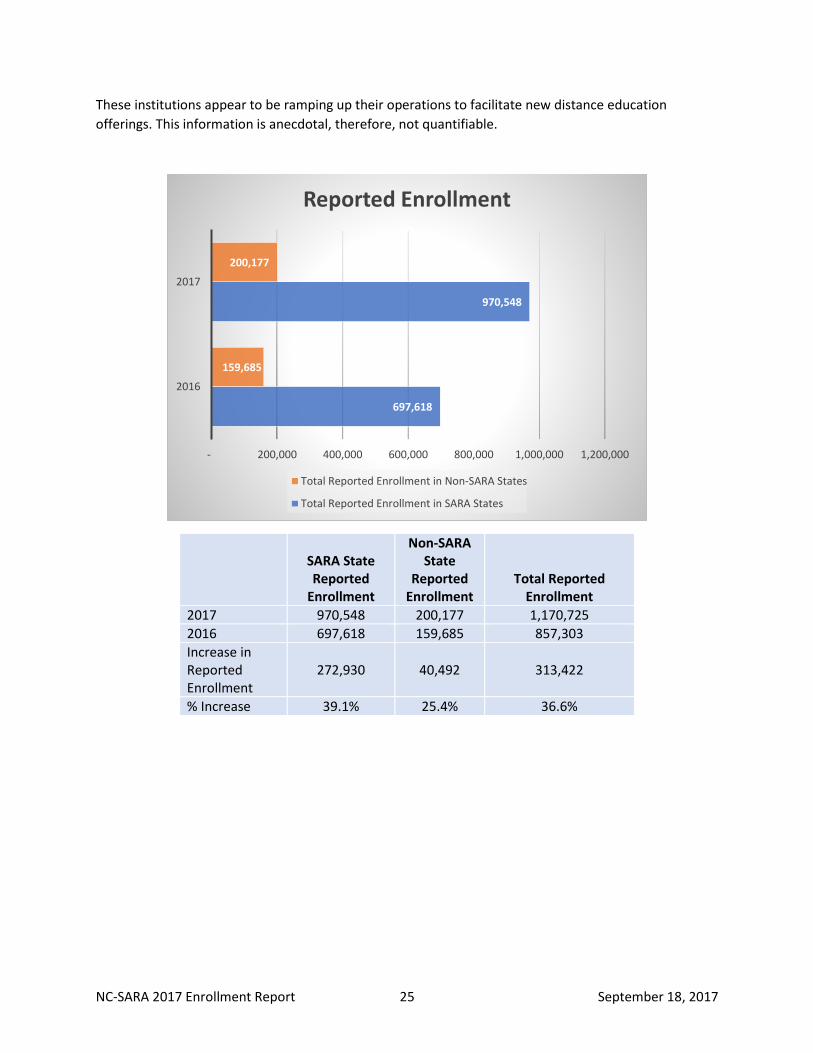
Distance Education Enrollment Reported The data below summarizes reported enrollment for the two years. It demonstrates the significant
growth in participation over the period. Institutions reported 39.1% larger combined total enrollment in
SARA states from 697,618 in 2016 to 970,548 in 2017. The same institutions reported 25.4% more
enrollments in Non-SARA state enrollments. The total increase in reported enrollment in the one-year
period was 36.6%.
Some institutions report that they are applying to operate under SARA in preparation for distance
education programs that are in the planning stages; many mentioned those plans in the Comments field
of the 2017 survey. This dynamic could partially account for the fact that the number of participating
institutions is growing at a faster rate than reported enrollments during the 2017 reporting period.
867
1477
0 200 400 600 800 1000 1200 1400 1600
2016
2017
Number of Institutions Reporting
NC-SARA 2017 Enrollment Report 25 September 18, 2017
These institutions appear to be ramping up their operations to facilitate new distance education
offerings. This information is anecdotal, therefore, not quantifiable.
SARA State Reported
Enrollment
Non-SARA State
Reported Enrollment
Total Reported Enrollment
2017 970,548 200,177 1,170,725
2016 697,618 159,685 857,303
Increase in Reported Enrollment
272,930
40,492
313,422
% Increase 39.1% 25.4% 36.6%
697,618
970,548
159,685
200,177
- 200,000 400,000 600,000 800,000 1,000,000 1,200,000
2016
2017
Reported Enrollment
Total Reported Enrollment in Non-SARA States
Total Reported Enrollment in SARA States
NC-SARA 2017 Enrollment Report 26 September 18, 2017
Reporting Challenges In an attempt to standardize reporting requirements for institutions, SARA relies on IPEDS definitions,
schedules, etc. Unfortunately, it is clear from the comments submitted in 2017 that many institutions
struggle to understand how they should report to IPEDS. And, since NC-SARA’s basic instructions are to
“report as you do for IPEDS, but disaggregate by state, territory, or district in which the students
reside”,11 those misunderstandings affect NC-SARA reporting. Over half (51.7%) of comments provided
in the Comment field of 2017 survey specifically mentioned variations from IPEDS data, definitions and
concerns with how to report military students and those in territories.
SARA member institutions continue to describe enrollment reporting issues related to IPEDS protocols.
These include:
• IPEDS’ definition of a “Distance Education Course” as one delivered exclusively via distance
education is a source of confusion as reported by many providing the enrollment data for their
institutions. Some institutions have their own definitions, usually less narrow, that they use to
generate distance education reports. It is a burden to the institutions to have to maintain data
using different definitions.
• Significant numbers of institutions continued to report in-state enrollments despite instructions
that indicate not to report those enrollments to NC-SARA.
• Confusion about how to report military students (APO, etc.).
• Confusion about the U.S. Territories and the fact that they are not included by name in IPEDS
reporting.
• Inability to report some fields that are in IPEDS, but not in NC-SARA data collection; these
include: “Student in U.S., Location Unknown”, “Student Located Outside the U.S.” and “Student
Location Unknown”.
• A small number of institutions reported that they have continuous enrollment throughout the
year, so the IPEDS “Fall Enrollment” date has little meaning for them. Some institutions report
the full year of enrollment, others use the IPEDS date as a cut off, knowing the result is under-
reporting enrollment.
• A small number of institutions indicated that they did not report state totals less than ten
because of continuing concerns about student privacy.
The Comments field is a welcome addition to the reporting process. Many respondents used the
Comments field to explain how their NC-SARA reporting was different from their IPEDS data reporting.
This attention to detail and willingness to share the differences so transparently is a major step toward
distance education data integrity for SARA and the entire distance education industry.
In addition, institutional changes that either merge previous IPEDS Unit IDs or separate units that
previously reported together into individual campus IDs remain a problem for the institutions affected
and those comparing institutional data over time. The IPEDS Unit ID is a unique numeric identification
number assigned to an institution by IPEDS.
11 NC-SARA Manual, p. 34. http://www.nc-sara.org/files/docs/NC-SARA_Manual_Final_2016.pdf
NC-SARA 2017 Enrollment Report 27 September 18, 2017
Recommendations to Improve Reporting Based on a review of the comments provided by those reporting distance education data to NC-SARA in
the spring of 2017 and interviews with NC-SARA staff, the following recommendations should be
considered as NC-SARA continues to refine the data reporting process:
• Ensure there are fields for all five U.S. territories: U.S. Virgin Islands, Puerto Rico, CNMI,
American Samoa, and Guam. Spell out Commonwealth of the Northern Mariana Islands (CNMI)
on the survey screen; a few people commented that they didn’t know what it was despite the
instructions that highlighted this territory by name.
• Continue to highlight the fact that in-state distance education enrollments are not reported to
NC-SARA. A significant number of institutions continue to report these enrollments in error.
Reported in-state enrollment is removed from the published totals in this report.
• Add contact fields: Name, Title, Email, Phone number of person completing the report.
• Add instructions that explain that the data reported to IPEDS and NC-SARA will not necessarily
match. IPEDS will include the home state “exclusively distance education” enrollments, SARA
will not. IPEDS also has fields that are not relevant to SARA data collection, those include:
“Student in U.S., Location Unknown”, “Student Located Outside the U.S.” and “Student Location
Unknown”. SARA data collection includes reporting enrollment for the U.S. Territories and the
District of Columbia; IPEDS does not.
• Keep the Comments field. Those reporting in 2017 used the field to explain discrepancies from
IPEDS data, inform NC-SARA of changes in IPEDS Unit number, provide their contact
information, and report issues that were confusing to them. It is a useful addition to the data
survey since it allows NC-SARA to identify trends and areas for improvement.
• Consider adding state abbreviations next to state name since system queries often return two
letter state abbreviations. Alphabetic listings of state names and state abbreviations return the
states in different order. Including as much information in the label of the survey for each state
should improve the reliability of the data reported.
• Standardize the display of data by state to be consistent between tables. Alphabetize either by
state name or abbreviation consistently.
• Consider adding a Total field that automatically totals submissions, if not technically
burdensome.
Collaboration with NCES to improve the definition of a “Distance Education Course” and other related
definitions used by IPEDS would be a big step toward improving the consistency and reliability of all
distance education data reported.
Overall, the reporting process and mechanisms to receive the data worked well for the second NC-SARA
reporting period. The rapid adoption of SARA by the states and the institutions within them provides a
new and likely more reliable source of information about distance education offerings in the U.S. than
was previously available through the Babson Survey Research Group (BSRG) surveys12 and prior IPEDS
12 Allen, I.E. and Seaman, J., (2016) Online Report Card: Tracking Online Education in the United States. http://onlinelearningsurvey.com/reports/onlinereportcard.pdf
NC-SARA 2017 Enrollment Report 28 September 18, 2017
Distance Education reporting by the WICHE Cooperative for Educational Technologies (WCET)13 and
others. NC-SARA’s commitment to transparency in distance education data collection and reporting is
setting a collaborative tone that may help establish a new norm for institutions. Continued
improvement in the processes, systems and communication related to the annual NC-SARA data
collection will improve the process and give all who use these data a renewed confidence in what they
tell us about distance education adoption and use across state lines in the U.S.
13 Poulin, R. and Straut, T. (2016). WCET Distance Education Enrollment Report 2016. http://wcet.wiche.edu/initiatives/research/WCET-Distance-Education-Enrollment-Report-2016
NC-SARA 2017 Enrollment Report 29 September 18, 2017
Appendix A: Technical Notes
Definitions The following definitions are provided by The Department of Education National Center for Educational
Statistics (NCES)14.
Distance Education - Education that uses one or more technologies to deliver instruction to students
who are separated from the instructor and to support regular and substantive interaction between the
students and the instructor synchronously or asynchronously. Technologies used for instruction may
include the following: Internet; one-way and two-way transmissions through open broadcasts, closed
circuit, cable, microwave, broadband lines, fiber optics, satellite or wireless communication devices;
audio conferencing; and video cassette, DVDs, and CD-ROMs, if the cassette, DVDs, and CD-ROMs are
used in a course in conjunction with the technologies listed above.
Distance Education Course - a course in which the instructional content is delivered exclusively via
distance education. Requirements for coming to campus for orientation, testing, or academic support
services do not exclude a course from being classified as distance education.
Distance Education Program – A program for which all the required coursework for program completion
is able to be completed via distance education courses.
The historic use of definitions:
The IPEDS Fall Enrollment report asks institutions to separate students into three categories:
• Enrolled Exclusively in Distance Education Courses
• Enrolled in Some (But Not All) Distance Education Course
• Not Enrolled in Any Distance Education Courses
To approximate the historic distance education surveys conducted by the Babson Survey Research
Group (BSRG) that used a definition of approximately 80% of the course online, the WICHE Cooperative
for Educational Technologies (WCET) and others have combined the IPEDS reporting for Exclusively in
Distance Education courses and Some But Not All Distance Education course. This combination of
reporting has been referred to as “Enrolled in At Least One” Distance Education Course. Reporting of
IPEDS distance education data often utilizes this category.
Additional SARA-specific definitions are available in the current version of the SARA Policy and
Operations Manual.15
14 U.S. Department of Education, NCES National Center for Education Statistics, IPEDS Glossary for 2016-2017 Data Collection System https://surveys.nces.ed.gov/IPEDS/Downloads/Forms/IPEDSGlossary.pdf 15 NC-SARA, State Authorization Reciprocity Agreements Policy and Operations Manual (2016). Version 16.3. http://www.nc-sara.org/files/docs/NC-SARA_Manual_Final_2016.pdf
NC-SARA 2017 Enrollment Report 30 September 18, 2017
SARA Institutions Reporting In-State Enrollment The NC-SARA Manual outlines data submission requirements for participating institutions. The
instructions say, “Institutions participating in the State Authorization Reciprocity Agreements (SARA)
shall annually report to the National Council for State Authorization Reciprocity Agreements the number
of students enrolled in the institution via distance education delivered outside the home state of the
institution, disaggregated by state, territory, or district in which the students reside.”16
Despite these instructions, many institutions continue to report in-state enrollments to NC-SARA. NC-
SARA returns in-state enrollment reported by institutions to zero to ensure accurate reporting at the
state in and institutional level, in alignment with the SARA guidelines.
16 NC-SARA Manual, p. 34. http://www.nc-sara.org/files/docs/NC-SARA_Manual_Final_2016.pdf
NC-SARA 2017 Enrollment Report 31 September 18, 2017
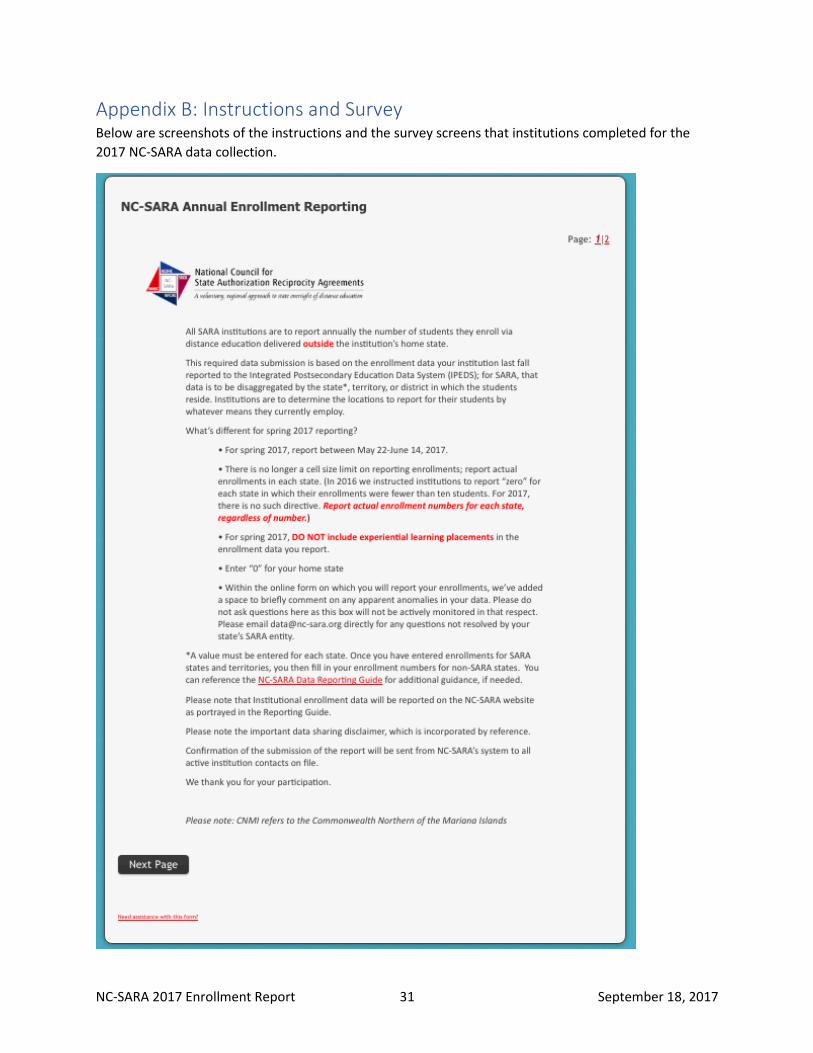
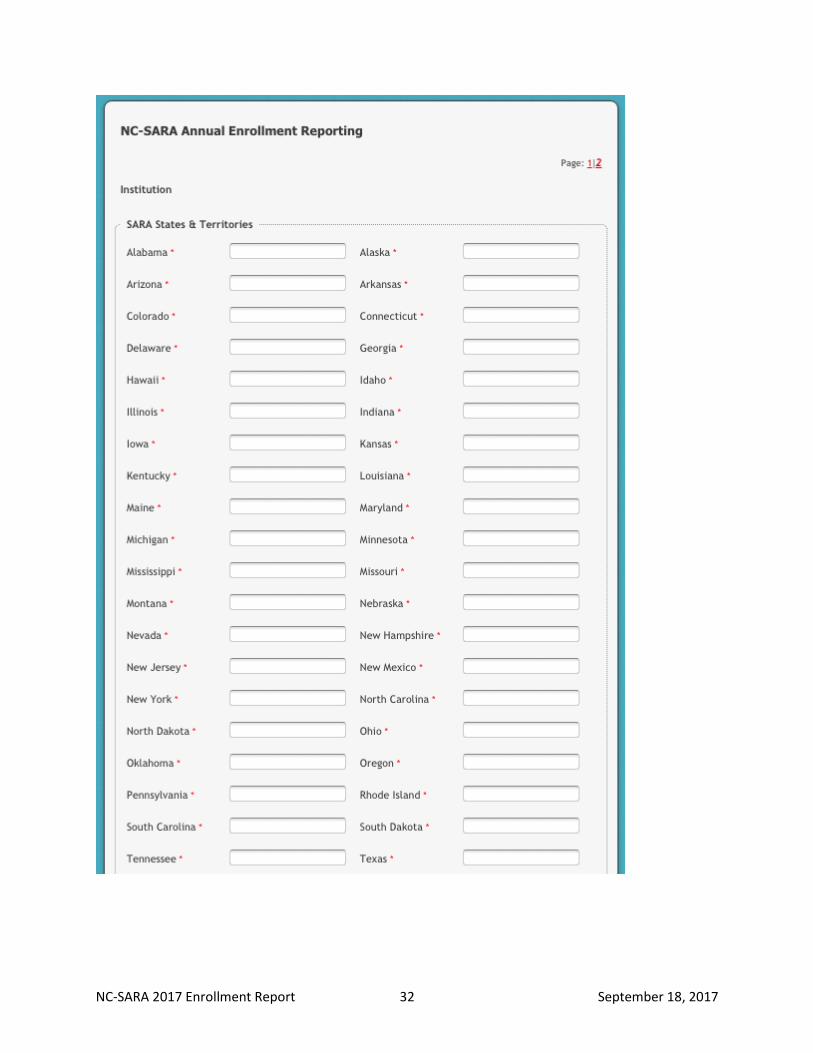
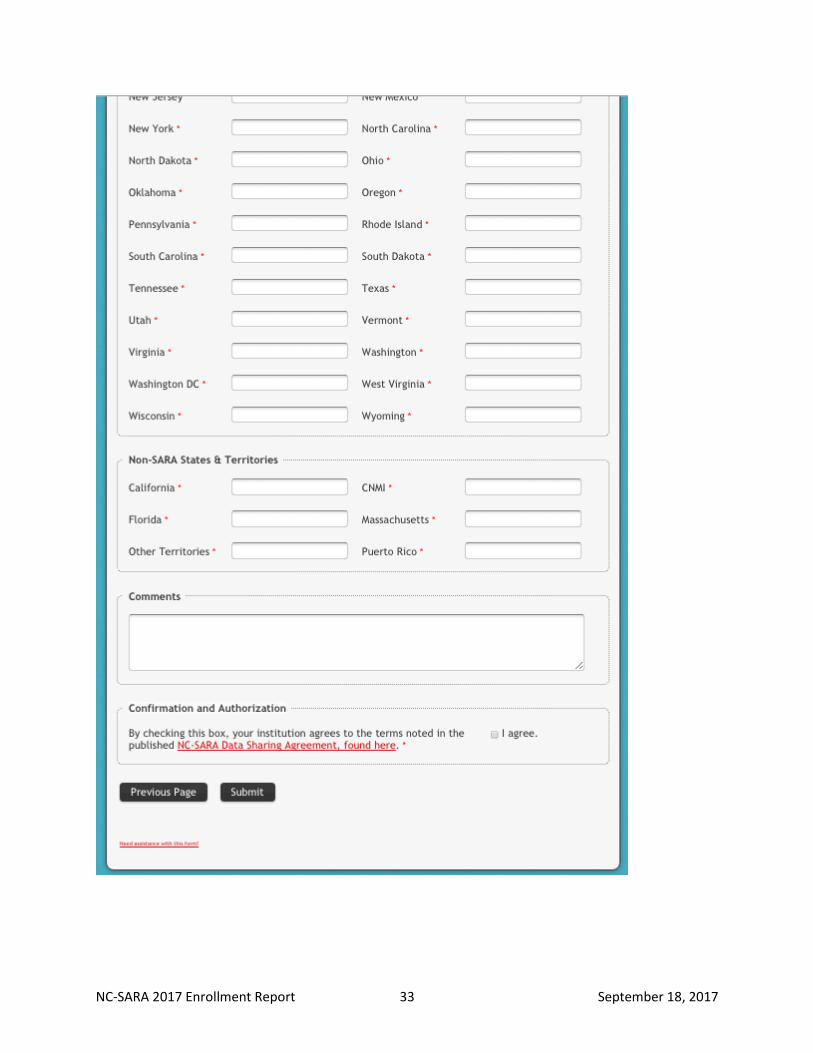
Appendix B: Instructions and Survey Below are screenshots of the instructions and the survey screens that institutions completed for the
2017 NC-SARA data collection.
NC-SARA 2017 Enrollment Report 32 September 18, 2017
NC-SARA 2017 Enrollment Report 33 September 18, 2017
NC-SARA 2017 Enrollment Report 34 September 18, 2017
Appendix C: About the Author Terri Taylor Straut, Senior Research Analyst, WICHE Cooperative for Educational Technology (WCET) and
independent consultant is an experienced researcher, project manager, and higher education
administrator. As the founding director of CU Online (for the University of Colorado) and a member of
the founding management team of the Western Governors University (WGU), Terri has been part of the
distance learning industry since its infancy in the mid-1990s. Terri has significant experience
implementing distance education projects in corporations as well as non-profit organizations. She is very
familiar with IPEDS distance education reporting through her work on the annual distance education
IPEDS reporting for WCET’s Research and Analysis unit. Terri earned her Masters of Business
Administration from Northeastern University and her Bachelor of Arts from the University of Delaware.
Appendix D: References
Allen, I.E. and Seaman, J., (2017). Digital Learning Compass: Distance Education Enrollment Report, http://digitallearningcompass.org/ Allen, I.E. and Seaman, J., (2016). Online Report Card: Tracking Online Education in the United States. http://onlinelearningsurvey.com/reports/onlinereportcard.pdf Allen, I.E. and Seaman J., (2003). Sizing the Opportunity: The Quality and Extent of Online Education in the United States, Babson Survey Research Group.
NC-SARA, About SARA (n.d.) Retrieved from NC-SARA Website. http://www.nc-sara.org/about (Retrieved July 8, 2017). NC-SARA, State Authorization Reciprocity Agreements Policy and Operations Manual (2016). Version 16.3. http://www.nc-sara.org/files/docs/NC-SARA_Manual_Final_2016.pdf Poulin R/, Straut, T. IPEDS Fall 2013: Higher Ed Sectors Vary Greatly in Distance Ed Enrollments. WCET Frontiers. March 2015. http://wcet.wiche.edu/initiatives/research/WCET-Distance-Education-Enrollment-Report-2016
Poulin, R. and Straut, T. (2016). WCET Distance Education Enrollment Report 2016. http://wcet.wiche.edu/initiatives/research/WCET-Distance-Education-Enrollment-Report-2016 U.S. Department of Education, NCES National Center for Education Statistics, IPEDS Glossary for 2016-2017 Data Collection System. https://surveys.nces.ed.gov/IPEDS/Downloads/Forms/IPEDSGlossary.pdf