Embed Size (px)
Citation preview
NBER WORKING PAPER SERIES
PRODUCT DIFFERENTIATION ANDTHE USE OF INFORMATION
TECHNOLOGY: EVIDENCE FROM THE TRUCKING INDUSTRY
Atreya ChakrabortyMark Kazarosian
Working Paper 7222http://www.nber.org/papers/w7222
NATIONAL BUREAU OF ECONOMIC RESEARCH1050 Massachusetts Avenue
Cambridge, MA 02138July 1999
Presented at the NBER Conference "The Patent System and Innovation" funded by the Alfred P. SloanFoundation via a grant to the NBER Project on Industrial Technology and Productivity. We wish to thankRichard Arnott, Kit Baum, Ernie Berndt, Ellie Berman, Russ Campbell, Don Cox, Thomas Hubbard, AdamJaffe, Bob Pritchard, Dan Stock, Dan Swaine, seminar participants at the NBER productivity workshop, andthe Federal Reserve Bank of Boston for many helpful comments. We also thank seminar participants from theNortheast Transportation Institute’s third annual conference at Atlantic City. Research assistance was providedby Andy Simms. This research was funded by the NBER. We also thank the American Trucking Associationfor providing the data, and Judy Feldmann for copy editing the paper. All opinions expressed are those of theauthors and not those of the National Bureau of Economic Research.
© 1999 by Atreya Chakraborty and Mark Kazarosian. All rights reserved. Short sections of text, not toexceed two paragraphs, may be quoted without explicit permission provided that full credit, including © notice,is given to the source.Product Differentiation and the Use of Information
Technology: New Evidence from the Trucking IndustryAtreya Chakraborty and Mark KazarosianNBER Working Paper No. 7222July 1999JEL No. D21, L21
ABSTRACT
Since the mid-1980s many authors have investigated the influence of information technology
(IT) on productivity. Until recently there has been no clear evidence that productivity increases as
a result of IT spending. This productivity paradox is partly due to the difficulty in correctly
identifying outputs, particularly in the service sector such as the trucking industry. Products are often
differentiated by quality attributes of the service provided, rather than merely the physical content of
the good delivered by motor carriers. A carrier’s primary marketing objective, e.g. on-time-
performance vs. lowest rate carrier, are precisely what differentiates a trucking firm’s service. This
paper uses cross-sectional data to show that the use of increasingly sophisticated IT by trucking firms
varies depending upon marketing objectives. Our empirical results imply that in order to measure the
impact of IT on productivity it is crucial to account for how the firm differentiates its product. We
conclude that the productivity paradox can be alleviated if measures of output incorporate firms’
marketing objectives.
Atreya Chakraborty Mark KazarosianBrandeis University Stonehill CollegeDept.of International Economics and Finance Department of EconomicsWaltham, MA 02254 249 [email protected] Easton, MA 02357
1. Introduction
Did a university's 1980 investment in new Vax computer help faculty and students be
more productive? Does investment in a satellite communications network improve the
productivity of UPS workers? The answers ten years ago to similar questions were either
"maybe," or "no," and this productivity paradox of information technology (IT) fueled a large
literature.'
Brynjolfsson and Hitt (1998) summarize the key reasons for the productivity paradox
with the following humorous passage:
Productivity is a simple concept. It is the amount of output producedper unit of input [yet productivity] is notoriously difficult tomeasure.. .In particular, there are two aspects of productivity that haveincreasingly defied precise measurement: output and input.
More recently, better data and a clearer understanding of how to measure both outputs and inputs
have begun to reveal that use of technology may in fact improve productivity. Using cross-
sectional data this paper finds that the use of increasingly sophisticated IT by trucking firms
depends on marketing objectives. Marketing objectives are defined by a firm's competitive
strategy, and these objectives are met by product differentiation. Our empirical results imply that
in order to measure output precisely, it is crucial to account for how the firm differentiates its
product.
Evidence of a connection between a firm's use of IT and its marketing objectives would
suggest that these traditionally intangible variables add a new dimension to the firm's measured
output. If this is true, then productivity studies (even at the firm level) may need to include the
firm's objectives to identify output correctly. Measured output can no longer be limited to
simply counting widgets.
Measures of productivity--defined as the effect of IT on output--must incorporate a firm's
competitive strategies. This connection of IT with competitive strategy is important for
Brynjolfsson (1993) and Wilson (1993) survey the literature that investigates the impact of information technologyon productivity.
understanding one of many reasons the productivity paradox initially existed. Suppose two
trucking firms provide the (seemingly) exact same service: the delivery of heavy machinery. Yet
one firm has on-time performance as its most important objective, while the other firm markets
itself as having the lowest freight rate. Each firm uses IT differently depending upon how each
markets its service, even though both may deliver one machine per day. If output is measured as
the number of machines delivered, the relationship between productivity and IT use will be
mismeasured. The on-time performer delivering an asphalt spreader to a construction site two
hours late can count its output as zero. The lowest-rate carrier moves that same spreader when it
is idle from one storage site to another. If that delivery is a few hours late it is still a productive
day. The on-time performer will differentiate its service--timely delivery of the spreader--by
using sophisticated IT. The lowest-rate firm has little need for the same technology. Production
studies that aggregate over all firms delivering heavy machinery will not accurately gauge the
true impact of IT.
The difficulty of measuring output in the face of accelerating use of technology is clearly
important in the modern economy, yet the existing empirical literature is in its early stages. Until
now, data sets containing both detailed output and financial characteristics, as well as particular
types of firm-specific technologies, have been hard to find. Even with the recent availability of
firm-level data explored by Brynjolfsson and Hitt (1996), and detailed truck-level data explored
by Hubbard (1998), still the issue of how to measure output precisely has not been fully
explored. We do not attempt to measure productivity in this paper, but we do uncover evidence
indicating that given the use of IT to differentiate a firm's product, marketing objectives must be
taken into account when measuring output.
2
We use a new data set that contains information about firms' objectives, detailed
technology use, and financial and operating characteristics. Our probit and ordered probit
estimations explain the use of three levels of technological sophistication. The groups of
technology that reflect intensity are intuitively straightforward. The categories are 1) no
technology, 2) two-way radios or cell phones, or pagers, and 3) automatic vehicle location
(AVL), or on-board-computers, or satellite communications.2 We test whether IT use responds to
truckers' haul characteristics differently depending upon the firm's primary marketing objective.3
The empirical models control for key variables, including complementary technologies,
operating characteristics, financial attributes, and
industry-wide organizational structure.4
Our results show that a firm's marketing objective is a key factor in detenmning the
patterns of IT use. Haul characteristics have a statistically significant influence on IT use for
firms with a primary marketing objective of on-time performance. For those firms not concerned
with on-time performance, this is not the case. We infer from these results that two firms could
be delivering the same product, yet be using different levels of technology owing to the particular
market niche they have carved. A firm's choice to use sophisticated IT depends more upon the
way a product is delivered (e.g., on-time versus lowest freight rate) rather than what product is
delivered. Moreover, the patterns of IT use that we observe suggest that the number of products
delivered is not the only component of the measured output. We take these results as evidence
2 The probit model simply collapses the first two categories of the ordered probit intoone category.The haul characteristics in our model include the time-sensitivity of the goods, and the route variability of the haul.Our models distinguish between information-gathering technologies (dependent variable) and
information-processing technologies (explanatory variable). Please see the variable descriptions and expectedcoefficients in the data section below for a detailed explanation of the distinction.
3
that output measures should incorporate the firm-specific objective that reflects the customer's
perception of a successfully delivered good.
After a summary of the related literature and a brief description of the trucking industry
in section 2, section 3 presents the empirical implementation. Section 4 describes thedata,
section 5 the results and implications and section 6 offers concluding remarks.2.
Literature Review and the Trucking Industry
Porter (1985a,b,c) lays the groundwork for understanding the complex relationship
between a firm's use of IT and the nature of that firm's output. Firms must adopt some forms of
IT just to survive in a quickly changing environment. Technology changes industry structure,
creates competitive advantage, spawns completely new businesses, and literally transforms
industries by actuating new approaches to competitive behavior. Firms are increasingly able to
customize products to serve small market niches--thus IT enhances a company's ability to
differentiate itself. Products have been reshaped by the use of IT, and the product's definition
must now include multidimensional quality characteristics such as, in the motor carrier industry,
whether the truck delivers the product on time or at the lowest freight rate.
Porter recognized early that the influence of IT on the modem economy would make it
difficult to pin down a precise definition of the firm's output. Indeed a "productivity paradox"
emerged in the 1980s literature, and this paradox in no small part reflected Porter's observations
that output, transformed by IT, would be difficult to measure for many reasons. Roach (1987)
4
and Solow (1987) first recognized this paradox--no clear evidence of productivity increases as a
result of IT spending. Their premature conclusions, summarized by Solow's statement that "we
see the computer age everywhere except in the productivity statistics," were based on early and
aggregate data. As Porter implicitly predicted, it was too early for the data to reveal the true
long-term benefits of IT--production processes don't change overnight. Also, even if the IT
benefits existed, they were washed out in the aggregate data.
The ensuing research that investigates the influence of IT on firms' performance is large,
and is reviewed by Brynjolfsson (1993) and Wilson (1993). The results from these studies are
mixed, suggesting positive, negative, and zero effects of the use of technology on productivity.
The assorted results can be only partly explained by problems stemming from the use of
aggregate data (Morrison and Berndt 1990), small sample size of firm-level data (Loveman
1994), unreliable data (Siegel and Griliches 1991), or misspecifications, such as using profits as
performance measures (Dos Santos et al. 1993). More recently, examinations of large firm-level
time-series data by Brynjolfsson and Bitt (1995, 1996), Lichtenberg (1995), and Dewan and Mm
(1997) indicate that IT might enhance productivity.
Even after careful investigation of representative microdata, a nagging question remains--
what reflects the true output of the firm? In today's highly specialized economy, particularly in
the service sector, output is certainly more than merely the number of widgets produced. Instead,
to measure output one must take into account the value provided to the customer. Brynjolfsson
and Bitt (1996) acknowledge that there is "an inherent difficulty of measuring the benefits of IT
investment." Recognizing this, they queried managers to determine their justifications for
investing in IT. The most important reasons were customer service, cost savings, timeliness, and
quality. Indeed, Brynjolfsson and Bitt (1995) suggest that future research examine subsamples
5
of IT data based on organizational form and management strategy. Our paper does precisely that
by exploring how the use of IT varies in response to the manager's perception of what is
important--such as timeliness.
A clear illustration of the difficulty in defining output as a result of IT can be found in the
motor earner industry. Trucking offers a prime test case since as in any service, several
nonphysical components compose the firm's output. Also the industry has recently become
technologically intensive, and technology use is heterogeneous.
Deregulation (1978-79) stimulated competition among previously unrelated trucking
firms. The Interstate Commerce Commission (ICC) eased its strict entry policy by granting
operating certificates at an accelerated rate. Because of this open-door policy along with more
flexible carrier rates, the industry experienced a drastic restructuring and reorganization (Zingales
1998, Hubbard 1998, Swan 1997). Truckers could now haul goods, relatively unfettered by
previously constraining regulations. The availability and proliferation of IT throughout the
trucking industry coincided with this deregulation. New and existing firms needed to carve out
niches, i.e., differentiate their products by offering services related to their "core competence" or
comparative advantage.
Zingales (1998) finds that both the fittest (economically efficient) as well as the fattest
(substantially liquid) trucking firms survived the deregulation. IT such as cellular phones and
electronic data interchange (EDI), coupled with deregulation played an important role at this time
by enabling entry into otherwise untouchable markets. Smaller (or newly entering) firms that
perhaps did not have the financial ability to buy sophisticated technology were forced to be the
fittest and specialize along a different path than the larger firms. Firms with the ability to borrow
6
more easily, or with more cash availability (the fattest), could more quickly adopt the
sophisticated and expensive technologies, such as satellite communications.
Porter's insight that IT use would make output difficult to measure is particularly
important in the trucking industry and is highlighted by the findings of Swan (1997) and
Zingales (1998). Swan shows that trucking firms that change their operating routines will
experience decreased productivity and face an increased risk of failure. Zingales investigates the
increased risk of bankruptcy in the post-deregulation trucking industry. Surviving firms were
among the fittest and the fattest and were precisely those who adjusted their operating routines to
the changing needs of the industry. The adjustment of operating routines was often associated
with the adoption of IT to gain a market niche and exploit the firm's core competence. This
dynamic market made it increasingly difficult to measure output and consequently, the
productivity resulting from IT investment.
Hubbard (1998) investigates where and why IT is valuable in the trucking industry. He
uses truck-level data to explore how the use of two types of on-board computers are influenced
by detailed carrier, shipper, and haul information. He finds that trip recorders, a technology that
enables incentive benefits, are more common on trucks operating far from home, making fewer
stops, within private fleets, and on trucks that are under longer-term use agreements. Electronic
vehicle management systems (EVMS) (associated with coordination benefits) are more common
as haul-length increases, within for-hire fleets, and on trucks that are under longer-term use
agreements.
Our investigation is similar to Hubbard (1998) in that both papers explore the
determinants of IT use. Yet we ask a different question, owing to our access to information
about the firm's marketing objectives, more detailed technology data, and the firm's financial
7
characteristics. Hubbard's finding that both incentive- and coordination-related benefits make IT
valuable complement our finding that IT use depends upon the firm's marketing objectives. For
example, the goal of being an on-time performer (a key variable in our investigation) is certainly
closely related to both incentive- and coordination-related benefits of IT. Hubbard did not
explicitly consider how his results related to productivity, yet those results support our
conclusion. The firm needs to be concerned with both incentive- and coordination-related
benefits of IT in order to meet its objective of being on time.
The Empirical Model
We observe the use of IT in discrete amounts. For example, either trucking firm uses cell
phones or it does not. Yet the need for technology in production is truly a continuous,
unobserved (latent) variable. This variable--the sophistication of IT use--is determined by a
firm's operational characteristics and marketing objectives. We model this latent variable in two
ways. The latent variable has either one observed threshold (a probit model) or two observed
thresholds (an ordered probit model). Each threshold denotes the transition from one set of
technologies to another. As the firm crosses a higher threshold, more sophisticated technologies
are used. Our goal is to identify empirically both these thresholds and the firms' characteristics
that affect the observed use of technology.
Our first specification, the probit model, captures a simplistic view of adopting IT. In
this world the firms are either high- or low-technology users. High technologies are state-of-the-
art information-gathering technologies that include satellite communications (S ATCOM), on-
board computers (OBC), or automatic vehicle location and tracking devices (AVL).5 Low
technologies are basic communication technologies that include two-way radios, cell phones, or
pagers. The low-technology group in this specification also includes firms using none of the
above communication technologies. These firms perhaps depend upon local telephone networks.
Please see the data section and the appendix below for a detailed description of technologies.
8
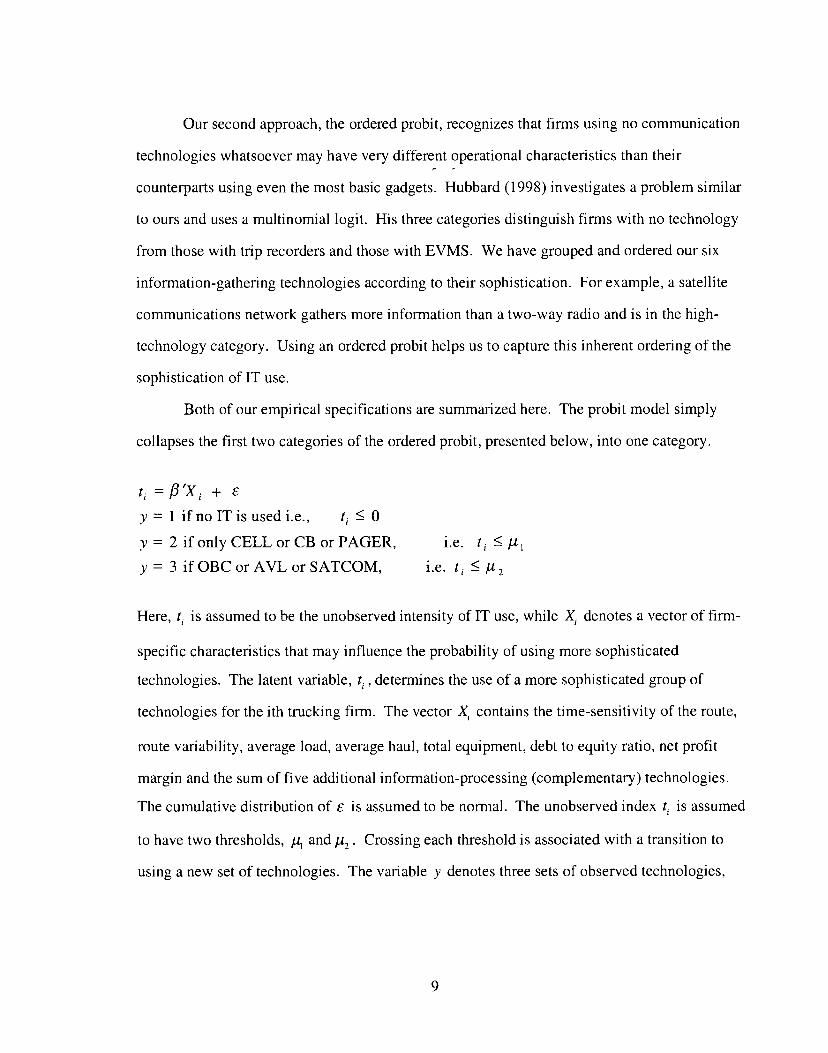
Our second approach, the ordered probit, recognizes that firms using no communication
technologies whatsoever may have very different operational characteristics than their
counterparts using even the most basic gadgets. Hubbard (1998) investigates a problem similar
to ours and uses a multinomial logit. His three categories distinguish firms with no technology
from those with trip recorders and those with EVMS. We have grouped and ordered our six
information-gathering technologies according to their sophistication. For example, a satellite
communications network gathers more information than a two-way radio and is in the high-
technology category. Using an ordered probit helps us to capture this inherent ordering of the
sophistication of IT use.
Both of our empirical specifications are summarized here. The probit model simply
collapses the first two categories of the ordered probit, presented below, into one category.
t, =13'X, + E
y 1 ifnolTisusedi.e., t � 0
y= 2ifon1yCELLorCBorPAGER, i.e. t1 �u1y = 3 ifOBCorAVLorSATCOM, i.e. t � /i2
Here, t. is assumed to be the unobserved intensity of IT use, while X1 denotes a vector of firm-
specific characteristics that may influence the probability of using more sophisticated
technologies. The latent variable, t, , determines the use of a more sophisticated group of
technologies for the ith trucking firm. The vector X contains the time-sensitivity of the route,
route variability, average load, average haul, total equipment, debt to equity ratio, net profit
margin and the sum of five additional information-processing (complementary) technologies.
The cumulative distribution of E is assumed to be normal. The unobserved index t is assumed
to have two thresholds, p and u2. Crossing each threshold is associated with a transition to
using a new set of technologies. The variable y denotes three sets of observed technologies,
9
which are grouped in order of increasing sophistication described above. Maximum likelihood
estimates of Au and $ are obtained to investigate the impact of haul characteristics on IT use.
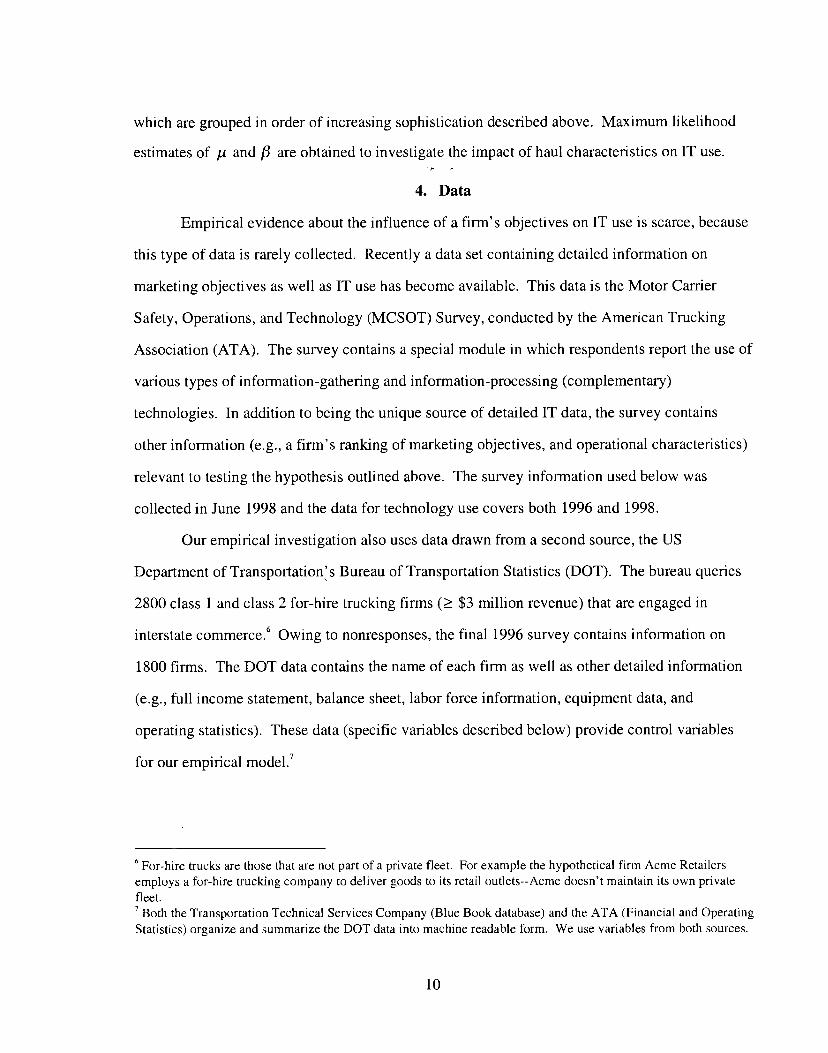
4. Data
Empirical evidence about the influence of a firm's objectives on IT use is scarce, because
this type of data is rarely collected. Recently a data set containing detailed information on
marketing objectives as well as IT use has become available. This data is the Motor Carrier
Safety, Operations, and Technology (MCSOT) Survey, conducted by the American Trucking
Association (ATA). The survey contains a special module in which respondents report the use of
various types of information-gathering and information-processing (complementary)
technologies. In addition to being the unique source of detailed IT data, the survey contains
other information (e.g., a firm's ranking of marketing objectives, and operational characteristics)
relevant to testing the hypothesis outlined above. The survey information used below was
collected in June 1998 and the data for technology use covers both 1996 and 1998.
Our empirical investigation also uses data drawn from a second source, the US
Department of Transportations Bureau of Transportation Statistics (DOT). The bureau queries
2800 class 1 and class 2 for-hire trucking firms (� $3 million revenue) that are engaged in
interstate commerce.6 Owing to nonresponses, the final 1996 survey contains information on
1800 firms. The DOT data contains the name of each firm as well as other detailed information
(e.g., full income statement, balance sheet, labor force information, equipment data, and
operating statistics). These data (specific variables described below) provide control variables
for our empirical model.7
6 For-hire trucks are those that are not part of a private fleet. For example the hypothetical firm Acme Retailersemploys a for-hire trucking company to deliver goods to its retail outlets--Acme doesn't maintain its own privatefleet.Both the Transportation Technical Services Company (Blue Book database) and the ATA (Financial and Operating
Statistics) organize and summarize the DOT data into machine readable form. We use variables from both sources.
10
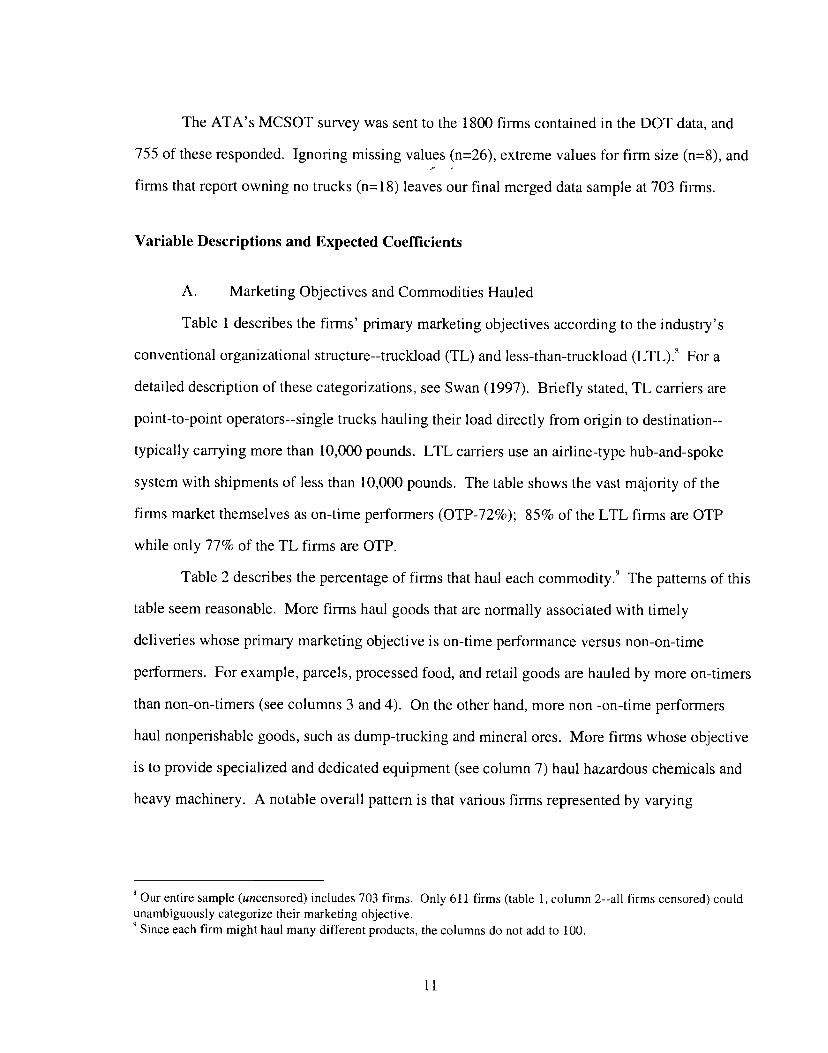
The ATA's MCSOT survey was sent to the 1800 firms contained in the DOT data, and
755 of these responded. Ignoring missing values (n=26), extreme values for firm size (n=8), and
firms that report owning no trucks (n=18) leaves our final merged data sample at 703 firms.
Variable Descriptions and Expected Coefficients
A. Marketing Objectives and Commodities Hauled
Table 1 describes the firms' primary marketing objectives according to the industry's
conventional organizational structure--truckload (TL) and less-than-truckload (LTL).8 For a
detailed description of these categorizations, see Swan (1997). Briefly stated, TL carriers are
point-to-point operators--single trucks hauling their load directly from origin to destination--
typically carrying more than 10,000 pounds. LTL carriers use an airline-type hub-and-spoke
system with shipments of less than 10,000 pounds. The table shows the vast majority of the
firms market themselves as on-time performers (OTP-72%); 85% of the LTL firms are OTP
while only 77% of the TL firms are OTP.
Table 2 describes the percentage of firms that haul each commodity.9 The patterns of this
table seem reasonable. More firms haul goods that are normally associated with timely
deliveries whose primary marketing objective is on-time performance versus non-on-time
performers. For example, parcels, processed food, and retail goods are hauled by more on-timers
than non-on-timers (see columns 3 and 4). On the other hand, more non -on-time performers
haul nonperishable goods, such as dump-trucking and mineral ores. More firms whose objective
is to provide specialized and dedicated equipment (see column 7) haul hazardous chemicals and
heavy machinery. A notable overall pattern is that various firms represented by varying
8 Our entire sample (uncensored) includes 703 firms. Only 611 firms (table 1, column 2--all firms censored) couldunambiguously categorize their marketing objective.Since each firm might haul many different products, the columns do not add to 100.
11
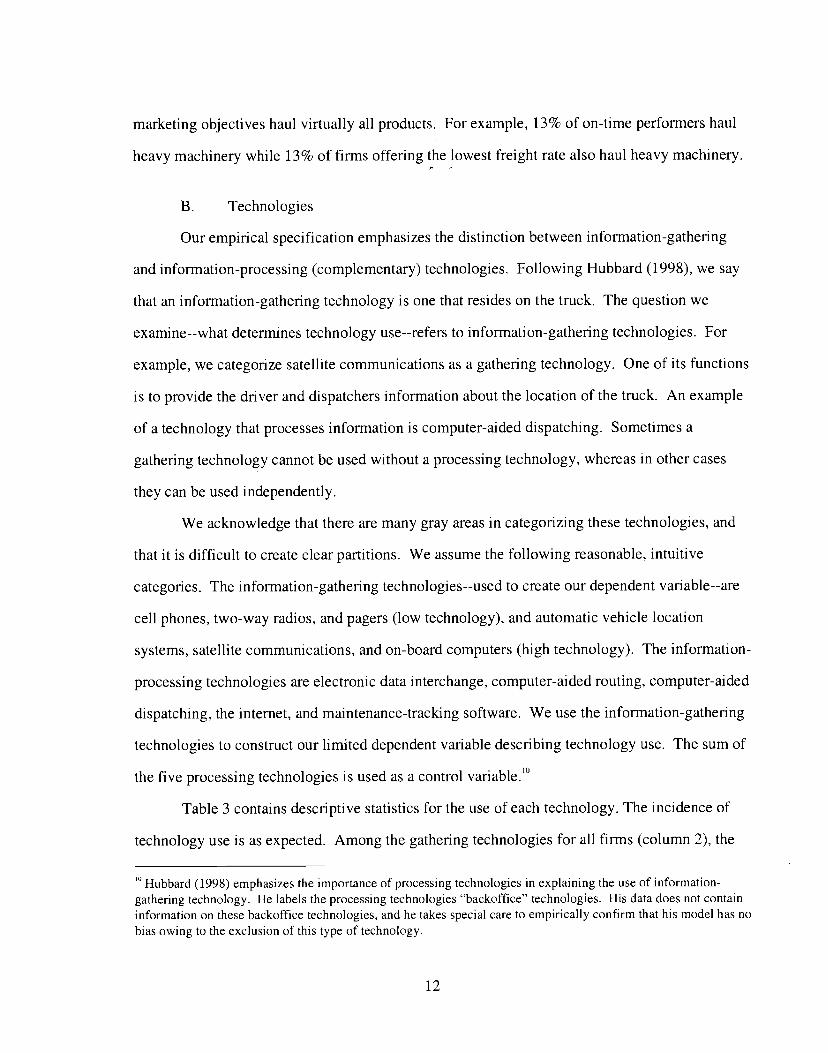
marketing objectives haul virtually all products. For example, 13% of on-time performers haul
heavy machinery while 13% of firms offering the lowest freight rate also haul heavy machinery.
B. Technologies
Our empirical specification emphasizes the distinction between information-gathering
and information-processing (complementary) technologies. Following Hubbard (1998), we say
that an information-gathering technology is one that resides on the truck. The question we
examine--what determines technology use--refers to information-gathering technologies. For
example, we categorize satellite communications as a gathering technology. One of its functions
is to provide the driver and dispatchers information about the location of the truck. An example
of a technology that processes information is computer-aided dispatching. Sometimes a
gathering technology cannot be used without a processing technology, whereas in other cases
they can be used independently.
We acknowledge that there are many gray areas in categorizing these technologies, and
that it is difficult to create clear partitions. We assume the following reasonable, intuitive
categories. The information-gathering technologies--used to create our dependent variable--are
cell phones, two-way radios, and pagers (low technology), and automatic vehicle location
systems, satellite communications, and on-board computers (high technology). The information-
processing technologies are electronic data interchange, computer-aided routing, computer-aided
dispatching, the internet, and maintenance-tracking software. We use the information-gathering
technologies to construct our limited dependent variable describing technology use. The sum of
the five processing technologies is used as a control variable.10
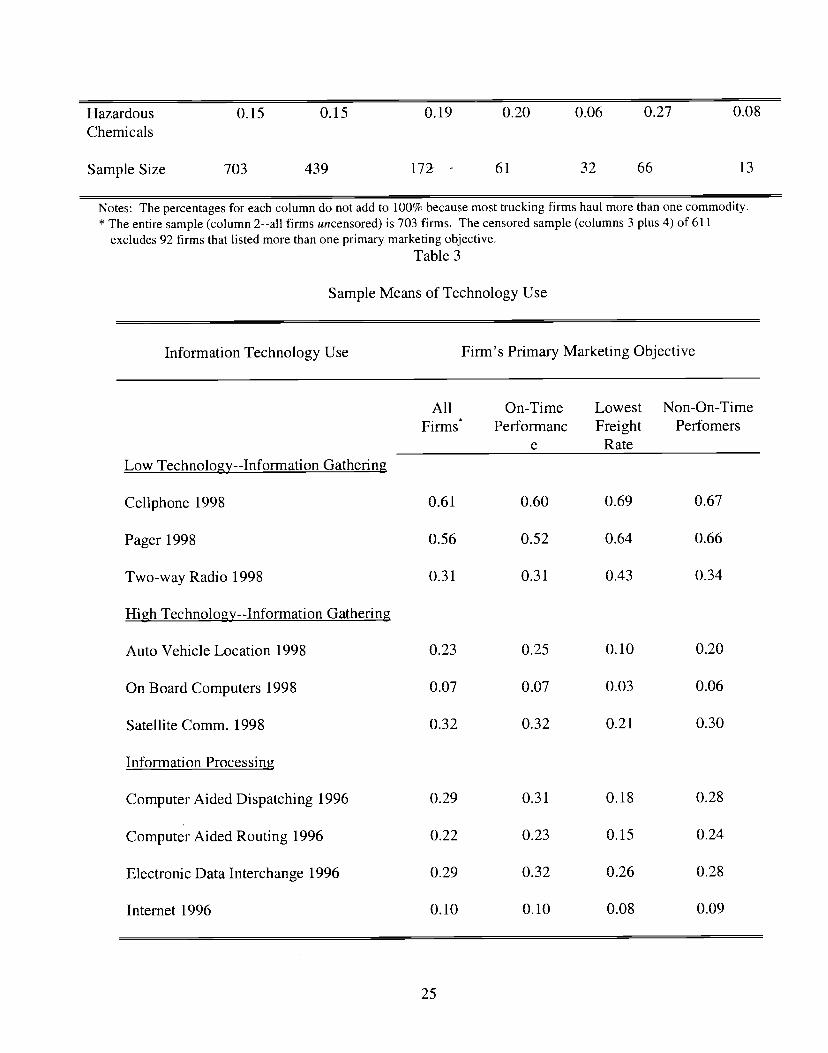
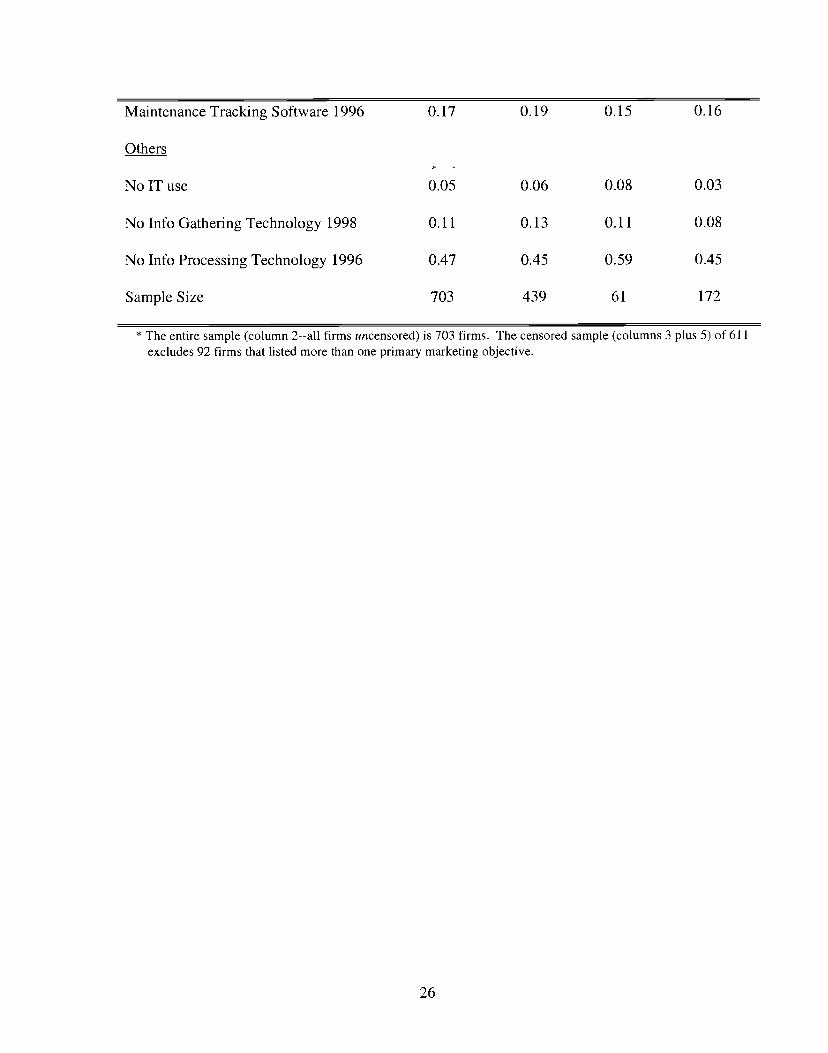
Table 3 contains descriptive statistics for the use of each technology. The incidence of
technology use is as expected. Among the gathering technologies for all firms (column 2), the
Hubbard (1998) emphasizes the importance of processing technologies in explaining the use of information-gathering technology. He labels the processing technologies "backoffice" technologies. His data does not containinformation on these backoffice technologies, and he takes special care to empirically confirm that his model has nobias owing to the exclusion of this type of technology.
12
low technologies--celiphones and pagers--are used by the largest percentage of the firms, 61%
and 56% respectively. Fewer firms (automatic vehicle location systems (23%), satellite
communications (32%), and on-board computers (7%) use the more sophisticated and more
expensive gathering technologies (high technologies). Two-way radios are both low technology
and inexpensive, yet are used by a relatively small percentage of firms (31%). Perhaps the
usefulness of two-way radios in improving productivity has been overshadowed by cell phones
and pagers. Finally, it seems reasonable that very few firms (5%) use no technology at all.
Reasonable patterns of technology use emerge by comparing on-time performers (OTPs,
column 3) with firms offering the lowest freight rate (LFR--column 4), and with all firms that are
non-OTP. The sophisticated technologies (e.g., automatic vehicle location systems) are used by
more OTP firms (compared to LFR or non-OTP) whereas the low technologies (e.g., cellphones)
are used by more LFR and non-OTP firms (than by OTP firms.) The OTP firms also use more
information-processing technologies (e.g., computer aided routing and dispatching) than their
LFR counterparts. It seems that the OTP firms use the higher technologies to meet their
marketing objective, even though these technologies are generally more expensive.
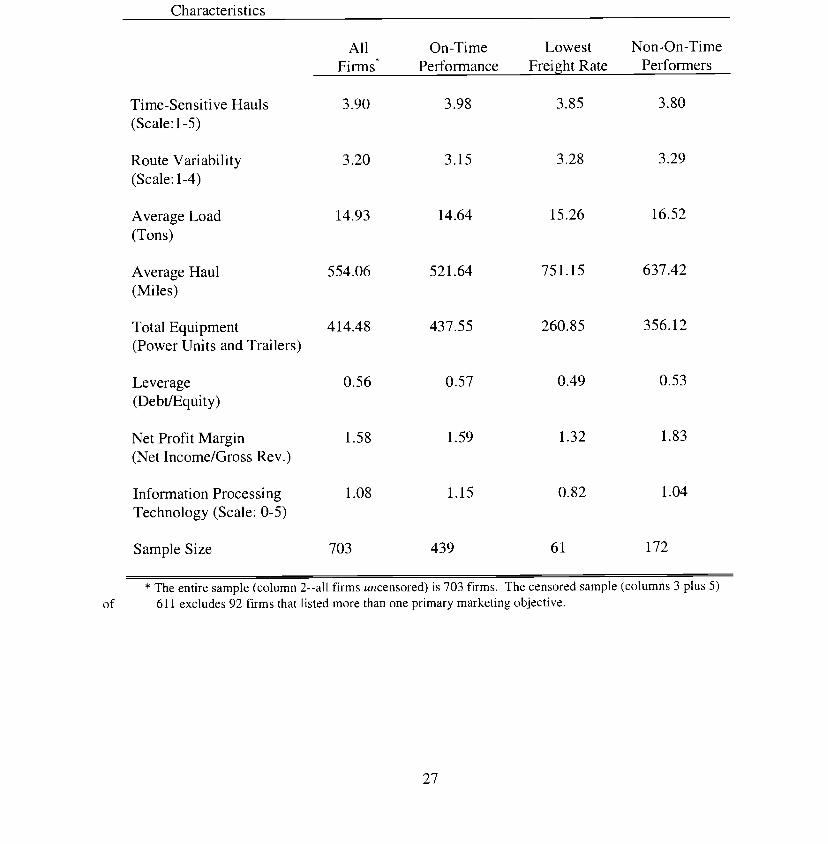
C. Explanatory Variables
The empirical model described above contains a vector of control variables X1 that are
assumed to influence the probability of using more highly sophisticated information-gathering
technologies. Table 4 contains sample means of these variables.
One of our two key explanatory variables describes the percentage of the firm's
dispatches that are time-sensitive or perishable (row 1). The variable ranges from 1 to 5, 1
indicating that none of the dispatches is time-sensitive, 2 indicating that 1-25% are time-
sensitive, etc. The 3.9 average for time-sensitivity in table 4 indicates that for the average firm,
between 26 and 50% of their dispatches are time-sensitive. As expected those who market
themselves as on-time performers haul more time-sensitive goods than do non-on-timers. We
13
expect that the probability of using more sophisticated technology will increase as the proportion
of time-sensitive hauls increases if the firm markets itself as an on-time performer.
Our second key explanatory variable describes the variability of the company's routes
(row 2). It ranges from 1 to 4, 1 indicating not at all variable, and 4--indicating extremely
variable. The probability of using sophisticated technology should rise as the route variability
rises, only with firms for which the variability of the route may preclude them from obtaining
their objective. For example, an on-time performer that hauls mostly within the hub-and-spoke
system (LTL hauler) should be expected to use more sophisticated technology in response to an
increase in route variability. In contrast, a point-to-point hauler (TL hauler) is not expected to
use high technology gadgets in response to more variable routes. Their objectives are different.
The incentive to use information-gathering technology should, then, be clearly related to how the
production activity is organized.
Both time-sensitivity and route-variability are firm-specific haul characteristics. We
expect that these characteristics will influence the use of IT differently, depending upon how
firms market themselves to their customers. Our data include a variable that ranks each firm's
marketing objectives among five items--providing the lowest freight rates, on-time performance,
short turn-around, safety of performance, and availability of specialized equipment. We assume
that if a firm ranks on-time performance as its most important marketing objective, then being on
time is a key component of that firm's output. With this in mind, we run separate regressions on
firms with different marketing objectives.
Grimm et al. (1989), McMullen (1987), and McMullen and Tanaka (1995) explain costs
in the motor carrier industry and include output attributes as explanatory variables to help capture
the heterogeneity of output. Our investigation of IT use has the same concern--to reduce
heterogeneity in our sample as much as possible--so that the impact of marketing objectives can
be more clearly examined. The output attributes we include to reduce heterogeneity are the
average load and the average haul. The average load indicates the number of tons transported by
14
each unit dispatched. The average haul length measures how far the average unit travels each
time it is dispatched.
A low average load indicates that the trucks operate more frequently, reflecting higher
quality service. Trucks with lighter loads are more often LTL carriers where operating costs are
typically higher for many reasons. Coupled with the need for more advanced hub-and-spoke
infrastructure, an LTL carrier should find more sophisticated technology useful for coordination
purposes (Hubbard 1998). We expect that trucks with a smaller average load will use more
sophisticated technology--a negative coefficient on average load.
A longer average haul length indicates the need for more sophisticated technology such
as satellite communications and automatic vehicle location systems. The further the truck is
from home, the less cost-effective is a cell phone or a pager. We expect a positive coefficient on
average haul. Columns 3 and 4 in Table 4 reveal that on-time performers have a lower average
load and a lower average haul than their counterparts that offer the lowest freight rate. This
makes sense, since absent the need to be on time, firms offering the lowest freight rate
concentrate on reducing average costs by making sure their trucks are fuller (higher average load)
and travel longer distances (higher average haul).
Total equipment is defined as the number of trucks plus tractors plus trailers. This
variable controls for the size of the firm's operation. On-time performers operate more units than
LFR firms (Table 4). Firms offering the lowest freight rate as their specialty don't need the
larger fleets to ensure on-time delivery. We also include the net profit margin (net income as a
percent of gross revenue) as a control variable to ensure that our results are not driven by the
firm's financial well-being.
Zingales (1998) explains the survival of post-deregulation trucking firms with the level of
pre-deregulation leverage. He finds that highly leveraged firms are less likely to survive. We
include the debt-to-equity ratio to control for the firm's leverage and are uncertain about this
variable's coefficient. More highly leveraged firms may be indicative of the ability to borrow to
15
acquire sophisticated IT, but it may also indicate that the firm has already exhausted its
borrowing capacity. If the firm is unable to borrow it is less capable of adopting sophisticated
technology.
5. Results
Main Findings
Our estimation strategy investigates the impact of haul characteristics on the use of
information technology. The question to be examined is: Does the impact of haul characteristics
on IT use vary depending upon the firm's marketing strategy? If the answer is yes, then two
firms may seem to offer identical services yet in fact offer different services as a result of
disparate marketing strategies and varying IT usage. Outputs might then be grouped incorrectly
in productivity studies, and the impact of IT on productivity may be mismeasured.
We investigate the variation in IT use with two separate specifications. In the first
specification, we categorize information-gathering technologies used on the truck as either high-
tech or low-tech. These two groups serve to define our dependent variable for probit estimates
(table 5). In our second specification we create three groups of IT use, in order of increasing
sophistication. These ordered probit estimates are presented in tables 6 and 7. A list of variable
means for all explanatory variables is presented in table 4. Table 5, specification 1 predicts the
use of IT for the entire sample (n=703). Specifications 2 and 3 partition the sample according to
whether or not the firm's primary marketing objective is to be an on-time performer."
The evidence indicates that a firm's use of increasingly sophisticated IT varies
considerably depending upon its marketing strategy. For those firms that market themselves as
on-time performers (table 5, specification 2), the estimated probit coefficients for both the
proportion of time-sensitive hauls and for the firm's route variability are positive and significant
at the five-percent level. For firms with marketing objectives other than on-time performance,
' The number of observations for on-timers (439) plus non-on-timers (172) does not sum to 703 because wedropped 92 firms that reported more than one primary marketing objective.
16
the coefficients for those same key haul characteristics are statistically insignificant (specification
3).
For on-time performers (specification 2) at sample means, a 25% rise in the number of
time-sensitive hauls increases the probability of using sophisticated IT by 5%. For non- on-time
performers, the same 25% rise in time-sensitive hauls has a statistically insignificant impact on
technology use. The impact of time-sensitive hauls on technology use is 50% higher for on-
timers compared to the entire sample.
The impact of route variability on the use of information-gathering technology follows
the same pattern as the impact of time-sensitive hauls. On-time performers use more
sophisticated technology as routes become more variable, while for non-on-timers route
variability has no impact. For on-time performers, a 25% rise in route variability increases the
probability of using sophisticated technology by 7%. The impact of route variability on
technology use is 100% higher for on-timers compared to the entire sample.
The sharp difference between the estimates for on-timers versus non-on-timers supports
the hypothesis that a firm's measured output must incorporate information about service-oriented
firm-specific goals. Productivity studies that aggregate over all firms producing the same
physical good are likely to misrepresent the true output of the firm. Firms with different
customer-oriented goals (e.g., on-time performers vs. non-on-time performers) use different
technologies in response to variations in the same haul characteristics. The services, and
therefore the output, that the on-time performer produces are clearly different.
The remaining estimates in table 5 for on-timers (specification 2) accord with several of
our predictions outlined in the data section above. A notable (overall) result is that the combined
explanatory variables perform better at explaining technology use within a particular marketing
objective (on-timers) than for the sample that includes all other marketing objectives combined
(non-on-timers).
17
To reduce sample heterogeneity we included average load and average haul as output
attributes. Trucks with a smaller average load use more sophisticated IT, possibly owing to the
need for more coordination. The significantly positive impact of average haul indicates that
trucks traveling longer distances are more likely to use sophisticated IT.
The total equipment coefficient suggests that larger operations find the more
sophisticated technologies useful, perhaps again for coordination purposes. Yet the insignificant
coefficient on net profit margin raises doubts about firms buying IT simply because they have the
cash.
Firms use significantly higher levels of information technology as they become more
leveraged. It may be that they are borrowing to acquire some of the more expensive technologies
such as satellite communications. Finally, it makes sense that firms with more highly
sophisticated gathering technologies will be more likely to have more processing
(complementary) technologies.
Additional Findings
We address possible objections to our above specification by splitting our sample in a
more traditional manner (TL and LTL), and by using an alternate (ordered) categorization of the
technologies contained in the dependent variable. Our additional findings indicate that our main
results are robust.
One alternative for creating our dependent variable is to use a categorization of
technologies that reflects an order of sophistication that includes no technologies, some low-level
gadgets, and highly sophisticated gadgets. Grouping together firms that use no technologies with
those using low-level yet highly effective technologies such as cell phones may raise questions
regarding the validity of our result. To address this potential concern we re-estimate the table 5
18
specifications using the ordered probit model described in the empirical specification section
above. Our results, presented in table 6, still indicate that firms choose more sophisticated
technologies differently depending upon their marketing objective.
Second, our results may be questioned since we neglect to control for the highly
heterogeneous organizational structure in the motor carrier industry. As mentioned earlier, TL
and LTL carriers operate differently along many dimensions. We partition our sample along the
TLILTL lines, yet we find that this categorization is not the main concern when estimating IT
use. Specifications 1 and 2 in Table 7 indicate that for all firms neither time-sensitivity nor route
variability has a statistically significant impact on technology use. This split does little to resolve
the problem that occurs owing to aggregating over heterogeneous competitive strategies.'2
Specifications 3, 4, and 5 in table 7 support our previous conclusion: the important
categorization in explaining variation in IT use is the firm's primary objective for quality customer
service. There is a notable difference in results between TL and LTL firms for on-timers.
Specification 4 (LTL firms only) reveals that route variability has a significantly positive influence
on IT adoption. This statistically significant effect is not present for only TL firms (specification 3).
For on-timers, the time-sensitivity of hauls has a statistically significant positive impact on
technology use. This result holds for both TL and LTL firms (specifications 3 and 4). For TL firms
that are not concerned with on-time performance (specification 5), these haul characteristics have no
impact.'3 A notable difference in results between TL and LTL firms for on-timers is that the route-
variability coefficient is much larger for the LTL firms. Firms in both categories may have
12 In table 7, all firms (columns 2 plus 3--325 firms) excludes specialized carriers. The censored sample (columns 4through 6--283 firms) also excludes firms that listed more than one primary marketing objective.'We cannot compare LTL on-time performers with LTL non on-time performers since the sample size for LTL nonon-timers is only 8.
19
6. Conclusion
The estimates presented above indicate that marketing objectives are a pivotal factor in
determining the use of information technology. We find that sophisticated IT is used differently
by firms with similar haul characteristics yet different marketing strategies. Firms that market
themselves as on-time performers use IT differently than do firms that have other marketing
criteria. This finding is important because marketing strategies can add distinct quality
dimensions to a good or service. Previous research has found that a primary reason for the
productivity paradox is the incorrect measuring of outputs. Our results indicate that output
cannot be measured correctly until the impact of marketing objectives--the quality dimension of
the good--is recognized. Even in firm-level productivity studies, precise measurement of the
influence of IT on productivity should control for the quality dimension of the good. One way to
accomplish this might be to group firms producing similar goods and services according to their
primary marketing objectives.
20
REFERENCES
Brynjolfsson, Erik. "The Productivity Paradox of Information Technology." Communications ofthe ACM 35 (December 1993): 66-77. -
Brynjolfsson, Erik, and Lorin Hitt. "Beyond the Productivity Paradox." Communication of theACM 41, no.8 (1998): 49-55.
______• "Paradox Lost? Firm-Level Evidence on the Returns to Information Systems Spending."Management Science 42, no.4 (1996): 541-558.
______• "Information Technology as a Factor of Production: The Role of Differences amongFirms." Economic Innovation and New Technology 3 (1995): 183-199.
Dewan, Sanjeev, and Chung-ki Mm. "The Substitution of Information Technology for OtherFactors of Production: A Firm Level Analysis." Management Science 43, no.2 (1997):1660- 1675.
Dos Santos, B.L., K.G. Peffers, and D.C. Mauer. "The Impact of Information TechnologyInvestment Announcements on the Market Value of the Firm," Information SystemsRes.,4,1 (1993): 1-23.
Grimm, C.M., T.M. Corsi, and J.L. Jarrell. "U.S. Motor Carrier Cost Structure UnderDeregulation," Logistics and Transportation Review, 25, no. 3 (Fall 1989): 23 1-249.
Hubbard, Thomas. "Why Are Monitoring Technologies Valuable? The Use of On-BoardInformation Technology in the Trucking Industry." UCLA and NBER, Mimeo (August 4,1998).
Lichtenberg, R. "The Output Contributions of Computer Equipment and Personnel: A Firm-Level Analysis." Economics of Innovation and New Technology 3, 3-4 (May 1995): 201-217.
Loveman, G.W. "An Assessment of the Productivity Impact on Information Technologies," inT.J. Allen and M.S. Scott Morton (Eds.), Information Technology and the Corporation ofthe 1990s: Research Studies, MIT Press, Cambridge, MA (1994).
McMullen, B. Stan. "The Impact of Regulatory Reform on US Motor Carrier Costs." Journal ofTransport Economics and Policy September (1987): 307-3 18.
McMullen, B. Stan, and Hiroshi Tanaka. "An Econometric Analysis of Differences BetweenMotor Carriers: Implications for Market Structure." Quarterly Journal of Business andEconomics 34, no.4 (1995): 16-29.
21
Morrison, C.J., and E,R. Berndt. "Assessing the Productivity of Information TechnologyEquipment in the US Manufacturing Industries." NBER Working Paper 3582.January (1990).
Porter, Michael E. "Technology and Competitive Advantage." Journal of Business Strategy 5(1985a): 60-68.
Porter, Michael E. Competitive Advantage. Creating and Sustaining Superior Performance, TheFree Press (1985b),
Porter, Michael E. and Victor E. Millar. "How Information Gives You a CompetitiveAdvantage." Harvard Business Review, July-August (1985c): 149-160.
Roach, S.S. "America's Technology Dilemma: A Profile of the Information Economy," MorganStanley Special Economic Study (April 1987).
Siegel, D. and Z. Griliches. "Purchased Services, Outsourcing, Computers, and Productivity inManufacturing," NBER Working Paper 3678 (April 1991).
Solow, Robert, New York Times Book Review (July 12, 1987).
Swan, P.F. "The Effect of Changes in Operations on Less-Than-Truckload Motor CarrierProductivity and Survival," Ph.D. Dissertation, The University of Michigan, 1997.
Wilson, D. "Assessing the Impact of Information Technology on Organizational Performance,"in R. Barker, R. Kauffman, and M.A. Mahmood (Eds.), Strategic Information TechnologyManagement. Idea Group, Harrisburg, PA, 1993.
Zingales, Luigi. "Survival of the Fittest or the Fattest? Exit and Financing in the TruckingIndustry." The Journal of Finance 3, no.3 (1998): 905-938.
22

</ref_section>
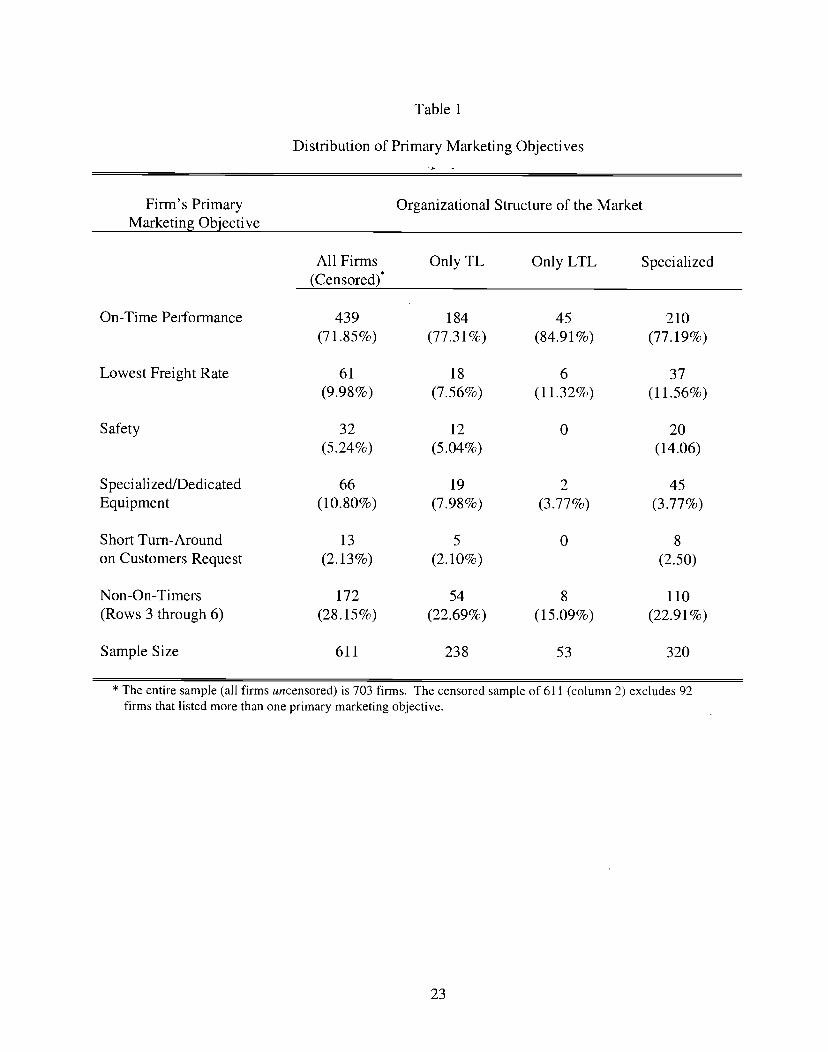
Table 1
Distribution of Primary Marketing Objectives
Firm's PrimaryMarketing Objective
Organizational Structure of the Market
On-Time Performance
All Firms(Censored)'
Only TL Only LTL Specialized
439(7 1.85%)
184
(77.3 1%)45
(84.9 1%)
210(77.19%)
Lowest Freight Rate 61
(9.98%)18
(7.56%)6
(11.32%)37
(11.56%)
Safety 32(5.24%)
12
(5.04%)0 20
(14.06)
SpecializedfDedicatedEquipment
66(10.80%)
19
(7.98%)2
(3.77%)45
(3.77%)
Short Turn-Aroundon Customers Request
13
(2.13%)5
(2.10%)0 8
(2.50)
Non-On-Timers(Rows 3 through 6)
172(28.15%)
54
(22.69%)8
(15.09%)110
(22.91%)
Sample Size 611 238 53 320
* The entire sample (all firms uncensored) is 703 firms. The censored sample of 611 (column 2) excludes 92firms that listed more than one primary marketing objective.
23
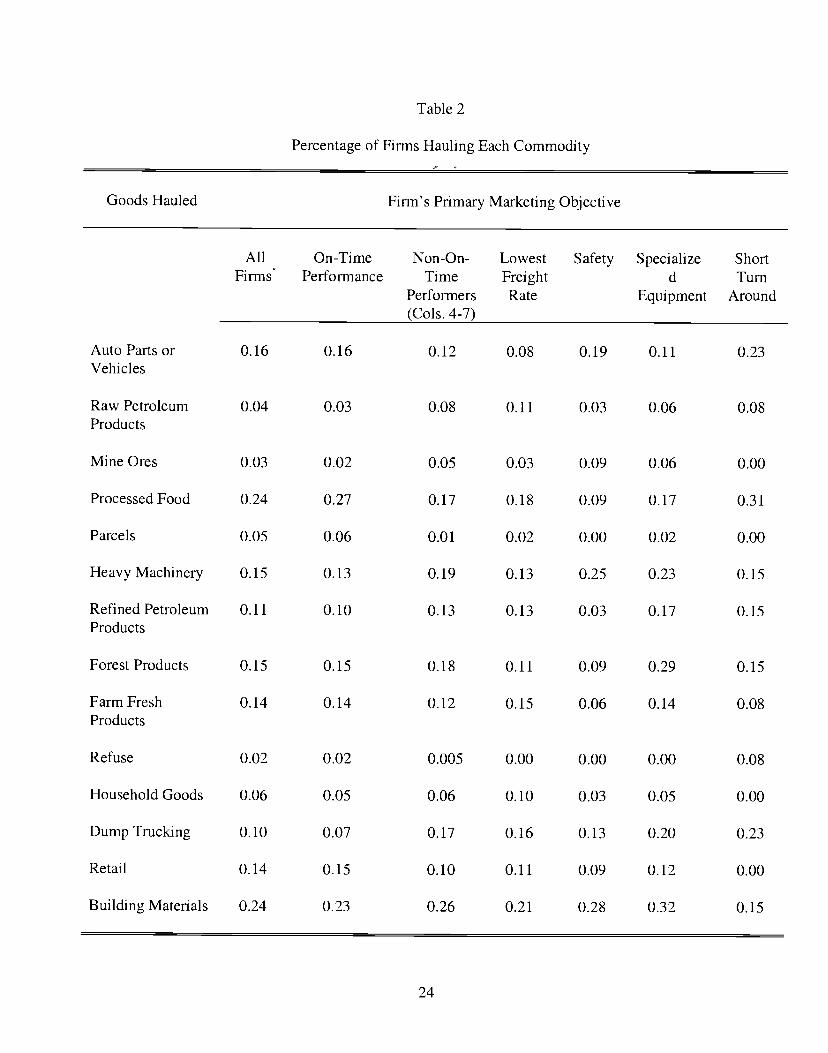
Table 2
Percentage of Firms Hauling Each Commodity
Goods Hauled Finn's Primary Marketing Objective
All On-Time Non-On- Lowest Safety Specialize ShortFirms Performance Time Freight d Turn
Performers Rate Equipment Around(Cols. 4-7)
Auto Parts or 0.16 0.16 0.12 0.08 0.19 0.11 0.23Vehicles
Raw Petroleum 0.04 0.03 0.08 0.11 0.03 0.06 0.08Products
Mine Ores 0.03 0.02 0.05 0.03 0.09 0.06 0.00
Processed Food 0.24 0.27 0.17 0.18 0.09 0.17 0.31
Parcels 0.05 0.06 0.01 0.02 0.00 0.02 0.00
Heavy Machinery 0.15 0.13 0.19 0.13 0.25 0.23 0.15
Refined Petroleum 0.11 0.10 0.13 0.13 0.03 0.17 0.15Products
Forest Products 0.15 0.15 0.18 0.11 0.09 0.29 0.15
Farm Fresh 0.14 0.14 0.12 0.15 0.06 0.14 0.08Products
Refuse 0.02 0.02 0.005 0.00 0.00 0.00 0.08
Household Goods 0.06 0.05 0.06 0.10 0.03 0.05 0.00
Dump Trucking 0.10 0.07 0.17 0.16 0.13 0.20 0.23
Retail 0.14 0.15 0.10 0.11 0.09 0.12 0.00
Building Materials 0.24 0.23 0.26 0.21 0.28 0.32 0.15
24
0.06 0.27 0.08Hazardous 0.20Chemicals
Sample Size
Notes: The percentages for each column do not add to 100% because most trucking firms haul more than one commodity.* The entire sample (column 2--all firms uncensored) is 703 firms. The censored sample (columns 3 plus 4) of 611
excludes 92 firms that listed more than one primary marketing objective.Table 3
0.15 0.15 0.19
703 439 172 - 61 32 66 13
Sample Means of Technology Use
Information Technology Use Firm's Primary Marketing Objective
All On-Time Lowest Non-On-TimeFirms Performanc Freight Perfomers
e Rate
Low Technology--Information Gathering
0.61 0.60 0.69 0.67Celiphone 1998
Pager 1998 0.56 0.52 0.64 0.66
Two-way Radio 1998 0.31 0.31 0.43 0.34
High Technology--Information Gathering
0.23 0.25 0.10 0.20Auto Vehicle Location 1998
On Board Computers 1998 0.07 0.07 0.03 0.06
Satellite Comm. 1998 0.32 0.32 0.21 0.30
Information Processing
Computer Aided Dispatching 1996 0.29 0.31 0.18 0.28
Computer Aided Routing 1996 0.22 0.23 0.15 0.24
Electronic Data Interchange 1996 0.29 0.32 0.26 0.28
Internet 1996 0.10 0.10 0.08 0.09
25
Maintenance Tracking Software 1996 0.17 0.19 0.15 0.16
Others
No IT use 0.05 0.06 0.08 0.03
No Info Gathering Technology 1998 0.11 0.13 0.11 0.08
No Info Processing Technology 1996 0.47 0.45 0.59 0.45
Sample Size 703 439 61 172
* The entire sample (column 2--all firms uncensored) is 703 firms. The censored sample (columns 3 plus 5)of 611excludes 92 firms that listed more than one primary marketing objective.
26
Characteristics
All On-Time Lowest Non-On-TimeFirms* Performance Freight Rate Performers
Time-Sensitive Hauls 3.90 3.98 3.85 3.80
(Scale: 1-5)
Route Variability 3.20 3.15 3.28 3.29
(Scale: 1-4)
Average Load 14.93 14.64 15.26 16.52
(Tons)
Average Haul 554.06 521.64 751.15 637.42
(Miles)
Total Equipment 414.48 437.55 260.85 356.12(Power Units and Trailers)
Leverage 0.56 0.57 0.49 0.53
(Debt/Equity)
Net Profit Margin 1.58 1.59 1.32 1.83
(Net Income/Gross Rev.)
Information Processing 1.08 1.15 0.82 1.04
Technology (Scale: 0-5)
Sample Size 703 439 61 172
* The entire sample (column 2--all firms uncensored) is 703 firms. The censored sample (columns 3 plus 5)of 611 excludes 92 firms that listed more than one primary marketing objective.
27
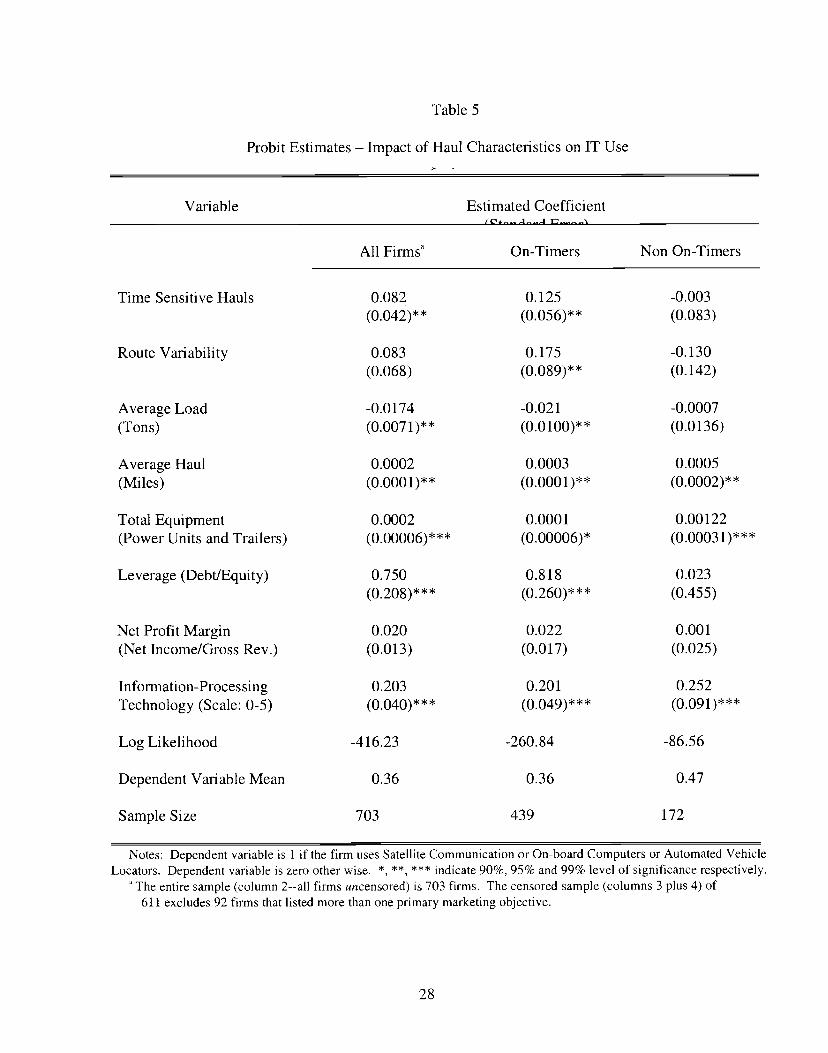
Table 5
Probit Estimates — Impact of Haul Characteristics on IT Use
Variable Estimated Coefficient/-.... .-1.._..-i r.._.\
All Firms'1 On-Timers Non On-Timers
Time Sensitive Hauls 0.082 0.125 -0.003(0.042)** (0.056)** (0.083)
Route Variability 0.083 0.175 -0.130(0.068) (0.089)** (0.142)
Average Load -0.0174 -0.021 -0.0007
(Tons) (0.007 1)** (0.0 100)** (0.0 136)
Average Haul 0.0002 0.0003 0.0005(Miles) (0.0001 )* * (0.0001 )** (0.0002)* *
Total Equipment 0.0002 0.0001 0.00122(Power Units and Trailers) (0.00006)* ** (0 .00006)* (0.00031) ** *
Leverage (Debt/Equity) 0.750 0.818 0.023
(0.208)*** (0.260)*** (0.455)
Net Profit Margin 0.020 0.022 0.00 1
(Net Income/Gross Rev.) (0.0 13) (0.017) (0.025)
Information-Processing 0.203 0.201 0.252
Technology (Scale: 0-5) (0.040)*** (0.049)*** (0.091)***
Log Likelihood -416.23 -260.84 -86.56
Dependent Variable Mean 0,36 0.36 0.47
Sample Size 703 439 172
Notes: Dependent variable is 1 if the firm uses Satellite Communication or On-board Computers or Automated VehicleLocators. Dependent variable is zero other wise. , , *** indicate 90%, 95% and 99% level of significance respectively.
The entire sample (column 2--all firms uncensored) is 703 firms. The censored sample (columns 3 plus 4) of611 excludes 92 firms that listed more than one primary marketing objective.
28
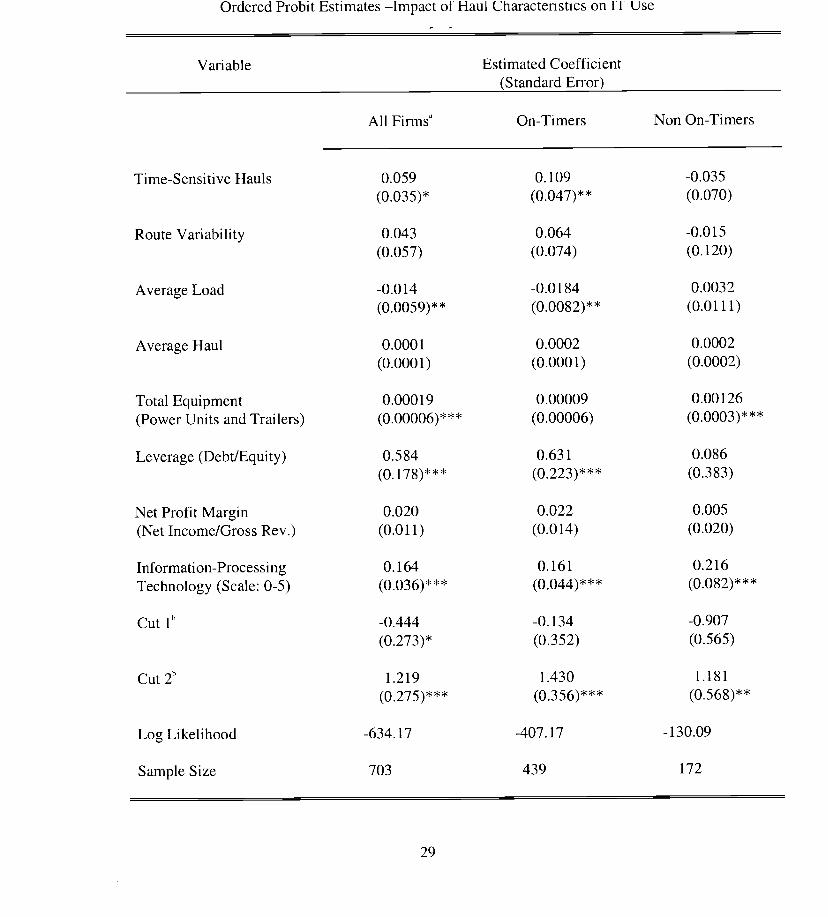
Ordered Probit Estimates —Impact of Haul Characteristics on 11 Use
Variable Estimated Coefficient(Standard Error)
All Firms On-Timers Non On-Timers
Time-Sensitive Hauls 0.059 0.109 -0.035
(0.035)* (0.047)** (0.070)
Route Variability 0.043 0.064 -0.015
(0.057) (0.074) (0.120)
Average Load -0.014 -0.0184 0.0032
(O.0059)** (0.0082)** (0.0111)
Average Haul 0.000 1 0.0002 0.0002
(0.0001) (0.0001) (0.0002)
Total Equipment 0.000 19 0.00009 0.00 126
(Power Units and Trailers) (0.00006)*** (0.00006) (0.0003)***
Leverage (Debt/Equity) 0.584 0.63 1 0.086
(0.178)*** (0.223)*** (0.383)
Net Profit Margin 0.020 0.022 0.005
(Net Income/Gross Rev.) (0.011) (0.0 14) (0.020)
Information-Processing 0.164 0.161 0.216
Technology (Scale: 0-5) (0.036)*** (0.044)*** (0.082)***
Cut lb -0.444 -0.134 -0.907
(0.273)* (0.352) (0.565)
Cut2h 1.219 1.430 1.181
(0.275)*** (0.356)*** (0.568)**
Log Likelihood -634.17 -407.17 -130.09
Sample Size 703 439 172
29

Notes: Dependent variable is 1 if the firm does not use any information-gathering technologies. Dependent variable is2 if the firm only uses low technologies--Celiphones or Pagers or Two-Way Radios. Dependent variable is 3 if the firmuses high technologies--Satellite Communications or On-board Computers or Automated Vehicle Locators. Dependentvariable is zero other wise. , , *** indicate 90%, 95% and 99% level of significance respectively.
a The entire sample (column 2--all firms uncensored) Is 703 firms. The censored sample (columns 3 plus 4) of611 excludes 92 firms that listed more than one primary marketing objective.
bThe estimated thresholds (Cuti and Cut2) are significantly different from each other at 99% level of significance.
30
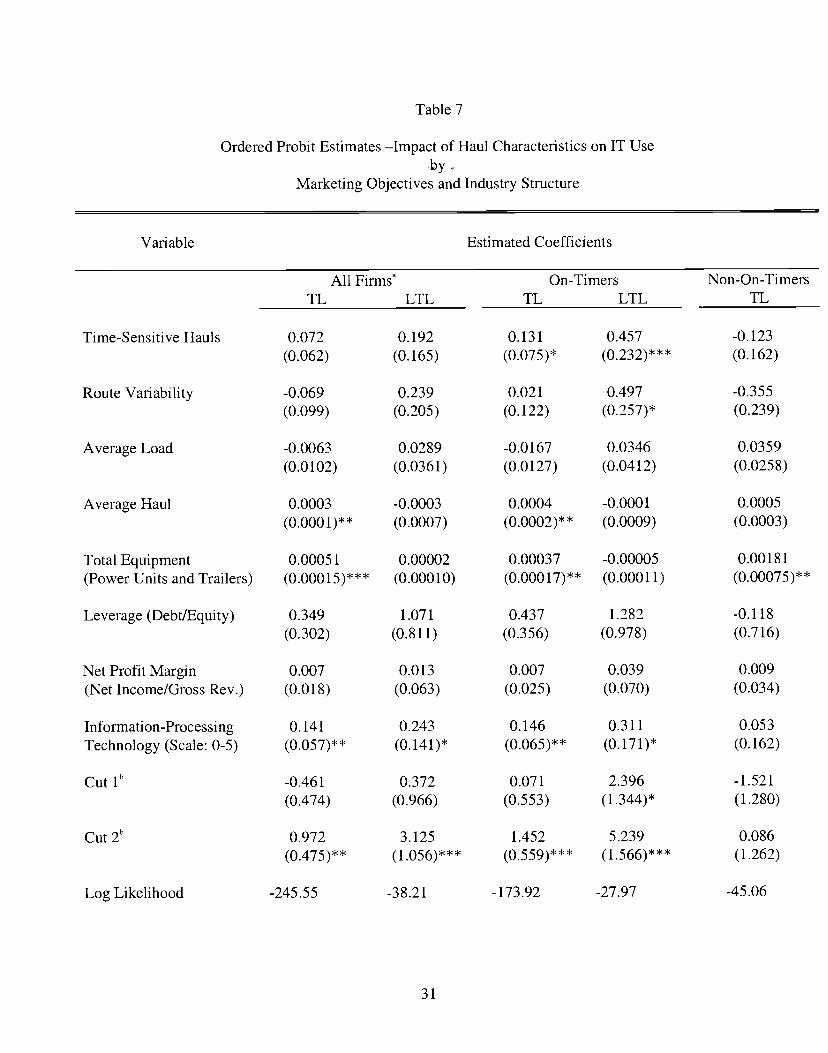
Table 7
Ordered Probit Estimates —Impact of Haul Characteristics on IT Useby -
Marketing Objectives and Industry Structure
Variable Estimated Coefficients
All Firmsa On-Timers Non-On-TimersTL LTL TL LTL TL
Time-Sensitive Hauls 0.072 0.192 0.131 0.457 -0.123(0.062) (0.165) (0.075)* (0.232)*** (0.162)
Route Variability -0.069 0.239 0.021 0.497 -0.355
(0.099) (0.205) (0.122) (0.257)* (0.239)
Average Load -0.0063 0.0289 -0.0167 0.0346 0.0359
(0.0102) (0.0361) (0.0127) (0.0412) (0.0258)
Average Haul 0.0003 -0.0003 0.0004 -0.000 1 0.0005
(0.0001)** (0.0007) (0.0002)** (0.0009) (0.0003)
Total Equipment 0.0005 1 0.00002 0.00037 -0.00005 0.0018 1
(Power Units and Trailers) (0.00015)*** (0.00010) (0.00017)** (0.00011) (0.00075)**
Leverage (Debt/Equity) 0.349 1.071 0.437 1.282 -0.118
(0.302) (0.811) (0.356) (0.978) (0.716)
Net Profit Margin 0.007 0.0 13 0.007 0.039 0.009
(Net Income/Gross Rev.) (0.0 18) (0.063) (0.025) (0.070) (0.034)
Information-Processing 0.141 0.243 0.146 0.311 0.053
Technology (Scale: 0-5) (0.057)** (0.141)* (0.065)** (0.171)* (0.162)
Cut 1" -0.461 0.372 0.071 2.396 -1.521
(0.474) (0.966) (0.553) (l.344)* (1.280)
Cut 2" 0.972 3.125 1.452 5.239 0.086
(0.475)** (1 .056)*** (0.559)*** (1.566)*** (1.262)
Log Likelihood -245.55 -38.21 -173.92 -27.97 -45.06
31
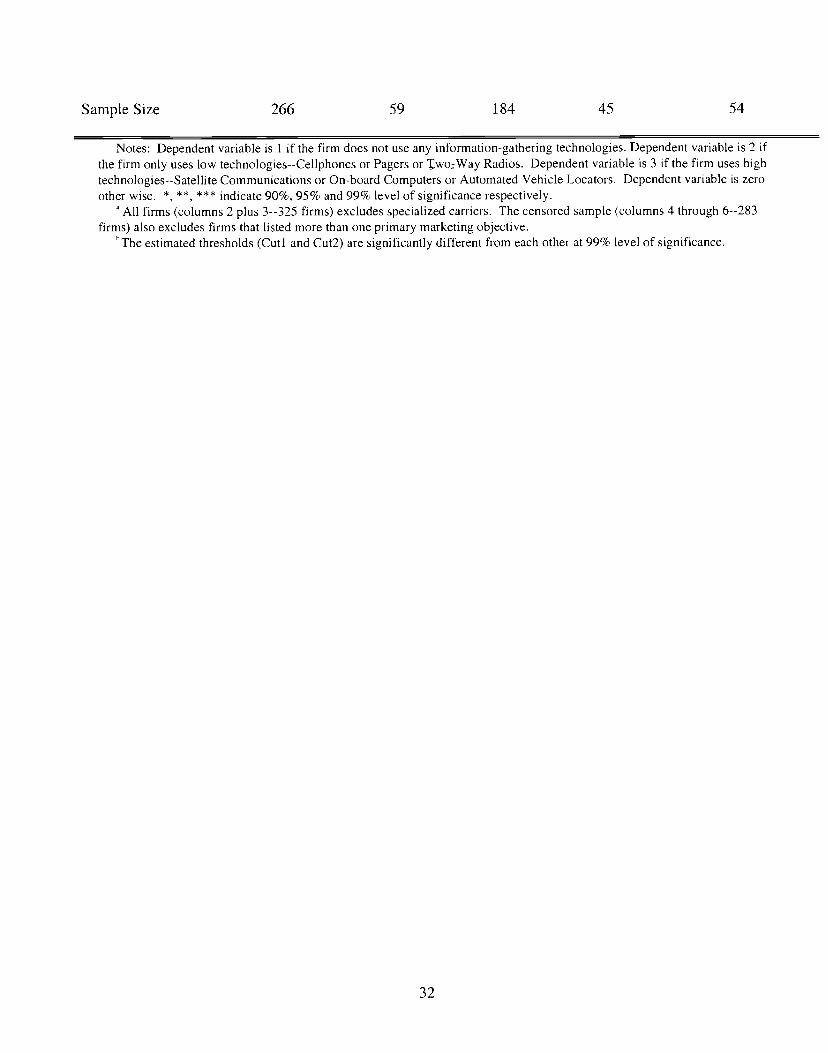
Sample Size 266 59 184 45 54
Notes: Dependent variable is 1 if the firm does not use any information-gathering technologies. Dependent variable is 2 ifthe firm only uses low technologies--Celiphones or Pagers or wo;Way Radios. Dependent variable is 3 if the firm uses hightechnologies--Satellite Communications or On-board Computers or Automated Vehicle Locators. Dependent variable is zeroother wise. , , *** indicate 90%, 95% and 99% level of significance respectively.
All firms (columns 2 plus 3--325 firms) excludes specialized carriers. The censored sample (columns 4 through 6--283firms) also excludes firms that listed more than one primary marketing objective.
bThe estimated thresholds (Cut 1 and Cut2) are significantly different from each other at 99% level of significance.
32
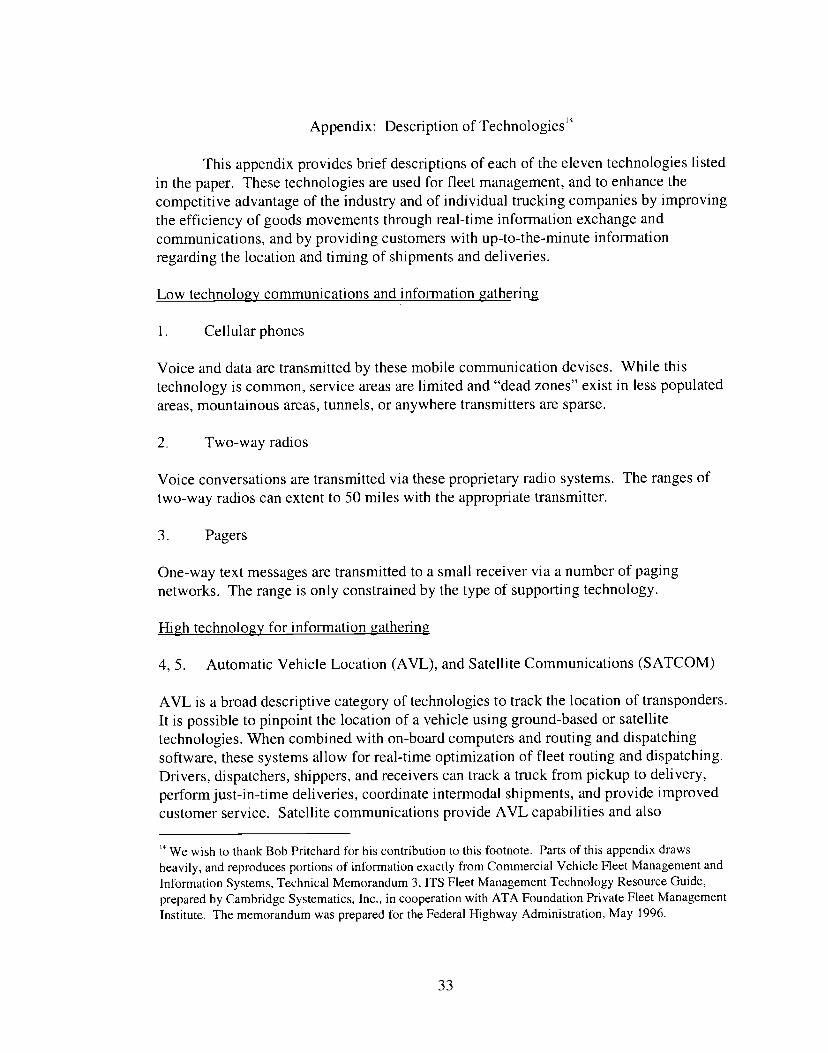
Appendix: Description of Technologies14
This appendix provides brief descriptions of each of the eleven technologies listedin the paper. These technologies are used for fleet management, and to enhance thecompetitive advantage of the industry and of individual trucking companies by improvingthe efficiency of goods movements through real-time information exchange andcommunications, and by providing customers with up-to-the-minute informationregarding the location and timing of shipments and deliveries.
Low technology communications and information gathering
1. Cellular phones
Voice and data are transmitted by these mobile communication devises. While thistechnology is common, service areas are limited and "dead zones" exist in less populatedareas, mountainous areas, tunnels, or anywhere transmitters are sparse.
2. Two-way radios
Voice conversations are transmitted via these proprietary radio systems. The ranges oftwo-way radios can extent to 50 miles with the appropriate transmitter.
3. Pagers
One-way text messages are transmitted to a small receiver via a number of pagingnetworks. The range is only constrained by the type of supporting technology.
High technology for information gathering
4, 5. Automatic Vehicle Location (AVL), and Satellite Communications (SATCOM)
AVL is a broad descriptive category of technologies to track the location of transponders.It is possible to pinpoint the location of a vehicle using ground-based or satellitetechnologies. When combined with on-board computers and routing and dispatchingsoftware, these systems allow for real-time optimization of fleet routing and dispatching.Drivers, dispatchers, shippers, and receivers can track a truck from pickup to delivery,perform just-in-time deliveries, coordinate intermodal shipments, and provide improvedcustomer service. Satellite communications provide AVL capabilities and also
'We wish to thank Bob Pritchard for his contribution to this footnote. Parts of this appendix drawsheavily, and reproduces portions of information exactly from Commercial Vehicle Fleet Management andInformation Systems, Technical Memorandum 3, ITS Fleet Management Technology Resource Guide,prepared by Cambridge Systematics, Inc., in cooperation with ATA Foundation Private Fleet ManagementInstitute. The memorandum was prepared for the Federal Highway Administration, May 1996.
33
communications between the vehicle and dispatcher. With an on-board computer, two-way text or voice communications can allow for dynamic routing and dispatching, as wellas the real-time monitoring of vehicle operating parameters (speed, RPMs, etc.). Satellitesystems are less effective in urban areas, because their radio-navigation signals arereflected and distorted by buildings, bridges, power lines, and other structures. Ground-based AVL are more reliable in urban areas which may make this technology moreattractive to short-haul motor carriers. Since sufficient antenna coverage for groundbased systems does not exist throughout the US, satellite systems that have globalcoverage, can be used more effectively by long-haul carriers.
6. On-board computers (OBCs)
OBCs are either vehicle based or hand-held computers used to capture information fromthe vehicle, or by the driver. OBCs are sometimes used as trip recorders, for monitoringvehicle performance measures such as speed, fuel consumption and drivers' hours ofservice. Information stored in OBCs can be uploaded to the dispatch center using mobilecommunication systems, or downloaded to a system when the truck returns to itsdomicile. OBCs are often used as a platform for two way text communications, andsometimes in conjunction with routing and dispatching systems as well as withmaintenance-scheduling software. OBCs can provide the following functions:
• Business Transactions: Registers delivery times, state line crossings, and customersignatures for proof-of-delivery; transmits delivery notifications.
• Driver Log: Enables drivers to input records of fuel consumption and hours of serviceusing a keyboard and display screen.
• Vehicle Location Information: Deciphers AVL system transmissions.• Vehicle performance data collection: Engine idling, braking, shifting, and
acceleration patterns, as well as data from diagnostic systems for ancillary equipmentsuch as refrigeration units can be captured. OBCs can allow for remote diagnosticsprior to a malfunction in order to improve the safety performance of vehicles.
Technology for information processing
7. Electronic data interchange (EDT)
A series of standardized messages comprises the umbrella concept of EDI and allows forcomputer to computer data transmission. The transmissions can occur between truckingcompanies and shippers, or between any two trading partners. ED! allows for automaticscheduling, billing, receipt of load acknowledgment, etc.
8, 9. Computer-aided routing, and dispatching (CAR and CAD):
Routing and dispatching software provides decision support for route selection in order tominimize the time and cost of moving freight. Systems are used to schedule trucks and
34
drivers subject to availability of parameters such as allowable driving hours, size of load,origin and destination. Static systems allow for preplanning. More sophisticateddynamic systems allow routing and dispatch decisions based on real-time truck locations,generate route maps, estimate delivery times and distances, and help improve costestimates. These software provide the following benefits:
• Improved dispatcher productivity: Companies report that routing procedures, whichpreviously took staff eight hours with a manual system, now can be finished in onehour.
• Reduced client inventory costs: With the reliable delivery provided by CAR and CADsystems, "just-in-time" inventory systems can be more commonly used and"manufacture on demand" is also made feasible. With these software firms no longerneed to keep extensive inventories at manufacturing plants.
• Improved communication efficiency: With a computerized system, load informationto drivers can be relayed instantaneously.
• Reduced labor costs: Companies do not need to employ logistics experts to operatethese systems. Simple user interfaces make it possible for employees withoutspecialized training to operate the system. Shippers can make their routing anddispatching information available on the internet so that receivers can track shipmentsin real-time thus reducing dispatchers' workloads.
10. Maintenance tracking software (MTS)
This software optimizes many areas of vehicle maintenance. For example, MTS cantrack and reorder parts in a repair department or do real-time vehicle diagnostic viasatellite communications. As real-time information becomes available about theperformance of trucks, MTS is used to continuously improve the performance of vehiclesand schedule preventive and emergency repairs as needed in the most cost-effectivemanner.
11. Internet
The Internet provides a variety of communications opportunities. Its current mostcommon application allows for low-cost computer to computer messaging and datasharing. EDT is viable via the Internet, replacing the higher cost proprietarytelecommunications networks.
35