Embed Size (px)
Citation preview

NBER WORKING PAPER SERIES
THE POWER OF SUGGESTION:INERTIA IN 401(K) PARTICIPATION AND SAVINGS BEHAVIOR
Brigitte C. MadrianDennis F. Shea
Working Paper 7682http://www.nber.org/papers/w7682
NATIONAL BUREAU OF ECONOMIC RESEARCH1050 Massachusetts Avenue
Cambridge, MA 02138May 2000
Research support from the National Institute on Aging is gratefully acknowledged. A special thanks to HewittAssociates for their help in providing the data. Thanks also to Richard Thaler, Anna Lusardi, Amil Petrin,Judy Chevalier, Kara Anderson, and Dave Docherty for helpful discussions. Comments from seminarparticipants at the University of North Carolina, Brigham Young University, Western Michigan University,the University of Chicago, the University of Wisconsin, Harvard University, MIT, and the National Bureauof Economic Research are also appreciated. The views expressed herein are those of the authors and are notnecessarily those of the National Bureau of Economic Research.
© 2000 by Brigitte C. Madrian andDennis F. Shea. All rights reserved. Short sections of text, not to exceedtwo paragraphs, may be quoted without explicit permission provided that full credit, including © notice, isgiven to the source.

The Power of Suggestion: Inertia in 401(k) Participation and Savings BehaviorBrigitte C. Madrian and Dennis F. SheaNBER Working Paper No. 7682May 2000JEL No. E2, H3, J0, J3, N3
ABSTRACT
In this paper, we analyze the 401(k) savings behavior of employees in a large U.S.
corporation before and after an interesting change in the company 401(k) plan. Before the plan
change, employees were required to affirmatively elect participation in the 401(k) plan. After the
plan change, employees were automatically and immediately enrolled in the 401(k) plan unless they
made a negative election to opt out of the plan. Although none of the economic features of the plan
changed, this switch to automatic enrollment dramatically changed the savings behavior of
employees. We have two key findings. First, 401(k) participation is significantly higher under
automatic enrollment. Second, the default contribution rate and investment allocation chosen by the
company under automatic enrollment has a strong influence on the savings behavior of 401(k)
participants. A substantial fraction of 401(k) participants hired under automatic enrollment exhibit
what we call "default" behavior--sticking to both the default contribution rate and the default fund
allocation even though very few employees hired before automatic enrollment picked this particular
outcome. This "default" behavior appears to result both from participant inertia and from many
employees taking the default as investment advice on the part of the company. Overall, these results
are consistent with the notion that large changes in savings behavior can be motivated simply by the
"power of suggestion." These findings have important implications for the optimal design of 401(k)
savings plans as well as for any type of Social Security reform that includes personal accounts over
which individuals have some amount of control. They also shed light more generally on the
importance of both economic and non-economic factors in the determination of individual savings
behavior.
Brigitte C. Madrian Dennis F. SheaUniversity of Chicago Vice President Total CompensationGraduate School of Business United Health Group1101 E. 58th Street MN008-B215Chicago, IL 60637 9900 Bren Road [email protected] Minnetonka, MN 55343
1
The Power of Suggestion: Inertia in 401(k) Participation and Savings Behavior
I. Introduction
The continuing erosion of traditional defined benefit pension plans, the approaching
retirement of the baby-boom generation, and the growing interest in Social Security reform have
all renewed interest in the issue of retirement savings. Traditional models of lifecycle
consumption with rational, forward-looking agents predict that individuals will save for
retirement when young, and consume their savings during retirement when old. Yet much of the
evidence on savings behavior suggests that contrary to the lifecycle consumption models, many
individuals do very little savings when young (Diamond and Hausman, 1984; Venti and Wise,
1993; Poterba, Venti and Wise, 1994; Lusardi, 1999). This discrepancy between the predictions
of economic theory and the actual behavior that we observe has motivated research into
alternative models of savings behavior.
This paper sheds light on how a variety of both economic and non-economic factors
affect savings behavior. We analyze the 401(k) savings behavior of employees in a large U.S.
corporation before and after an interesting change in the company 401(k) plan. Before the plan
change, employees who enrolled in the 401(k) plan were required to affirmatively elect
participation. After the plan change, employees were automatically enrolled in the 401(k) plan
immediately upon hire unless they made a negative election to opt out of the plan. Although
none of the economic features of the plan changed, this switch to automatic and immediate
enrollment dramatically changed the savings behavior of employees. We have two key findings.
First, 401(k) participation is significantly higher under automatic enrollment. Second, the
default contribution rate and default investment allocation chosen by the company for automatic
enrollment has a strong influence on the savings behavior of 401(k) participants. A substantial
fraction of 401(k) participants hired under automatic enrollment exhibit what we call "default"
behavior--sticking to both the default contribution rate and fund allocation even though very few
employees hired before automatic enrollment would have picked this particular outcome. This
2
"default" behavior appears to result both from participant inertia and from many employees
taking the default as investment advice on the part of the company. Overall, these results are
consistent with the notion that large changes in savings behavior can be motivated simply by the
"power of suggestion." These findings have important implications for the optimal design of
401(k) savings plans as well as for any type of Social Security reform that includes personal
accounts over which individuals have some amount of control. They also shed light more
generally on the importance of both economic and non-economic factors in the determination of
individual savings behavior.
II. Ties to the previous literature on savings
This paper is most closely related to the recent literature that either advocates or seeks to
incorporate behavioral explanations into economic models of savings behavior (Thaler, 1994;
Akerlof, 1991; Lusardi, 1999; Bernheim, 1991; Laibson, 1998; O'Donoghue and Rabin 1998 and
1999; Shefrin and Thaler, 1988). The first finding of the paper, that 401(k) participation is
significantly higher after automatic enrollment is adopted at the study company, supports the
contention made in much of this literature that procrastination is an extremely important factor in
the widely perceived inadequacy of individual savings for retirement. The second finding, that
of default savings behavior under automatic enrollment, is also consistent with procrastination in
savings behavior, in this case procrastination in the reallocation of retirement assets. This
finding also conforms with several other behavioral explanations for individual savings behavior,
including anchoring around the default and a bias for the status quo. The paper also presents
evidence that the default investment allocation under automatic enrollment may be perceived as
advice on the part of the company, a result that speaks directly to the arguments made by
Bernheim and others on the importance of investor education (Bernheim, 1997; Bernheim and
Garrett, 1996).
This paper is also related to the more narrowly-defined economic research on 401(k)
plans. This literature has been largely focused on three issues: the determinants of 401(k)
participation at the employee level, the determinants of 401(k) plan adoption at the firm level,
and whether 401(k) plans increase overall savings. The results in the paper corroborate what
research there is on the determinants of 401(k) participation at the individual level--namely, that
401(k) participation tends to increase with age, income and tenure, and is generally higher for
3
men relative to women, and for whites relative to blacks or Hispanics. The issues of 401(k) plan
adoption at the firm level and of whether 401(k) plans increase overall savings are not really
addressed in this paper, although there is some evidence that is supportive of the notion that at
least some 401(k) savings represents "new" rather than "old" savings (see Section
IX). The results in the paper also have important implications for issues related to 401(k) plan
design.
III. Features of the 401(k) savings plan at a large U.S. corporation
To examine the importance of economic vs. non-economic factors in the savings
behavior of individuals, we use employee-level data on 401(k) participation and savings
behavior from a large, publicly-traded Fortune 500 company in the health care and insurance
industry. In March of 1999, the company had major locations in 38 states, the District of
Columbia, and Puerto Rico. The company first implemented its 401(k) savings plan in 1985.
This paper will consider the 401(k) savings decisions of employees at this company over
approximately a two-year period from June of 1997 through June of 1999.
The company implemented a change in 401(k) enrollment and eligibility that took effect
on April 1, 1998. Prior to this change, 401(k) participation was limited to individuals with one
or more years of employment at the firm. Individuals eligible for participation had the option of
contributing up to 15% of compensation to the 401(k) plan, with the first 6% of compensation
contributed receiving a 50% employer match. In order to participate, individuals had to fill out
an enrollment form or call the 401(k) record keeper to (1) authorize payroll deduction of their
employee contributions, (2) select a contribution rate, and (3) choose the investment allocation of
the combined employee and employer contributions.
Effective April 1, 1998, two substantive changes were made. The first was that all
employees were made immediately eligible to participate in the 401(k) plan regardless of service,
although the one-year service requirement was maintained to qualify for an employer match.
Thus, on April 1, 1998, individuals who had been hired after April 2, 1997 and who did not yet
meet the previous service requirement for eligibility became immediately eligible to contribute
up to 15% of compensation to the 401(k) plan with no employer match. Upon reaching one year
of employment, these individuals became eligible for a 50% employer matching contribution on
the first 6% of their salary contributed to the 401(k) plan. In order to participate in the 401(k)
4
plan, these individuals were required to take the same enrollment steps as other previously
eligible participants: (1) authorize payroll deduction of their employee contributions, (2) select a
contribution rate, and (3) choose the investment allocation of their contributions.
The second change that took effect on April 1, 1998 was that all newly hired employees
were automatically enrolled in the 401(k) plan unless they affirmatively elected to opt-out (a so-
called "negative" election). Thus, employees hired on or subsequent to April 1, 1998 were not
only immediately eligible to enroll in the 401(k) plan, they were automatically enrolled unless
they specifically declined. Employees who did not decline 401(k) participation were
automatically enrolled in the 401(k) plan with a 3% contribution rate allocated entirely to the
money market fund that was part of the overall menu of fund options available to all 401(k)
participants. However, as with all 401(k) participants hired prior to automatic enrollment, these
employees had the option at any time to change both their contribution rate and their fund
allocation.1
Table 1 summarizes the overall plan characteristics before and after the changes
implemented on April 1, 1998. Beyond the aspects of the plan just described, other features of
the 401(k) plan did not change. The employer-matching provisions, vesting of employer
contributions, investment options, and the conditions for loans and hardship withdrawals
remained the same both before and after April 1, 1998.
While the design features of 401(k) and other savings plans vary widely across
employers, the features of the 401(k) plan in this company before the switch to immediate
eligibility and automatic enrollment were typical of 401(k) plans in other large corporations. As
part of its Employee Benefits Survey, the Bureau of Labor Statistics collects detailed data on the
features of defined contribution plans. For employees in medium and large firms offering 401(k)
or other savings plans (see Bureau of Labor Statistics, 1998):
§ The modal maximum employee contribution rate is 15% (20% of employees in firms
offering a 401(k) plan have a 15% contribution limit). § The modal length of service requirement is 1 year (52% of employees in firms
offering a 401(k) plan have a one-year length of service requirement).
1 Under automatic enrollment, any changes to the contribution rate or investment allocation did not take effect until the second bi-weekly pay period. Thus, all employees hired under automatic enrollment who did not opt-out of 401(k) participation were enrolled at the automatic enrollment default for the first pay period.

5
§ The modal employer matching provision is a 50% employer match on employee contributions up to the first 6% of compensation (27% of employees in firms offering a savings plan have this match provision).
§ One-third of employees in firms with 401(k) plans have immediate vesting of their
employer-contributions, 25% have cliff vesting, and 24% have graduated vesting. Typically cliff vesting occurs at 5 years. The company in this study is slightly anomalous in having such a short vesting period relative to other companies with vesting provisions.
§ Almost half of the employees in firms with 401(k) plans have loan and hardship
withdrawal provisions as a part of the plan.
§ 20% of employees in firms with 401(k) plans have more than 6 investment options for their contributions.
As the characteristics of this list reveal, the features of the 401(k) plan at the company in this
study prior to April 1, 1998 are fairly common.
How typical are the characteristics of the 401(k) plan following the April 1, 1998
changes? While a one-year length of service requirement is the norm as noted above, immediate
eligibility is common as well: 27% of employees in firms that offer 401(k) plans face no service
requirement to participate (Bureau of Labor Statistics, 1998). Unfortunately, the Bureau of
Labor Statistics does not collect data on the prevalence of the other major design change--
whether or not companies have automatic enrollment of their 401(k)-eligible employees.
Conversations with the human resources department of this company and with benefits
consultants suggest that while this company was by no means the first to implement automatic
enrollment, such a plan feature is still relatively uncommon.2 The brief descriptions of the
automatic enrollment plans at other companies that are discussed in the benefits practitioner
journals suggest that the features of this company's automatic enrollment plans are very similar
to the features of other automatic enrollment plans. A 3% default contribution rate seems to be
standard, and the default investments tend to be fairly conservative, with money market funds,
guaranteed income funds, stable value funds, or balanced funds cited as the most common
2 A 1999 survey by Buck Consultants reports that 7% of 401(k) sponsors have plans with automatic enrollment and another 28% are considering automatic enrollment (Hays, 1999). These numbers are likely too high, however, as the respondents to the surveys conducted by consulting firms tend to be very large firms, and large firms are usually the first to adopt innovative changes in benefit plan design.
6
options.3 Although automatic enrollment is not currently a very typical feature of 401(k) plans, a
recent survey of companies revealed that 28% of companies were considering automatic
enrollment (Hays, 1999).
IV. The data
The company provided data for this analysis on various aspects of the 401(k) savings
behavior of its employees at six points in time between June 1, 1997 and June 30, 1999, covering
roughly a two-year period. There are two rounds of data prior to the switch to immediate
eligibility and automatic enrollment: June 1, 1997 and December 31, 1997. Four rounds of data
are available after the switch to immediate eligibility and automatic enrollment: June 30, 1998,
December 31, 1998, March 31, 1999 and June 30, 1999. Figure 1 shows a time line graphing the
data collection and changes in plan design. In addition to data on 401(k) participation,
contribution rates, and fund allocation, some basic demographic information such as age,
race/ethnicity, tenure, salary, and state of residence is also available. For most of the analyses
presented in this paper, we use the June 30, 1999 data (we make some limited use of prior waves
of data as well).
Table 3 compares the demographic characteristics of the employees in this company on
March 31, 1999 with the characteristics of the overall U.S. workforce in the March 1998, Current
Population Survey. As shown in Table 3, the characteristics of the employees in this company
vary from those of the U.S. workforce in several important ways. Perhaps the most striking
difference is in gender: almost 78% of the employees in this company are female, while only
47% of the U.S. workforce is female. In contrast, the racial and ethnic composition of this
company's workforce mirrors that in the overall labor market fairly well. The age distribution of
the employees in the study company is somewhat compressed relative to that of the U.S.
workforce, with relatively fewer employees that are very young (<20) or older (>50), and more
who are in their prime years (30-50). There are many fewer part-time workers (<35 hours per
week) at the study company than in the U.S. workforce (6% relative to 21%), and consequently
compensation is higher at the study company than in the U.S. workforce. Finally, in terms of
3 A recent study of 14 member companies with automatic enrollment by the Profit Sharing/401(k) Council of America (2000) reports that 71% of the 14 companies surveyed had a 3% default contribution rate. The most commonly reported default fund was a stable value fund (31%), followed by either a money market fund, a balanced stock/bond fund, or a lifestyle fund (each with 15%).
7
geography, the employment at the study company is somewhat more concentrated in the east and
midwest relative to employment in the entire U.S. labor market, but, as noted earlier, the
company is national and has 240 offices located throughout the country.
For the purposes of analyzing the effects of automatic enrollment on the 401(k) savings
decisions of employees, it is instructive to compare three particular subgroups of employees at
the study company (see Figure 2). The first is individuals who were hired between April 1, 1996
and March 31, 1997. At the time automatic enrollment was implemented, all of these employees
had between 1 and 2 years of tenure and were eligible for the 401(k) plan with a company match.
In the subsequent analysis, we shall refer to this cohort as the OLD group. The second group is
employees hired between April 1, 1997 and March 31, 1998. When automatic enrollment was
implemented on April 1, 1998, these recent hires were already employed by the study company
but had less than one year of tenure and thus were not eligible to participate in the 401(k) plan.
On April 1, 1998, however, all of these employees became immediately eligible to participate in
the 401(k) plan, albeit without a company match until reaching one year of service. This group,
however, was not automatically enrolled. Thus, to participate in the 401(k), these employees had
to affirmatively enroll. We shall refer to this cohort of employees as the WINDOW group. The
third group of employees is those who were hired between April 1, 1998 and March 31, 1999.
These employees represent the first annual cohort of employees hired with immediate 401(k)
eligibility and automatic enrollment absent a negative 401(k) election under the terms of the new
401(k) plan design. We shall refer to this cohort as the NEW group. Many of the tables and
charts also present statistics for what is labeled as the "3+" cohort, which includes everyone hired
prior to the OLD cohort.
In most of the analyses, we restrict the sample to employees who are not yet age 65 and
to those with at least 3 months of tenure. The exclusion of employees over age 65 is made for
two reasons: first, there are very few employees over age 65 who still work at the study
company, and second, eligibility for Social Security and potentially pension benefits from other,
former employers, could make the 401(k) savings decisions for this group very different than
those for younger employees. We make the second exclusion because employees with less than
three months of tenure look very similar to the NEW cohort and for this reason there would be
little learned from adding another cohort to the analysis. We could have included these newly
hired employees in the NEW cohort, but decided against this in order to maintain a consistent

8
one-year cohort size for the NEW, WINDOW, and OLD cohorts, the three primary groups in our
analysis. In addition, we exclude about 900 employees who were acquired from other companies
after the onset of automatic enrollment but who had been hired by their previous company before
April 1, 1998. We do this because all employees acquired after April 1, 1998 were also
automatically enrolled in the 401(k) plan, but their tenure within the company is determined by
their original date of hire. Thus, in terms of overall tenure, these employees do not belong to the
NEW cohort but nonetheless participate through automatic enrollment. In order to make the
comparison of the 401(k) savings behavior of various cohorts of employees as clean as possible,
we thus exclude these acquired employees who have a rightful claim to belong in more than one
cohort.
Employee Cohorts for Comparative Analysis OLD WINDOW NEW Dates of hire 4/1/1996 to
4/1/1997
4/1/1997 to 3/31/1998
4/1/1998 to 3/31/1999
First eligible to participate in 401(k)
One year following date of hire
April 1, 1998 Date of hire
First eligible for company match
One year following date of hire
One year following date of hire
One year following date of hire
Automatically enrolled No No Yes
Table 4 presents comparative demographic statistics on each of these cohorts as of March
31, 1999. Overall, the cohorts appear fairly similar--most of the differences in their
characteristics can be explained by the aging of cohorts over time or the differential effects of
turnover. As would be expected, the average age of the cohorts increases with their tenure by a
little over one year. That the age difference between consecutive cohorts is slightly more than a
year can be explained by the fact that turnover rates vary inversely with age. Thus, in terms of
age at their initial hire date, the individuals in these three cohorts are very similar. In terms of
ethnicity, the fraction white increases slightly with tenure (77.1% for the OLD cohort vs. 68.8%
for the NEW cohort) while the fraction black falls (12.5% for the OLD cohort vs. 18.9% for the
NEW cohort). These differences appear to result both from differential turnover by ethnicity,
and from higher levels of minority recruitment in the past couple of years. The fraction of
9
employees working part-time is decreasing with tenure, and once again, this is consistent with
the higher turnover rates for part-time workers, or the conversion of part-time into full-time
workers. As would be expected, both mean and median compensation increase with the
respective tenure of the three cohorts. This is consistent with both positive returns to labor
market experience given the slightly higher age of the older cohorts, positive returns to tenure
given the slightly higher tenure of the older cohorts, and higher turnover rates in the lower pay
categories. The distribution of employment by region and across business units is fairly similar
for all three cohorts. The one exception is a relative shift in hiring away from business unit C
and into business unit G for the NEW cohort. Overall, however, the three cohorts appear to be
very similar in terms of their characteristics.
V. 401(K) Savings: The Participation Decision
The Effect of Automatic Enrollment on 401(k) Participation
The first aspect of the savings decision that we consider is the extent to which employees
participate in the company-sponsored 401(k) plan. The overall 401(k) participation rate amongst
401(k) eligible employees on June 30, 1999 was 72.0%. The conventional wisdom gleaned from
discussions with benefits practitioners, a casual perusal of practitioner-oriented benefits journals,
and a handful of academic articles examining 401(k) participation is that between two-thirds and
three-quarters of 401(k)-eligible employees participate in their company-sponsored 401(k) plan.4
Thus, the overall participation rate in the study company corresponds to typical participation
rates in other companies. But this aggregate figure masks considerable variation in the
participation rate by various demographic characteristics. By far the most important determinant
of 401(k) participation is tenure. Figure 3 charts the 401(k) participation rate by tenure. There
are two things to notice in Figure 3. First, for employees hired prior to automatic enrollment (the
WINDOW cohort and all tenure categories to the right of this group in Figure 3), 401(k)
participation is increasing in tenure. Much of the increase in participation occurs during the first
10 years of employment, with only small increases in the participation rate after that. The
second and more striking thing to notice about Figure 3 is that the highest participation rates by
10
far are for the employees hired under automatic enrollment: approximately 86% of employees
hired under automatic enrollment participate in the 401(k) plan.5 In contrast, only about half of
the WINDOW cohort are 401(k) participants. The participation rate of those hired under
automatic enrollment even exceeds the participation rate of highly tenured employees hired prior
to automatic enrollment.
Given that 401(k) participation is increasing in tenure for those hired prior to automatic
enrollment, it is difficult to say what the general effect of automatic enrollment is on 401(k)
participation given that automatic enrollment at this company has only been in effect for a period
of a little over one year. However, one indication of the effect of automatic enrollment on
401(k) participation is the difference between the participation rate of those hired under
automatic enrollment and the participation rate of those cohorts hired just prior to automatic
enrollment. Figure 3 certainly suggests that automatic enrollment has increased participation
substantially relative to either the WINDOW or the OLD cohorts.
One problem with comparing the participation rates at the same point in time of the NEW
and the WINDOW (or OLD) cohort in assessing the effect of automatic enrollment on 401(k)
participation is that the WINDOW group has higher tenure (about one year on average), and
401(k) participation increases dramatically with tenure over the first several years of
employment. Note that the effect of tenure on 401(k) participation implies that the relative
differences between the 401(k) participation rates of the NEW and the WINDOW cohort in
Figure 3 will understate the true effects of automatic enrollment on 401(k) participation, at least
initially.
However, with longitudinal data we can compare the 401(k) participation rate of the
NEW cohort with that of the WINDOW cohort at a similar level of tenure. The first two
columns of Table 5 give such a comparison, showing the 401(k) participation of the NEW cohort
on June 30, 1999 when this cohort of employees had 3-15 months of tenure, and also of the
WINDOW cohort on June 30, 1998 when these employees also had 3-15 months of tenure. A
further comparison with the OLD cohort at a similar length of tenure is precluded by the fact that
4 See, for example, Poterba, Venti and Wise (1994), Andrews (1992), and Bassett, Fleming and Rodrigues (1998) for academic studies, Fidelity Investments (1999) for a consulting report, and Thompson (1997) for a more anecdotal discussion. 5 As a basis of comparison, a recent Buck Consultants' survey reports 401(k) participation rates of 77% in companies without automatic enrollment and of 84% in companies with automatic enrollment (Employee Benefit Plan Review, 1999).
11
none of the OLD cohort were eligible for the 401(k) plan until they had reached one-year of
tenure because they were all hired under the old terms of the 401(k) plan. As anticipated, the
differences between the 401(k) participation rates of these two groups are magnified relative to
the differences in Figure 3. The 401(k) participation rate of the WINDOW cohort at 3-15
months of tenure was 37%. This is less than half the 86% participation rate of the NEW cohort
with a similar amount of tenure. Thus, automatic enrollment substantially increases 401(k)
participation for new hires.
Table 5 shows another interesting effect of automatic enrollment on 401(k) participation:
it substantially decreases the variation in 401(k) participation rates across various demographic
subgroups of the employee population. The first column of Table 5 shows that for the
WINDOW cohort, the 401(k) participation rate varies widely by gender, by age, by
compensation, and across racial and ethnic groups. Amongst the WINDOW cohort, 401(k)
participation increases quite dramatically with age and with compensation.6 In addition, men are
more likely to participate in the 401(k) plan than are women, and whites are more likely to
participate than are blacks and Hispanics. Although not shown in Table 5, there are similar
differences in the 401(k) participation rate across these demographic groups for other cohorts
with more tenure. In general, the variation in participation rates by age and pay category
decrease somewhat with tenure, while the variation in participation rates with respect to gender
and race/ethnicity persist.
The second column of Table 5 shows that for the NEW cohort, there is substantial
compression in the variation in participation rates with respect to the demographic characteristics
that strongly influence participation for older cohorts. For example, in the NEW cohort, the
participation rate of women is virtually identical to that of men. Automatic enrollment also has
strong effects on the variation in participation across race/ethnicity, age, and compensation. The
difference between the black and the white participation rates of the WINDOW cohort is over 20
percentage points (43% vs. 22%), while the difference for the NEW cohort is only 7 percentage
points (88% vs. 81%). Moreover, the 81% black 401(k)-participation rate under automatic
6 Bassett, Fleming and Rodrigues (1998) show a similarly steep 401(k) participation gradient with respect to family income in the April 1993 Current Population Survey. Andrews (1992) documents steep 401(k) participation gradients with respect to age, income and job tenure in the May 1988 Current Population Survey. Poterba, Venti and Wise (1994) find a steep 401(k) participation gradient with respect to both age and income in the 1987 Survey of Income and Program Participation. Fidelity Investments (1999) documents a steep 401(k) participation gradient with respect to age, compensation, and tenure among the 5,000+ 401(k) plans which Fidelity services.

12
enrollment is extremely high in absolute terms. The disparity between the highest and lowest
age-related participation rates is 35 percentage points for the WINDOW cohort (25% vs. 60%),
but only 16 percentage points for the NEW cohort (74% vs. 90%). Similarly, the disparity
between the highest and lowest pay-related participation rates is about 55 percentage points for
the WINDOW cohort (13% vs. 68%) and 15 percentage points for the NEW cohort (80% vs.
95%).
Thus, while automatic enrollment substantially increases the overall 401(k) participation
rate, it also equalizes participation rates across various demographic subgroups. The effects are
largest among the groups with the lowest participation rates under the previous regime of
affirmative elections: blacks and Hispanics, the young, and employees with lower levels of
compensation.
How does the effect of automatic enrollment on 401(k) participation compare in
magnitude to the effect of other measures adopted by employers to increase 401(k) participation?
One tool used by employers to increase 401(k) participation is the employer match. The
effectiveness of employer matching on 401(k) participation is, however, not at all certain. Using
cross-sectional data, Andrews (1992), Bassett, Fleming and Rodrigues (1998), Papke and
Poterba (1995), and Even and Macpherson (1999) all find a positive correlation between the
availability of an employer match and the 401(k) participation rate. However, more rigorous
attempts to disentangle the direct effect of the employer match on 401(k) participation from the
correlation between the employer match and other factors that also affect 401(k) participation
have been less conclusive. Kusko, Poterba and Wilcox (1998) find no relationship between the
match rate and the 401(k) participation rate, Papke (1995) finds somewhat mixed evidence of a
relationship, while Even and Macpherson (1999) find a very strong relationship between
employer matching and 401(k) participation.
Despite the uncertainty surrounding the effects of an employer match on 401(k)
participation, the results in Papke (1995) provide an interesting basis for comparison. In a
simple OLS regression, Papke finds that 401(k) participation is 10.2 percentage points higher in
companies with a 50% match (the most commonly used match rate across all companies and the
match rate in effect at the study company) than in companies with no match7. Because this
estimate of the effect of the employer match is based on overall employee participation and not
7 See Papke (1995), Table 3, column 1.
13
on participation of newly hired employees, the right comparison for the effect of automatic
enrollment on 401(k) participation in the study company would also be the effect on overall
participation. The overall 401(k) participation rate in the study company prior to the adoption of
automatic enrollment was 61%. If we assume a steady-state 401(k) participation rate of 86%
following the adoption of automatic enrollment8, then the overall effect of automatic enrollment
in the study company is a 25 percentage point increase in 401(k) participation. Thus, the effect
of automatic enrollment on 401(k) participation is more than twice as large as Papke's OLS
estimate of the effect of instituting a 50% match. However, when Papke controls for employer-
specific fixed effects, the effect of the match rate on 401(k) participation completely disappears.
This suggests that companies with an employer match would have had higher 401(k)
participation even in the absence of an employer match, due either to the demographic
characteristics of the employees, or to other efforts taken by the employer to increase 401(k)
participation. If employer matching really has no effect on 401(k) participation, then the effect of
automatic enrollment is all the greater in comparison.
A second mechanism used by employers to increase 401(k) participation is employee
financial education through mechanisms such as brochures, newsletters, seminars, videos,
individual counseling, and interactive software. In an analysis of individual-level savings data,
Bernheim and Garrett (1996) find that the availability of employer-provided financial education
increases the probability of 401(k) participation by 11.8 percentage points. Using firm-level
data, Bayer, Bernheim and Scholz (1996) find a similar effect--that employer-provided financial
education increases the 401(k) participation rate by 8.2 percentage points. These effects, while
large, are still less than half of the presumed 25 percentage point increase in the steady-state
401(k) participation rate generated by the adoption of automatic enrollment. Thus, automatic
enrollment appears to be a much more effective means of increasing 401(k) participation than
either employer-provided financial education or increasing the 401(k) employer match.
The Effect of Immediate Eligibility on 401(k) Participation
While we have been attributing all of the difference between the participation rates of the
NEW and WINDOW cohorts in columns 1 and 2 of Table 5 to the impact of automatic
8 The assumption of an 86% steady-state 401(k) participation rate is based on the participation rate of newly hired employees under automatic enrollment and the assumption, substantiated in the short-term at least, that employees

14
enrollment, there is one other aspect of the 401(k) plan that was changed at the same time
automatic enrollment was implemented: the move from a one-year waiting period for 401(k)
eligibility to immediate eligibility. To assess the impact of immediate eligibility on 401(k)
participation as separate from the effect of automatic enrollment, we compare the 401(k)
participation of the OLD cohort on June 30, 1998 with that of the WINDOW cohort on June 30,
1999 (columns 4 and 5 of Table 5). Each cohort had tenure ranging from 15-27 months on these
dates of observation. Recall that the OLD cohort did not become 401(k) eligible until reaching
one year of employment, while the WINDOW cohort became immediately eligible on April 1,
1998 when the 401(k) plan change was implemented. The WINDOW cohort, however, was not
automatically enrolled upon becoming eligible. This comparison does not provide a completely
untainted assessment of the impact of immediate eligibility on 401(k) participation because the
401(k) eligibility of the WINDOW cohort was not immediate upon hire, but immediate upon
April 1, 1998. Nevertheless, the comparison is at least illustrative of the effect of earlier 401(k)
eligibility on participation. Interestingly, there is very little difference in the overall participation
rates of these two cohorts at points of similar tenure, 48.7% participation for the OLD cohort
with 15-27 months of tenure, and 49.4% participation for the WINDOW cohort. This suggests
that the earlier 401(k) eligibility of the WINDOW cohort had very little, if any, impact on 401(k)
participation rates. With such a small role played by immediate eligibility, it seems likely that
the 401(k) participation differences in the first two columns of Table 5 can be attributed solely to
the impact of automatic enrollment.
VI. 401(K) Savings: The Contribution Rate Decision
The Effect of Automatic Enrollment on the 401(k) Contribution Rate
A second important aspect of the 401(k) savings decision is the contribution rate. In the
study company, employees are allowed to contribute between 1% and 15% of their total
compensation to the 401(k) plan. After the first year of employment, the first 6% of
compensation contributed is eligible for a 50% employer match, increasing the maximum
possible 401(k) contribution to 18% (a 15% employee contribution and a 3% employer match).
In the analysis that follows, we focus solely on the employee contribution rate.
do not appear to be dropping out of the 401(k) plan after the initial pay period
15
The average overall average 401(k) contribution rate is 6.4% of compensation, but there
is substantial variation in the contribution rates that are chosen by individuals.9 Figure 4A
illustrates this variation by plotting the distribution of contribution rates for various cohorts. The
most striking thing to note about Figure 4A is that the distribution of contribution rates for the
NEW cohort is quite different than that for the other cohorts. For the WINDOW, OLD, and 3+
cohorts, the most frequently chosen contribution rate is 6%, with slightly more than a third of all
participants at this rate. The next most frequently chosen contribution rates are 15%, 10%, and
3% (in that order), with 8-14% of participants in each of these cohorts at these various rates.
Together, 3%, 6%, 10% and 15% account for roughly 70% of all participants in these cohorts.
The remaining roughly 30% of participants are spread amongst the other rates which are
somewhat aggregated in Figure 4A. In marked contrast, the most prevalent contribution rate
amongst the NEW cohort is 3%, with 76% of 401(k) participants in the NEW cohort contributing
at that rate (relative to around 10% of participants from the other cohorts). The next most
frequently chosen options for the NEW cohort are 6%, 15%, and 10%, but a much smaller
fraction of participants are at any of these contribution rates relative to any of the other cohorts.
The impact of automatic enrollment on the distribution of contribution rates appears to result
largely from inertia—employees are “stuck” at the default contribution rate of 3%. While three-
quarters of non-automatically enrolled 401(k) participants have contribution rates of 6% or
greater, three-quarters of automatically enrolled participants contribute at the default rate of
3%.10
One explanation for the substantial difference between the fraction of participants with a
contribution rate of 6% or more in the other cohorts relative to the NEW cohort is that most of
the NEW cohort is not yet match-eligible and thus they do not face the same incentive to
contribute at least 6% of compensation to the 401(k) plan as do the match-eligible participants in
9 The average contribution rate for 401(k) participants hired prior to automatic enrollment is 7.2%. This is very similar to the 7.0% average 401(k) contribution rate calculated by Bassett, Fleming and Rodrigues (1998) for the entire population of 401(k) participants in the April 1993 Current Population Survey, the 6.6% average 401(k) contribution rate calculated by Andrews (1992) from the May 1988 Current Population Survey, and the 7.0% average contribution rate calculated by Fidelity Investments (1999) across the 5000+ 401(k) plans serviced by Fidelity. 10 In an anecdotal discussion of the experience of Southland Corporation's experience with automatic enrollment, Youden (1999) reports that two year after the implementation of automatic enrollment, 80% of employees were still contributing at the default contribution rate of 3%. Similarly, Thompson (1997) reports that about one year after implementing automatic enrollment, 65% of enrollees at Freddie Mac were still contributing at the default

16
the other cohorts. To ascertain the importance of match-eligibility (or lack thereof) on the
distribution of contribution rates, we can compare the contribution rates of the NEW cohort with
those of the WINDOW cohort one year earlier when they had an equivalent amount of tenure.
This is done in Figure 4B. The lack of match-eligibility appears to account for surprisingly little
of the difference in the distribution of contribution rates between the NEW and WINDOW
cohorts when both cohorts are largely match-ineligible. Even when most of the WINDOW
cohort is not match eligible, 30% of participants choose a 6% contribution rate and only 11%
choose a 3% contribution rate.
A second explanation for the substantial differences in the distribution of contribution
rates for the NEW cohort and the other cohorts could be one of composition. As shown in the
previous section, the NEW cohort has a substantially higher participation rate than the other
cohorts. Thus, relative to other cohorts, the NEW cohort has a large number of 401(k)
participants who would have been contributing to the 401(k) plan at a 0% contribution rate (non-
participation) but who are now contributing at a non-zero rate as a result of automatic
enrollment. Perhaps the differences in the distribution of contribution rates between the NEW
and other cohorts is driven by a shift from a 0% contribution rate to 3%, the default contribution
rate under automatic enrollment. A simple way to ascertain whether a shift in the composition of
401(k) participants is driving the contribution differences is to include non-participation (0%) as
a contribution rate category. This is done in Figure 4C for the NEW and WINDOW cohorts
when both cohorts have the same level of tenure (3-15 months). The difference between the
WINDOW and NEW cohorts in the fraction of employees with a 0% contribution rate (non-
participation) is 48.5 percentage points. If we assume that (1) 48.5% of the employees in the
NEW cohort are at a contribution rate of 3% simply because they have become participants
through automatic enrollment and this is the automatic enrollment default, and (2) that the
distribution of contribution rates for the NEW cohort would be the same as that for the
WINDOW cohort if automatic enrollment had not impacted participation, then we would predict
that 52.9% of the NEW cohort would have a contribution rate of 3% under automatic enrollment
(48.5% + 4.4%, the latter being the fraction of the WINDOW cohort with a 3% contribution rate
at 3-15 months of tenure). In fact, however, 65.1% of the NEW cohort has a contribution rate of
contribution rate. Thus, the experiences of the study company documented in this paper are supported, at least anecdotally, by those of other companies that have implemented automatic enrollment.
17
3% when non-participation is included as a contribution category. Thus, an additional 12.2% of
employees in the NEW cohort are at a 3% contribution rate over what we would predict even if
all of the incremental 401(k) participants under automatic enrollment were contributing at 3%.
This suggests that automatic enrollment has had the effect of moving a substantial fraction of
employees who would have participated in the 401(k) plan even in the absence of automatic
enrollment to a contribution rate of 3% although they would have chosen a different contribution
rate otherwise.
Table 6 compares the average contribution rates of 401(k) participants from the NEW
and the WINDOW cohorts by various demographic characteristics. To account for any possible
effects of increases in tenure on the average 401(k) contribution rate, the first two columns of
Table 6 compare the 401(k) contribution rate of the WINDOW cohort on 6/30/98 with that of the
NEW cohort on 6/30/99. Both cohorts had between 3 and 15 months of tenure at these
measurement dates. The comparison between these two groups suggests that automatic
enrollment results in a decline in the average contribution rate from 7.4% to 4.4% among those
newly eligible, and that this decline is pervasive across virtually all demographic subgroups.
This result is not surprising given the distribution of contribution rates shown in Figure 4A.
Although not shown, there is very little variation in the average contribution rate with
respect to tenure across the WINDOW, OLD and 3+ cohorts, as the similarity in the distribution
of contribution rates across these three cohorts in Figure 4A would suggest. The average
contribution rate is slightly above 7% for all three of these cohorts, and the variation in the
average contribution rate by demographic characteristics in Table 6 for the WINDOW cohort is
similar to the variation in all of the other cohorts hired prior to automatic enrollment. Within the
WINDOW, OLD and 3+ cohorts, the average 401(k) contribution rate is somewhat lower for
women than for men, is somewhat lower for blacks and Hispanics relative to whites, and tends to
increase with both age and compensation. The disparities in the contribution rates across these
various demographic groups tends to be smaller than the disparities in the participation rates
across these demographic groups as shown in Table 5.
Automatic enrollment does not appear to have the same equalizing effect on the variation
in contribution rates by demographic characteristics as it had on the variation in participation
rates. As show in columns 1 and 2 of Table 6, the absolute differences in 401(k) contribution
rates across demographic subgroups are not that different for the NEW cohort relative to the

18
WINDOW cohort, and because the absolute level of the average contribution rates of the NEW
cohort is much lower, the relative differences for the NEW cohort are even larger. For example,
the absolute difference between the highest and lowest 401(k) contribution rate with respect to
age for the WINDOW cohort is 3.6 percentage points (9.5% for those 60-64 minus 5.9% for
those <20), while that for the NEW cohort is 3.7 percentage points (6.9% for those 60-64 minus
3.2% for those <20). In percentage terms, however, the relative differences are 61% for the
WINDOW cohort and 116% for the NEW cohort (using the lower average contribution rate as
the base). Similar characterizations can be made for the differences across pay categories and
racial/ethnic groups.
The Effect of Immediate Eligibility on the 401(k) Contribution Rate
The effect of immediate eligibility on the 401(k) contribution rate can be inferred from
the last two columns of Table 6 which compare the 401(k) contribution rates of the OLD and
WINDOW cohorts on 6/30/98 and 6/30/99, respectively, when both groups had between 15 and
27 months of tenure. The same caveats given in the earlier discussion of the effect of immediate
eligibility on the 401(k) participation rate also apply here. As with 401(k) participation, it
appears that the 401(k) contribution rates of these two cohorts are very similar when measured at
the same level of tenure (and also when measured at different levels of tenure). Thus, immediate
eligibility appears to have little effect on either 401(k) participation or the 401(k) contribution
rate conditional on participation.
VII. 401(K) Savings: The Fund Allocation Decision
A final aspect of 401(k) savings considered in this paper is the allocation of 401(k)
contributions amongst the various fund options available to participants. At the study company,
9 funds are available for the majority of employees (executives participating and a supplemental
non-qualified savings plan have an additional 2 funds to choose from). Among the fund choices
are a money market fund, a bond fund, a stable value fund, a combination stock/bond balanced
fund, several stock mutual funds, and a foreign stock fund.
One simple aspect of the 401(k) fund allocation decision is the number of funds to which
individuals contribute. Figure 5 shows the distribution of the number of funds with positive
contribution allocations by cohort. Amongst the WINDOW, OLD and 3+ cohorts, between one-

19
quarter and one-fifth of employees choose either 1 fund, 2 funds or 3 funds. Only about 28% of
employees in these three cohorts divide their contributions between four or more funds.11 In
contrast, 85% of participants in the NEW cohort have their contributions allocated to only one
fund. As with the fraction of participants contributing at 3% in the NEW relative to the other
cohorts, the fraction of participants contributing to only one fund in the NEW relative to the
other cohorts cannot be explained entirely by a shift in the composition of participants due to the
substantial effects of automatic enrollment on 401(k) participation.
Table 7 gives some summary statistics on the allocation of contributions amongst the
various types of funds. Contributions have been aggregated into three broad categories: money
market, stocks (including the foreign stock mutual fund), and bonds. The one balanced fund
containing a mix of both stocks and bonds was divided between these two categories according
to the relative mix of stocks and bonds in the fund as communicated to employees (60% stocks,
40% bonds).
The last row grouping in Table 7 shows the average fraction of 401(k) contributions
allocated to the various fund categories. These numbers are also plotted in Figure 6, showing
quite starkly the difference in the savings behavior of the NEW cohort relative to the other
cohorts. For the NEW cohort, 80% of 401(k) contributions are allocated to the money market
fund, while only 16% of contributions go into stock funds. In contrast, the other cohorts allocate
roughly 70% of their 401(k) contributions to stock funds, with less than 10% earmarked for the
money market fund. There are also striking differences in the average fraction of contributions
allocated to the bond market, about 3% for the NEW cohort relative to about 20% for the other
cohorts.
The first four row groupings in Table 7 give more detail on what is driving the
differences in the average contribution allocation across cohorts just described. The first three
rows of Table 7 show the fraction of employees that have any of their fund balances in the
various fund types. Overall, about half of employees have some of their fund balances in the
money market, 71% have some of their fund balances in stocks, and 47% have some of their
fund balances in bonds. The WINDOW and OLD cohorts are much less likely to have any of
their balances in the money market (less than 20% of participants in these two cohorts), and
11 Fidelity Investments (1999) shows a roughly similar distribution for the number of funds with positive balances amongst the plan participants in the 5,000+ plans which Fidelity services.
20
much more likely to have any of their balances in stock funds (over 90% of participants). The
next three rows of Table 7 show the fraction of employees that have all of their fund balances in
a specific fund type. For the WINDOW and OLD cohorts, almost 40% of employees have all of
their fund balances invested solely in stocks. A much smaller fraction, about 6%, have all of
their balances in the money market, and only about 2% have all of their balances invested in
bonds.
In contrast, the distribution of fund balances of the NEW cohort is completely different
from that of the other cohorts: over 90% of the NEW cohort have some of their 401(k) balances
in the money market, and 75% have all of their fund balances in the money market.
Furthermore, only one-quarter of the NEW cohort has any 401(k) balances in the stock market,
and a mere 5% have all of their balances allocated to stock funds. These statistics in Table 7
confirm the emerging pattern from Figures 4, 5 and 6: the vast majority of NEW cohort 401(k)
participants have a contribution rate of 3% (Figure 4) that is invested in only one fund (Figure 5),
and that fund happens to be the money market fund (Table 7) which is the default fund under
automatic enrollment.
The third and fourth row groupings in Table 7 give the fraction of employees with any
contributions allocated to the various fund categories, and with all of their contributions allocated
to the various fund categories. The overall percentages are quite similar to those for the any and
only fund balances just described.
VIII. The "Default" Effect of Automatic Enrollment
The results summarized in Sections VI and VII suggest that an extremely important
consequence of automatic enrollment is that individuals unfortunately become passive savers--
the vast majority of 401(k) participants hired under automatic enrollment do nothing to move
away from the default contribution rate (3%) or fund allocation (100% in the money market
fund). How prevalent is this type of inertia in the 401(K) savings behavior of the NEW cohort of
employees who were subject to automatic enrollment?
In Table 8 we summarize what we call the 401(k) "default" rate: the fraction of
employees whose 401(k) savings behavior corresponds to the default under automatic
enrollment. In column 1, the "default" is defined as: (1) participation in the 401(k) plan at (2) a
3% contribution rate that is (3) invested 100% in the money market fund. The overall default
21
rate for the NEW cohort is 61%: six out of ten employees do nothing to change their savings
behavior from the default specified by the company if no other action is taken. The good news
about this high default rate is that it includes participation. Viewed in this light, at least 61% of
the NEW cohort have not opted out of the 401(k) plan (as shown in Table 5, the fraction of
employees who have elected not to opt out is actually much higher, at 86%). The bad news,
however, is that 61% of these employees have done nothing to increase their fairly low 3%
contribution rate or to reallocate their contributions away from the default money market fund.
For the sake of comparison, only 1% of the WINDOW, OLD and 3+ cohorts are participating in
the 401(k) plan at a contribution rate of 3% with 100% of contributions allocated to the money
market fund. Thus, almost all of the 61% default rate for the NEW cohort represents participant
inertia rather than a duplication of savings choices that many would have made regardless of the
default.
The second column of Table 8 calculates the default rate conditional on 401(k)
participation. In this case, "default" refers to a 3% contribution rate that is allocated 100% in the
money market fund. As would be expected, the default rate rises in column 2 relative to column
1. Conditional on participation, 71% of the NEW cohort 401(k) participants are at the default
contribution rate and fund allocation.
Table 8 also illustrates how the "default rate" varies by demographic characteristics. Men
have a lower default rate than women, older employees have a lower default rate than younger
employees, and the default rate declines quite significantly with compensation. For example,
74% of those earning less than $20,000 per year exhibit participant inertia relative to only 30%
of those earning between $70,000 and $79,000. In general, the default rate in columns 1 and 2 of
Table 8 varies inversely with the 401(k) participation rate of employees in the WINDOW cohort
as summarized in Table 5.
A third measure of default behavior is found in the 3rd column of Table 8. This measure
is the non-default participation rate: the fraction of employees who are participating in the
401(k) plan at a contribution rate other than 3% and/or who have allocated their contributions in
part or in whole to something other than the money market fund. Figure 7 illustrates the
correlation between the non-default participation rates of the NEW cohort at 3-15 months of
tenure with the participation rates of the WINDOW cohort also at 3-15 months of tenure for the
various demographic subgroups in Tables 5 and 8. As can be seen, these two participation rates
22
are quite highly correlated (the correlation coefficient is 0.94), although the non-default
participation rate of the NEW cohort tends to be less than the participation rate of the WINDOW
cohort with a similar length of tenure (that is, most all of the points in Figure 7 lie below the 45-
degree line). Thus, it appears that individuals who were inclined to save prior to automatic
enrollment are also more likely to change their savings behavior from the default under
automatic enrollment. That said, however, Figures 4-6 and Table 7 show that the default
contribution rate and investment allocation still predominate in the savings behavior of
employees hired under automatic enrollment.
IX. Explaining the Differences in 401(k) Savings Behavior
Thus far, this paper has documented two key differences in the savings behavior of
401(k)-eligible employees hired in the study company before and after the switch to automatic
enrollment:
1) 401(k) participation is much higher under automatic enrollment than when an affirmative enrollment election is required to participate.
2) The savings behavior of 401(k) participants hired under automatic enrollment is very different from that of participants hired under the old provisions of the 401(k) plan requiring an affirmative election. In particular, the majority of 401(k) participants hired under automatic enrollment maintain the default contribution rate (3%) and investment allocation (100% in the money market fund) even though this particular savings choice is made by less than 1% of employees hired prior to automatic enrollment.
From the perspective of an economist, these differences are particularly interesting because there
were no changes in the economic features of the 401(k) plan when automatic enrollment was
implemented: the range of allowable contribution rates did not change, the employer matching
provisions did not change, the investment options did not change, the loan and hardship
withdrawal provisions did not change. A natural question, then, is are there economic
explanations that can fully account for the differences in the 401(k) savings behavior of
employees hired before and after automatic enrollment even though the economic incentives
associated with 401(k) participation and savings behavior did not change.
23
Explaining the Differential 401(k) Participation Rates Before and After Automatic
Enrollment
The first issue we address is why there is such a dramatic difference in the 401(k)
participation rate of employees before and after automatic enrollment. Given no change in the
economic incentives for 401(k) participation, we might have expected the 401(k) participation
rates of newly hired employees to be the same under the old provisions of the 401(k) plan, which
required an affirmative election to participate, as under the new provisions of the 401(k) plan,
which require a negative election to opt-out. This issue can be framed in one of two ways: (1)
Relative to the 401(k) participation rate of newly hired employees under automatic enrollment,
why is the participation rate of employees hired before automatic enrollment so low? or (2)
Relative to the 401(k) participation rate of newly hired employees before automatic enrollment,
why don't more employees hired under automatic enrollment opt-out?
One explanation for the low participation rate of new hires in the absence of automatic
enrollment is that the process of optimally making a decision to participate in the 401(k) plan is a
complicated one. Studies by psychologists have shown that increasing the complexity of a
decision-making task leads individuals to defer making a decision, or, in the popular vernacular,
to procrastinate (Tversky and Shafir, 1992; Shafir, Simonson and Tversky, 1993). There are at
least two sources of complexity in making an optimal 401(k) participation decision. First, the
array of participation options to be evaluated by individual employees is immense. Individuals
must first choose what fraction of their compensation to contribute to the 401(k) plan, anything
from 1% to 15%. They must then choose how to allocate that contribution between the 9 fund
options that are available. There are, quite literally, an infinite number of alternatives available.
For some employees, a second source of complexity is learning how to evaluate the myriad of
401(k) options that are available. For example, young newly hired employees may not even
know what a "401(k)" plan is, or what a "mutual fund" is, or what the difference is between a
"money market fund" a "stable value fund" and a "small cap value stock fund".
In the absence of automatic enrollment, individuals may rationally postpone making a
decision on 401(k) participation even when ex post they would have preferred 401(k)
participation to non-participation. Why? Because the cost of gathering the information needed
to make a decision coupled with the complexity involved in evaluating the information may
exceed the short-run benefit from doing so. Automatic enrollment decreases the complexity of

24
the 401(k) participation decision by decoupling the participation decision from the investment
decision. The initial participation decision is simplified from one that involves evaluating a
myriad of options to a simple comparison of two alternatives: non-participation (consumption or
saving outside of the 401(k) plan) vs. a 3% 401(k) contribution, with a 50% employer match
after one year, that is allocated 100% to the money market fund.
One piece of evidence that is consistent with procrastination as an explanation for the
lower 401(k) participation rates of employees prior to automatic enrollment is that, as Figure 3
shows, 401(k) participation rises quite dramatically with tenure for those employees hired prior
to automatic enrollment. As employees have more time to become financially literate, to gather
information on the details of the 401(k) plan, and to evaluate the options that are available, we
would expect to see increases in 401(k) participation such as those shown in Figure 3.
Moreover, although not shown, the increase in 401(k) participation with respect to tenure is
greatest for younger employees, and is particularly large for those under age 30. We would
expect general 401(k) literacy to increase with age as individuals accumulate direct experience
making 401(k) participation decisions at previous employers or jointly with a spouse in
conjunction with his or her job. Similarly, overall financial literacy should likewise increase
with age and life experience. The steeper 401(k) participation gradient with respect to tenure for
younger individuals is consistent with this type of financial learning by doing.12
Another piece of evidence that is consistent with procrastination as an explanation for the
lower 401(k) participation rates of employees hired prior to automatic enrollment is the income
gradient with respect to 401(k) participation. As column 1 of Table 5 shows, higher income
individuals have a high participation probability prior to automatic enrollment, while lower
income individuals have a very low participation probability. The cost of putting off the task of
making an optimal 401(k) participation decision prior to automatic enrollment is the foregone tax
benefit associated with 401(k) participation, which increases with income, and the value of the
employer match (after one year of employment), which also increases with income. Thus, in
weighing the costs and benefits of deferring the 401(k) participation decision, the costs are larger
12 Note that there are factors other than procrastination that can account for the increase in 401(k) participation with respect to tenure under the old provisions of the 401(k) plan, and for a steeper tenure-related 401(k) participation gradient with respect to age. Liquidity constraints that become less binding with time as individual incomes increase would also lead to the tenure-related increases in 401(k) participation just described. Thus, the increase in 401(k) participation with respect to tenure, and the slope of the tenure gradient with respect to age, are consistent with both decision avoidance and with liquidity constraints.
25
for high income individuals while the benefits are arguably the same because the number of
401(k) participation options does not vary with respect to income.13
As noted earlier, a second way of thinking about the difference in the 401(k) participation
rates of employees before and after automatic enrollment is to consider why the 401(k)
participation rate under automatic enrollment is so high. If the 401(k) participation rates prior to
automatic enrollment are taken as representative of the optimal allocation of income between
consumption and savings, then why don't more individuals opt-out of 401(k) participation under
automatic enrollment?
One answer is that automatic enrollment has no impact on the allocation of income
between savings and consumption because the incremental 401(k) savings of individuals who
would not have been 401(k) participants in the absence of automatic enrollment is merely a
reallocation of assets from other savings vehicles. Indeed, there is a contentious debate within
the economics profession over this exact issue--whether 401(k) savings in general represents
"new" savings, or relabeled "old" savings (see Poterba, Venti and Wise, 1996 and 1998, and
Engen, Gale and Scholz, 1995 and 1996, for the two sides of this debate, and Hubbard and
Skinner, 1996 and Bernheim, 1997 for a discussion of the debate). If individuals are merely
reshuffling their assets, then there is an entire range of 401(k) participation rates that could be
consistent with individual optimization.
One piece of evidence that is inconsistent with the notion that the higher 401(k)
participation rate under automatic enrollment is driven by a reshuffling of other assets is that
participation in the only other savings vehicle offered by the company, the employee stock
purchase plan (ESPP),14 is completely unaffected by the switch to 401(k) automatic enrollment.
The ESPP participation rate is around 18% for employees of both the NEW and the WINDOW
cohort with 3-15 months of tenure, and the average ESPP contribution rate is just shy of 5% for
both groups. Prior to automatic enrollment, almost one-third of ESPP participants in the
13 Higher income individuals could, of course, have a higher time cost of money which would impart a higher benefit to procrastination as well. 14 Participation in the employee stock purchase plan (ESPP) entails an elective payroll deduction of between 1% and 10% of compensation that is used to used to purchase the stock of the study company. In contrast to 401(k) contributions, ESPP contributions are not tax deductible. The value of ESPP participation is derived from the fact that shares in the company are purchased at a 15% discount and that, if held long enough, the stock appreciation is taxed at capital gains rates rather than ordinary income tax rates.
26
WINDOW cohort were not enrolled in the 401(k) plan.15 It does not appear, however, that
automatic enrollment transformed these ESPP-only participants under the old provisions of the
401(k) plan into 401(k)-only participants under automatic enrollment. Rather, these employees
appear to have become joint ESPP/401(k) participants under automatic enrollment with little or
no change in their ESPP contribution rate.
Unfortunately, lacking information on the other assets of employees at the study
company, we cannot definitively rule out the possibility that the differential 401(k) participation
rate before and after automatic enrollment is driven by reallocated non-ESPP savings. However,
given the substantial costs associated with saving outside of a 401(k) plan when a 401(k) plan is
available, it seems unlikely that the much lower participation rates prior to automatic enrollment
could have been optimal: if individuals had significant other assets prior to automatic
enrollment, they should have been reallocating them to the 401(k) in the first place in order to
take advantage of the tax benefits and the employer match.
Another explanation for the higher 401(k) participation rates under automatic enrollment
is, once again, procrastination. In this case, the story is that individuals may in fact prefer
consumption (non-participation) to saving, but they postpone the action of opting out of the
401(k) plan. There are two arguments that contradict this notion that many of the 401(k)
participants under automatic enrollment would in fact prefer non-participation to participation
but have procrastinated the decision to opt-out. First, the decision to opt-out of the 401(k) plan is
not a complicated one--it simply involves a comparison of non-participation to the default under
automatic enrollment. Thus, there is no compelling rationale to defer making this decision.
Moreover, in the short-run, to the extent that individuals would prefer consumption to savings,
postponing this decision is costly because liquidating 401(k) assets entails the normal payment of
income taxes plus an additional 10% tax penalty for early withdrawal of 401(k) balances. Over
the long-run, the value of the employer-match along with the deferral of income tax payments
may more than offset the 10% tax penalty, but if individuals had this type of long-term
consumption horizon, then, once again, participating in the 401(k) and withdrawing the balances
early would have been the optimal strategy prior to automatic enrollment. The second and more
15 It is actually a bit of a puzzle why employees would choose to contribute to the ESPP plan without first contributing to the 401(k) plan, as the tax deductibility of 401(k) contributions coupled with the employer match are likely to make the 401(k) a better investment option than the ESPP. The complexity of the 401(k) participation decision relative to the ESPP participation decision may explain part of this anomaly.
27
compelling argument against the notion that many 401(k) participants under automatic
enrollment are simply postponing the act of opting out is that there is no evidence that
individuals hired under automatic enrollment are in fact more likely to opt out of the 401(k) plan
over time: the 15% of employees that opt-out do so in the first month of employment. After one
month, the 401(k) participation rate of employees hired under automatic enrollment remains
fairly constant at around 85%.
A third explanation for the higher participation rates under automatic enrollment is that
once individuals have become 401(k) participants, they may actually value 401(k) participation
more than they would have valued it as non-participants--an "endowment" effect (Thaler, 1980).
Many studies have documented this effect--that individuals value commodities more as owners
than they would as prospective owners (Kahneman, Knetsch and Thaler, 1991). In economic
jargon, an individual's willingness to accept remuneration in exchange for giving up something
already owned far exceeds an individual's willingness to pay for the same item if it is not already
owned. In theoretical terms, the endowment affect is driven by an assumed asymmetry in the
way individuals perceive losses and gains relative to the status quo--in particular, losses from the
reference point are weighted much more heavily than are gains. Thus, when comparing an
alternative that involves equivalent gains and losses relative to what an individual already has,
the losses will be more heavily weighted, and this will lead the individual to prefer "the bird in
the hand." For automatic enrollees, the gain from opting out is increased current consumption,
while the loss is reduced retirement savings. The endowment effect will lead individuals under
automatic enrollment to place greater weight on the loss in retirement saving than would
individuals contemplating 401(k) participation under the old plan provisions. Thus automatic
enrollment, by conferring ownership of a 401(k) savings account on individuals who would
otherwise not have participated, may actually increase the value that these individuals place on
saving.
A final explanation for the differential 401(k) participation rates under automatic
enrollment is the framing of 401(k) participation. Prior to automatic enrollment, the default is
non-participation, while under the automatic enrollment, the default is participation. A growing
body of research has documented the effects of such types of framing on individual choices. For
example, Johnson et al. (1993) describe the effects of recent legislative changes in automobile
insurance laws in New Jew and Pennsylvania. Both states enacted laws to give motorists the
28
option of purchasing a lower cost insurance policy with restricted, rather than full, rights to sue.
In New Jersey, however, the law was implemented so that policies with restricted rights are the
default although motorists can acquire the full right to sue at additional cost, while in
Pennsylvania, the law was implemented so that the full right to sue is the default, but motorists
can reduce their premiums by relinquishing some of these rights. Johnson et al. note that the
actual fraction of insurance policies with full rights to sue are dramatically different in the two
states--20% in New Jersey, vs. 75% in Pennsylvania. They attribute these differences to the
choices in New Jersey and Pennsylvania about which type of policy would be the default. This
anecdote suggests that the impact of framing on decisions can be large indeed. The differential
401(k) participation behavior before and after automatic enrollment would certainly not be
inconsistent with this type of a framing effect.
Overall, we have given five explanations for the differences between the 401(k)
participation rates before and after automatic enrollment: procrastination of the decision to
participate in the 401(k) plan prior to automatic enrollment, procrastination of the decision to
opt-out of the 401(k) plan after automatic enrolment, a reshuffling of assets into the 401(k) plan
after automatic enrollment, an endowment affect associated with 401(k) participation after
automatic enrollment, and the framing of 401(k) participation as the default under automatic
enrollment. Which of these explanations are the most important in explaining the 401(k)
participation differences? Based on the discussion above, we believe that there is little evidence
that the higher 401(k) participation rate under automatic enrollment is driven by a reshuffling of
other assets into the 401(k) plan or by procrastination of the decision to opt-out of the 401(k)
plan. In our opinion, the most important effect is procrastination of the decision to participate in
the 401(k) plan before automatic enrollment. The fact that individuals don't opt-out of the
401(k) plan over time under automatic enrollment suggests that individual would in fact prefer to
save through the 401(k) plan, as does the increasing 401(k) participation rate with respect to
tenure prior to automatic enrollment. While the first fact is also consistent with the effects of
framing or an endowment effect, the latter is not. On the other hand, procrastination of the
401(k) participation decision prior to automatic enrollment is consistent with both of these facts.
We do, however, find some evidence of endowment and/or framing effects in the fact that 401(k)
participation under automatic enrollment is higher than that achieved prior to automatic
enrollment even at very high levels of tenure.
29
Explaining the Differential Savings Behavior Before and After Automatic Enrollment
The second anomaly documented in this paper is the dramatic difference in the savings
behavior of 401(k) participants before and after automatic enrollment, and, in particular, the
substantial mass of participants after automatic enrollment who remain at the default even
though this allocation is chosen by almost no one prior to automatic enrollment. Since the
switch to automatic enrollment at the study company did not entail any changes in the savings
options available to 401(k) participants, we might have expected the savings behavior of newly
hired 401(k) participants to be the similar before and after automatic enrollment.
As with the differential participation rates under the Old and the New 401(k) Plan, one
explanation for the default savings behavior observed under automatic enrollment is
procrastination of the investment reallocation decision. In order for individuals to change their
investment allocation under automatic enrollment, they must first decide that the default is not
the optimal savings strategy, and then they must determine what their optimal savings strategy is.
As already noted, this is a complex decision. We have already cited the evidence that individuals
tend to defer making decisions as they become more complicated. One variant of this type of
behavior is that individuals have a greater tendency to stick with the status quo (when one is
available) as decisions become more complicated (Tversky and Shafir, 1992; Shafir, Simonson
and Tversky, 1993; Redelmeier and Shafir, 1995; Samuelson and Zeckhauser, 1988). Thus, the
default savings behavior observed under automatic enrollment is likely to result, in part, from
complexity-induced procrastination.
If it is the difficulties inherent in making a complicated decision that are driving the
default savings behavior of 401(k) participants under automatic enrollment, then we ought to see
that over time, as individuals have time to learn about and evaluate their savings options, the
likelihood of being at the default should fall. And indeed, it does. Figure 8 shows that the non-
default 401(k) participation rate under automatic enrollment increases dramatically, from 7% to
37%, over the first 15 months of employment.16 Thus, given some time, many individuals do
appear to recognize that the automatic enrollment default is not their optimal savings strategy,
16 Interestingly, the non-default participation rate increases at a fairly steady rate from the first month of employment. It does not appear that the incidence of match-eligibility at 1 year of service is the factor that precipitates a change in the savings behavior of individuals under automatic enrollment.
30
and they opt to change their contribution rate and/or their investment allocation. Nevertheless,
even after 15 months, over half of the 401(k) participants hired under automatic enrollment are at
the default.
With only a little more than one year's worth of data subsequent to the switch to
automatic enrollment, it is difficult to say whether the default savings behavior of 401(k)
participants hired under automatic enrollment will continue to dissipate, and if so, how long the
process will take. The trend over the first year is both encouraging and discouraging. After 15
months, the fraction of 401(k) participants hired under automatic enrollment who are at the
default declines substantially, from 92% to 57%. However, after 15 months, over half of them
are still at the default.
O'Donoghue and Rabin (1998) propose a model of savings behavior that might give
cause for concern about the 57% of 401(k) participants still at the default even after a year. In
their model, they show that under certain conditions (specifically, naï veté about time-
inconsistent preferences), individuals may never reallocate their portfolios away from poor-
performing investments even when the transactions costs of doing so are relatively small. These
individuals continue to persist in their belief that they will find a better allocation and change
their portfolio tomorrow, but when tomorrow comes they decide to put the task off for another
day, and so on, for days, months, and years on end, always believing that tomorrow is the day
they will change their portfolio, yet each day putting things off until another tomorrow.
Another factor that may explain the high fraction of automatic enrollees who exhibit
default savings behavior is the status quo bias. In a series of decision-making experiments,
Samuelson and Zeckhauser (1988) show that individuals choose to stick with the status quo a
disproportionate share of the time when one of the alternatives is framed as the status quo
relative to situations in which none of (the same) alternatives is represented as the status quo.
Samuelson and Zeckhauser give three broad explanations for the presence of a status quo bias.
The first is that it may be rational to stick with the status quo when there are transaction costs
involved in switching to another alternative. In the case of 401(k) savings behavior, the
transaction costs are two-fold: (1) learning about and evaluating the various saving options, and
(2) implementing a desired change. This explanation for a status quo bias will result in the type
of procrastination that we have already discussed--as individuals learn about better investment
31
alternatives, the transaction costs involved in making a change are reduced and individuals will
begin to move away from the default.
A second explanation given for the status quo bias is what Samuelson and Zeckhauser
label broadly as cognitive misperceptions. One example of this is the endowment effect, already
discussed in the context of 401(k) participation. The endowment effect could certainly explain a
preference for the default over other investment options under automatic enrollment just as it can
explain a preference for 401(k) participation under automatic enrollment. Samuelson and
Zeckhauser give another example of cognitive misperception that seems particularly relevant in
the context of the 401(k) investment allocation process. They note that when faced with a
complicated array of decision options, a reasonable strategy to pursue is to reduce the choice set,
ignoring some options altogether. But individuals are unlikely to completely dismiss the default,
because it is the only option with which they have any direct experience. So, in a complicated
decision, the default will assume an asymmetric position in the decision-making process relative
to the other outcomes, and consequently, will be more likely to be picked as the chosen
alternative.
The third explanation given by Samuelson and Zeckhauser for the status quo bias, that of
psychological commitment associated with the initial choice, is not particularly relevant in the
context of default savings behavior as this explanation presumes that the individuals have made
the initial choice that defines the status quo--this is clearly not true in the case of the automatic
enrollment default, something chosen by the company rather than by individual 401(k)
participants.
Using actual data on individual choices (as opposed to responses to hypothetical
scenarios) Samuelson and Zeckhauser (1988) and Schweitzer, Hershey and Asch (1996)
document status quo bias in the benefits elections of employees with respect to various types of
employee benefits. The results in this paper certainly support the conclusions of these two
previous studies.
Are procrastination of the portfolio reallocation decision and status quo bias the only
factor that explain the differential savings behavior of 401(k) participants under automatic
enrollment? If so, then we ought to see similarities between the savings behavior of individuals
hired under automatic enrollment who reject the default and that of 401(k) participants in earlier
cohorts not subject to automatic enrollment. Is this the case? Figure 9A shows the distribution
32
of 401(k) contribution rates for plan participants by cohort, essentially replicating Figure 4A only
with the addition of a separate set of bars for non-default members of the NEW cohort. As can
be seen, the distribution of contribution rates for the non-default participants of the NEW cohort
looks more like the distribution of contribution rates for the other cohorts than does that of the
entire NEW cohort. However, there are still some interesting differences. The non-default
participants of the NEW cohort are somewhat more likely to have a 15% contribution rate than
are participants of the other cohorts. This is not surprising--we might expect that those
employees who have the strongest incentive to move away from the default under automatic
enrollment are those whose preferred 401(k) contribution rate and investment allocation is most
different from the default. Those individuals who have a strong desire to contribute 15% of the
compensation to the 401(k) plan should have the strongest incentives to move away from the
default. But, the non-default participants of the NEW cohort are still somewhat more likely to
have a 3% contribution rate than are participants of the other cohorts. These are employees who
have elected to change their 401(k) contribution allocation away from the default money market
fund but who have nonetheless maintained the default contribution rate of 3%. That a higher
fraction of non-default participants are at a contribution rate of 3% than are participants in other
cohorts suggests that the default is coloring the savings behavior of employees hired under
automatic enrollment even when employees reject the default.
Figure 9B shows the distribution of the number of funds with positive balances for non-
default members of the new cohort relative to the other cohorts. Once again, the distribution of
the number of funds with positive balances for non-default participants of the NEW cohort looks
more like the distribution for the other cohorts that does that of the entire NEW cohort. But, the
non-default participants of the NEW cohort are still much more likely to have their fund balances
invested in only one fund than are members of other cohorts, and they are less likely to have
their fund balances invested in two, three, or four funds. As Table 9 shows, this is the result of
non-default participants changing their contribution rate but maintaining the default investment
allocation of 100% in the money market fund. Non-default 401(k) participants under automatic
enrollment are more likely to be invested in the stock market and less likely to be invested in the
money market than are the NEW cohort taken as a whole. But they are, nonetheless, about five
times more likely to have all of their 401(k) funds invested in the money market than are
members of the WINDOW or OLD cohorts (30% vs. about 6%). This also provides evidence
33
that the default colors the savings behavior of 401(k) participants even when they reject the
default.
Figures 9A, 9B and Table 9 suggest that procrastination and the status quo bias cannot
account for all of the differential savings behavior observed among automatic enrollees: those
401(k) participants hired under automatic enrollment who have changed their contribution rate
are still much more invested in the money market than their non-automatic-enrollment
counterparts, and those 401(k) participants hired under automatic enrollment who have changed
their investment allocation are more likely to have a contribution rate of 3% than their non-
automatic-enrollment counter parts. Thus, non-default 401(k) participants under automatic
enrollment appear to have some tendency to retain aspects of the default.
One explanation for the fact that even non-default 401(k) participants under automatic
enrollment appear to be more heavily invested in the money market fund, despite having
undertaken the transactions costs of changing their 401(k) contribution rate and presumably
having undergone the complex process of evaluating their "optimal" savings decision, is that
employees view the default investment allocation under automatic enrollment as implicit advice
from the company on "the best" allocation of one's retirement assets. There is one particularly
telling piece of evidence on this front. Figure 10 shows the asset allocation behavior of 401(k)
participants by cohort based on when they initially became 401(k) participants. Individuals in
the 3+, WINDOW and OLD cohorts who became plan participants before the switch to
automatic enrollment for new employees have a low probability of having any balances in the
money market fund or of having all of their contributions allocated to the money market fund. In
contrast, individuals belonging to these cohorts (none of whom was subject to automatic
enrollment) who delayed plan participation until after the switch to automatic enrollment are
much more likely to have some of their balances allocated in the money market fund and to have
all of their balances allocated to the money market fund. In fact, in terms of investment
behavior, they look very similar to the non-default participants hired under automatic enrollment.
Given that the individuals in these older cohorts had to actively choose their investment
allocation since they were not subject to automatic enrollment, the most plausible explanation for
their investment behavior appears to be that the default investment allocation is taken as advice
by at least some of the employees.
34
Another explanation for the relative predominance of the money market fund and a 3%
contribution rate, even among non-default 401(k) participants hired under automatic enrollment,
is a cognitive misperception called anchoring (Tversky and Kahneman, 1974). In some decision-
making contexts, individuals may use an initial starting value as a reference point from which
they then make adjustments. Numerous studies have shown that while individuals tend to move
in the right direction away from their initial reference point (in the case of decisions that have a
right or a wrong answer), their adjustments tend to be incomplete (Plous, 1993; Mussweiler and
Strack, 1999). So, for example, if asked to determine the selling price for a house, respondents
will give an answer that is too high if they are given a reference point that is higher than the
actual selling price, and a price that is too low if they are given a reference point that is lower
than the actual selling price (Northcraft and Neale, 1987). In the absence of automatic
enrollment, there is no reference point for the investment allocation, and a likely reference point
for the 401(k) contribution rate is 6%, the point at which the employer match is maximized.
Under automatic enrollment, however, the primary reference point is clearly the default.
Anchoring could help explain: (1) why the predominant contribution rate before automatic
enrollment is 6%; (2) why the predominant contribution rate for automatic enrollees is 3%; (3)
why a 3% contribution rate is more likely to be chosen by non-default 401(k) participants hired
under automatic enrollment than by participants hired prior to automatic enrollment; (4) why the
money market fund is the predominant allocation option for employees hired under automatic
enrollment; and (5) why the money market fund is still such a common fund choice even
amongst non-default 401(k) participants hired under automatic enrollment.
We have discussed four explanations for the differential savings behavior of 401(k)
participants hired before and after automatic enrollment: procrastination of the contribution rate
and portfolio reallocation decision on the part of automatic enrollees, the effect of the status quo
bias in preserving the default amongst automatic enrollees, the presumption amongst automatic
enrollees (and potentially amongst employees hired prior to automatic enrollment as well) that
the default represents investment advice on the part of the company, and the effect of the default
in anchoring the savings decisions of 401(k) participants under automatic enrollment so that they
retain aspects of the default even when making changes in their contribution rate or portfolio
allocation. The substantial decline over time in the fraction of automatic enrollees who are at the
default certainly suggests that procrastination is an important determinant of the savings behavior
35
of automatic enrollees, at least in the short term. Whether the substantial fraction of participants
who remain at the default even after a year is a result of more severe procrastination (which
would be evidenced by further declines in the default rate) or by a severe status quo bias (which
would be evidenced by further persistence in the default rate) remains to be seem.
Amongst 401(k) participants hired under automatic enrollment who have made some
change in their savings behavior, we find evidence of both advice effects and anchoring. Figure
10 clearly shows evidence of what seems to be an advice effect--401(k) participants in the
WINDOW and OLD cohorts who did not initiate 401(k) participation until after the switch to
automatic enrollment should not have been affected by the anchoring or status quo effects of the
default. The differences between the money market allocation of non-default automatic
enrollees and the WINDOW and OLD cohorts in Table 9, on the other hand, are likely to result
both from advice effects and anchoring effects. Our assessment of the relative magnitudes of the
advice effects in Figure 10 and the advice+anchoring effects in Table 9 leads us to believe that
the advice and anchoring effects are about equally important in explaining the money market
investments in excess of other cohorts of the non-default NEW cohort 401(k) participants. And
clearly, if the advice effects are important in explaining the savings behavior of non-default
401(k) participants in the NEW cohort, they could be an important explanation in the default
savings behavior of this entire cohort as well.
X. The Implications of Employee Inertia on 401(k) Savings: A Simulation
What is the long-run impact on retirement savings of the savings behavior generated by
automatic enrollment that has been documented in this paper? To gauge the impact of default
savings behavior on the eventual savings available for retirement, we simulate the future fund
balances of all 401(k)-eligible employees as of June 30, 1999 who were hired in the previous
year under both the provisions of the old 401(k) plan, and under the new 401(k) plan features
with automatic enrollment and immediate eligibility.
This simulation requires several things, which we discuss in turn:
§ Predicting future compensation
§ The probability of 401(k) participation both before and after automatic
enrollment over time
§ The contribution rate of 401(k) participants
36
§ The allocation of contributions between various fund classes
§ A distribution of future returns for various fund classes.
Future compensation. To predict future compensation, we first run a regression of total
pay on age, tenure and other demographic characteristics. We then use the regression to predict
current compensation and future compensation (based on changes in age and tenure), and use
these predictions to calculate a growth profile of future compensation relative to current
compensation. We then apply this growth profile to the actual current compensation of the most
recent annual cohort of newly hired employees to generate a 20-year compensation profile for
these employees.
401(k) participation. Under automatic enrollment we give each individual a 401(k)
participation probability of 85%. Participation in the first period is then invariant--first period
non-participants are assumed to always be non-participants, while first-period participants are
always future participants. Under the old plan provisions, there are no 401(k) participants in the
first period (there is a one-year service requirement for eligibility). In the second period, we give
each individual a probability of participation that varies according to age and pay category, with
the actual probability corresponding to the empirical distribution of participation across these
categories. Individuals who become participants in the second period are assumed to always be
participants in all future periods. Second period non-participants have a transition probability of
becoming participants in the next and subsequent periods. This transition probability varies by
age and pay category, and also by tenure. As with second period participants, individuals who
become participants in subsequent periods are assumed to remain participants in all periods in
the future.
Contribution rate. Participants are assigned a contribution rate that is drawn from the
probability distributions in Figure 4A. We use one distribution under automatic enrollment
corresponding to the NEW cohort, and another distribution prior to automatic enrollment,
corresponding to the WINDOW, OLD and 3+ cohorts in Figure 4A. We assume that the
contribution rate does not change over time.
Contribution allocations. We assign individuals a contribution allocation that is drawn
from a distribution of 11 contribution allocations that we derive by aggregating the actual
contribution allocations of 401(k) participants. Each of the 11 contribution allocations gives a
different percentage allocation of 401(k) contributions to the money market, stocks and bonds.
37
Two separate allocation distributions are derived for the new and old provisions of the 401(k)
plan, taken from the experience of the NEW cohort, and the WINDOW, OLD and 3+ cohorts
respectively. In both cases we assume that the contribution allocation, like the contribution rate,
is fixed over time.
Future returns. We draw a joint rate of return for the money market, stocks, and bonds
from the historical distribution of actual returns for these three broad categories from 1926-1997.
A new joint return is drawn in each period of the simulation, but the same joint return is applied
to both the simulation of fund balances under automatic enrollment and the simulation of fund
balances under the old provisions of the 401(k) plan in each period.
After generating a stream of future compensation and 401(k) participation rates and
drawing a contribution rate and fund allocation from their respective distributions, we then
calculate a 401(k) balance for each period that is divided between the money market, stocks, and
bonds. In the initial period, the various fund balances equal the initial contribution allocation. In
subsequent periods, future fund balances equal the new contribution plus the fund balance from
the previous period grossed up (or down) by the appropriate investment return drawn from the
distribution of returns. The total 401(k) fund balance in each period equals the sum of the three
component balances. We simulated 401(k) fund balances 20 periods into the future and repeated
the simulation 100 times.
Table 10 provides some summary statistics on the variation in the participation rates and
fund balances derived from the simulation. Under the old provisions of the 401(k) plan, the
401(k) participation rate increases with tenure in a manner very similar to that actually observed
for employees hired prior to automatic enrollment. There is some distribution in participation
probabilities across the various replications of the simulation, but overall the range of
participation probabilities is fairly narrow. Under automatic enrollment, the mean and median
participation rate are both about 85%, and this is assumed to be constant across all periods in the
simulation.
There is substantially more variation in the simulated distribution of fund balances by
period, and this variation increases for time periods further into the future. This reflects the
inherent uncertainty in predicting future returns from historical data when there is wide variation
in historical returns, especially in the stock market. The variation in fund balances is much
greater under the old provisions of the 401(k) plan than under the new plan features. This
38
reflects the dramatically different distribution of asset allocations under the two plans. Under
automatic enrollment, the vast majority of contributions are directed into the money market fund
where there is much less variation in returns than is the case for stock funds which is where
contributions are primarily invested prior to automatic enrollment.
Table 11 shows the median average fund balance from the 100 simulations for each of
the 20 periods, along with the number of periods in which fund balances under the old plan
provisions exceed those under automatic enrollment at various percentiles in the fund balance
distribution. One particularly interesting thing to note is that by period 4 and in all subsequent
periods, the median average fund balance under the old plan provisions exceeds that under
automatic enrollment. This is despite the fact that participation is still lower under the old plan
provisions than under automatic enrollment in year 4 (and in all periods), and despite the fact
that there are no contributions under the old plan provisions in year one. This illustrates how
important the effects of default savings behavior are on future fund balances. By year 4, a
relatively short time span, total fund balances tend to be greater under the old plan provisions
than under automatic enrollment because, despite a lower participation rate, individuals who do
participate contribute at a much higher level and consequently receive greater matching
contributions from the company, and they also invest their money in ways that achieve higher
average returns.
While the old plan provisions appears to generate higher aggregate savings after 4 years,
the effect of automatic enrollment on the savings of any individual employee is not necessarily
greater. For those wishing to promote savings, a great virtue of automatic enrollment is that it
dramatically increases the 401(k) participation rate so that many would-be non-participants, who
would have previously had zero fund balances, now have positive fund balances. At the 10th
percentile of the fund balance distribution, the fund balance is still $0 under both the old and the
new plan provisions because under neither plan does the simulated participation rate ever exceed
90%. At the 25th percentile, however, there is always participation under automatic enrollment,
and participation under the old plan provisions with sufficient tenure. The median fund balances
at the 25th percentile of the fund balance distribution are graphed in Figure 11A. It is not until
the 19th period that the median fund balance under the old plan provisions exceeds that under
automatic enrollment. Thus, automatic enrollment appears to increase the savings of employees
at least through the 25th percentile of the income distribution at short and even moderate time
39
horizons. Table 11 shows that it is not until period 13 that any of the simulated fund balances
under the old plan provisions at the 25th percentile exceed those under automatic enrollment, and
not until the 18th period that more than half do so.
As Figure 11B shows, at the 50th percentile of the fund balance distribution, balances
under the old plan provisions tend to overtake balances under automatic enrollment at year 6, and
as Table 11 shows, by year 6 virtually all of the simulations have fund balances at the 50th
percentile under the old plan provisions exceeding those under automatic enrollment. By year
20, the median fund balance at the 50th percentile under the old plan provisions is more than
double that under automatic enrollment.
At higher percentiles in the fund balance distribution (the 75th percentile is shown in
Figure 11C), the story is similar: balances under the old plan provisions quickly overtake
balances under automatic enrollment, and by 5 or 6 years out are almost always higher. By 15-
20 years out, there is also quite a sizeable difference in the median total fund balances under the
old and new plan provisions, with balances under the old provisions at least doubling, if not
almost tripling those under automatic enrollment.
Overall, the simulation results suggest that from an aggregate perspective, "default"
savings behavior will lead to lower total 401(k) savings after only a few years relative to more
traditional 401(k) plans. Employees in the lower percentiles of the savings distribution appear to
benefit from automatic enrollment, however, because it turns non-participants into participants
and hastens the participation of others. At higher percentiles in the fund balance distribution,
however, "default" behavior works to the detriment of plan participants by anchoring them to
lower contribution rates and low-return investment allocations.
One word of caution in the interpretation of these simulations is in order, and that is that
the simulations assume that there is no change over time in the "default" behavior of 401(k)-
eligible employees hired under automatic enrollment, an assumption that we have already shown
is not true--401(k) participants hired under automatic enrollment do move away from the default
over time, but certainly not immediately. Thus, the simulations present a worst-case scenario. If
employees hired under automatic enrollment do move away from the default over time,
increasing their contribution rate and adopting a more aggressive investment strategy, then the
difference between the fund balances under the Old and the New plans will naturally be
mitigated over time. If, however, the move away from the default happens slowly, or
40
incompletely, or if the default continues to influence the savings behavior of 401(k) participants
either through advice or anchoring effects, then the simulations may still be a fairly good
indication of the likely effects of automatic enrollment on 401(k) savings.
XI. Conclusions
This paper has documented significant changes in the 401(k) savings behavior of
employees in a large U.S. corporation before and after a switch to automatic enrollment, even
though none of the economic features of the 401(k) plan changed. There are two key findings:
first, 401(k) participation is significantly higher under automatic enrollment; second, the default
contribution rate and investment allocation chosen by the company under automatic enrolment
have a strong influence on the savings behavior of 401(k) participants. We explore a variety of
explanations for these results, almost all of which point to the notion that economically
significant changes in savings behavior can be motivated simply by the "power of suggestion."
The "suggestion" of 401(k) participation through automatic enrollment leads to a large increase
in the 401(k) participation rate. The "suggestion" of a 3% contribution rate through the
automatic enrollment default leads to a dramatic shift in the distribution of contribution rates
among plan participants, away from 6% and higher contribution levels to exactly 3%. And the
"suggestion" of the money market fund as the default fund allocation leads to a substantially
more conservative investment portfolio, one dominated by the money market fund rather than by
stocks.
While we discuss a variety of economic and non-economic explanations for these results,
further research is necessary to disentangle the importance of these various factors on the savings
behavior of employees. It is important, however, to understand why we observe such dramatic
differences in savings behavior, even when the economic incentives to save appear to be the
same, because the reasons underlying the behavioral differences will inform the discussion of
how best to create savings incentives. For example, if procrastination either in 401(k)
participation or investment reallocation results from the complexity of making an optimal
savings decision, then the right response is to find ways to make the savings decision less
complicated, perhaps by offering a menu of popular options. Alternatively, if procrastination
results from employees having inadequate information, or if employees take the automatic
41
enrollment default as investment advice, then a more appropriate response is investment
education.
In addition to speaking more generally to the issue of what motivates individuals to save,
this paper also speaks specifically to the economic effects of automatic enrollment as a way to
encourage 401(k) participation. Automatic enrollment appears to be a win-lose approach to
changing 401(k) savings behavior. The win aspect is that automatic enrollment dramatically
increases 401(k) participation, with particularly large effects among the groups who would
otherwise tend to have the lowest participation rates (blacks and Hispanics, the young, and those
with lower compensation). Automatic enrollment also serves to partially equalize participation
differences with respect to gender, race/ethnicity, age and compensation. The lose aspect of
automatic enrollment is that it generates a tremendous amount of participant inertia. The vast
majority of plan participants stick with the default contribution rate and investment allocation,
even though only a tiny fraction of participants not subject to automatic enrollment voluntarily
choose that particular allocation within this company.
To turn automatic enrollment from a win-lose proposition to a win-win proposition,
employers must find ways to move employees into higher contribution rates and more aggressive
investment strategies. One approach would be participant education. Another approach,
suggested by the favorable aspects of automatic enrollment, would be to improve the default,
either initially or over time. One concern of plan administrators with increasing the initial
contribution rate is that this may induce employees to opt-out of 401(k) participation, and just as
there is participant inertia, there is non-participant inertia as well. A viable alternative may be to
initially automatically enroll employees at a low contribution rate, but automatically increase the
contribution rate in small increments in the future. While employers may be wary of choosing
default fund allocations that are too aggressive because of the potential negative repercussions of
doing so if returns fall or are negative, alternatives to very conservative investment choices
should at least be considered.
The results discussed in this paper also have implications for the design of public policies
to encourage saving. For example, the results in this paper suggest that if Social Security reform
were to include the adoption of wholly or partially self-directed individual accounts, a substantial
fraction of individuals would end up at the default plan specified by the Social Security

42
administration or legislated by Congress. In this case, getting the default "right" could have a
tremendous impact on the distribution of retirement savings available to individuals.
Overall, this paper raises far more interesting and important questions than it answers.
We hope that the results documented in this paper will generate further research into the issue of
what motivates individual savings behavior.

43
References
Akerlof, George A. (1991). "Procrastination and Obedience." American Economic Review
Papers and Proceedings, 81 (May): 1-19. Andrews, Emily S. (1992). "The Growth and Distribution of 401(k) Plans," in John Turner and
Daniel Beller, eds. Trends in Pensions 1992 (Washington, DC.: U.S. Department of Labor, Pension and Welfare Benefits Administration), 149-176.
Bassett, William F., Michael J. Fleming, and Anthony P. Rodrigues (1998). "How Workers Use
401(k) Plans: The Participation, Contribution, and Withdrawal Decisions." National Tax Journal, 51 (2): 263-289.
Bernheim, B. Douglas (1997) "Rethinking Saving Incentives," in Alan J. Auerbach, ed., Fiscal
Policy: Lessons from Economic Research (Cambridge, MA: MIT Press). Bernheim, B. Douglas and Daniel M. Garrett (1996). "The Determinants and Consequences of
Financial Education in the Workplace: Evidence From a Survey of Households," NBER Working Paper No. 5667 (Cambridge, MA: National Bureau of Economic Research).
Browning, Martin and Annamaria Lusardi (1996). "Household Saving: Micro Theories and
Micro Facts," Journal of Economic Literature, 34:1797-1855. Bureau of Labor Statistics (1998). Employee Benefits in Medium and Large Private
Establishments. Washington DC: U.S. Department of Labor, Bureau of Labor Statistics. Employee Benefit Plan Review (1999). "401(k) Plans: Nondiscrimination testing, automatic
enrollment." Employee Benefit Plan Review, 53 (11): 9. Engen, Eric M., William G. Gale and John Karl Scholz (1996). "The Illusory Effects of Saving
Incentives on Saving." Journal of Economic Perspectives, 10 (4): 113-138. Engen, Eric M., William G. Gale, and John Karl Scholz (1994). "Do Saving Incentives Work?,"
Brookings Papers on Economic Activity, 1994, 1, 85-180. Even, William E. and David A. Macpherson (1999). "Employee Participation in 401(k) Plans."
Working Paper. Fidelity Investments (1999). Building Futures: How American Companies Are Helping Their
Employees Retire. A Report on Corporate Defined Contribution Plans (Boston: Fidelity Investments).
Hays, Scott (1999). "'Negative' Election of 401(k) Plans Raises Legal Concerns," Workforce, 78
(4): 108.

44
Hubbard, R. Glenn and Jonathan S. Skinner (1996). "Assessing the Effectiveness of Saving Incentives." Journal of Economic Perspectives, 10 (4): 73-90.
Johnson, Eric J. et al. (1993). "Framing, Probability Distortions, and Insurance Decisions."
Journal of Risk and Uncertainty, 7: 35-51. Kahneman, Daniel and Amos Tversky (1979). "Prospect Theory: An Analysis of Decision
under Risk." Econometrica, 47: 363-91. Kahneman, Daniel and Amos Tversky (1984). "Choices, Values and Frames." American
Psychologist, 39: 341-50. Kahneman, Daniel, Jack L. Knetsch and Richard H. Thaler (1991). "The Endowment Effect,
Loss Aversion, and Status Quo Bias," Journal of Economic Perspectives, 5 (1): 193-206. Kusko, Andrea, James Poterba and David Wilcox (1998). "Employee Decisions with Respect to
401(k) Plans," in Olivia Mitchell and Sylvester Schieber, eds., Living with Defined Contribution Pensions: Remaking Responsibility for Retirement (Philadelphia, University of Pennsylvania Press, 1998), 98-112.
Laibson, David I., Andrea Repetto and Jeremy Tobacman (1998). "Self-Control and Saving for
Retirement", Brookings Papers on Economic Activity, 1998, 1, 91-196. Lusardi, Annamaria (1999). "Information, Expectations, and Savings for Retirement." Working
Paper. Mussweiler, Thomas and Fritz Strack (1999). "Comparing Is Believing: A Selective
Accessibility Model of Judgmental Anchoring." In Wolfgang Stroebe and Miles Hewstone, eds., European Review of Social Psychology, Vol. 10 (New York: John Wiley & Sons), 135-167.
Northcraft, G. B., and M. A. Neale (1987). "Expert, Amateurs, and Real Estate: An Achoring-
and-Adjustment Perspective on Property Pricing Decisions." Organizational Behavior and Human Decision Processes, 39: 84-97.
O'Donoghue, Ted and Matthew Rabin (1998). "Procrastination in Preparing for Retirement."
Working Paper. O'Donoghue, Ted and Matthew Rabin (1999). "Doing it Now or Later," American Economic
Review, 89 (1): 103-124. Papke, Leslie E. (1995). "Participation in and Contributions to 401(k) Pension Plans." Journal
of Human Resources, 30 (2): 311-325. Papke, Leslie E. and James M. Poterba (1995). "Survey Evidence on Employer Match Rates and
Employee Saving Behavior in 401(k) Plans." Economics Letters 49 (3): 313-17.
45
Plous, Scott (1993). The Psychology of Judgment and Decision Making (New York: McGraw
Hill). Poterba, James M., Steven F. Venti, and David A. Wise (1994). "401(k) Plans and Tax-Deferred
Saving," in David A. Wise, ed., Studies in the Economics of Aging (Chicago: University of Chicago Press), 105-38.
Poterba, James M., Steven F. Venti, and David A. Wise (1996). "How Retirement Saving
Programs Increase Saving." Journal of Economic Perspectives, 10 (4): 91-112. Poterba, James M., Steven F. Venti, and David A. Wise (1998). "Personal Retirement Saving
Programs and Asset Accumulation: Reconciling the Evidence," in David A. Wise, ed., Frontiers in the Economics of Aging (Chicago: University of Chicago Press), 23-106.
Profit Sharing/401(k) Council of America (2000). Automatic Enrollment 2000: A Study of
Automatic Enrollment Features in 401(k) Plans. (Chicago: Profit Sharing/401(k) Council of America).
Redelmeier, Donald A. and Eldar Shafir (1995). "Medical Decision Making in Situations That
Offer Multiple Alternatives." Journal of the American Medical Association, 273 (4): 302-205.
Samuelson, William and Richard Zeckhauser (1988). "Status Quo Bias in Decision Making."
Journal of Risk and Uncertainty, 1 (1): 7-59. Schweitzer, Maurice, John C. Hershey, and David A. Asch (1996). "Individual Choice in
Spending Accounts: Can We Rely on Employees to Choose Well?" Medical Care, 34: 583-593.
Shafir, Eldar, Itamar Simonson and Amos Tversky (1993). "Reason-based Choice." Cognition,
49: (11-36). Thaler, Richard H. (1980). "Toward a Positive Theory of Consumer Choice." Journal of
Economic Behavior and Organization, 1: 39-60. Thaler, Richard H. (1994). "Psychology and Savings Policies." American Economic Review
Papers and Proceedings, 84 (May): 186-196. Thompson, Roger (1997). "The Positive Side of 'Negative Elections.'" HR Magazine, 42 (11):
112-117. Tversky, Amos and Daniel Kahneman (1974). "Judgment Under Uncertainty: Heuristics and
Biases," Science, 185: 1124-30.
46
Tversky, Amos and Daniel Kahneman (1981). "The Framing of Decisions and the Psychology of Choice," Science, 211: 453-458.
Tversky, Amos and Eldar Shafir (1992). "Choice Under Conflict: The Dynamics of Deferred
Decision." Psychological Science, 3: 358-361. Youden, Diane (1999). "Automatic 401(k) Enrollment: Retirement Cure-All or Bitter Pill?"
Compensation and Benefits Review, 31 (2): 54-60.
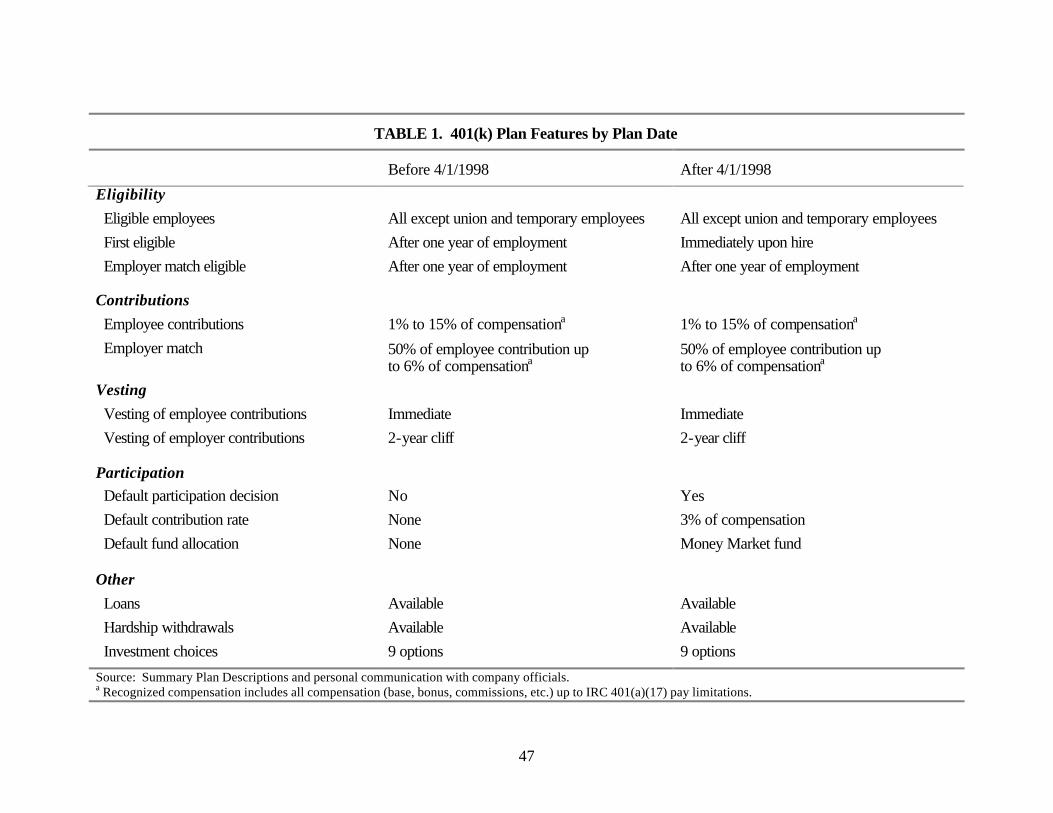
47
TABLE 1. 401(k) Plan Features by Plan Date
Before 4/1/1998
After 4/1/1998
Eligibility
Eligible employees All except union and temporary employees All except union and temporary employees
First eligible After one year of employment Immediately upon hire
Employer match eligible After one year of employment After one year of employment
Contributions
Employee contributions 1% to 15% of compensationa 1% to 15% of compensationa
Employer match 50% of employee contribution up to 6% of compensationa
50% of employee contribution up to 6% of compensationa
Vesting
Vesting of employee contributions Immediate Immediate
Vesting of employer contributions 2-year cliff 2-year cliff
Participation Default participation decision No Yes
Default contribution rate None 3% of compensation
Default fund allocation None Money Market fund
Other
Loans Available Available
Hardship withdrawals Available Available
Investment choices 9 options 9 options
Source: Summary Plan Descriptions and personal communication with company officials. a Recognized compensation includes all compensation (base, bonus, commissions, etc.) up to IRC 401(a)(17) pay limitations.

48
TABLE 2. 401(k) Eligibility and Participation Defaults by Hire Date
Hired before 4/1/1997a Hired between 4/1/1997 and 4/1/1998a
Hired after 4/1/1998a
First eligible After one year of employment
4/1/1998 Hire date
Employer match eligible
After one year of employment
After one year of employment
After one year of employment
Default participation decision
No No Yes
Default contribution rate
None None 3%
Default fund allocation
None None Money market fund
a For employees hired through the acquisition of other companies, eligibility for 401(k) plan participation and the employer match was determined by the date of hire at the acquired company. Employees hired through acquisitions on or after 4/1/1998 were subject to automatic enrollment under the same terms as newly hired employees, with eligibility for the employer match determined by the date of hire at the acquired company.
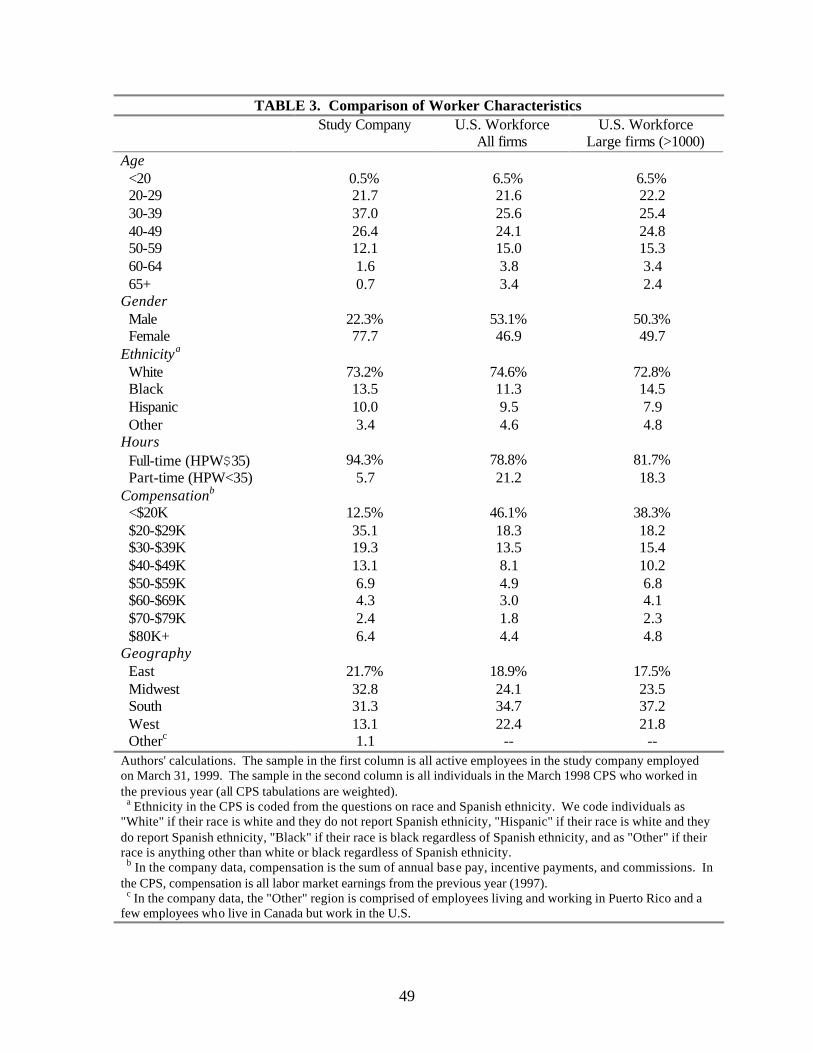
49
TABLE 3. Comparison of Worker Characteristics
Study Company U.S. Workforce All firms
U.S. Workforce Large firms (>1000)
Age <20 0.5% 6.5% 6.5% 20-29 21.7 21.6 22.2 30-39 37.0 25.6 25.4 40-49 26.4 24.1 24.8 50-59 12.1 15.0 15.3 60-64 1.6 3.8 3.4 65+ 0.7 3.4 2.4 Gender Male 22.3% 53.1% 50.3% Female 77.7 46.9 49.7 Ethnicitya White 73.2% 74.6% 72.8% Black 13.5 11.3 14.5 Hispanic 10.0 9.5 7.9 Other 3.4 4.6 4.8 Hours Full-time (HPW$35) 94.3% 78.8% 81.7% Part-time (HPW<35) 5.7 21.2 18.3 Compensationb <$20K 12.5% 46.1% 38.3% $20-$29K 35.1 18.3 18.2 $30-$39K 19.3 13.5 15.4 $40-$49K 13.1 8.1 10.2 $50-$59K 6.9 4.9 6.8 $60-$69K 4.3 3.0 4.1 $70-$79K 2.4 1.8 2.3 $80K+ 6.4 4.4 4.8 Geography East 21.7% 18.9% 17.5% Midwest 32.8 24.1 23.5 South 31.3 34.7 37.2 West 13.1 22.4 21.8 Otherc 1.1 -- -- Authors' calculations. The sample in the first column is all active employees in the study company employed on March 31, 1999. The sample in the second column is all individuals in the March 1998 CPS who worked in the previous year (all CPS tabulations are weighted). a Ethnicity in the CPS is coded from the questions on race and Spanish ethnicity. We code individuals as "White" if their race is white and they do not report Spanish ethnicity, "Hispanic" if their race is white and they do report Spanish ethnicity, "Black" if their race is black regardless of Spanish ethnicity, and as "Other" if their race is anything other than white or black regardless of Spanish ethnicity. b In the company data, compensation is the sum of annual base pay, incentive payments, and commissions. In the CPS, compensation is all labor market earnings from the previous year (1997). c In the company data, the "Other" region is comprised of employees living and working in Puerto Rico and a few employees who live in Canada but work in the U.S.
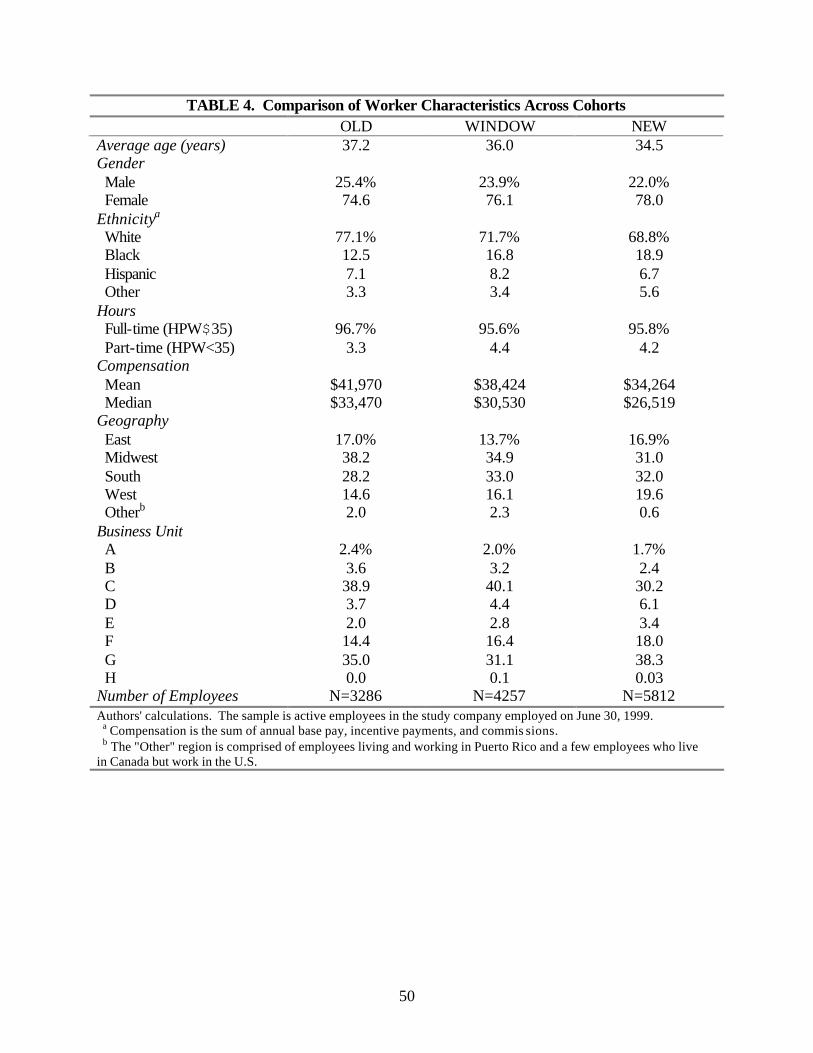
50
TABLE 4. Comparison of Worker Characteristics Across Cohorts
OLD WINDOW NEW Average age (years) 37.2 36.0 34.5 Gender Male 25.4% 23.9% 22.0% Female 74.6 76.1 78.0 Ethnicitya White 77.1% 71.7% 68.8% Black 12.5 16.8 18.9 Hispanic 7.1 8.2 6.7 Other 3.3 3.4 5.6 Hours Full-time (HPW$35) 96.7% 95.6% 95.8% Part-time (HPW<35) 3.3 4.4 4.2 Compensation Mean $41,970 $38,424 $34,264 Median $33,470 $30,530 $26,519 Geography East 17.0% 13.7% 16.9% Midwest 38.2 34.9 31.0 South 28.2 33.0 32.0 West 14.6 16.1 19.6 Otherb 2.0 2.3 0.6 Business Unit A 2.4% 2.0% 1.7% B 3.6 3.2 2.4 C 38.9 40.1 30.2 D 3.7 4.4 6.1 E 2.0 2.8 3.4 F 14.4 16.4 18.0 G 35.0 31.1 38.3 H 0.0 0.1 0.03 Number of Employees N=3286 N=4257 N=5812 Authors' calculations. The sample is active employees in the study company employed on June 30, 1999. a Compensation is the sum of annual base pay, incentive payments, and commis sions. b The "Other" region is comprised of employees living and working in Puerto Rico and a few employees who live in Canada but work in the U.S.
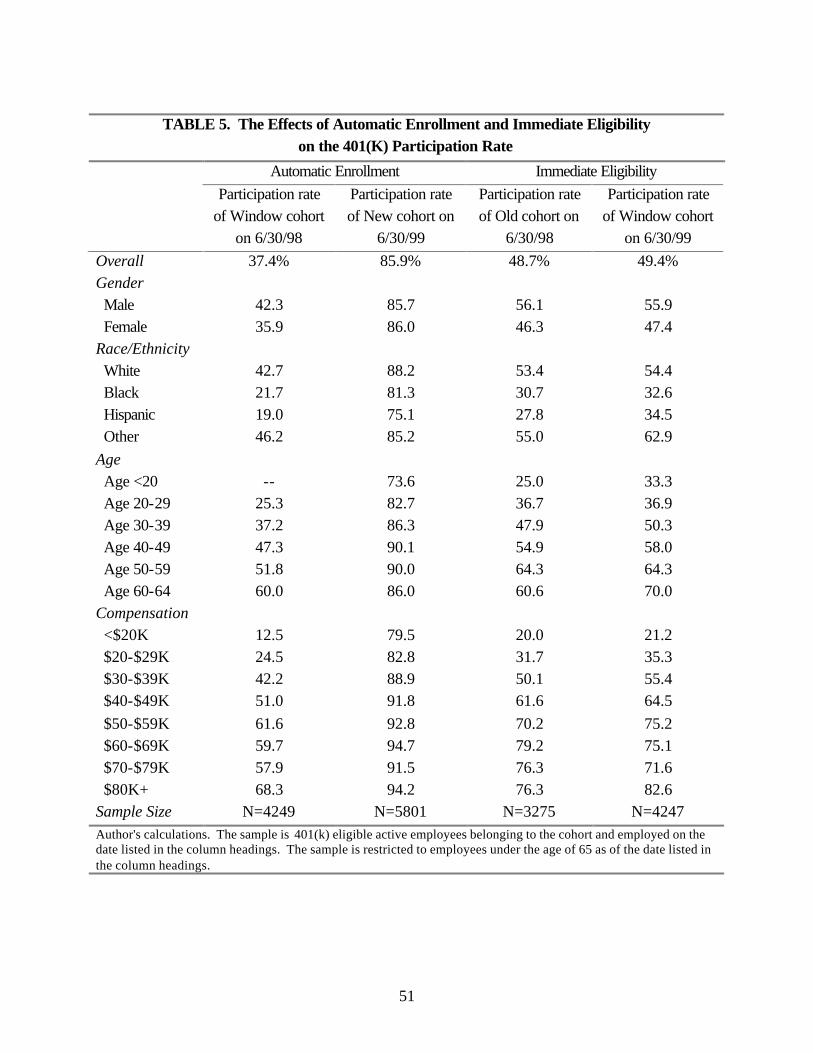
51
TABLE 5. The Effects of Automatic Enrollment and Immediate Eligibility
on the 401(K) Participation Rate
Automatic Enrollment Immediate Eligibility Participation rate
of Window cohort on 6/30/98
Participation rate of New cohort on
6/30/99
Participation rate of Old cohort on
6/30/98
Participation rate of Window cohort
on 6/30/99 Overall 37.4% 85.9% 48.7% 49.4% Gender Male 42.3 85.7 56.1 55.9 Female 35.9 86.0 46.3 47.4 Race/Ethnicity White 42.7 88.2 53.4 54.4 Black 21.7 81.3 30.7 32.6 Hispanic 19.0 75.1 27.8 34.5 Other 46.2 85.2 55.0 62.9 Age Age <20 -- 73.6 25.0 33.3 Age 20-29 25.3 82.7 36.7 36.9 Age 30-39 37.2 86.3 47.9 50.3 Age 40-49 47.3 90.1 54.9 58.0 Age 50-59 51.8 90.0 64.3 64.3 Age 60-64 60.0 86.0 60.6 70.0 Compensation <$20K 12.5 79.5 20.0 21.2 $20-$29K 24.5 82.8 31.7 35.3 $30-$39K 42.2 88.9 50.1 55.4 $40-$49K 51.0 91.8 61.6 64.5 $50-$59K 61.6 92.8 70.2 75.2 $60-$69K 59.7 94.7 79.2 75.1 $70-$79K 57.9 91.5 76.3 71.6 $80K+ 68.3 94.2 76.3 82.6 Sample Size N=4249 N=5801 N=3275 N=4247 Author's calculations. The sample is 401(k) eligible active employees belonging to the cohort and employed on the date listed in the column headings. The sample is restricted to employees under the age of 65 as of the date listed in the column headings.
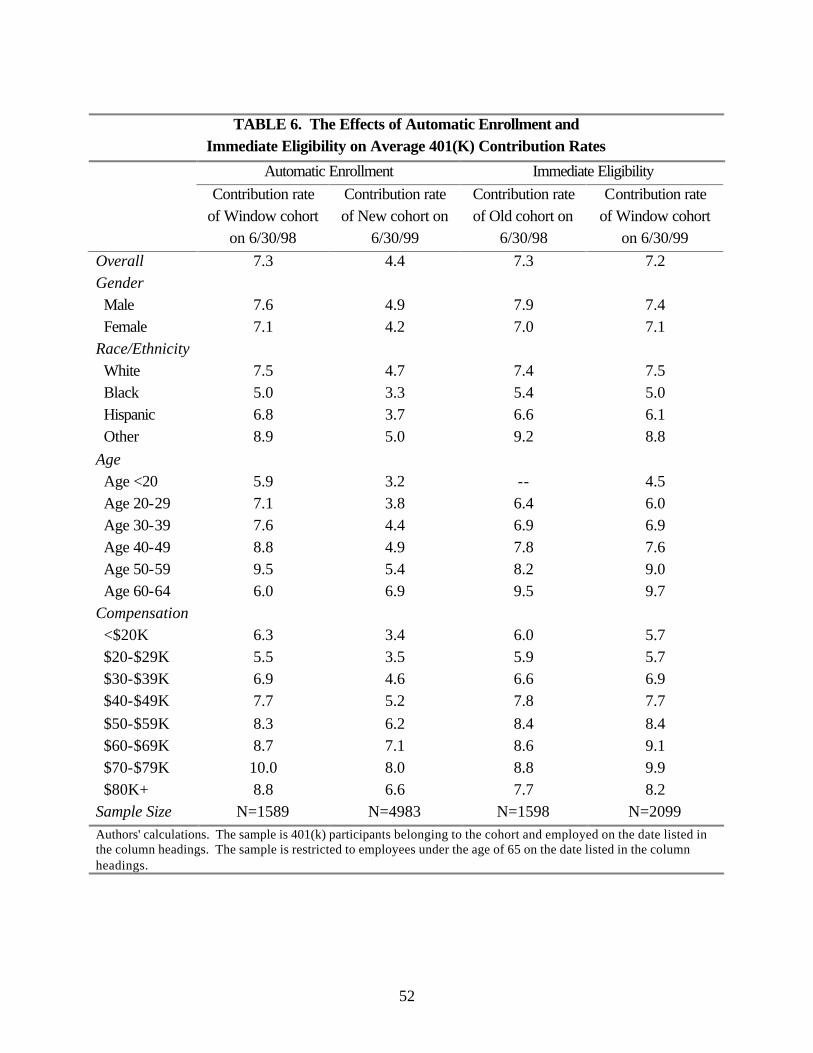
52
TABLE 6. The Effects of Automatic Enrollment and
Immediate Eligibility on Average 401(K) Contribution Rates
Automatic Enrollment Immediate Eligibility Contribution rate
of Window cohort on 6/30/98
Contribution rate of New cohort on
6/30/99
Contribution rate of Old cohort on
6/30/98
Contribution rate of Window cohort
on 6/30/99 Overall 7.3 4.4 7.3 7.2 Gender Male 7.6 4.9 7.9 7.4 Female 7.1 4.2 7.0 7.1 Race/Ethnicity White 7.5 4.7 7.4 7.5 Black 5.0 3.3 5.4 5.0 Hispanic 6.8 3.7 6.6 6.1 Other 8.9 5.0 9.2 8.8 Age Age <20 5.9 3.2 -- 4.5 Age 20-29 7.1 3.8 6.4 6.0 Age 30-39 7.6 4.4 6.9 6.9 Age 40-49 8.8 4.9 7.8 7.6 Age 50-59 9.5 5.4 8.2 9.0 Age 60-64 6.0 6.9 9.5 9.7 Compensation <$20K 6.3 3.4 6.0 5.7 $20-$29K 5.5 3.5 5.9 5.7 $30-$39K 6.9 4.6 6.6 6.9 $40-$49K 7.7 5.2 7.8 7.7 $50-$59K 8.3 6.2 8.4 8.4 $60-$69K 8.7 7.1 8.6 9.1 $70-$79K 10.0 8.0 8.8 9.9 $80K+ 8.8 6.6 7.7 8.2 Sample Size N=1589 N=4983 N=1598 N=2099 Authors' calculations. The sample is 401(k) participants belonging to the cohort and employed on the date listed in the column headings. The sample is restricted to employees under the age of 65 on the date listed in the column headings.
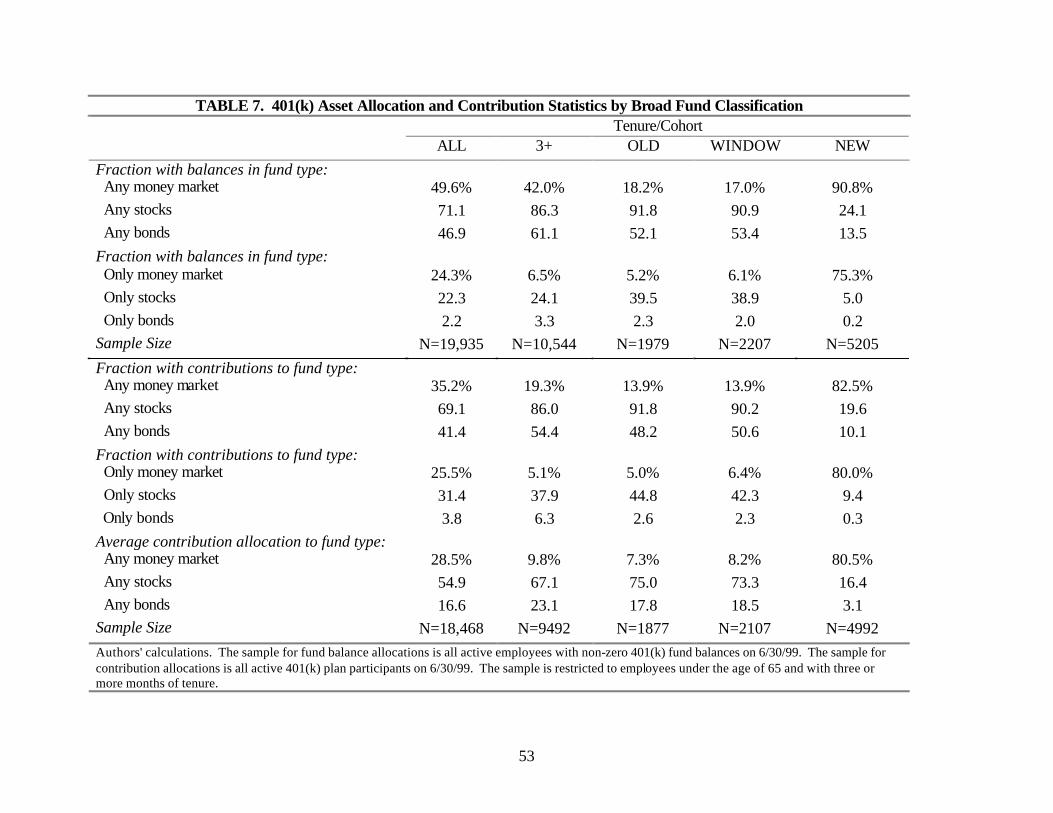
53
TABLE 7. 401(k) Asset Allocation and Contribution Statistics by Broad Fund Classification Tenure/Cohort ALL 3+ OLD WINDOW NEW
Fraction with balances in fund type: Any money market 49.6% 42.0% 18.2% 17.0% 90.8% Any stocks 71.1 86.3 91.8 90.9 24.1 Any bonds 46.9 61.1 52.1 53.4 13.5 Fraction with balances in fund type: Only money market 24.3% 6.5% 5.2% 6.1% 75.3% Only stocks 22.3 24.1 39.5 38.9 5.0 Only bonds 2.2 3.3 2.3 2.0 0.2 Sample Size N=19,935 N=10,544 N=1979 N=2207 N=5205
Fraction with contributions to fund type: Any money market 35.2% 19.3% 13.9% 13.9% 82.5% Any stocks 69.1 86.0 91.8 90.2 19.6 Any bonds 41.4 54.4 48.2 50.6 10.1 Fraction with contributions to fund type: Only money market 25.5% 5.1% 5.0% 6.4% 80.0% Only stocks 31.4 37.9 44.8 42.3 9.4 Only bonds 3.8 6.3 2.6 2.3 0.3 Average contribution allocation to fund type: Any money market 28.5% 9.8% 7.3% 8.2% 80.5% Any stocks 54.9 67.1 75.0 73.3 16.4 Any bonds 16.6 23.1 17.8 18.5 3.1 Sample Size N=18,468 N=9492 N=1877 N=2107 N=4992 Authors' calculations. The sample for fund balance allocations is all active employees with non-zero 401(k) fund balances on 6/30/99. The sample for contribution allocations is all active 401(k) plan participants on 6/30/99. The sample is restricted to employees under the age of 65 and with three or more months of tenure.
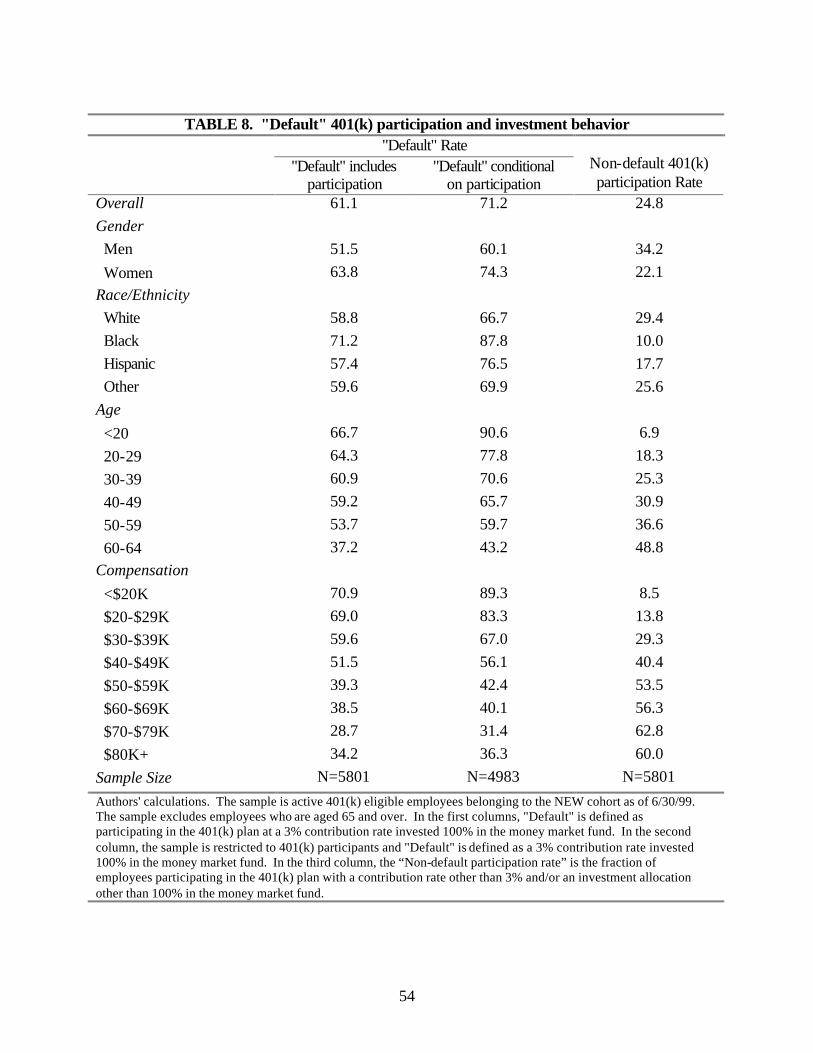
54
TABLE 8. "Default" 401(k) participation and investment behavior
"Default" Rate "Default" includes
participation "Default" conditional
on participation
Non-default 401(k) participation Rate
Overall 61.1 71.2 24.8 Gender Men 51.5 60.1 34.2
Women 63.8 74.3 22.1 Race/Ethnicity White 58.8 66.7 29.4 Black 71.2 87.8 10.0 Hispanic 57.4 76.5 17.7 Other 59.6 69.9 25.6 Age
<20 66.7 90.6 6.9
20-29 64.3 77.8 18.3
30-39 60.9 70.6 25.3
40-49 59.2 65.7 30.9
50-59 53.7 59.7 36.6
60-64 37.2 43.2 48.8 Compensation
<$20K 70.9 89.3 8.5
$20-$29K 69.0 83.3 13.8
$30-$39K 59.6 67.0 29.3
$40-$49K 51.5 56.1 40.4
$50-$59K 39.3 42.4 53.5
$60-$69K 38.5 40.1 56.3
$70-$79K 28.7 31.4 62.8
$80K+ 34.2 36.3 60.0
Sample Size N=5801 N=4983 N=5801
Authors' calculations. The sample is active 401(k) eligible employees belonging to the NEW cohort as of 6/30/99. The sample excludes employees who are aged 65 and over. In the first columns, "Default" is defined as participating in the 401(k) plan at a 3% contribution rate invested 100% in the money market fund. In the second column, the sample is restricted to 401(k) participants and "Default" is defined as a 3% contribution rate invested 100% in the money market fund. In the third column, the “Non-default participation rate” is the fraction of employees participating in the 401(k) plan with a contribution rate other than 3% and/or an investment allocation other than 100% in the money market fund.
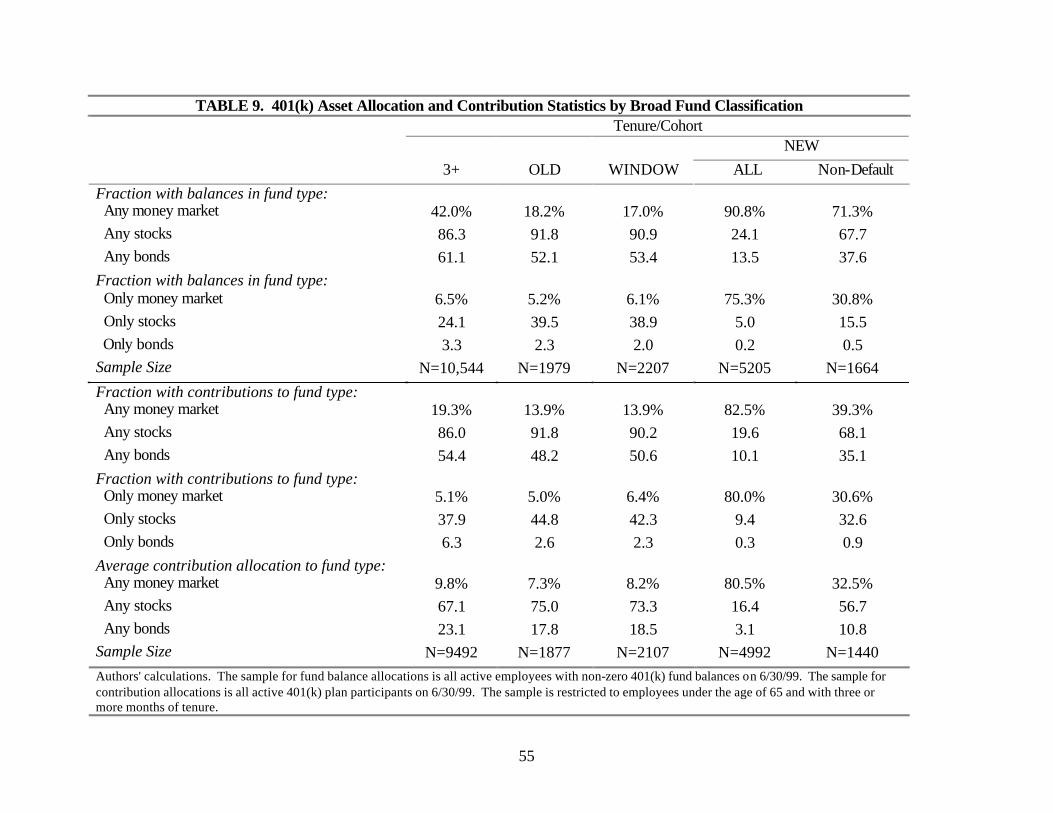
55
TABLE 9. 401(k) Asset Allocation and Contribution Statistics by Broad Fund Classification Tenure/Cohort NEW
3+ OLD WINDOW ALL Non-Default
Fraction with balances in fund type: Any money market 42.0% 18.2% 17.0% 90.8% 71.3% Any stocks 86.3 91.8 90.9 24.1 67.7 Any bonds 61.1 52.1 53.4 13.5 37.6 Fraction with balances in fund type: Only money market 6.5% 5.2% 6.1% 75.3% 30.8% Only stocks 24.1 39.5 38.9 5.0 15.5 Only bonds 3.3 2.3 2.0 0.2 0.5 Sample Size N=10,544 N=1979 N=2207 N=5205 N=1664
Fraction with contributions to fund type: Any money market 19.3% 13.9% 13.9% 82.5% 39.3% Any stocks 86.0 91.8 90.2 19.6 68.1 Any bonds 54.4 48.2 50.6 10.1 35.1 Fraction with contributions to fund type: Only money market 5.1% 5.0% 6.4% 80.0% 30.6% Only stocks 37.9 44.8 42.3 9.4 32.6 Only bonds 6.3 2.6 2.3 0.3 0.9 Average contribution allocation to fund type: Any money market 9.8% 7.3% 8.2% 80.5% 32.5% Any stocks 67.1 75.0 73.3 16.4 56.7 Any bonds 23.1 17.8 18.5 3.1 10.8 Sample Size N=9492 N=1877 N=2107 N=4992 N=1440 Authors' calculations. The sample for fund balance allocations is all active employees with non-zero 401(k) fund balances on 6/30/99. The sample for contribution allocations is all active 401(k) plan participants on 6/30/99. The sample is restricted to employees under the age of 65 and with three or more months of tenure.
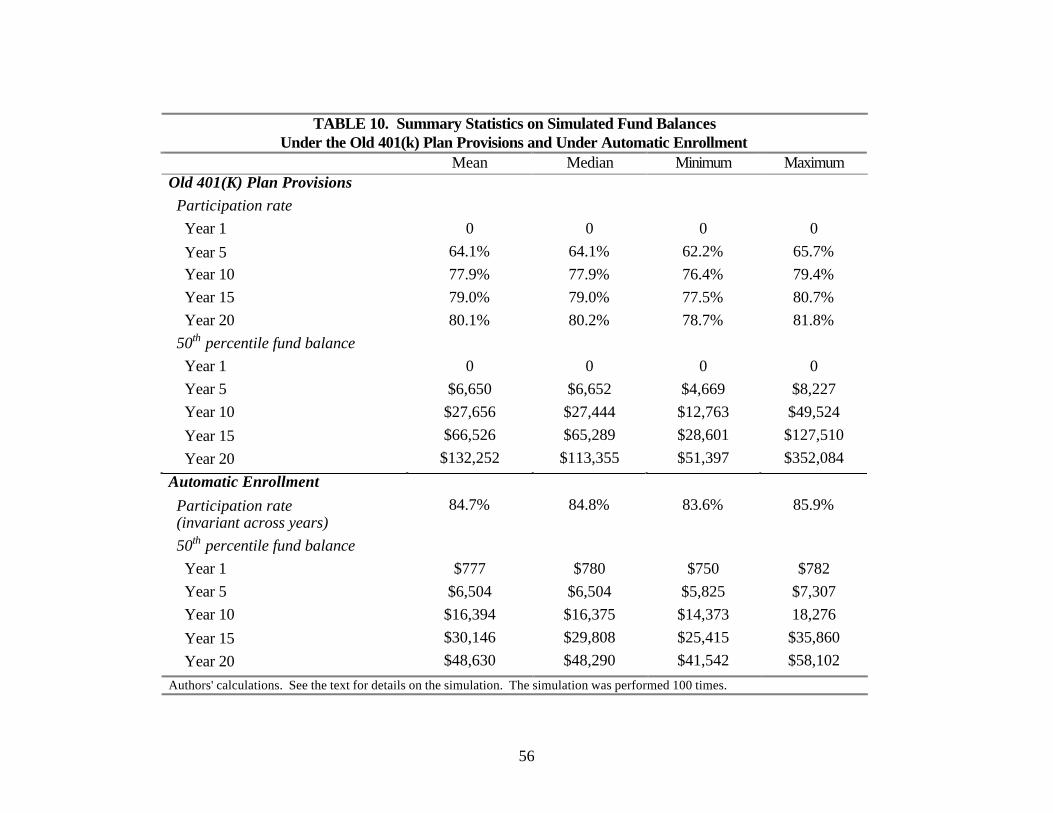
56
TABLE 10. Summary Statistics on Simulated Fund Balances
Under the Old 401(k) Plan Provisions and Under Automatic Enrollment Mean Median Minimum Maximum Old 401(K) Plan Provisions Participation rate Year 1 0 0 0 0
Year 5 64.1% 64.1% 62.2% 65.7% Year 10 77.9% 77.9% 76.4% 79.4% Year 15 79.0% 79.0% 77.5% 80.7% Year 20 80.1% 80.2% 78.7% 81.8% 50th percentile fund balance Year 1 0 0 0 0 Year 5 $6,650 $6,652 $4,669 $8,227 Year 10 $27,656 $27,444 $12,763 $49,524
Year 15 $66,526 $65,289 $28,601 $127,510
Year 20 $132,252 $113,355 $51,397 $352,084
Automatic Enrollment
Participation rate (invariant across years)
84.7% 84.8% 83.6% 85.9%
50th percentile fund balance Year 1 $777 $780 $750 $782 Year 5 $6,504 $6,504 $5,825 $7,307 Year 10 $16,394 $16,375 $14,373 18,276
Year 15 $30,146 $29,808 $25,415 $35,860
Year 20 $48,630 $48,290 $41,542 $58,102
Authors' calculations. See the text for details on the simulation. The simulation was performed 100 times.
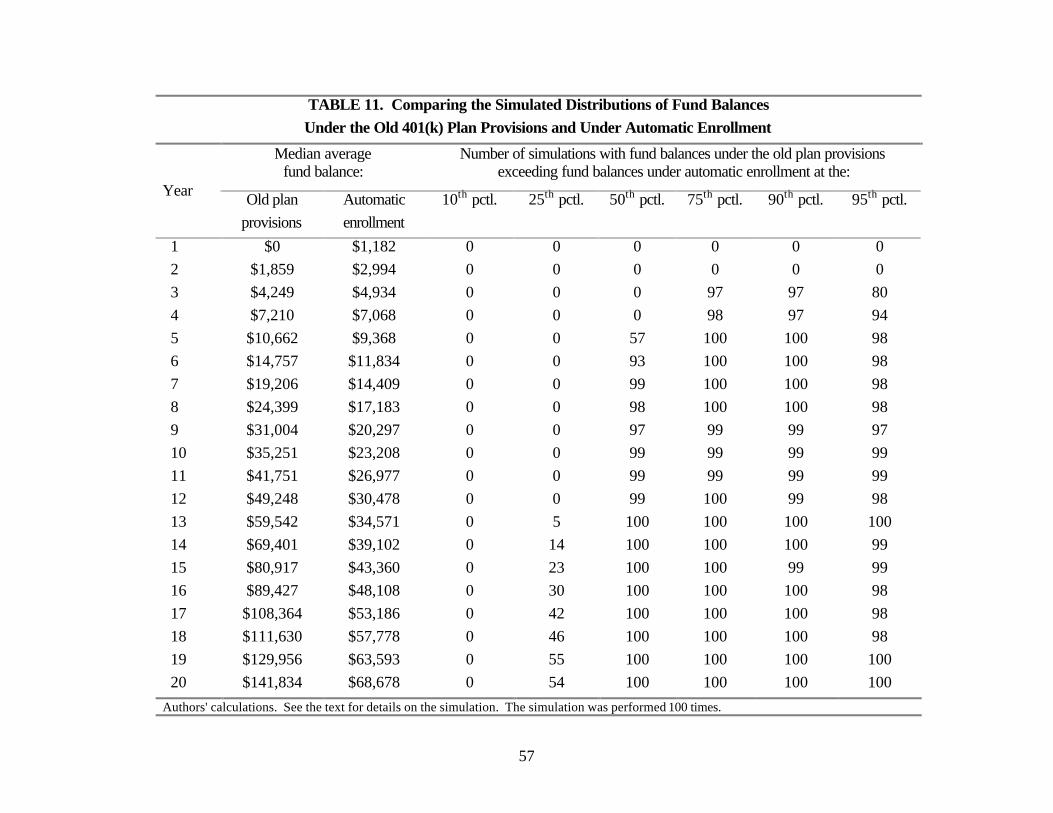
57
TABLE 11. Comparing the Simulated Distributions of Fund Balances
Under the Old 401(k) Plan Provisions and Under Automatic Enrollment
Median average fund balance:
Number of simulations with fund balances under the old plan provisions exceeding fund balances under automatic enrollment at the:
Year Old plan provisions
Automatic enrollment
10th pctl. 25th pctl. 50th pctl. 75th pctl. 90th pctl. 95th pctl.
1 $0 $1,182 0 0 0 0 0 0 2 $1,859 $2,994 0 0 0 0 0 0 3 $4,249 $4,934 0 0 0 97 97 80 4 $7,210 $7,068 0 0 0 98 97 94 5 $10,662 $9,368 0 0 57 100 100 98 6 $14,757 $11,834 0 0 93 100 100 98 7 $19,206 $14,409 0 0 99 100 100 98 8 $24,399 $17,183 0 0 98 100 100 98 9 $31,004 $20,297 0 0 97 99 99 97 10 $35,251 $23,208 0 0 99 99 99 99 11 $41,751 $26,977 0 0 99 99 99 99 12 $49,248 $30,478 0 0 99 100 99 98 13 $59,542 $34,571 0 5 100 100 100 100 14 $69,401 $39,102 0 14 100 100 100 99 15 $80,917 $43,360 0 23 100 100 99 99 16 $89,427 $48,108 0 30 100 100 100 98 17 $108,364 $53,186 0 42 100 100 100 98 18 $111,630 $57,778 0 46 100 100 100 98 19 $129,956 $63,593 0 55 100 100 100 100 20 $141,834 $68,678 0 54 100 100 100 100
Authors' calculations. See the text for details on the simulation. The simulation was performed 100 times.
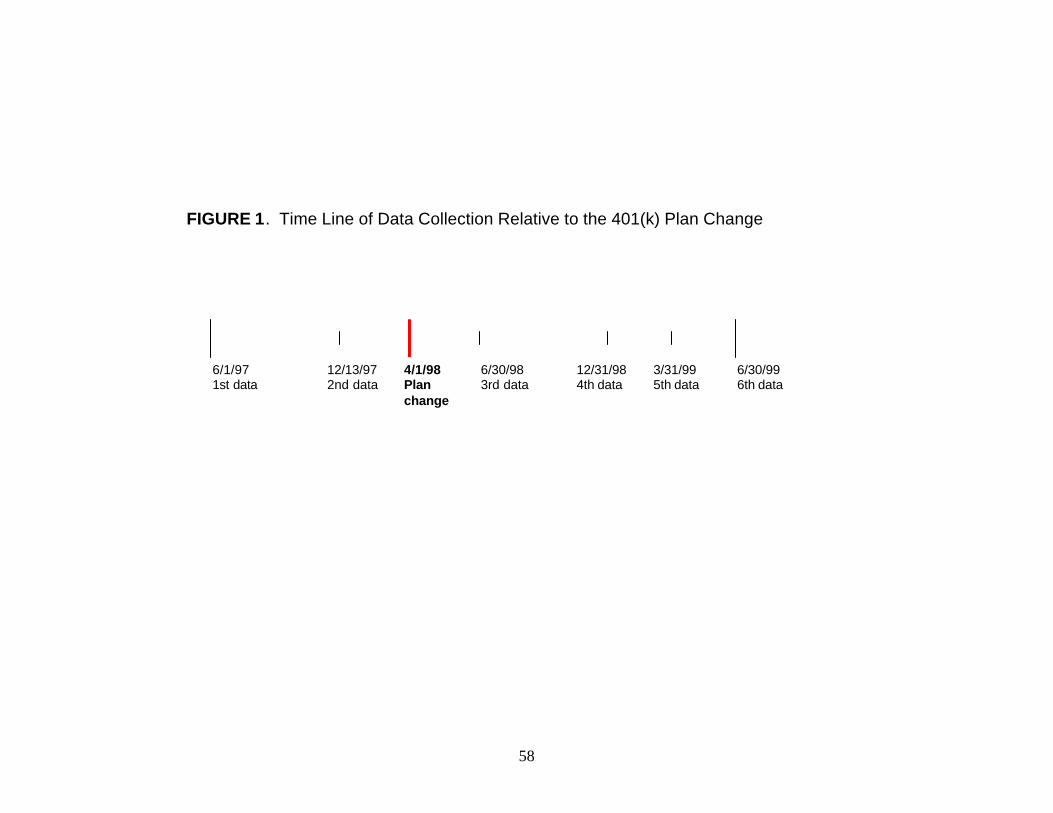
58
6/1/971st data
12/13/972nd data
4/1/98Planchange
6/30/983rd data
12/31/984th data
3/31/995th data
6/30/996th data
FIGURE 1. Time Line of Data Collection Relative to the 401(k) Plan Change
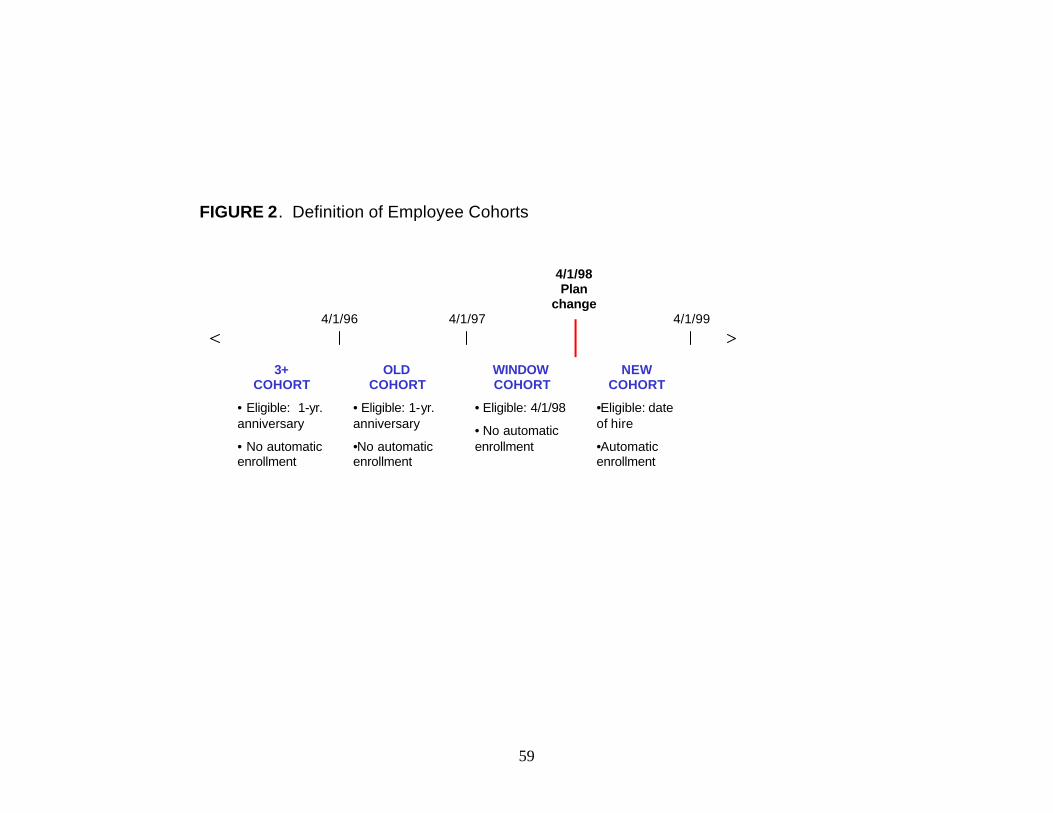
59
4/1/96 4/1/97
4/1/98Plan
change4/1/99
FIGURE 2. Definition of Employee Cohorts
WINDOWCOHORT
• Eligible: 4/1/98
• No automaticenrollment
3+COHORT
• Eligible: 1-yr.anniversary
• No automaticenrollment
OLDCOHORT
• Eligible: 1-yr.anniversary
•No automaticenrollment
NEWCOHORT
•Eligible: dateof hire
•Automaticenrollment

60
FIGURE 3. 401(k) Participation by Tenure
86%
49%57%
64%
77% 80% 82% 83%
0%
20%
40%
60%
80%
100%
NEW WINDOW OLD 3-5 yrs. 5-10 yrs. 10-15 yrs. 15-20 yrs. 20+ yrs.
Tenure Category
After Automatic Enrollment Before Automatic Enrollment

61
FIGURE 4A. Distribution of 401(K) Contribution Rates by Cohort for 401(K) Participants
0%
20%
40%
60%
80%
1-2% 3% 4-5% 6% 7-9% 10% 11-14% 15%
Contribution Rate
Fra
ctio
n o
f P
arti
cip
ants
3+
OLD
WINDOW
NEW
FIGURE 4B. Distribution of 401(K) Contribution Rates for the WINDOW and NEW Cohorts with Equivalent Tenure
8% 12%
30%
9% 11%2%
16%
76%
12%6%
1%4%2%8%
2%2%0%
20%
40%
60%
80%
1-2% 3% 4-5% 6% 7-9% 10% 11-14% 15%
Contribution Rate
Fra
ctio
n o
f P
arti
cip
ants
WINDOW
NEW
FIGURE 4C. Distribution of 401(K) Contribution Rates for the WINDOW and NEW Cohorts Including Non-Participation
3% 4% 4%11%
3% 4% 1%6%
65%63%
5%1%3%2%7%
2%1%
14%
0%
20%
40%
60%
80%
0% 1-2% 3% 4-5% 6% 7-9% 10% 11-14% 15%
Contribution Rate
Fra
ctio
n o
f E
mp
loye
es
WINDOW
NEW

62
FIGURE 5. Number of Funds with Balances by Cohort for Employees with Positive Balances
0
10
2030
40
50
6070
80
90
1 2 3 4 5 6 7+
Number of Funds with Positive Balances
Frac
tion
of E
mpl
oyee
s
3+ OLD WINDOW NEW
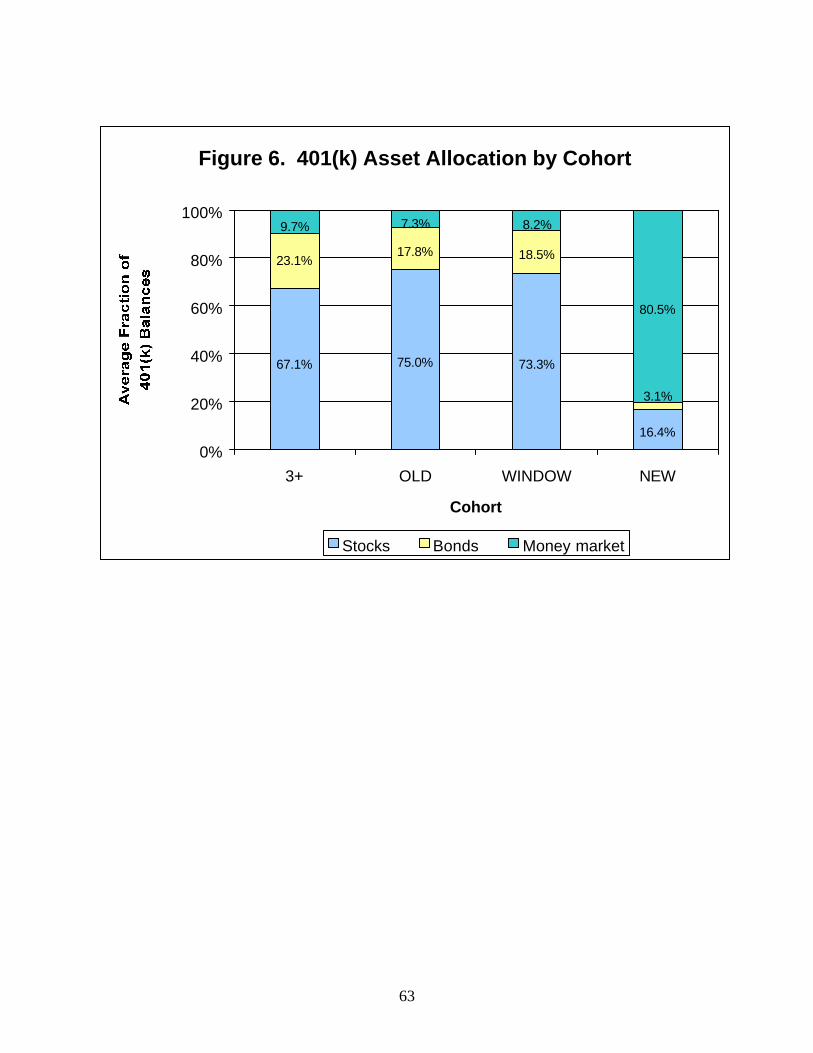
63
Figure 6. 401(k) Asset Allocation by Cohort
75.0% 73.3%
16.4%
17.8% 18.5%
80.5%
67.1%
23.1%
3.1%
9.7% 8.2%7.3%
0%
20%
40%
60%
80%
100%
3+ OLD WINDOW NEW
Cohort
Stocks Bonds Money market

64
FIGURE 7. 401(k) Participation Under the Old 401(k) Plan Provisions and Non-default 401(k) Participation Under
Automatic Enrollment
0
10
20
30
40
50
60
70
80
90
100
0 20 40 60 80 100
Participation rate of the WINDOW cohort after 1 year
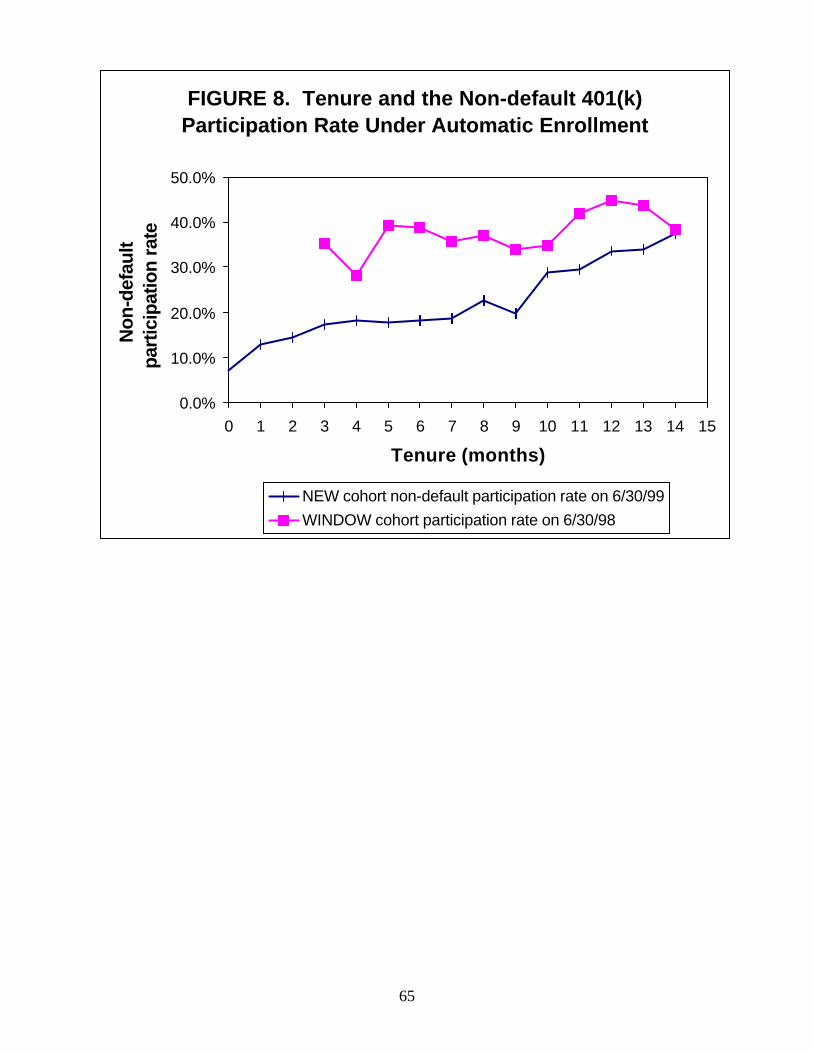
65
FIGURE 8. Tenure and the Non-default 401(k) Participation Rate Under Automatic Enrollment
0.0%
10.0%
20.0%
30.0%
40.0%
50.0%
0 1 2 3 4 5 6 7 8 9 10 11 12 13 14 15
Tenure (months)
Non
-def
ault
part
icip
atio
n ra
te
NEW cohort non-default participation rate on 6/30/99WINDOW cohort participation rate on 6/30/98
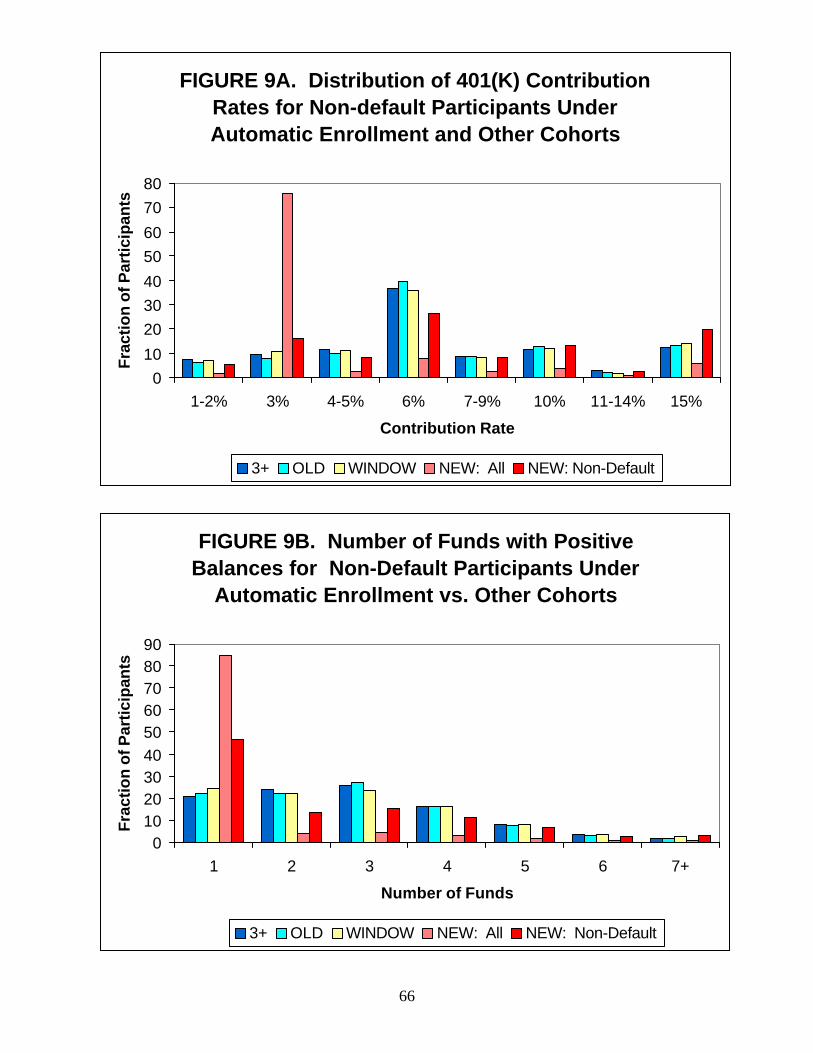
66
FIGURE 9A. Distribution of 401(K) Contribution Rates for Non-default Participants Under Automatic Enrollment and Other Cohorts
010
203040
5060
7080
1-2% 3% 4-5% 6% 7-9% 10% 11-14% 15%
Contribution Rate
Frac
tion
of P
artic
ipan
ts
3+ OLD WINDOW NEW: All NEW: Non-Default
FIGURE 9B. Number of Funds with Positive Balances for Non-Default Participants Under
Automatic Enrollment vs. Other Cohorts
0102030405060708090
1 2 3 4 5 6 7+
Number of Funds
Frac
tion
of P
artic
ipan
ts
3+ OLD WINDOW NEW: All NEW: Non-Default

67
FIGURE 10A. Asset Allocation by Date of Initial 401(k) Participation: Average Money Market Allocation
8%5%
14%
5% 5%
27%
19%17%
0%
10%
20%
30%
3+ OLD WINDOW
Cohort
Before 12/31/1997
Between 1/1/1998and 6/30/1998
After 7/1/1998
FIGURE 10B. Asset Allocation by Date of Initial 401(k) Participation: Any Money Market Contributions
18%13%
21%
9% 10%
41%
29%24%
0%
10%
20%
30%
40%
50%
3+ OLD WINDOW
Cohort
Before 12/31/1997
Between 1/1/1998and 6/30/1998
After 7/1/1998
FIGURE 10C. Asset Allocation by Date of Initial 401(k) Participation: Only Money Market Contributions
4% 2%
11%
3% 3%
21%
16% 15%
0%
5%
10%
15%
20%
25%
3+ OLD WINDOW
Cohort
Before 12/31/1997
Between 1/1/1998and 6/30/1998
After 7/1/1998
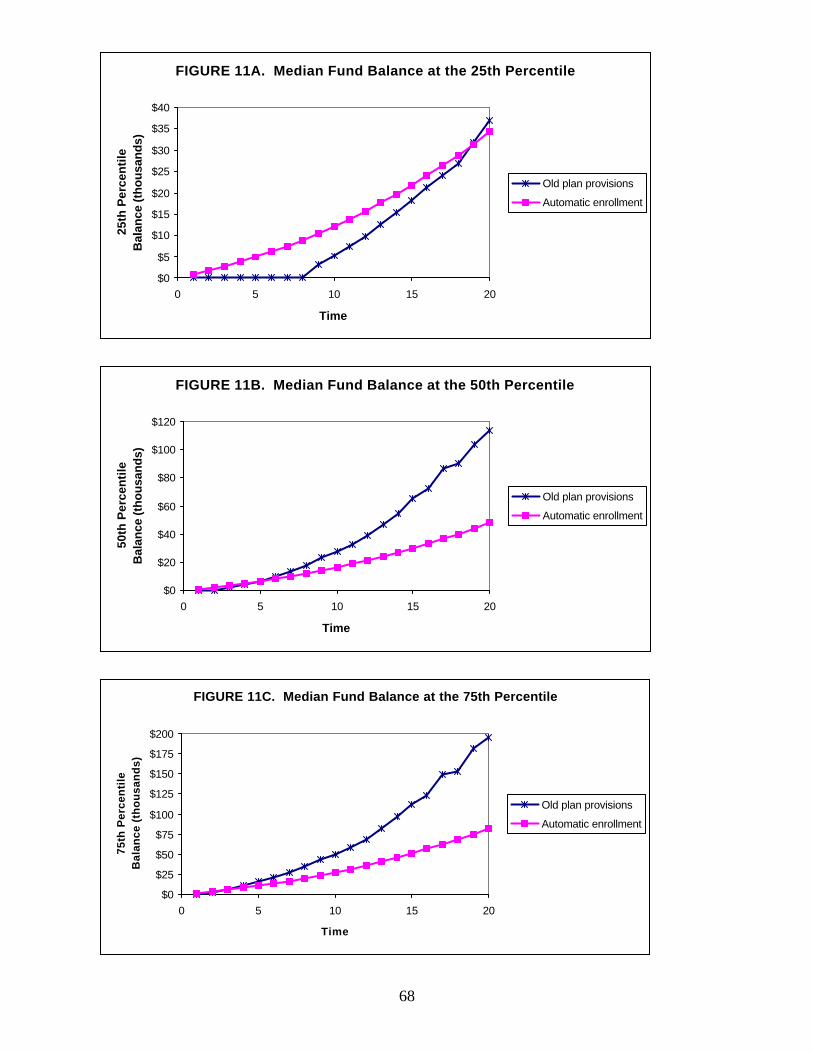
68
FIGURE 11A. Median Fund Balance at the 25th Percentile
$0
$5
$10
$15
$20
$25
$30
$35
$40
0 5 10 15 20
Time
25th
Per
cen
tile
B
alan
ce (t
hous
ands
)
Old plan provisions
Automatic enrollment
FIGURE 11B. Median Fund Balance at the 50th Percentile
$0
$20
$40
$60
$80
$100
$120
0 5 10 15 20
Time
50th
Per
cen
tile
B
alan
ce (t
hous
ands
)
Old plan provisions
Automatic enrollment
FIGURE 11C. Median Fund Balance at the 75th Percentile
$0
$25
$50
$75
$100
$125
$150
$175
$200
0 5 10 15 20
Time
75th
Per
cen
tile
B
alan
ce (
tho
usa
nd
s)
Old plan provisions
Automatic enrollment


![NBER WORKING PAPER SERIES WEALTH ACCUMULATION …cycle model, are strongly related to wealth accumulation. For example, Madrian and Shea [2001] show that default rules in defined](https://img.pdfslide.us/doc/110x75/5eceaa4b1f3056299e53b666/nber-working-paper-series-wealth-accumulation-cycle-model-are-strongly-related.jpg)