Embed Size (px)
Citation preview
NBER WORKING PAPER SERIES
INAPPROPRIATE POOLING OF WEALTHY AND POOR COUNTRIES IN EMPIRICAL FDI STUDIES
Bruce A. BlonigenMiao Wang
Working Paper 10378http://www.nber.org/papers/w10378
NATIONAL BUREAU OF ECONOMIC RESEARCH1050 Massachusetts Avenue
Cambridge, MA 02138March 2004
Prepared for the Institute of International Economics conference, “The Impact of Foreign DirectInvestment on Development: New Measurements, New Outcomes, New Policy Approaches,”held in Washington, DC, in April 2004. The views expressed herein are those of the authors andnot necessarily those of the National Bureau of Economic Research.
©2004 by Bruce A.Blonigen and Miao Wang. All rights reserved. Short sections of text, not toexceed two paragraphs, may be quoted without explicit permission provided that full credit,including © notice, is given to the source.
Inappropriate Pooling of Wealthy and Poor Countries in Empirical FDI StudiesBruce A. Blonigen and Miao Wang NBER Working Paper No. 10378March 2004JEL No. F2, H2, O4
ABSTRACT
This paper examines the question of whether less-developed countries' (LDCs') experiences with
foreign direct investment (FDI) systematically different from those of developed countries (DCs).
We do this by examining three types of empirical FDI studies that typically do not distinguish
between LDCs and DCs in their analysis. First, we find that the underlying factors that determine
the location of FDI activity across countries vary systematically across LDCs and DCs in a way that
is not captured by current empirical models of FDI. Second, the effect of FDI on economic growth
is one that is only supported for LDCs in the aggregate data, not DCs. Third, the evidence suggests
that FDI is much less likely to crowd out (more likely to crowd in) domestic investment for LDCs
than DCs.
Bruce A. Blonigen Miao WangDepartment of Economics Department of Economics1285 University of Oregon Marquette UniversityEugene, OR 97403 Milwaukee, WI 53233and NBER [email protected] [email protected]
I. Introduction
The rapid pace of foreign direct investment (FDI) and multinational firm activity has
been well documented. As with trade, the freer flow of capital, including FDI, is cited by many
as an important engine of growth for the world economy, perhaps especially for the world’s less-
developed countries (LDCs). However, systematic empirical evidence for the factors that affect
FDI patterns and its effect on country-level economies is in its infancy. It is only in the past
decade that reasonable data on FDI activity has become available and allowed standard statistical
analysis. This is particularly true with respect to LDCs.
In fact, the vast majority of empirical FDI studies do not distinguish between LDCs and
developed countries (DCs) in their analysis. In many studies, data from both types of countries
are often pooled into one sample and the estimated relationships are assumed to hold equally for
both types of countries. Unfortunately, these pooled coefficient estimates may significantly
misrepresent the true relationships for both sets of countries if these underlying relationships are
indeed different for LDCs versus DCs. Many other papers in the literature use data only for
DCs, for which data are often more readily available. The results from these DC studies then do
not provide information regarding LDCs experiences with FDI and a further concern is that the
results are incorrectly assumed to be valid for LDCs as well.
This paper examines the question of whether LDCs’ experiences with FDI are
systematically different from those of DCs. We do this by examining three types of empirical
FDI studies using country-level data that typically do not distinguish between LDCs and DCs.
We begin with the recent literature examining the factors that determine FDI location. We then
turn to the relatively extensive literature examining whether FDI affects growth. Finally, we
examine the issue of whether FDI negatively or positively impacts (i.e., crowds out or crowds in)
domestic investment.
1
It may be that no significant differences exist and pooling data across DCs and LDCs
does not lead to incorrect inferences. We find the world is not that simple. In all three areas of
FDI analysis we find substantial differences between LDCs and DCs that are both statistically
and economically significant. In fact, in each we uncover surprising differences between our
samples of LDCs and DCs that provide new perspectives on the existing literature. Thus, while
our methodology is fairly straightforward – examination for structural differences in the
coefficient estimates – the message we come away with is fairly powerful. It is inappropriate to
assume that FDI plays the same role in LDCs as it does for DCs, and policy recommendations
are therefore necessarily different.
The next section gives a brief overview of worldwide patterns of FDI across LDCs and
DCs over the past few decades. This is followed by our analysis of structural differences
between LDC’s and DC’s behavior with the three different strands of the empirical FDI
literature. A final section concludes by summarizing our results and providing some final
thoughts on country-level FDI studies.
II. Descriptive Differences in FDI Patterns for DCs versus LDCs
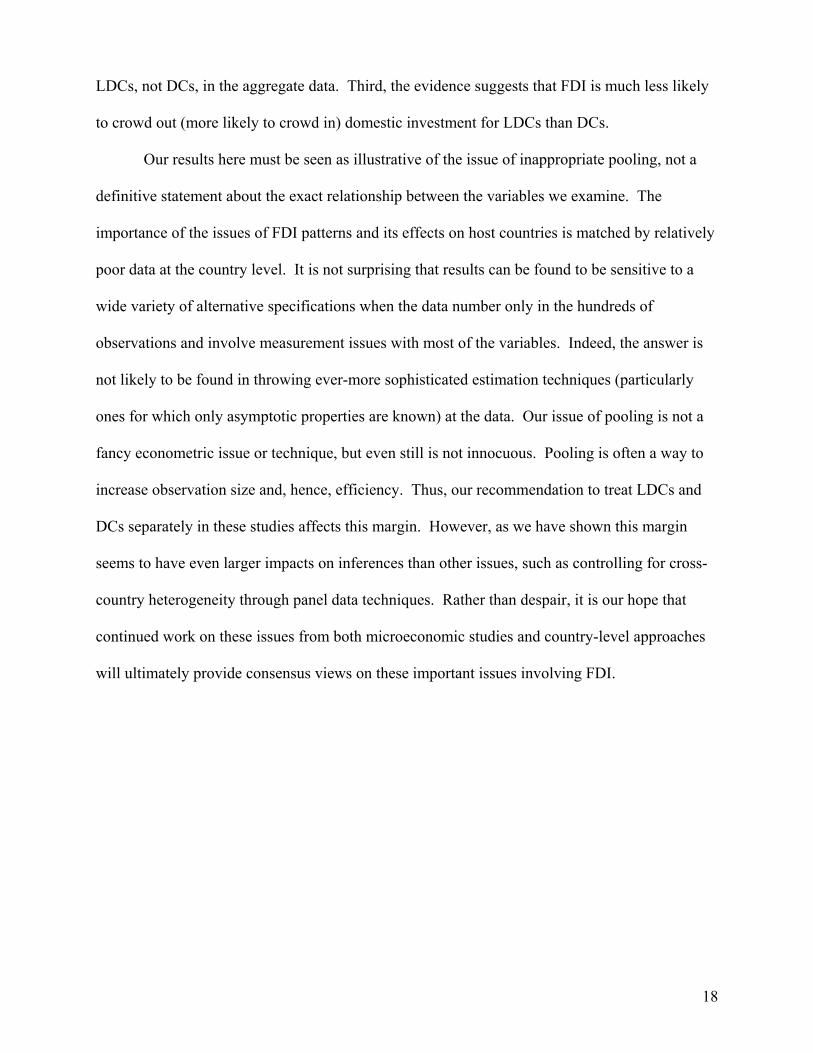
FDI flows between nations have grown at a rapid pace in the past couple decades. As Table
1 shows, world FDI inflows reached $1.3 trillion in 2000 (United Nations, 2001), and the annual
worldwide growth rate since the early 1980s has been over 20%, with almost a 40% growth rate
in the latter 1990s. As has been well documented, the growth of FDI has easily exceeded the
already fast pace of trade growth between countries.
Most world FDI flows continue to be mainly among DCs, especially the “Triad” of Japan,
the European Union, and the United States. Table 2 shows the regional distribution of FDI
inflows and outflows from 1982 to 1998. Over the period of 1986-2000, an average of 72.5
percent of world FDI inflows was received by DCs. However, the share of world FDI activity
2
flowing to LDCs has been rising gradually. LDCs received 35.3 per cent of world FDI inflows
over the period of 1993-1998, compared to an average of 31.2 percent from 1991-1992 and an
average of 17.5 per cent during the second half of the 1980s. At the same time, total FDI flows
into LDCs are also strikingly concentrated. For instance, during the 1990s, the five largest host
countries for FDI inflows are China, Brazil, Mexico, Singapore, and Indonesia and these five
countries accounted for 55 per cent of FDI inflows to all LDCs countries in 1998. Also, the
outflows of FDI from LDCs countries are concentrated in certain regions.
Of course, a big distinction between LDCs and DCs with respect to FDI is that while DCs
have substantial amounts of two-way FDI flows, LDCs are almost exclusively recipients of FDI.
A small exception to this occurs in East and Southeast Asia, especially among Association of
Southeast Asian Nations (ASEAN) countries which see some two-way flows of FDI between
LDCs.
Importantly, FDI inflows are playing an increasingly important role in private capital
flows to LDCs. Around 66.8 percent of total private capital flows to LDCs was FDI in 1998,
compared with a 38.5 percent in 1990.
A final interesting phenomenon we can see in the raw numbers is the sectoral distribution
of world FDI inflows (Figure 1). The share of services FDI has been growing while shares of
manufacturing FDI and primary FDI have been declining over the past decade or so in both
LDCs and DCs. However, LDCs have experienced a larger decrease in manufacturing FDI
inflows and a larger increase in service FDI inflows than DCs. For DCs, the share of
manufacturing FDI inflows fell from 38 percent in 1988 to 35 percent in 1997, primary FDI
inflows from 9 percent to 4 percent, while service FDI inflows went up from 43 to 54 percent.
LDCs’ manufacturing FDI inflows decreased from 66 percent to 50 percent, primary FDI inflows
from 7 percent to 5 percent from 1988 to 1997. Service FDI inflows in LDCs increased from 25
to 41 percent of total inflows.
3
III. Estimating Determinants of FDI
In the past decades, economists have developed ever more realistic models of FDI by
multinational enterprises (MNEs). One main strand of the literature has developed models where
MNEs are motivated by the desire to outsource some of their activities to lower cost countries.
More specifically, such “vertical” FDI sees MNEs from DCs accessing less-skilled workers in
LDCs to perform assembly operations at a lower wage. Formal models of vertical MNE activity
stem back at least to Helpman (1984). An initially separate strand identified an alternative
motivation for FDI that was motivated by accessing markets in the presence of trade frictions,
such as tariffs or transportation costs. Such MNE activity is labeled “horizontal” as it predicts
MNE FDI across larger economies that may be similar in all aspects and involves duplication of
the entire production process (with the exception of headquarter services) across multiple
countries. Formal modeling of horizontal MNE activity dates back to at least Markusen (1984).
Recent work by Markusen et al. (1996) and Markusen (1997) combine both the vertical and
horizontal motivations for FDI into one theoretical model, labeled the knowledge-capital model,
and Carr, Markusen, and Maskus (CMM) (2001) have proposed and estimated an empirical
specification that explains world FDI patterns based on this knowledge-capital model.1
While variations of a gravity model have historically been the most popular empirical
framework for examining FDI activity across countries, the CMM framework is arguably the
most comprehensive empirical specification we have that is grounded to some extent in theory.2
The CMM empirical specification for the FDI from country j to country i in time period t is
given by the following linear specification with a mean zero error term:
1 Yeaple (2003) also develops a model that combines vertical and horizontal motivations for FDI, though no empirical specification to test its implications has been proposed to this point. 2 Related work by Brainard (1997) develops and tests a model of horizontal MNE activity by U.S. firms.
4
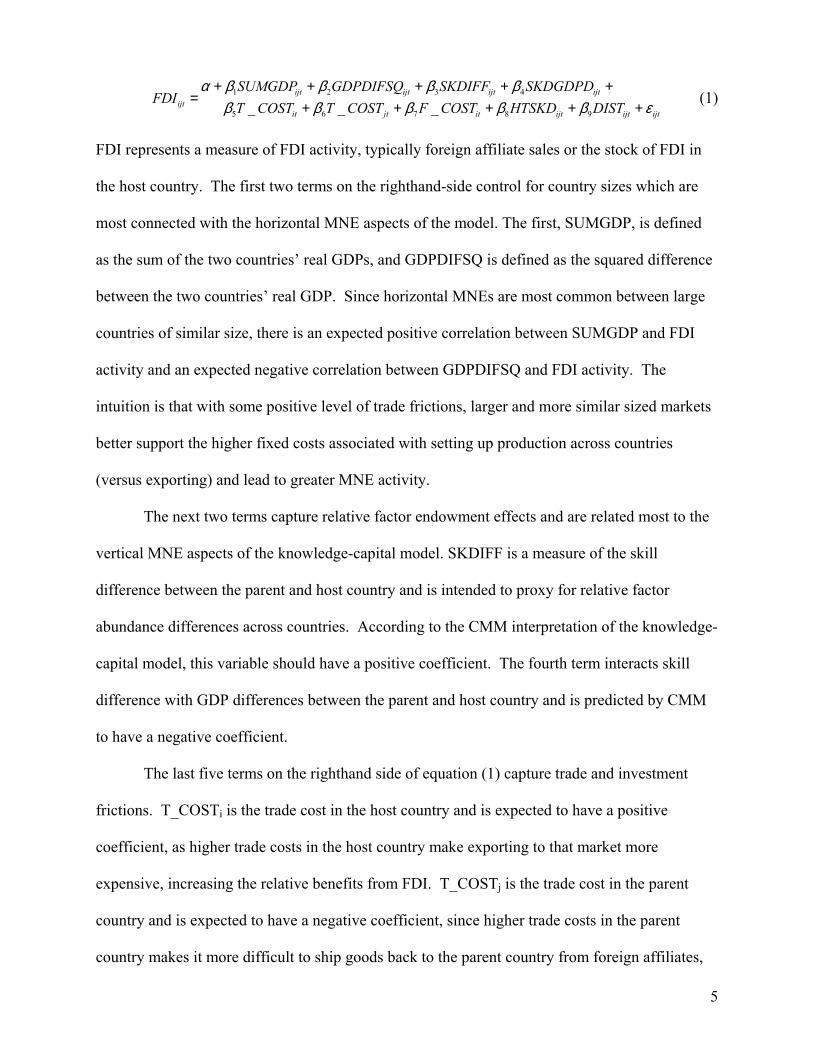
1 2 3 4
5 6 7 8 9 _ _ _ijt ijt ijt ijt
ijtit jt it ijt ijt ijt
SUMGDP GDPDIFSQ SKDIFF SKDGDPDFDI
T COST T COST F COST HTSKD DISTα β β β β
β β β β β ε+ + + + +
=+ + + + +
(1)
FDI represents a measure of FDI activity, typically foreign affiliate sales or the stock of FDI in
the host country. The first two terms on the righthand-side control for country sizes which are
most connected with the horizontal MNE aspects of the model. The first, SUMGDP, is defined
as the sum of the two countries’ real GDPs, and GDPDIFSQ is defined as the squared difference
between the two countries’ real GDP. Since horizontal MNEs are most common between large
countries of similar size, there is an expected positive correlation between SUMGDP and FDI
activity and an expected negative correlation between GDPDIFSQ and FDI activity. The
intuition is that with some positive level of trade frictions, larger and more similar sized markets
better support the higher fixed costs associated with setting up production across countries
(versus exporting) and lead to greater MNE activity.
The next two terms capture relative factor endowment effects and are related most to the
vertical MNE aspects of the knowledge-capital model. SKDIFF is a measure of the skill
difference between the parent and host country and is intended to proxy for relative factor
abundance differences across countries. According to the CMM interpretation of the knowledge-
capital model, this variable should have a positive coefficient. The fourth term interacts skill
difference with GDP differences between the parent and host country and is predicted by CMM
to have a negative coefficient.
The last five terms on the righthand side of equation (1) capture trade and investment
frictions. T_COSTi is the trade cost in the host country and is expected to have a positive
coefficient, as higher trade costs in the host country make exporting to that market more
expensive, increasing the relative benefits from FDI. T_COSTj is the trade cost in the parent
country and is expected to have a negative coefficient, since higher trade costs in the parent
country makes it more difficult to ship goods back to the parent country from foreign affiliates,
5
which makes vertical FDI a less attractive option. F_COST is the cost of investing in the host
country which is measured by an index based on survey data of the business environment risk in
a host country. As this rises, FDI should fall. HTSKD interacts host trade costs with the squared
skill difference. Since host trade costs should matter less when FDI is vertical (i.e. skill
differences are large), this carries an expected negative coefficient. Finally DIST is the distance
between countries. Since higher distances make both trade and control of overseas FDI more
difficult, the net effect is ambiguous.
Empirical results for the CMM specification are generally good, except for a key puzzle.
As shown by Blonigen, Davies and Head (2003), the skill difference term in the CMM
specification has the wrong sign and is statistically significant when the variable is properly
specified. Thus, the key variable identifying vertical motivations for FDI fails and suggests that
observed FDI patterns are mainly connected with horizontal motivations. This is puzzling and
contrasts with recent findings by Hanson, Mataloni and Slaughter (2003) of substantial vertical
FDI, or outsourcing, by U.S. MNES that increases with lower wages in a destination country.
A key concern is that the CMM specification is not adequate to disentangle the vertical
from the horizontal motivations for FDI from the use of data that pools observations of FDI
activity across DCs and LDCs. CMM test their model with data on bilateral FDI activity
between the U.S. and partner countries. This includes both observations on U.S. outbound FDI
in both DCs and LDCs and inbound FDI into the U.S. from other parent countries (DCs and
potentially LDCs). The process behind these various combinations of host and parent country
FDI activities are likely quite different and coefficient estimates from pooled data may provide
estimates that are not an accurate representation of any of these activities.
To investigate this further, we take the CMM specification and explore stability of
coefficients across DCs and LDCs. We use the dataset from Blonigen and Davies (forthcoming)
on U.S. bilateral FDI activity, which provides a more comprehensive set of data on U.S. FDI
6
activity than CMM. This data set spans U.S. FDI activity with all partner countries for which
data are available for the years 1970-1999. Given the critique in Blonigen, Davies and Head
(2003) we look separately at U.S. inbound and outbound FDI, since for the inbound FDI
observations the parents are always skill-deficient relative to the host and vice versa for
outbound FDI. Details on data sources and variable construction are in the data appendix.
As mentioned, an implication of CMM is that we can pool all countries and directions of
FDI activity and estimate coefficient estimates that are valid for the entire sample. Alternatively,
we hypothesize that the vertical motivations for MNE activity will be more evident with respect
to U.S. FDI with LDCs, in particular for outbound U.S. FDI, where the U.S. is a relatively
skilled country potentially searching for outsourcing destinations. For MNE activity (both
inbound and outbound) between the U.S. and other DCs, the horizontal aspects of the model are
expected to be stronger. For U.S. inbound FDI activity from LDCs, horizontal aspects should
predominate as LDCs should not be looking to source low-wage activities to the U.S. There is a
potential model of LDCs having MNEs that outsource high-skilled activities to DCs, but this
model has never been proposed and is arguably inconsistent with the standard models proposed
by Markusen and others. Thus, if anything, we should see mainly horizontal motivations
governing the small amount of observed FDI by LDCs into DCs; i.e., FDI motivated by the
desire to access a large market in the presence of trade frictions.
Table 3 provides our baseline results using data on FDI stock. Our first and third
columns of results report baseline estimates for U.S. outbound and inbound FDI between all
country destinations for which data are available. The results show mixed evidence for the
efficacy of these base results. The R2 statistics are reasonably high for a sample with such cross-
section variation. However, only five of the eight CMM variables in the outbound regression
and only four of the eight CMM variables in the inbound regression have the expected sign.
Consistent with Blonigen, Davies, and Head (2003) the skill difference term (SKDIFF) has a
7
negative coefficient, which is exactly opposite of what CMM would predict if vertical
motivations for MNE activity exist. Instead, the coefficients suggest that FDI increases as skill
differences decline which supports a purely horizontal model of world MNE activity.
An explanation for these results is that the baseline CMM specification does not
encompass the different processes that govern FDI across such heterogeneous countries. To
explore this, the second and fourth columns of Table 3 add interactions of CMM variables with a
dummy variable indicating whether a country is an LDC. We classify Australia, Canada, Hong
Kong, Iceland, Japan, New Zealand, Norway, Switzerland, and the European Union countries (as
of 2003) as DCs. All other countries are classified as LDCs. The coefficient terms on these
variables give the incremental difference in the variable’s effect on FDI when the observation is
connected with an LDC rather than a DC. As the results show, these interactions are extremely
important. The adjusted R2 in each equation goes up dramatically and an F-test strongly supports
the inclusion of these LDC interaction terms in both the inbound and outbound equations. Many
of the LDC interaction terms are statistically significant and in almost every instance are exactly
opposite in sign to its counterpart non-interacted CMM term. This evidence strongly suggests
that a different process is governing MNE activity with LDCs that is not captured by the standard
CMM model.
With respect to the skill-difference puzzle, the LDC interaction with SKDIFF has a
statistically significant positive coefficient for the outbound FDI regressions. However, the total
direct effect of SKDIFF on FDI activity for U.S. outbound to LDCs -- the sum of the coefficients
on SKDIFF and SKDIFF*LDC -- is negative and statistically insignificant (F=1.12 with p-
value=0.28). This point estimate is also small in terms of economic significance, with a standard
deviation change in skill difference reducing FDI stock by $1.4 million. Thus, while the inverse
relationship between skill differences and FDI activity is no longer true for U.S. outbound FDI to
8
LDCs, there is no statistically significant evidence for a positive relationship which would be
consistent with vertical motivations for FDI.3
As discussed in Blonigen and Davies (forthcoming), a concern with the data used to test
the CMM model in all previous literature is the statistical properties of these estimators due to
the pronounced skewness in much of the data. For example, the outbound FDI data show a mean
of $10.9 billion dollars across destination countries with a standard deviation of $22.1 billion.
There are many destinations with very low levels of FDI stock up to a maximum of $233.1
billion. There is similar skewness in the inbound sample as well. Not surprisingly then, a
Shapiro-Wilk (1965) test easily rejects normality of the residuals and a Ramsey (1969) RESET
test strongly suggests omitted variable bias, even after one includes the LDC interaction terms.
Table 4 presents results from a log-linear model. The linear model proposed by CMM is
not a structural equation derived from theory, so there is nothing inherently inconsistent with
specifying a log-linear model, and this functional form transformation is often used when data
are highly skewed. One issue when logging the data is dealing with negative values of the
dependent variable and trade cost measures for some observations. We truncate these
observations to 0.1 before taking logs although we get qualitatively similar results if we simply
drop these observations. In addition, the interaction terms – SKDGDPD and HTSKD – are
perfectly collinear once logged and, thus, are dropped from the CMM specification.
Statistically significant differences for U.S. MNE activity between LDC and DC remain
in the alternative log-linear model. Once again, for U.S. outbound FDI stock we find that the
vertical aspects of MNE activity show up in the SKDIFF*LDC variable, which has a positive
coefficient. Unlike in the linear model the coefficient on this variable is statistically significant,
3 The total marginal effect of SKDIFF on FDI must also take into account the interaction terms with GDP differences. The estimated coefficients on these terms for U.S. outbound FDI are small and statistically insignificant. At the means of the data, they yield the same qualitative comparisons of marginal effects as those reported here on only the direct marginal effects of the SKDIFF terms.
9
though total skill difference effect for LDC countries – the sum of the coefficients on SKDIFF
and SKDIFF*LDC – is once again statistically and economically insignificant.
Table 4 displays other interesting differences with respect to U.S. FDI patterns between
LDCs and DCs. In the outbound regressions, increases in SUMGDP still have a positive impact
on FDI activity, but the coefficient falls from 5.43 to 2.14 (5.43-3.29). This suggests that GDP
growth in the LDC is not as important for the amount of U.S. FDI it receives, which is again
more consistent with a vertical MNE, rather than a horizontal MNE, story. The other significant
difference is that FDI costs (as measured by an index of business environment risk in the host
country) are much more important for LDC hosts than DC hosts. MNEs may be much more
sensitive to changes in these risks for LDC countries that are generally more risky. In the
inbound regressions, the most notable differences for LDCs concern the SKDIFF and
DISTANCE variables. First, greater skill differences have an even larger negative effect on FDI
activity from LDCs into the U.S. than for DCs. This is likely because FDI from an LDC into the
U.S. is often insignificant until a country has reached some threshold level of education or
skills.4 Second, distance does not seem to negatively affect LDC FDI into the U.S., as it does for
DCs.
What conclusions can we draw from these results? First, the evidence strongly suggests
that the standard CMM model does not yield a comprehensive model of world MNE activity.
There appear to be substantial differences in the factors that determine MNE activity between the
U.S. and LDCs compared to that between the U.S. and DCs. This casts doubt on the CMM
specification’s ability to identify vertical versus horizontal MNE activity. The follow-up
question is where do we go from here? Are there feasible modifications to the CMM
specification that would lead to a comprehensive model or is it more fruitful to develop models
4 As discussed below, such education thresholds also seem important for whether inbound FDI increases growth in LDCs.
10
that focus on DC-LDC or DC-DC FDI separately? We do not have a definitive answer to this,
but note that our attempts to modify the CMM specification to yield residuals with nice statistical
properties have been unsuccessful. These modifications (many of which are reported further in
Blonigen and Davies, 2003) include country fixed effects, first difference specifications, and
inclusion of short-run determinants FDI activity, such as tax and exchange rate changes. None
of these provide specifications that can pass a RESET omitted variable test or a test for normality
of residuals. The CMM specification represents the state of the art in providing an empirical
framework to understand world patterns of FDI, but we obviously have a long way to go.
Further exploration into the differences between the process that guides such activity for LDCs
and DCs is clearly an import avenue of research.
IV. FDI and Growth
The issue of which factors affect economic growth is one of the more important that
economists can study. As evidenced by the literature estimating cross-country growth equations,
however, the wide variation in results across various samples and econometric methodologies
calls into question our ability to say anything definitive about what factors are important for
economic growth.5 Despite these concerns, recent papers have begun to examine whether FDI, a
factor largely ignored in previous literature, has an independent impact on economic growth of
countries.
Two more well-known papers, Balasubramanyam et al. (1996) and Borensztein et al.
(1998) examine this issue in the context of LDCs and find that FDI is positively correlated with
economic growth, but only under certain conditions. Balasubramanyam et al. (1996) find that
the evidence of a positive effect of FDI is strongest when the LDC is pursuing export promotion
5 Important papers pointing to the fragility of cross-country growth results include Levine and Renelt (1992), Sala-I-Martin (1997), Islam (1995), and Lee et al. (1998).
11
policies, rather than import substitution policies. Borensztein et al. (1998) find that FDI
positively affects economic growth in LDCs only after the country has a sufficient human capital
threshold, as proxied by years of schooling of males over the age of 25. The strength of these
papers is an economic hypothesis about when FDI should affect growth for an LDC (and when it
should not) which is confirmed by the empirical analysis.
A couple recent papers, however, have cast doubt on the effect of FDI on growth,
including Carkovic and Levine (2003) and Choe (2003). Carkovic and Levine use dynamic
panel techniques to control for endogeneity, unobserved country effects, and a lagged dependent
variable, while Choe performs Granger causality tests on a panel of countries from 1971 through
1995. Both find little evidence that FDI affects economic growth. What these results mean for
the previous studies by Balasubramanyam et al. (1996) and Borensztein et al. (1998) is less clear,
however, since these more recent papers find insignificance for a sample that includes both
LDCs and DCs, while the previous papers focus on LDCs. Indeed, Balasubramanyam et al.
(1996) and Borensztein et al. (1998) motivate their empirical analysis with hypotheses that are
arguably only valid for understanding the effect of FDI on LDCs. This calls into question
whether the evidence of insignificance is coming from inappropriate pooling of the recent papers
or inappropriate methodology of the previous LDC-only papers.
In this section, we examine whether it is appropriate to pool LDCs and DCs in growth
regressions using a common cross-section (and panel) setting. A frustration with this literature is
that there is no common sample used to explore these issues. Instead there seem to be many
papers providing varying results from varying samples which precludes any direct comparison.
Layered onto this is the variety of alternative econometric techniques employed. Statistical tests
can at least provide evidence on preferred techniques, but the evidence of these tests may vary by
the sample employed. An important choice, often not discussed, is frequency of the data. Given
that FDI is a source of capital, theory would suggest that FDI stock is the appropriate measure of
12
FDI for these growth regressions. FDI stock data is difficult to construct and often not available.
Thus, some studies, such as Borensztein et al. use FDI flows, but aggregate their data by decade.
Other studies use annual observations of FDI flows. In construction of our sample, we use the
former method because of concerns that highly-variable annual FDI flows are much further away
from our ideal measure of FDI stock.
Do we really think that such annual flows (or even one-year lagged flows) have a discernible
effect on this year’s growth rate? On the other hand, multiple observations of the same country
seem essential to be able to control for unobserved country-specific heterogeneity. Many
features of countries that are hypothesized to be important for growth seem largely time-
invariant, such as institutions, culture, etc. Proxies for such important factors used in cross-
sectional analysis are likely to have considerable measurement error. Thus, reducing omitted
variable bias from these time-invariant factors through panel data techniques seems essential.
With gracious help from Eduardo Borensztein and Jong-Wha Lee, we were able to obtain
the data used in Borensztein et al. (1998).6 As mentioned above, these data are a panel of decade-
averages of the variables for the 1970s and 1980s for LDCs only. We then augmented their data
by collecting observations for all the DCs for which we could get identical measures of the
variables.7 Linked to this common dataset from a well-known analysis in the area, we can then
explore the effects of pooling LDCs and DCs on the estimate effects of FDI on growth, as well
as sensitivity to using panel data techniques.
Columns 1 and 2 of Table 5 provide Seemingly Unrelated Regression (SUR) estimates of
the determinants of per capita growth across countries for the two decades of data, 1970-79 and
1980-89. We follow Borensztein et al. (1998) in constraining all the coefficients to be the same
6 We were able to gather all the data used in that paper with the exception of the data used for their institution variable. We were also able to get almost identical parameter estimates to those specifications reported in their paper that did not use the institution variable.
13
across the two decades with the exception of the constant and, thus, report just one set of
coefficient estimates. Column 1 of Table 5 provides our base estimates when we use the same
specification as Borensztein et al. (column 1.6 of their Table 1) but use a sample of both LDCs
and DCs, not just LDCs. The estimated coefficients largely follow expected signs and standard
statistical measures suggest a decent goodness of fit. However, unlike Borensztein et al. (1998),
these estimates using data pooling LDCs and DCs show much-reduced coefficient estimates on
the FDI measures and no statistically significant effect of FDI on growth. Thus, pooling seems
to have a substantial impact on the empirical evidence with respect to this issue.
This is confirmed in column 2 of Table 5, where we include interactions of our variables
with a dummy variable indicating our LDC countries.8 A statistical test suggests that these
interactions are jointly significant, though the most substantial impact occurs with the FDI
variables. As in the previous section, the coefficients on the standard variables indicate the
effects for DCs, while the effect for LDCs is the sum of the coefficients of the standard variables
and their interactions with the LDC dummy variable. Thus, the coefficients for LDCs on FDI
and FDI*schooling are -1.383 and 3.858, respectively. Both of these combined coefficients are
statistically significant at the 1% significance level and suggest the same pattern found by
Borensztein et al. (1998). In particular, FDI has a significant impact on per capita growth only
after education levels in the LDC are at a high enough threshold level. As is clear, no such
relationship exists for the DCs and pooling the data (as in column 1) obscures this important
relationship.
Interestingly, the magnitude of the estimated effects of FDI on growth for LDCs is much
larger in this pooled sample than in Borensztein et al. (1998). These estimates suggest that the
7 This added 19 additional countries: Austria, Australia, Belgium, Canada, Denmark, Finland, France, Ireland, Italy, Japan, Netherlands, New Zealand, Norway, Portugal, Spain, Sweden, West Germany, United Kingdom, and United States.
14
turning point is at a lower level of education than by Borensztein et al. – 0.36 average years
secondary schooling for males over 25 versus 0.89 years. This means that the estimated impact
of FDI on growth is negative for only the 20 poorest countries in the sample, primarily in sub-
Saharan Africa, whereas Borensztein et al.’s estimates suggest that it is negative for all but the
wealthier LDCs.
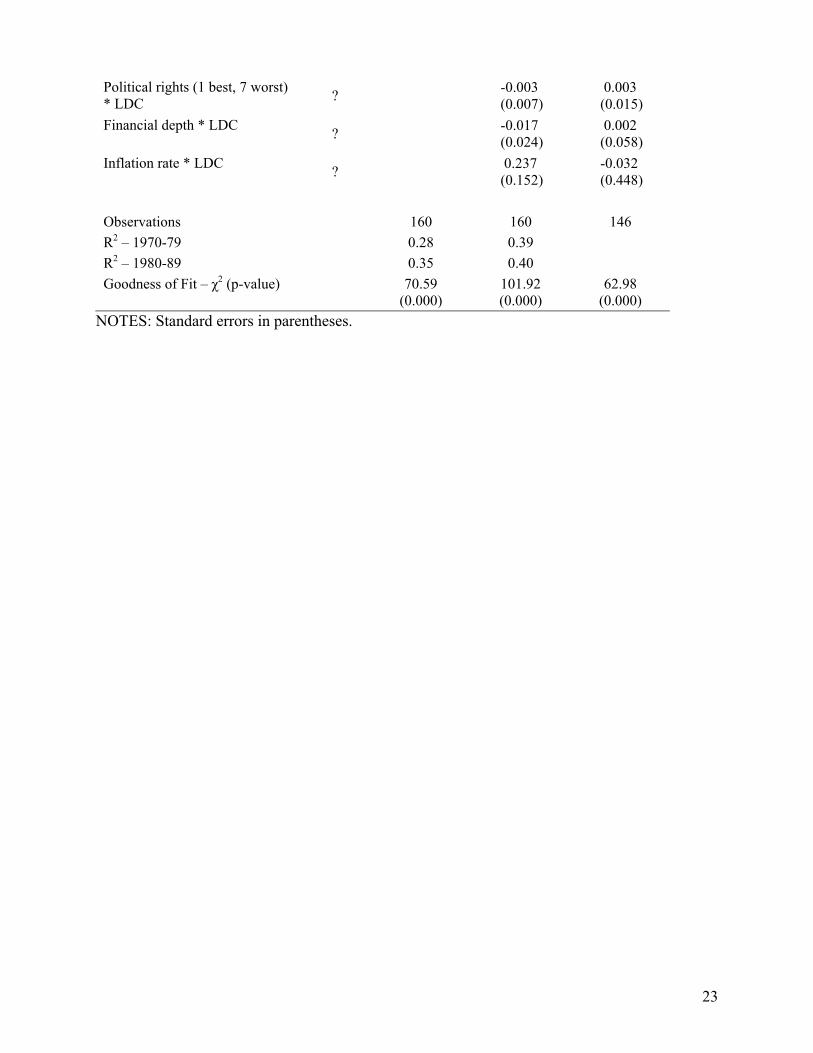
The SUR estimates do not control for unobserved heterogeneity across countries. Given
we have two time periods (1970-79 and 1980-89), panel data techniques can be applied to
control for such heterogeneity, eliminating this potential source of omitted variable bias.
Column 3 of Table 5 provides random effects estimates of the data using a specification that
includes the LDC interactions. In this setting, exploiting the panel nature of data does not have a
substantial effect on inferences, especially with respect to the FDI variables. As with the SUR
estimates, there are no statistically significant effects of FDI with respect to DCs, but there are
the same types of effects of FDI for LDCs. The combined effects of FDI and FDI*schooling for
LDCs are -2.152 and 2.836 with probability values of 0.12 and 0.04, respectively. The threshold
level of schooling before the effect of FDI becomes positive is now 0.76, which is much closer to
the Borensztein et al. estimates.
In summary, the evidence in this section suggests that inappropriate pooling of DCs with
LDCs, not the introduction of panel techniques, is responsible for estimation of insignificant
effects of FDI with respect to per capita GDP growth. The persuasive arguments for the effects
of FDI, however, have been made with LDCs in mind. That is precisely where the evidence
suggests that FDI does indeed affect growth, conditioned on a sufficient level of human capital.
8 The variables, Sub-Saharan African dummy, Latin American dummy, and Wars, were not interacted since they are perfectly or highly collinear with an LDC dummy variable.
15
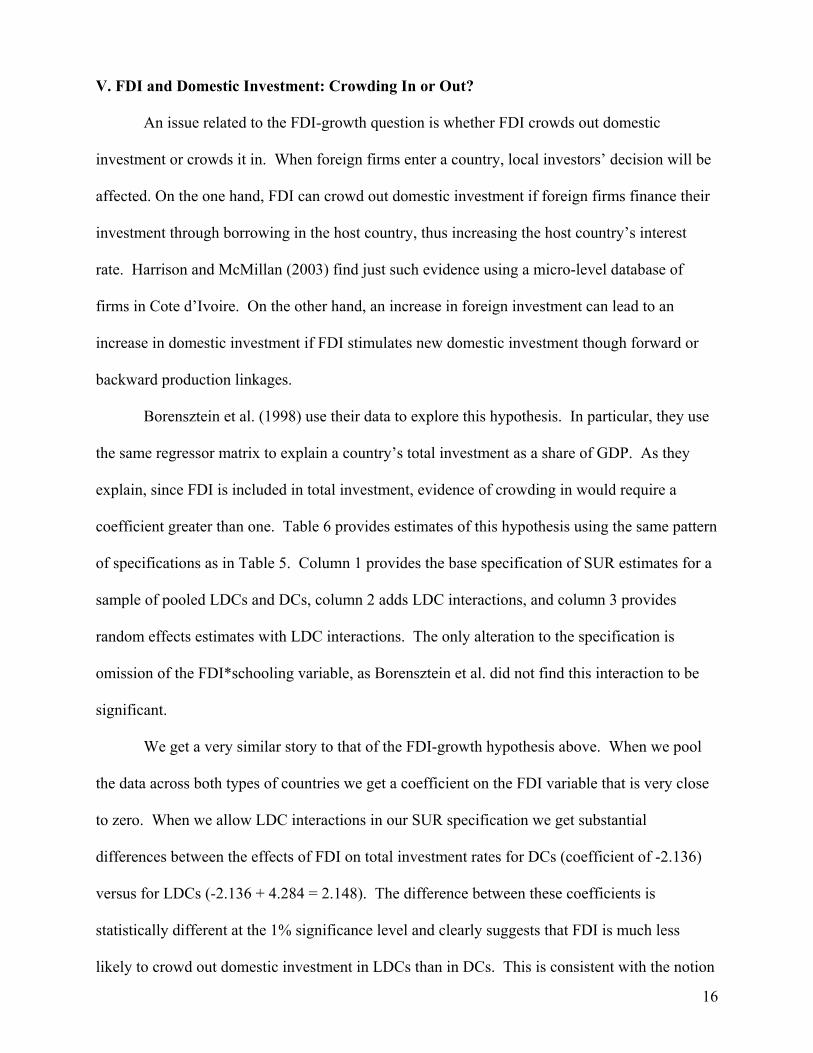
V. FDI and Domestic Investment: Crowding In or Out?
An issue related to the FDI-growth question is whether FDI crowds out domestic
investment or crowds it in. When foreign firms enter a country, local investors’ decision will be
affected. On the one hand, FDI can crowd out domestic investment if foreign firms finance their
investment through borrowing in the host country, thus increasing the host country’s interest
rate. Harrison and McMillan (2003) find just such evidence using a micro-level database of
firms in Cote d’Ivoire. On the other hand, an increase in foreign investment can lead to an
increase in domestic investment if FDI stimulates new domestic investment though forward or
backward production linkages.
Borensztein et al. (1998) use their data to explore this hypothesis. In particular, they use
the same regressor matrix to explain a country’s total investment as a share of GDP. As they
explain, since FDI is included in total investment, evidence of crowding in would require a
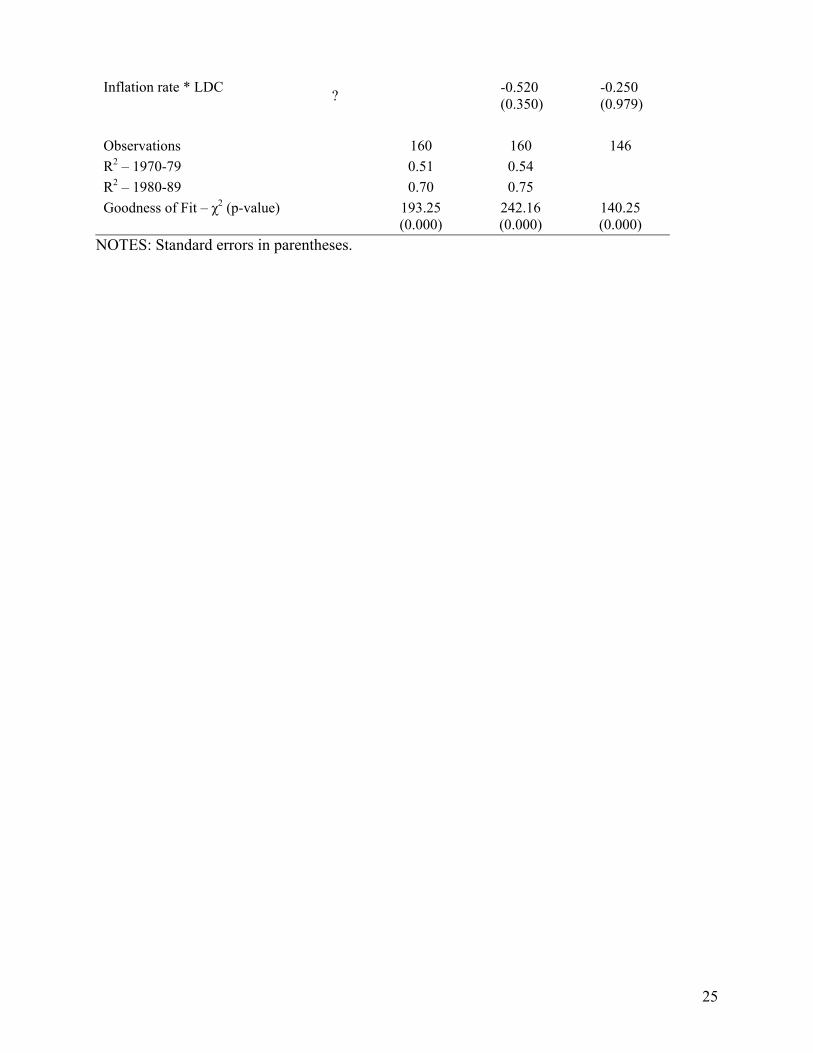
coefficient greater than one. Table 6 provides estimates of this hypothesis using the same pattern
of specifications as in Table 5. Column 1 provides the base specification of SUR estimates for a
sample of pooled LDCs and DCs, column 2 adds LDC interactions, and column 3 provides
random effects estimates with LDC interactions. The only alteration to the specification is
omission of the FDI*schooling variable, as Borensztein et al. did not find this interaction to be
significant.
We get a very similar story to that of the FDI-growth hypothesis above. When we pool
the data across both types of countries we get a coefficient on the FDI variable that is very close
to zero. When we allow LDC interactions in our SUR specification we get substantial
differences between the effects of FDI on total investment rates for DCs (coefficient of -2.136)
versus for LDCs (-2.136 + 4.284 = 2.148). The difference between these coefficients is
statistically different at the 1% significance level and clearly suggests that FDI is much less
likely to crowd out domestic investment in LDCs than in DCs. This is consistent with the notion
16
that technology spillovers, as well as backward and forward production linkages, are more
common with FDI into LDCs. While the effect of FDI on total investment is statistically
different from zero for LDCs, we cannot rule out that it takes the value of 1. Therefore, our tests
do not necessarily support a “crowding in” effect from FDI which is consistent with the evidence
found by Borensztein et al. (1998).
In related work, Wang (2003) examines the crowding out/in hypothesis using annual data
on FDI flows across a panel of OECD and non-OECD countries. She also investigates lagged
values of these FDI flows on domestic investment to control for endogeneity concerns. Her
analysis provides even stronger evidence that FDI crowds in domestic investment for non-OECD
(or LDC) countries than that presented here. Likewise, she finds that no such effect exists for
OECD countries.
In summary, there is evidence that pooling LDCs and DCs when examining the crowding
in/out hypothesis effect on domestic investment is inappropriate. The evidence to date suggests
that FDI is much less likely to crowd out (more likely to crowd in) domestic investment for
LDCs than DCs. Pooling the data is likely to obscure this potentially important relationship.
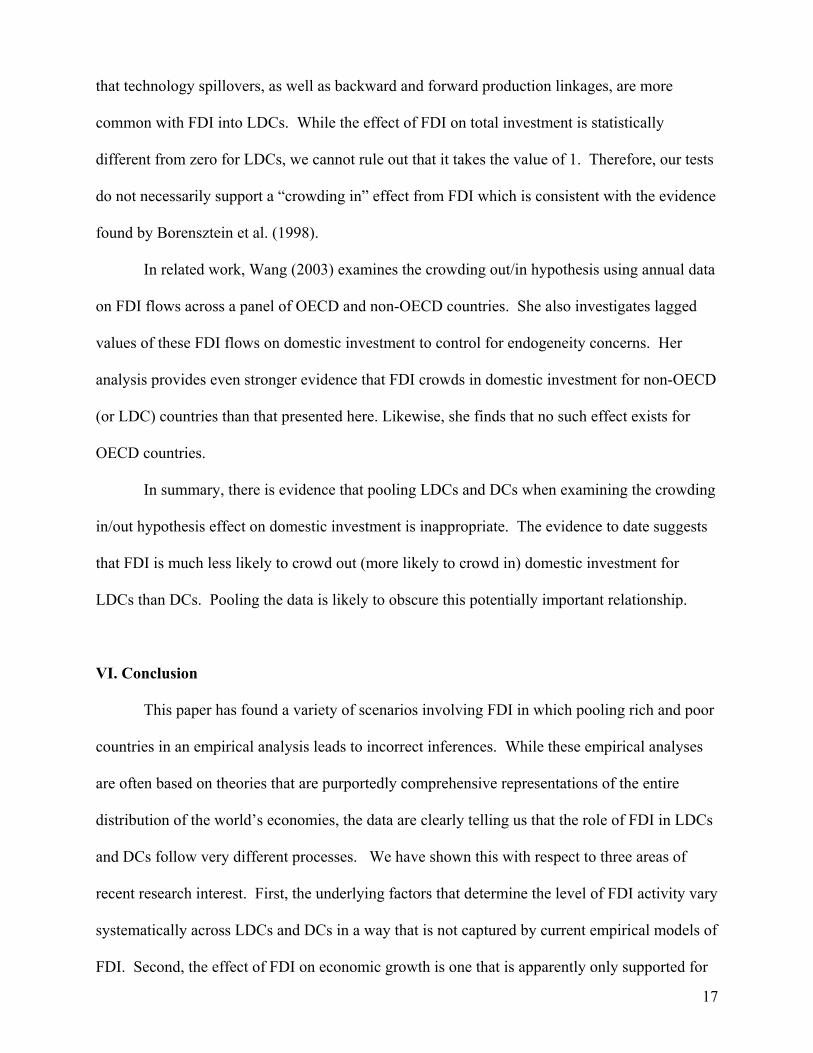
VI. Conclusion
This paper has found a variety of scenarios involving FDI in which pooling rich and poor
countries in an empirical analysis leads to incorrect inferences. While these empirical analyses
are often based on theories that are purportedly comprehensive representations of the entire
distribution of the world’s economies, the data are clearly telling us that the role of FDI in LDCs
and DCs follow very different processes. We have shown this with respect to three areas of
recent research interest. First, the underlying factors that determine the level of FDI activity vary
systematically across LDCs and DCs in a way that is not captured by current empirical models of
FDI. Second, the effect of FDI on economic growth is one that is apparently only supported for
17
LDCs, not DCs, in the aggregate data. Third, the evidence suggests that FDI is much less likely
to crowd out (more likely to crowd in) domestic investment for LDCs than DCs.
Our results here must be seen as illustrative of the issue of inappropriate pooling, not a
definitive statement about the exact relationship between the variables we examine. The
importance of the issues of FDI patterns and its effects on host countries is matched by relatively
poor data at the country level. It is not surprising that results can be found to be sensitive to a
wide variety of alternative specifications when the data number only in the hundreds of
observations and involve measurement issues with most of the variables. Indeed, the answer is
not likely to be found in throwing ever-more sophisticated estimation techniques (particularly
ones for which only asymptotic properties are known) at the data. Our issue of pooling is not a
fancy econometric issue or technique, but even still is not innocuous. Pooling is often a way to
increase observation size and, hence, efficiency. Thus, our recommendation to treat LDCs and
DCs separately in these studies affects this margin. However, as we have shown this margin
seems to have even larger impacts on inferences than other issues, such as controlling for cross-
country heterogeneity through panel data techniques. Rather than despair, it is our hope that
continued work on these issues from both microeconomic studies and country-level approaches
will ultimately provide consensus views on these important issues involving FDI.
18
Table 1. World FDI flows, 1982-2001.
Value at Current prices (Billions of US dollars)
Annual Growth rate (per cent)
1982 1990 2000 1986-1990 1991-1995 1996-2000FDI inflows 59 203 1300 23.6 20.0 40.1 FDI outflows 28 233 621 24.3 15.8 36.7
(Source: United Nations, various issues)
Table 2. Regional distribution of FDI inflows and outflows: Regions as a share of total.
Inflows Outflows Region/Country 1982-
87 1988-
92 1993-
95 1996 1997 19981982-
97 1988-
92 1993-
95 1996 1997 1998 DCs
78.1
78.5
62.0
58.8
58.9
71.5
98.0
95.7
85.8
84.2
85.6
91.6
Western Europe 31.5 47.4 36.0 32.1 29.1 36.9 55.3 59.7 47.0 53.7 50.6 62.6 European Union 28.2 43.9 34.0 30.4 27.2 35.7 47.4 50.1 42.7 47.9 46.0 59.5
Other Western Europe 3.4 3.5 2.0 1.8 1.9 1.2 7.9 9.6 4.3 5.8 4.6 3.1
United States 39.9 22.6 18.8 21.3 23.5 30.0 19.8 14.1 27.7 19.7 23.1 20.5 Japan 0.7 0.5 0.2 0.1 0.7 0.5 13.4 17.4 6.2 6.2 5.5 3.7 Other Developed Countries
6.0 7.9 7.1 5.3 5.6 4.1 9.5 4.5 5.2 4.6 6.4 4.9
LDCs
21.8
20.6
34.8
37.7
37.2
25.8
1.9
4.3
14.1
15.5
13.7
8.1
Africa 2.8 1.8 1.9 1.6 1.6 1.2 0.1 0.1 0.2 - 0.3 0.1 Latin America and the Caribbean
8.9 6.7 9.8 12.9 14.7 11.1 0.4 0.3 1.2 1.9 3.3 2.4
Developing Europe - 0.1 0.1 0.3 0.2 0.2 - - 0.0 - 0.1 - Asia 10.1 12.1 23.0 22.9 20.6 13.2 1.4 3.8 12.7 13.6 10.0 5.6 West Asia 0.6 0.3 0.7 0.2 1.0 0.7 0.2 0.1 0.3 0.6 0.4 0.3 Central Asia - - 0.3 0.6 0.7 0.5 - - - - - -
South, East, and Southeast Asia
9.3 11.5 21.9 22.1 18.9 12.0 1.2 3.7 12.3 13.0 9.6 5.3
The Pacific 0.2 0.2 0.1 0.1 - - - - - - - - Central and Eastern Europe
- 0.9 3.2 3.5 4.0 2.7 - - 0.1 0.3 0.7 0.3
World
100
100
100
100
100
100
100
100
100
100
100
100
(Source: United Nations, various issues)
19
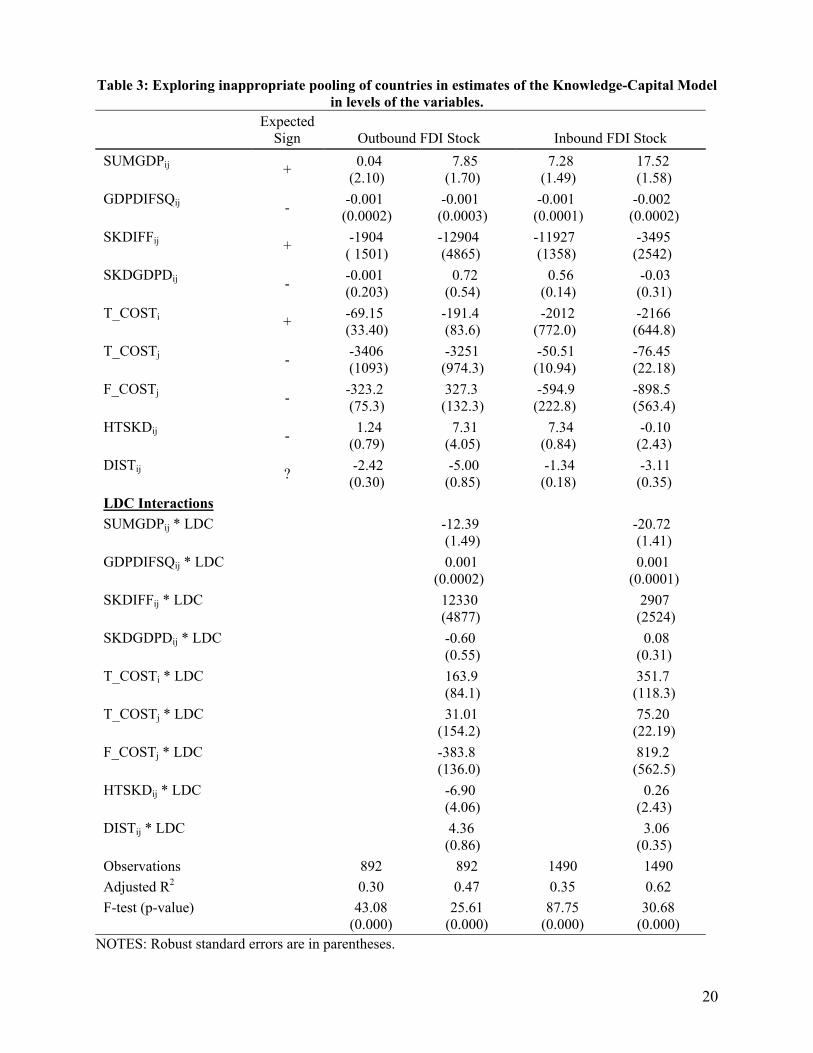
Table 3: Exploring inappropriate pooling of countries in estimates of the Knowledge-Capital Model in levels of the variables.
Expected Sign
Outbound FDI Stock
Inbound FDI Stock
SUMGDPij + 0.04 (2.10)
7.85 (1.70)
7.28 (1.49)
17.52 (1.58)
GDPDIFSQij - -0.001 (0.0002)
-0.001 (0.0003)
-0.001 (0.0001)
-0.002 (0.0002)
SKDIFFij + -1904 ( 1501)
-12904 (4865)
-11927 (1358)
-3495 (2542)
SKDGDPDij - -0.001 (0.203)
0.72 (0.54)
0.56
(0.14) -0.03
(0.31) T_COSTi + -69.15
(33.40) -191.4 (83.6)
-2012 (772.0)
-2166 (644.8)
T_COSTj - -3406 (1093)
-3251 (974.3)
-50.51 (10.94)
-76.45 (22.18)
F_COSTj - -323.2 (75.3)
327.3 (132.3)
-594.9 (222.8)
-898.5 (563.4)
HTSKDij - 1.24 (0.79)
7.31 (4.05)
7.34 (0.84)
-0.10 (2.43)
DISTij ? -2.42 (0.30)
-5.00 (0.85)
-1.34 (0.18)
-3.11 (0.35)
LDC Interactions SUMGDPij * LDC -12.39
(1.49) -20.72 (1.41)
GDPDIFSQij * LDC 0.001 (0.0002) 0.001
(0.0001) SKDIFFij * LDC 12330
(4877) 2907 (2524)
SKDGDPDij * LDC -0.60 (0.55) 0.08
(0.31) T_COSTi * LDC 163.9
(84.1) 351.7 (118.3)
T_COSTj * LDC 31.01 (154.2) 75.20
(22.19) F_COSTj * LDC -383.8
(136.0) 819.2 (562.5)
HTSKDij * LDC -6.90 (4.06) 0.26
(2.43) DISTij * LDC 4.36
(0.86) 3.06 (0.35)
Observations 892 892 1490 1490 Adjusted R2 0.30 0.47 0.35 0.62 F-test (p-value) 43.08
(0.000) 25.61
(0.000) 87.75
(0.000) 30.68
(0.000) NOTES: Robust standard errors are in parentheses.
20
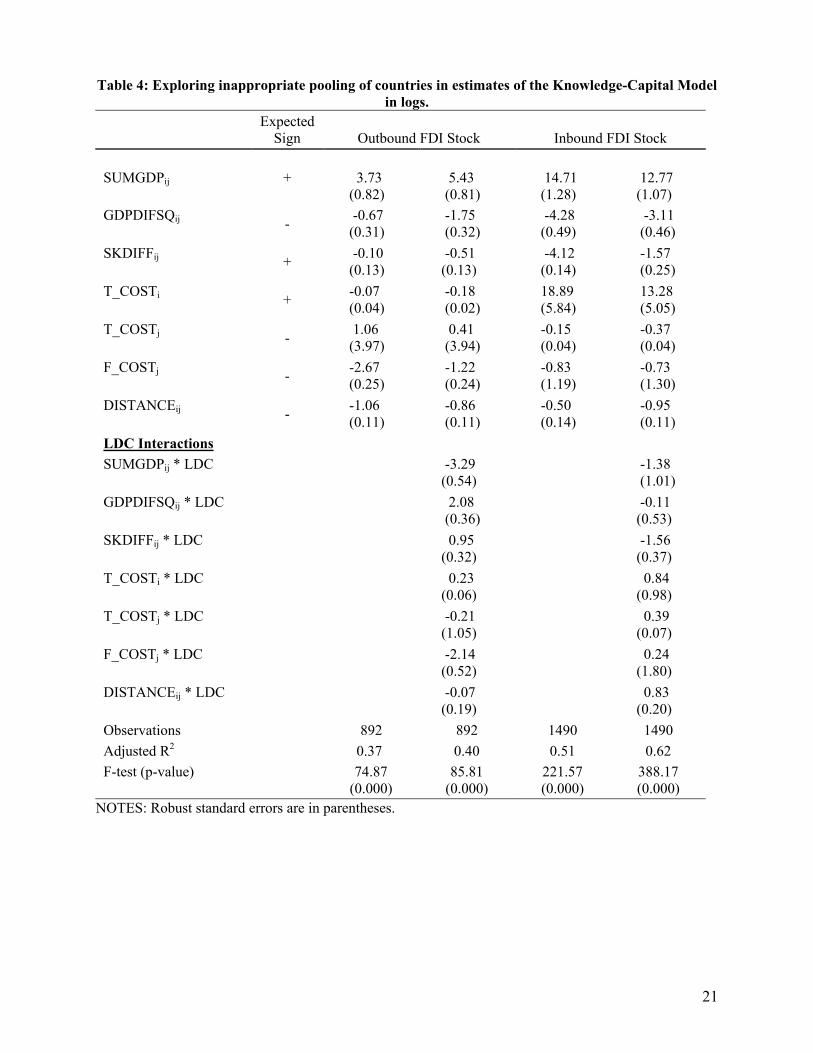
Table 4: Exploring inappropriate pooling of countries in estimates of the Knowledge-Capital Model in logs.
Expected Sign
Outbound FDI Stock
Inbound FDI Stock
SUMGDPij +
3.73
(0.82)
5.43
(0.81)
14.71
(1.28)
12.77
(1.07) GDPDIFSQij - -0.67
(0.31) -1.75 (0.32)
-4.28 (0.49)
-3.11 (0.46)
SKDIFFij + -0.10 (0.13)
-0.51 (0.13)
-4.12 (0.14)
-1.57 (0.25)
T_COSTi + -0.07 (0.04)
-0.18 (0.02)
18.89 (5.84)
13.28 (5.05)
T_COSTj - 1.06 (3.97)
0.41 (3.94)
-0.15 (0.04)
-0.37 (0.04)
F_COSTj - -2.67 (0.25)
-1.22 (0.24)
-0.83 (1.19)
-0.73 (1.30)
DISTANCEij - -1.06 (0.11)
-0.86 (0.11)
-0.50 (0.14)
-0.95 (0.11)
LDC Interactions SUMGDPij * LDC -3.29
(0.54) -1.38
(1.01) GDPDIFSQij * LDC 2.08
(0.36) -0.11
(0.53) SKDIFFij * LDC 0.95
(0.32) -1.56
(0.37) T_COSTi * LDC 0.23
(0.06) 0.84
(0.98) T_COSTj * LDC -0.21
(1.05) 0.39
(0.07) F_COSTj * LDC -2.14
(0.52) 0.24
(1.80) DISTANCEij * LDC -0.07
(0.19) 0.83
(0.20) Observations 892 892 1490 1490 Adjusted R2 0.37 0.40 0.51 0.62 F-test (p-value) 74.87
(0.000) 85.81
(0.000) 221.57 (0.000)
388.17 (0.000)
NOTES: Robust standard errors are in parentheses.
21
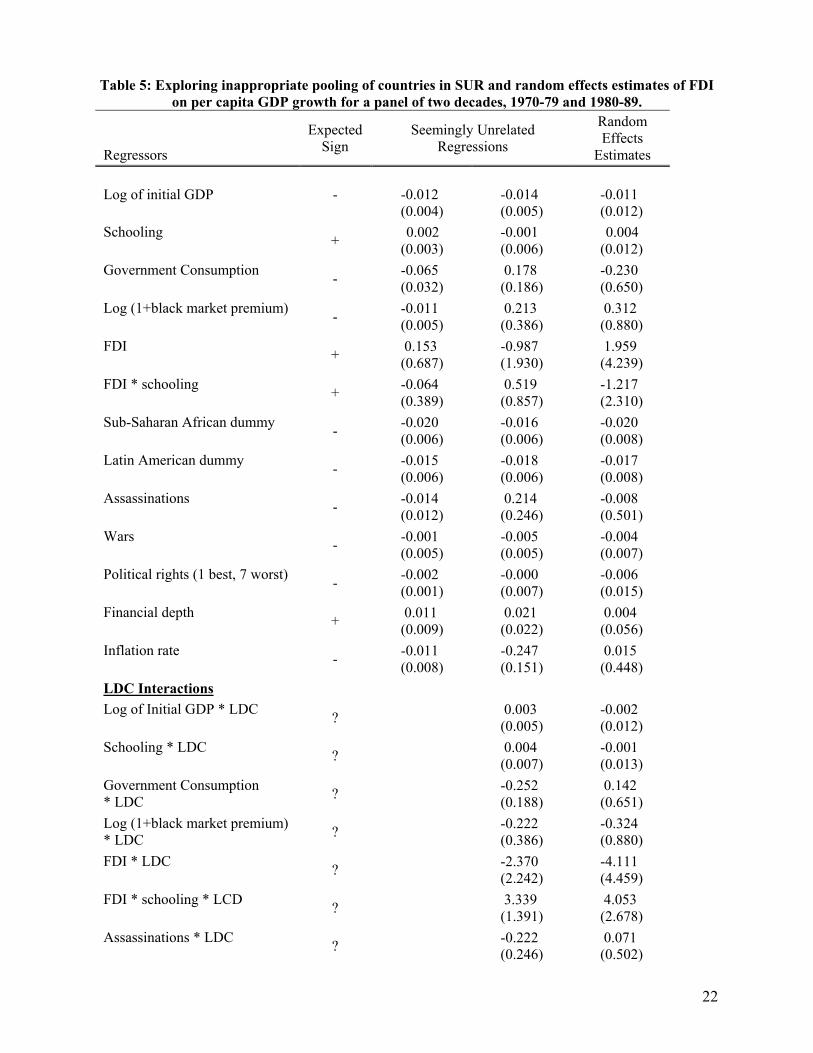
Table 5: Exploring inappropriate pooling of countries in SUR and random effects estimates of FDI on per capita GDP growth for a panel of two decades, 1970-79 and 1980-89.
Regressors
Expected Sign
Seemingly Unrelated Regressions
Random Effects
Estimates Log of initial GDP -
-0.012 (0.004)
-0.014 (0.005)
-0.011 (0.012)
Schooling + 0.002 (0.003)
-0.001 (0.006)
0.004 (0.012)
Government Consumption - -0.065 (0.032)
0.178 (0.186)
-0.230 (0.650)
Log (1+black market premium) - -0.011 (0.005)
0.213 (0.386)
0.312 (0.880)
FDI + 0.153 (0.687)
-0.987 (1.930)
1.959 (4.239)
FDI * schooling + -0.064 (0.389)
0.519 (0.857)
-1.217 (2.310)
Sub-Saharan African dummy - -0.020 (0.006)
-0.016 (0.006)
-0.020 (0.008)
Latin American dummy - -0.015 (0.006)
-0.018 (0.006)
-0.017 (0.008)
Assassinations - -0.014 (0.012)
0.214 (0.246)
-0.008 (0.501)
Wars - -0.001 (0.005)
-0.005 (0.005)
-0.004 (0.007)
Political rights (1 best, 7 worst) - -0.002 (0.001)
-0.000 (0.007)
-0.006 (0.015)
Financial depth + 0.011 (0.009)
0.021 (0.022)
0.004 (0.056)
Inflation rate - -0.011 (0.008)
-0.247 (0.151)
0.015 (0.448)
LDC Interactions Log of Initial GDP * LDC ? 0.003
(0.005) -0.002 (0.012)
Schooling * LDC ? 0.004 (0.007)
-0.001 (0.013)
Government Consumption * LDC ? -0.252
(0.188) 0.142 (0.651)
Log (1+black market premium) * LDC ? -0.222
(0.386) -0.324 (0.880)
FDI * LDC ? -2.370 (2.242)
-4.111 (4.459)
FDI * schooling * LCD ? 3.339 (1.391)
4.053 (2.678)
Assassinations * LDC ? -0.222 (0.246)
0.071 (0.502)
22
Political rights (1 best, 7 worst) * LDC ? -0.003
(0.007) 0.003 (0.015)
Financial depth * LDC ? -0.017 (0.024)
0.002 (0.058)
Inflation rate * LDC ? 0.237 (0.152)
-0.032 (0.448)
Observations 160 160 146 R2 – 1970-79 0.28 0.39 R2 – 1980-89 0.35 0.40 Goodness of Fit – χ2 (p-value) 70.59
(0.000) 101.92 (0.000)
62.98 (0.000)
NOTES: Standard errors in parentheses.
23
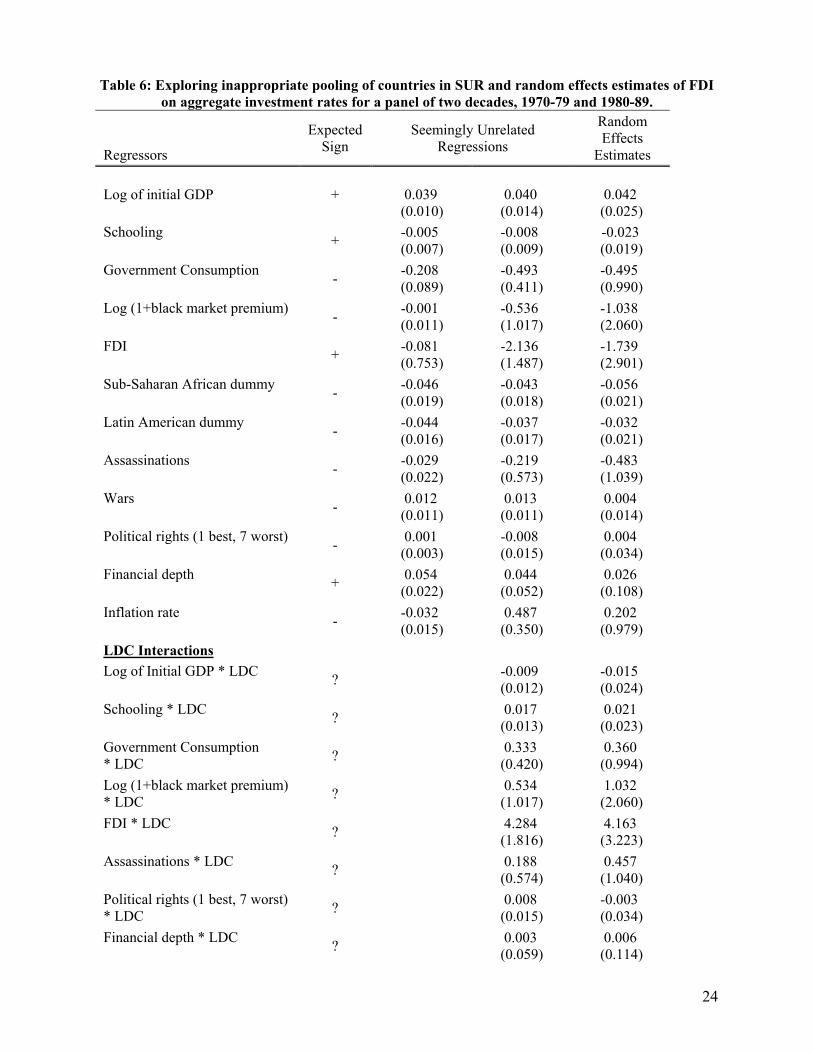
Table 6: Exploring inappropriate pooling of countries in SUR and random effects estimates of FDI on aggregate investment rates for a panel of two decades, 1970-79 and 1980-89.
Regressors
Expected Sign
Seemingly Unrelated Regressions
Random Effects
Estimates Log of initial GDP +
0.039 (0.010)
0.040 (0.014)
0.042 (0.025)
Schooling + -0.005 (0.007)
-0.008 (0.009)
-0.023 (0.019)
Government Consumption - -0.208 (0.089)
-0.493 (0.411)
-0.495 (0.990)
Log (1+black market premium) - -0.001 (0.011)
-0.536 (1.017)
-1.038 (2.060)
FDI + -0.081 (0.753)
-2.136 (1.487)
-1.739 (2.901)
Sub-Saharan African dummy - -0.046 (0.019)
-0.043 (0.018)
-0.056 (0.021)
Latin American dummy - -0.044 (0.016)
-0.037 (0.017)
-0.032 (0.021)
Assassinations - -0.029 (0.022)
-0.219 (0.573)
-0.483 (1.039)
Wars - 0.012 (0.011)
0.013 (0.011)
0.004 (0.014)
Political rights (1 best, 7 worst) - 0.001 (0.003)
-0.008 (0.015)
0.004 (0.034)
Financial depth + 0.054 (0.022)
0.044 (0.052)
0.026 (0.108)
Inflation rate - -0.032 (0.015)
0.487 (0.350)
0.202 (0.979)
LDC Interactions Log of Initial GDP * LDC ? -0.009
(0.012) -0.015 (0.024)
Schooling * LDC ? 0.017 (0.013)
0.021 (0.023)
Government Consumption * LDC ? 0.333
(0.420) 0.360 (0.994)
Log (1+black market premium) * LDC ? 0.534
(1.017) 1.032 (2.060)
FDI * LDC ? 4.284 (1.816)
4.163 (3.223)
Assassinations * LDC ? 0.188 (0.574)
0.457 (1.040)
Political rights (1 best, 7 worst) * LDC ? 0.008
(0.015) -0.003 (0.034)
Financial depth * LDC ? 0.003 (0.059)
0.006 (0.114)
24
Inflation rate * LDC ? -0.520 (0.350)
-0.250 (0.979)
Observations 160 160 146 R2 – 1970-79 0.51 0.54 R2 – 1980-89 0.70 0.75 Goodness of Fit – χ2 (p-value) 193.25
(0.000) 242.16 (0.000)
140.25 (0.000)
NOTES: Standard errors in parentheses.
25
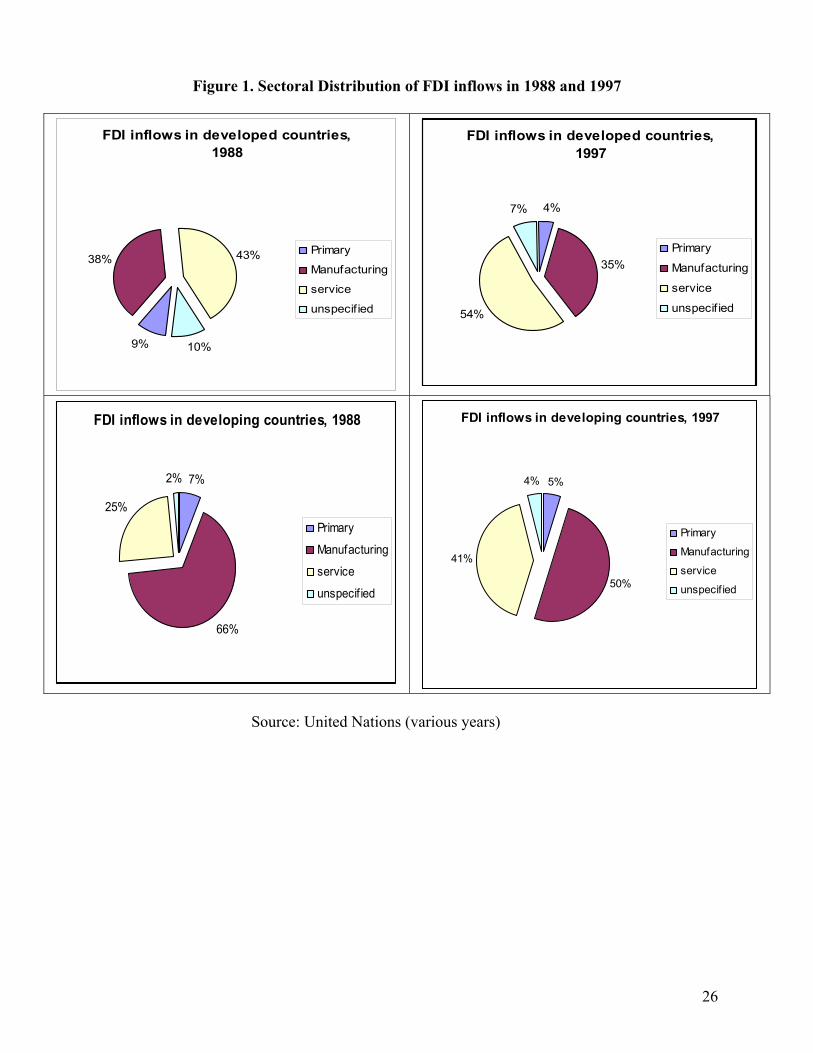
Figure 1. Sectoral Distribution of FDI inflows in 1988 and 1997
FDI inflows in developed countries, 1988
9%
43%
10%
38%Primary
Manufacturing
service
unspecif ied
FDI inflows in developed countries, 1997
4%
35%
54%
7%
Primary
Manufacturing
service
unspecif ied
FDI inflows in developing countries, 1988
7%
66%
25%
2%
Primary
Manufacturing
service
unspecif ied
FDI inflows in developing countries, 1997
5%
50%
41%
4%
Primary
Manufacturing
service
unspecif ied
Source: United Nations (various years)
26
References Balasubramanyam, V.N., Salisu, M. and D. Sapsford. 1996. “Foreign Direct Investment and Growth in EP and IS Countries.” The Economic Journal 106(1): 92-105. Bali Online Corporation. 1999. http://www.indo.com. Barro, Robert and J.W. Lee. 1996. "International Measures of Schooling Years and Schooling Quality, American Economic Review, Papers and Proceedings, 86(2): 218-23. Blonigen, Bruce A. and Ronald B. Davies. Forthcoming. “The Effects of Bilateral Tax Treaties on U.S. FDI Activity,” International Tax and Public Finance. Borensztein, E., De Gregorio, J and Lee, J.-W. 1998. “How does Foreign Direct Investment affect Economic Growth?” Journal of International Economics Vol. 45(1): 115-35. Brainard, S. Lael. 1997. “An Empirical Assessment of the Proximity-Concentration Trade-Off Between Multinational Sales and Trade,” American Economic Review, 87(4): 520-44. Carkovic, Maria, and Ross Levine. 2003. “Does Foreign Direct Investment Accelerate Economic Growth?” Mimeo. Department of Finance, University of Minnesota. Carr, David, James R. Markusen, and Keith E. Maskus. 2001. “Estimating the Knowledge-Capital Model of the Multinational Enterprise,” American Economic Review, 91(3): 693-708. Choe, Jong Il. 2003. “Do Foreign Direct Investment and Gross Domestic Investment Promote Economic Growth?” Review of Development Economics, 7(1): 44-57. Hanson, Gordon H., Raymond J. Mataloni, and Matthew J. Slaughter. 2003. “Vertical Production Networks in Multinational Firms,” NBER Working Paper No. 9723. Harrison, Ann and Margaret S. McMillan. 2003. “Does Direct Foreign Investment Affect Domestic Credit Constraints,” Journal of International Economics, 61(1): 73-100. Helpman, Elhanan. 1984. “A Simple Theory of International Trade with Multinational Corporations,” Journal of Political Economy, 92(3): 451-471. Islam, Nazrul. 1995. “Growth Empirics: A Panel Data Approach,” Quarterly Journal of Economics, 110(4): 1127-70. Islam, Nazrul. 1998. “Growth Empirics: A Panel Data Approach - A Reply,” Quarterly Journal of Economics, 113(1): 325-9. Lee, Kevin, M. Hashem Pesaran, and Ron Smith. 1998. “Growth Empirics: A Panel Data Approach - A Comment,” Quarterly Journal of Economics, 113(1): 319-23. Levine, Ross, and David Renelt. 1992. “A Sensitivity Analysis of Cross-Country Growth Regressions,” American Economic Review, 82(4): 942-63. Markusen, James R. 1984. “Multinationals, Multi-plant Economies, and the Gains from Trade,” Journal of International Economics, 16(3/4): 205-26.
27
Markusen, James R., Anthony J. Venables, Denise Eby-Konan, and Keven Honglin Zhang. 1996. “A Unified Treatment of Horizontal Direct Investment, Vertical Direct Investment, and the Pattern of Trade in Goods and Services,” NBER Working Paper No. 5696. Markusen, James R. 1997. “Trade Versus Investment Liberalization,” NBER Working Paper No. 6231. Ramsey, J.B. 1969. “Tests for Specification Errors in Classical Linear Least Squares Regression Analysis,” Journal of the Royal Statisical Society, Series B 31: 350-71. Sala-I-Martin, Xavier. 1997. “I Just Ran Two Million Regressions,” American Economic Review, 87(2):178-83. Shapiro, Samuel S. and Martin B. Wilk. 1965. “An Analysis of Variance Test for Normality (Complete Samples).” Biometrika, 52: 591-611. Summers, Robert and Alan Heston. 1991. “The Penn-World Table (Mark 5): an expanded set of international comparisons, 1950 - 1988,” Quarterly Journal of Economics, 106: 327-68. United Nations. (Various years). World Investment Report. New York: United Nations. Wang, Miao. 2003. Essays on Foreign Direct Investment. Ph.D. dissertation, University of Oregon. Yeaple, Stephen R. 2003. “The complex integration strategies of multinationals and cross country dependencies in the structure of foreign direct investment,” Journal of International Economics, 60: 293-314.
28
29
Data Appendix Data Sources and Construction for Section III Analysis These data are documented in detailed fashion in Blonigen and Davies (forthcoming). Data on FDI stocks for non-financial sectors come from official statistics of the U.S. Bureau of Economic Administration. These are publicly available at http://www.bea.doc.gov/bea/di1.htm. Our GDP (both total and per capita) and trade openness measures are those from version 6.1 of the Penn-World Tables, which are available online at http://pwt.econ.upenn.edu. For a detail discussion of these measures, see Summers and Heston (1991). Total GDP is measured in millions of real base 1996 dollars. Our education variable is the mean years of education for adults over age 25. This data comes from the Barro-Lee dataset which is available at http://www.worldbank.org/research/growth/ddbarle2.htm. Details on these data are given by Barro and Lee (1996). Distance was measure as the distance between capital cities as reported by the Bali Online Corporation. This distance calculator can be found at http://www.indo.com. For our measure of investment costs, we use the composite score compiled by Business Environment Risk Intelligence, S.A. (BERI). This composite includes measures of political risk, financial risk, and other economic indicators and ranges between zero and 100, with higher numbers meaning more openness. To compare these estimates to previously used measures of investment barriers, we define Investment Barriers as 100 minus the BERI’s composite score. The data for these analyses are available from authors upon request. Data Sources and Construction for Section IV and V Analysis All variables in these sections of the paper come from the identical sources and are constructed identically to that described in Borensztein et al. (1998), with the exception of FDI data for developed countries. We obtained data on decade average flows of FDI into our developed countries from the 2001 OECD publication International Direct Investment Statistics Yearbook, 1980-2000. (Columns 1 and 2 of Table 2 on p. 13) We combined this with International Financial Statistics data on nominal GDP to get decade averages of FDI as a share of GDP. The data for these analyses are available from authors upon request.