Embed Size (px)
Citation preview

1
NBA PEV Orientation Workshop
Self Assessment Report (TIER-II UG): Overview of Changes
16.11.2015
IHC, New Delhi

SAR Level Changes - Differentiators: 2015 (2013)
2
1. Concept of First Time and Subsequent accreditation
2. Explicit Program level criteria (07) and Institute level criteria (03)
3. No marks on curriculum; content beyond to cover gaps
4. PEO achievement NOT there / removed
5. PEO – PO mapping matrix NOT there / removed
6. Separate subsection on Course Outcomes attainment
7. Emphasis on effective Teaching – Learning and POs/PSOs attainment
8. Institute & Program level – expenditure per student included
9. Research/Consultancy: Expectations from the Program not from
individual faculty

SAR Level Changes - Differentiators: 2015 (2013)
3
10. The assessment based on class rooms, faculty rooms, medical, power
backup not there / removed
11.Academic Audit, Faculty Performance Appraisal & Development System
introduced
12. Continuous Improvement assessment is qualitative
13. First year admissions – Nos and ranks, both are assessment points
14. Student feedback on T-L and Industry connect assessed at the program
level
15. Student & Faculty put together (150+200); 35% weightage
16. Placement and Higher Studies given equal weightage
17. Examples given; NBA expectations also explicitly mentioned

SAR Contents Serial Code &
Link to the Item Item
PART A Institutional Information
PART B Criteria Summary
Program Level Criteria
1 Vision, Mission and Program Educational Objectives
2 Program Curriculum and Teaching – Learning Processes
3 Course Outcomes and Program Outcomes
4 Students’ Performance
5 Faculty Information and Contributions
6 Facilities and Technical Support
7 Continuous Improvement
Institute Level Criteria
8 First Year Academics
9 Student Support Systems
10 Governance, Institutional Support and Financial Resources
PART C Declaration by the Institution
Annexure- I Program Outcomes (POs) & Program Specific Outcomes (PSOs) 4

PART B - CRITERIA SUMMARY
Criteria No. Criteria Weightage
/Marks
Program level Criteria
1. Vision, Mission and Program Educational Objectives 60 (5+5+10+25+15)
2. Program Curriculum and Teaching–Learning Processes 120 (20+100)
3. Course Outcomes and Program Outcomes 120 (20+50+50)
4. Students’ Performance 150 (20+40+15+15+40+20)
5. Faculty Information and Contributions
200
(20+25+25+25+20+15+30+
30+10)
6. Facilities and Technical Support 80 (30+25+10+5+10)
7. Continuous Improvement 50 (20+10+10+10)
Institute Level Criteria
8. First Year Academics 50 (5+5+10+10+20)
9. Student Support Systems 50 (5+10+5+5+10+5+10)
10. Governance, Institutional Support and Financial
Resources
120 (40+30+30+20)
Total 1000 5

.
CRITERION 1
Vision, Mission
and
Program Educational Objectives
60
1.1. State the Vision and Mission of the Department and Institute (5)
•Vision statement typically indicates aspirations and Mission statement states
the broad approach to achieve aspirations
•Should be written in a simple language, easy to communicate and should define
objectives which are out of reach in the present context
•Should be understood and shared by the people within the system
•Department Vision and Mission statements shall be consistent with the Institute
Vision and Mission statements
Availability (1) + Appropriateness (2) + Consistency (2)
6

1.2. State the Program Educational Objectives (PEOs) (5)
• State the Program Educational Objectives (3 to 5)
Availability & Correctness
Indicative: Typically under the following five broad categories:
1. Preparation – Employment/Higher studies
2. Core competence – Discipline knowledge
3. Breadth – ‘T’ Shaped Engineer
4. Professionalism – 3 Ps – Professional value-knowledge-
development
5. Life long learning – Environment
7

.
1.3. Indicate where the Vision, Mission and PEOs are published and disseminated among stakeholders (10)
• Observe where (websites, curricula, posters etc.) the Vision, Mission and PEOs are published • Observe the process which ensures awareness among internal and
external stakeholders • Verify Effective process implementation including involvement of
stakeholders
• Adequacy (2) + Process (2) + Extent of Awareness (6)
• Availability on Institute website under relevant program link • Availability at department notice boards • HoD Chamber • Department website, if available • Availability in department level documents • Documentary evidence
8

.
1.4. State the process for defining the Vision and Mission of the Department, and PEOs of the program (25)
• Observe the process for defining the Vision and Mission of the department and PEOs of the program
Vision and Mission process (10) + PEOs process (15) Process to ensure:
• Effective participation of Stakeholders • Effective Process implementation
Documentary evidence
9

Note: M1, M2, . . Mn are distinct elements of Mission statement. Enter correlation
levels 1, 2 or 3 as defined below:
1: Slight (Low) 2: Moderate (Medium) 3: Substantial (High)
It there is no correlation, put “-”
Matrix Preparation (5) + Consistency/Justification (10)
1.5. Establish consistency of PEOs with Mission of the Department (15) • Generate a “Mission of the Department – PEOs matrix” with justification and rationale of the mapping
PEO Statements M1 M2 …. Mn
PEO1:
PEO2:
PEO3:
PEO4:
PEO5:
10

.
CRITERION 2 Program Curriculum and Teaching –
Learning Processes
120
2.1. Program Curriculum (20)
2.1.1. State the process used to identify extent of compliance of the University curriculum for attaining the Program Outcomes and Program Specific Outcomes as mentioned in Annexure I. Also mention the identified curricular gaps, if any (10)
• State the process details • Mention identified curricular gaps • Extent of compliance
Effective Process implementation (6) + Curricular Gaps (4) Note: If no gaps then marks of 2.1.2 will be merged with 2.1.1.
11

.
2.1.2. State the delivery details of the content beyond the syllabus for the attainment of POs & PSOs (10)
• Details of the additional course/learning material/content/laboratory experiments/projects etc. to cover the gaps
Institute to provide inputs to the Affiliating University regarding curricular gaps
and possible addition of new content/add-on courses in the curriculum to better
attain program outcome(s)
Intimation to the University (2) + Delivery details (5) + Mapping (3)
CAY, CAYm1, CAYm2
S.No. Gap Action
taken
Date-Month-
Year
Resource Person
with designation
No. of students
present
Relevance to POs,
PSOs
• Documentary evidence • Availability & Appropriateness of Mapping
12

2.2. Teaching-Learning Processes (100)
2.2.1. Describe Processes followed to improve quality of Teaching & Learning (25) Processes may include adherence to academic calendar and
implementation of pedagogical initiatives such as – • Real life examples
• Collaborative learning
• Quality of laboratory experience with regard to conducting experiments
• Recording observations
• Analysis of data etc
• Encouraging bright students
• Assisting weak students etc
• ICT supported learning
• Interactive classrooms
Academic Calendar (3) + Pedagogical initiatives (3) + Weak and Bright students (4) +
Classroom teaching (3) + Experiment (3) + Continuous Assessment in Lab (3) +
Student feedback of T-L and action taken thereof (6)
Documentary evidence
13

2.2.2. Quality of internal semester Question papers, Assignments and Evaluation (20)
Mention the initiatives, Implementation details and analysis of learning levels related to –
- Quality of Semester Question papers
- Assignments
- Evaluation - Relevance to COs
Process to ensure quality (5)
Process to ensure quality of question paper from outcomes/learning perspective (5)
Evidence of COs coverage (5)
Quality of assignments and relevance to COs (5)
14

2.2.3. Quality of student projects (25)
• Consideration to factors including, but not limited to – - Environment
- Safety
- Ethics
- Cost
- Type (application, product, research, review etc.)
- Standards
- Processes related to project identification, allotment, continuous
monitoring, evaluation
- Demonstration of working prototype sand enhancing the relevance of
projects.
- Mention Implementation details including details of Pos and PSOs addressed
with justification
Identification of projects and allocation methodology (3)
Types and relevance of the projects and their contribution towards attainment of
POs(5)
Process for monitoring and evaluation (5)
Process to assess individual and team performance (5)
Quality of completed projects/working prototype(5)
Evidences of papers published /Awards received by projects etc. (2)
15

2.2.4. Initiatives related to industry interaction (15)
• Industry supported laboratories (5)
• Industry involvement in the program design and partial delivery of any regular courses for students (5)
• Impact analysis of industry institute interaction and actions taken thereof (5)
• Type of Industries, type of labs, objectives, utilization and effectiveness • Impact analysis • Documentary evidence
2.2.5. Initiatives related to industry internship/summer training (15)
• Industrial training/tours for students (3)
• Industrial /internship /summer training of more than two weeks and post
training Assessment (4)
• Impact analysis of industrial training (4)
• Student feedback on initiatives (4)
16

• Type of Industries, planned or non-planned activity
• Objectives clearly defined
• No. of students participated
• Relevant area of training
• Visit report documented
• Documentary evidence
• Effectiveness including relevant area of the training
• Impact analysis and feedback format, analysis and actions taken (Will also be verified during interaction with students)
17

3.1. Establish the correlation between the Courses and the Program Outcomes (POs) and Program Specific Outcomes (PSOs) (20) 3.1.1. Course Outcomes (COs)
SAR should include course outcomes of One course/Semester (3rd to 8th) of study, however, should be prepared for all courses and made available as evidence, if asked) (05) Number of Outcomes for a Course is expected to be around 6.
Course Name: Ciii Year of Study: YYYY – YY; for ex. C202 Year of study 2013-14
CRITERION 3 Course Outcomes and Program Outcomes
120
18

C202.1 <Statement>
C202.2 <Statement>
C202.3 <Statement>
C202.N <Statement>
Evidence of COs being defined for every course (5)
Appropriateness of the statements
19

3.1.2. CO-PO matrices of courses selected in 3.1.1 (six matrices to be mentioned; one per semester from 3rd to 8th semester) (05)
Note:
Enter correlation levels 1, 2 or 3 as defined below:
1: Slight (Low) 2: Moderate (Medium) 3: Substantial (High)
It there is no correlation, put “-”
Similar table is to be prepared for PSOs
Justification of the mapping
CO PO1 PO2 PO3 PO4 PO5 PO6 PO7 PO8 PO9 PO10 PO11 PO12
C202.1
C202.2
C202.3
C202.N
C202
20

3.1.3. Program level Course-PO matrix of all courses INCLUDING first year
courses (10)
Note:
Enter correlation levels 1, 2 or 3 as defined below:
1: Slight (Low) 2: Moderate (Medium) 3: Substantial (High)
It there is no correlation, put “-”
It may be noted that contents of Table 3.1.2 must be consistent with information available in
Table 3.1.3 for all the courses.
Similar table is to be prepared for PSOs
Justification of the mapping
Course PO1 PO2 PO3 PO4 PO5 PO6 PO7 PO8 PO9 PO10 PO11 PO12
C101
C202
C303
….
….
C4…
21

3.2. Attainment of Course Outcomes (50)
3.2.1. Describe the assessment processes used to gather the data upon which
the evaluation of Course Outcome is based (10)
• Examples of data collection processes may include, but are not limited to –
- Specific exam/tutorial questions
- Assignments
- Laboratory tests
- Project evaluation - Student portfolios
• A portfolio is a collection of artifacts that demonstrate skills, personal
characteristics, and accomplishments created by the student during study
period, internally developed assessment exams, project presentations, oral
exams etc.
List of Assessment process (2)
Quality and relevance of processes and tools (8)
22

3.2.2. Record the attainment of Course Outcomes of all courses with respect
to set attainment levels (40)
• Program shall have set Course Outcome attainment levels for all
courses
• The attainment levels shall be set considering average performance levels in the University Examination or any higher value set as target for the assessment years
• Attainment level
Student performance in internal assessments with respect the Course Outcomes
Performance in the University Examination
Methodology to define attainment levels and its compliance, data collection, verification, analysis and decision making
23

Measuring Course Outcomes attained through University Examinations
Note: For cases where the University does not provide useful indicators like
average or median marks etc., the program may choose an attainment level on its
own with justification
Example related to attainment levels Vs. targets:
(The examples indicated are for reference only. Program may appropriately define levels)
Attainment Level 1: 60% students scoring more than University average
percentage marks or set attainment level in the final examination
Attainment Level 2: 70% students scoring more than University average
percentage marks or set attainment level in the final examination
Attainment Level 3: 80% students scoring more than University average
percentage marks or set attainment level in the final examination
• Attainment is measured in terms of actual percentage of students getting set percentage of
marks
• If targets are achieved then all the course outcomes are attained for that year Program is
expected to set higher targets for the following years as a part of continuous improvement
• If targets are not achieved the program should put in place an action plan to attain the
target in subsequent years 24

Measuring CO attainment through Internal Assessments: (The examples indicated are for reference only. Program may appropriately
define levels)
Target may be stated in terms of percentage of students getting more than class
average marks or set by the program in each of the associated COs in the assessment instruments (midterm tests, assignments, mini projects, reports and
presentations etc. as mapped with the COs
Example
Mid-term test 1 addresses C202.1 and C202.2. Out of the maximum 20 marks for this test 12 marks are associated with C202.1 and 8 marks are associated with
C202.2
Examples related to attainment levels Vs. targets:
Attainment Level 1: 60% students scoring more than 60% marks out of the relevant maximum marks
Attainment Level 2: 70% students scoring more than 60% marks out of the
relevant maximum marks
Attainment Level 3: 80% students scoring more than 60% marks out of the
relevant maximum marks 25

• Attainment is measured in terms of actual percentage of students getting set
percentage of marks
• If targets are achieved then the C202.1 and C202.2 are attained for that year.
Program is expected to set higher targets for the following years as a part of
continuous improvement
• If targets are not achieved the program should put in place an action plan to attain the target in subsequent years
• Similar targets and achievement are to be stated for the other midterm
tests/internal assessment instruments
Course Outcome Attainment:
For example:
Attainment through University Examination: Substantial i.e. 3
Attainment through Internal Assessment: Moderate i.e. 2
Assuming 80% weightage to University examination and 20% weightage to Internal assessment, the attainment calculations will be (80% of University level)
+ (20% of Internal level ) i.e. 80% of 3 + 20% of 2 = 2.4 + 0.4 = 2.8
Note: Weightage of 80% to University exams is only an example. Programs may
decide weightages appropriately for University exams and internal assessment with due justification
50% - 50% Weightage = 1.5+1=2.5
26

27
Program may decide five attainment levels instead of three
For ex. - Attainment levels:
• Level 5 – Very High - Score from >2.5 to 3
• Level 4 – High - Score from >2 to 2.5
• Level 3 – Medium - Score from >1.5 to 2
• Level 2 – Low - Score from >1 to 1.5
• Level 1 – Very Low- Score from 0.5 to <1

3.3. Attainment of Program Outcomes
and Program Specific Outcomes
(50)
28

Program Specific Outcomes - Programming
The student will –
• Participate in planning, implementing and evaluating language-specific team
programming solutions to specific business problems
• Complete individual practical experiences in a variety of programming languages
and situations
•Employ deductive logic skills to analyze malfunctioning computer programs and
use proper debugging and testing skills, modifying them so that they function correctly
•Create computer program documentation through the use of: flow charts, IPO
charts, pseudo code, internal program comments, and user instructions
• Demonstrate knowledge of, and the ability to write programs for, the World Wide
Web
29 www….

Program Specific Outcomes - Network Computer Management
The student will –
• Examine the elements supporting data communications and systems
• Show how the various IT components interact to support the Network
Communications Management field
• Demonstrate an ability to use the conceptual and applied information to solve
business related technological problems and issues
• Recognize and understand the dynamic nature of information technology
Program Specific Outcomes – System Administrator
The student will –
• Design and implement fundamental network security solutions; Configure
WLAN products including access points, bridges, client devices and
accessories
• Demonstrate proficiency in hardware and software installation and
configuration
• Design and implement LAN and WAN infrastructures
• Manage server resources, monitor server performance, and safeguard data
30 www….

3.3.1. Describe assessment tools and processes used for measuring the
attainment of each of the Program Outcomes and Program Specific
Outcomes (10)
• Describe the assessment tools and processes used to gather the data upon which
the evaluation of each of the Program Outcomes and Program Specific Outcomes
is based indicating the frequency with which these processes are carried out
• Describe the assessment processes that demonstrate the degree to which the
Program Outcomes and Program Specific Outcomes are attained and document
the attainment levels
List of Assessment tools and processes (5)
Quality/Relevance of assessment tools and processes (5)
•Direct and Indirect Assessment Tools & Processes
•Effective implementation
•Assessment methodology
•Indirect assessment formats/collection/analysis
•Decision making
31
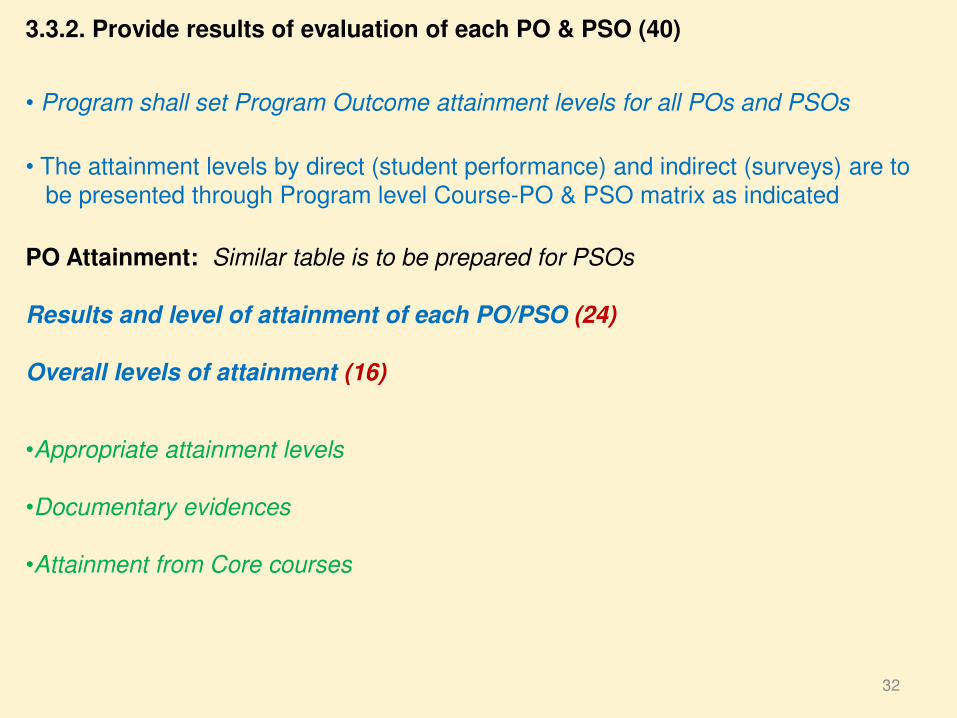
3.3.2. Provide results of evaluation of each PO & PSO (40)
• Program shall set Program Outcome attainment levels for all POs and PSOs
• The attainment levels by direct (student performance) and indirect (surveys) are to be presented through Program level Course-PO & PSO matrix as indicated
PO Attainment: Similar table is to be prepared for PSOs
Results and level of attainment of each PO/PSO (24)
Overall levels of attainment (16)
•Appropriate attainment levels
•Documentary evidences
•Attainment from Core courses
32

• Direct attainment level of a PO & PSO is determined by taking average across all
courses addressing that PO and/or PSO. Fractional numbers may be used for
example 1.55
• Indirect attainment level of PO & PSO is determined based on the student exit
surveys, employer surveys, co-curricular activities, extracurricular activities etc.
Example:
1. It is assumed that a particular PO has been mapped to four courses C2O1,
C3O2, C3O3 and C4O1
2. PO attainment level will be based on attainment levels of direct assessment and
indirect assessment
3. For affiliated, non-autonomous colleges, it is assumed that while deciding on
overall attainment level 80% weightage may be given to direct assessment and 20% weightage to indirect assessment through surveys from students(largely),
employers (to some extent). Program may have different weightages with
appropriate justification
33

4. Assuming following actual attainment levels:
Direct Assessment
•C201 –High (3)
•C302 – Medium (2)
•C303 – Low (1)
•C401 – High (3)
Attainment level will be summation of levels divided by no. of courses 3+2+1+3/4= 9/4=2.25
Indirect Assessment
• Surveys, Analysis, customized to an average value as per levels 1, 2 & 3.
• Assumed level – 2
5. PO Attainment level will be 80% of Direct Assessment + 20% of Indirect Assessment i.e. 1.8 + 0.4 = 2.2, Moderate/Medium level of attainment
Note: Similarly for PSOs
34
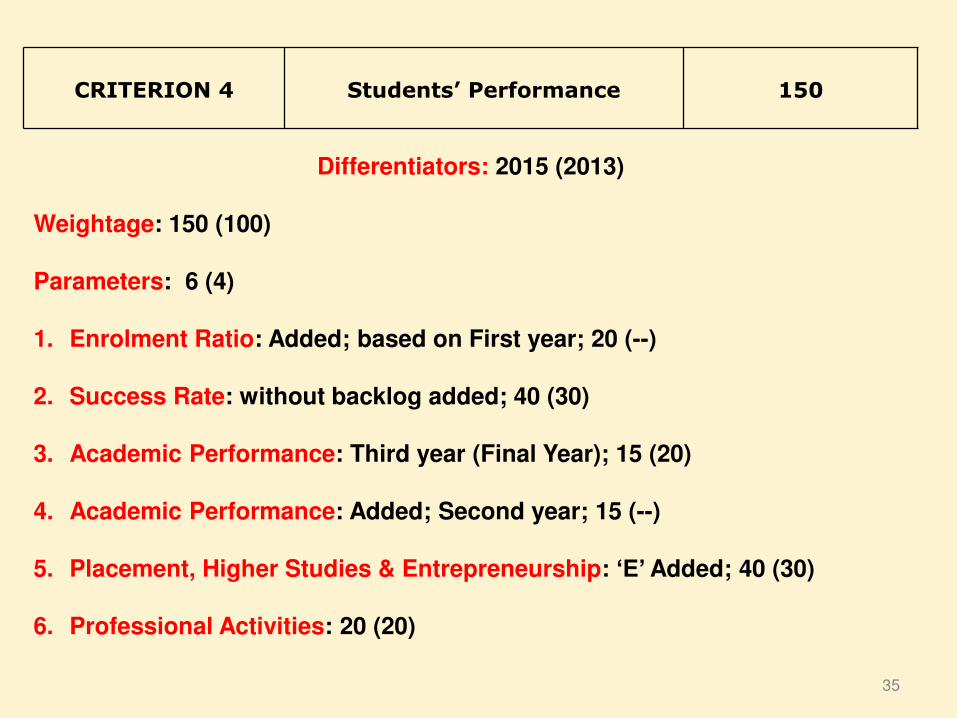
CRITERION 4 Students’ Performance 150
35
Differentiators: 2015 (2013)
Weightage: 150 (100)
Parameters: 6 (4)
1. Enrolment Ratio: Added; based on First year; 20 (--)
2. Success Rate: without backlog added; 40 (30)
3. Academic Performance: Third year (Final Year); 15 (20)
4. Academic Performance: Added; Second year; 15 (--)
5. Placement, Higher Studies & Entrepreneurship: ‘E’ Added; 40 (30)
6. Professional Activities: 20 (20)

CRITERION 4 Students’ Performance 150
Item
(Information - cumulatively for all the shifts with explicit headings) CAY
CAY
m1
CAY
m2
Sanctioned intake of the program (N)
Total number of students admitted in first year minus number of
students migrated to other programs/institutions plus no. of students
migrated to this program (N1)
Number of students admitted in 2nd year in the same batch via lateral
entry (N2)
Separate division students, if applicable (N3)
Total number of students admitted in the Program (N1 + N2 + N3)
Note: PIO/FN quota students, if admitted, details TO BE OBSERVED 36

Year of entry N1 + N2 + N3
(As defined above)
Number of students who have
successfully graduated without
backlogs in any semester/year of study
(Without Backlog means no
compartment or failures in any
semester/year of study)
I Year II Year III Year IV Year
CAY
CAYm1
CAYm2
CAYm3 (LYG)
CAYm4 (LYGm1)
CAYm5 (LYGm2)
Similarly another table With Backlog 37

4.1. Enrolment Ratio (20)
Enrolment Ratio= N1/N
38
Item (Students enrolled at the First Year Level on average basis
during the period of assessment)
Marks
>= 90% students 20
>= 80% students 18
>= 70% students 16
>= 60% students 14
Otherwise 0

4.2. Success Rate in the stipulated period of the program (40)
4.2.1. Success rate without backlogs in any semester/year of study (25)
SI = (Number of students who have graduated from the program without backlog)/ (Number of
students admitted in the first year of that batch and admitted in 2nd year via lateral entry and
separate division, if applicable)
Average SI = Mean of Success Index (SI) for past three batches
Success rate without backlogs in any year of study = 25 × Average SI
4.2.2. Success rate in stipulated period (15)
SI= (Number of students who graduated from the program in the stipulated period of course
duration)/ (Number of students admitted in the first year of that batch and admitted in 2nd year
via lateral entry and separate division, if applicable)
Average SI = mean of Success Index (SI) for past three batches
Success rate = 15 × Average SI
Note: If 100% students clear without any backlog then also total marks scored
will be 40 as both 4.2.1 & 4.2.2 will be applicable simultaneously
39 Data is to be verified for each of the Assessment years

4.3. Academic Performance in Third Year (15)
Academic Performance = 1.5 * Average API (Academic Performance Index)
API = ((Mean of 3rd Year Grade Point Average of all successful Students on a 10
point scale) or (Mean of the percentage of marks of all successful students in Third
Year/10)) x (number of successful students/number of students appeared in the
examination)
Successful students are those who are permitted to proceed to the Final year
4.4. Academic Performance in Second Year (15)
Academic Performance Level = 1.5 * Average API (Academic Performance Index)
API = ((Mean of 2nd Year Grade Point Average of all successful Students on a 10
point scale) or (Mean of the percentage of marks of all successful students in
Second Year/10)) x (number of successful students/number of students appeared in the examination)
Successful students are those who are permitted to proceed to the Third year
40 Data is to be verified for atleast one of the Assessment years

4.5. Placement, Higher Studies and Entrepreneurship (40)
Assessment Points = 40 × average placement
Item CAY CAYm1 CAYm2
Total No. of Final Year Students (N)
No. of students placed in companies or Government
Sector (x)
No. of students admitted to higher studies with valid
qualifying scores (GATE or equivalent State or
National Level Tests, GRE, GMAT etc.) (y)
No. of students turned entrepreneur in
engineering/technology (z)
x + y + z =
Placement Index : (x + y + z )/N P1 P2 P3
Average placement= (P1 + P2 + P3)/3
41 Data is to be verified for atleast one of the Assessment years

4.6. Professional Activities (20)
4.6.1. Professional societies/chapters and organizing engineering events (5)
• Relevant documentary evidences
Professional Society/Chapters (3)
No. and Quality of Engineering events organized (2)
4.6.2. Publication of technical magazines, newsletters, etc. (5)
• The Department publications along with the names of the editors, publishers, etc
Quality and relevance of the contents and print material (3) Participation of students from the program (2)
4.6.3 Participation in inter-institute events by students of the program of
study (10)
• Awards in the events/conferences organized by other institutes
Within the State (2)
Outside the State (3)
Prized/Awards received (5)
42

CRITERION 5 Faculty Information and
Contributions 200
43
Differentiators: 2015 (2013)
Weightage: 200 (175)
Parameters: 9 (10)
1. SFR: Intake- First year + Lateral entry + Separate Division 20 (20)
2. Cadre Proportion: No cadre zero mark; 25 (20)
3. Qualification: no marks for BE; 25 (30)
4. Retention: 25 (15)
5. Innovations in T-L: Added; 20 (--, faculty competencies 15)
6. FDPs/STTPs: 15 (15)
7. R&D: 30 (60)
8. FPADS: Added; 30 (--)
9. Visiting/Adjunct: Added; 10 (--)

CRITERION 5 Faculty Information and
Contributions 200
Name of the
Faculty
Member
Qualification
Desig
nation
(all
the
design
ations
since
joinin
g the
institu
tion)
Date
of
Joinin
g the
instit
ution
Distribution of Teaching Load (%)
Academic Research
Sponsored Resea
rch (Fund
ed Research)
Consultancy and
Product
Development
Specialization
1st Year
UG PG
Faculty
Receiving
Ph.D. during
the Assessment Years
Ph.D. Guidance
Research
Paper Publications
Degree
(starti
ng
from
highes
t
degree
)
Unive
rsity
Year
of
Gradu
ation
In program
Other
Program
To observe cumulative information for all the shifts for
three assessment years 44

5.1. Student-Faculty Ratio (SFR) (20)
S:F ratio = N/F; N=No. of students= 3x where x is (approved intake + 20% lateral entry intake+ separate division, if any)
F = No. of faculty = (a + b – c) for every assessment year
a: Total number of full-time regular Faculty serving fully to 2nd, 3rd and 4th year of the this program
b: Total number of full-time equivalent regular Faculty(considering fractional load)
serving this program from other Program(s)
c: Total number of full time equivalent regular Faculty(considering fractional load)
of this program serving other program(s)
45
Marks to be given proportionally from a maximum of 20 to a minimum of 10 for
average SFR between 15:1 to 20:1, and zero for average SFR higher than 20:1
Note: No. of Regular faculty calculation considering Regular faculty definition and fractional
load; Faculty appointment letters, time table, subject allocation file, salary statements
Faculty Qualification as per AICTE guidelines shall only be counted

* REGULAR Means –
•Full time on roll with prescribed pay scale. An
employee on contract for a period of more than two
years AND drawing consolidated salary equal or
higher than applicable gross salary shall only be
counted as a regular employee
•Prescribed pay scales means pay scales notified by
the AICTE/Central Government and implementation
as prescribed by the State Government. In case
State Government prescribes lesser consolidated
salary for a particular cadre then same will be
considered as reference while counting faculty as a
regular faculty 46

Cadre Proportion Marks = AF1 AF2 x 0.6 AF3 x 0.4
RF1 + RF2 + RF3 x 12.5
If AF1 = AF2= 0 then zero marks
Maximum marks to be limited if it exceeds 25
Example: Intake = 180; Required number of Faculty: 12; RF1= 1, RF2=2 and
RF3=9
Case 1: AF1/RF1= 1; AF2/RF2 = 1; AF3/RF3 = 1;
Cadre proportion marks = (1+0.6+0.4) x12.5 = 25
Case 2: AF1/RF1= 1; AF2/RF2 = 3/2; AF3/RF3 = 8/9;
Cadre proportion marks = (1+0.9+0.3) x12.5 = limited to 25
Case 3: AF1/RF1=0; AF2/RF2=1/2; AF3/RF3=11/9; To be observed carefully
Cadre proportion marks = (0+0.3+0.49) x12.5 = 9.87
47
5.2. Faculty Cadre Proportion (25)
The reference Faculty cadre proportion is 1(F1):2(F2):6(F3)
.
Faculty Qualification and experience required as per AICTE norms/guidelines for cadre posts shall only be considered

48
5.3. Faculty Qualification (25)
FQ =2.5 x [(10X +6Y)/F)] where x is no. of regular faculty with Ph.D., Y is no. of regular faculty with M.Tech., F is no. of regular faculty required to comply 1:15
Faculty Student ratio (no. of faculty and no. of students required are to be
calculated as per 5.1) Documentary Evidence – Qualification
5.4. Faculty Retention (25)
No. of regular faculty members in CAYm2= CAYm1= CAY=
Item
(During the period of assessment keeping CAYm2 as base year)
Marks
>=90% of required Faculty members retained 25
>=75% of required Faculty members retained 20
>=60% of required Faculty members retained 15
>=50% of required Faculty members retained 10
<50% of required Faculty members retained 0
Faculty date of joining; salary statements for each of the assessment years

5.5. Innovations by the Faculty in Teaching and Learning (20)
Contributions to teaching and learning are activities that contribute to the improvement of
student learning. These activities may include innovations not limited to-
• Use of ICT
• Instruction delivery
• Instructional methods
• Assessment
• Evaluation and inclusive class rooms that lead to effective, efficient and engaging
instruction
Any contributions to teaching and learning should satisfy the following criteria:
The work must be made available on Institute website (4)
The work must be available for peer review and critique (4)
The work must be reproducible and developed further by other scholars (2)
Statement of clear goals, use of appropriate methods, significance of results, effective
presentation (10)
The department/institution is expected to set up appropriate processes for making the contributions available to the public, getting them reviewed and
for rewarding
49

5.6. Faculty as participants in Faculty development/training activities/STTPs
(15)
A Faculty scores maximum five points for participation
Participation in 2 to 5 days Faculty development program: 3 Points
• Participation >5 days Faculty development program: 5 points
Name of the Faculty
Max. 5 per Faculty
CAY CAYm1 CAYm2
Sum
RF= Number of Faculty required to comply with
15:1 Student-Faculty ratio as per 5.1
Assessment = 3 × (Sum/0.5RF)
(Marks limited to 15)
Average assessment over three years (Marks limited to 15) =
50

5.7. Research and Development (30)
5.7.1. Academic Research (10)
Academic research includes research paper publications, Ph.D. guidance, and
faculty receiving Ph.D. during the assessment period.
• Number of quality publications in refereed/SCI Journals, citations, Books/Book Chapters etc. (6)
• Ph.D. guided /Ph.D. awarded during the assessment period while working in the
institute (4)
5.7.2. Sponsored Research (5)
• Funded research from outside
• Provide a list with Project Title, Funding Agency, Amount and Duration
Funded research from outside; Cumulative during Assessment years:
• Amount >20 Lacs – 5 Marks
• Amount >=16Lacs and < =20 Lacs – 4 Marks
• Amount >=12 Lacs and < 16 Lacs – 3 Marks
• Amount >=8 Lacs and < 12 Lacs – 2 Marks • Amount >=4 Lacs and < 8 Lacs – 1 Mark
• Amount < 4 Lacs – 0 Mark 51

5.7.3. Development activities (10)
Provide details:
• Product Development
• Research laboratories
• Instructional materials
• Working models/charts/monograms etc.
5.7.4. Consultancy (from Industry) (5)
• Provide a list with Project Title, Funding Agency, Amount and Duration
Funded research from outside; Cumulative during Assessment years:
• Amount >10 Lacs – 5 Marks
• Amount >=8Lacs and <=10 Lacs – 4 Marks • Amount >=6 Lacs and < 8 Lacs – 3 Marks
• Amount >=4 Lacs and < 6 Lacs – 2 Marks
• Amount > =2 Lacs and < 4 Lacs – 1 Mark
• Amount < 2 Lacs – 0 Mark
52

5.8. Faculty Performance Appraisal and Development System (FPADS) (30)
The assessment is based on:
A well-defined system for faculty appraisal for all the assessment years (10)
Its implementation, transperancy and effectiveness (20)
5.9. Visiting/Adjunct/Emeritus Faculty etc. (10)
Adjunct faculty also includes Industry experts. Provide details of participation and
contributions in teaching and learning and /or research by
visiting/adjunct/Emeritus faculty etc. for all the assessment years:
• Provision of inviting visiting/adjunct /Emeritus faculty (1)
• Minimum 50 hours per year interaction with adjunct faculty from industry/retired
professors etc.
Minimum 50 hours interaction in a year will result in 3 marks for that year; 3
marks x 3 years = 9 marks
53

CRITERION 6 Facilities and Technical
Support
80
54
Differentiators: 2015 (2013)
Weightage: 80 (125)
Parameters: 2 (4)
1. Laboratories: 65 (60; Class Rooms-30, Faculty Rooms-20)
2. Technical Manpower Support: 15 (15)

CRITERION 6 Facilities and Technical
Support
80
6.1. Adequate and well equipped laboratories, and technical manpower (30)
S N
Name of the Laboratory
No. of students per
setup
(Batch Size)
Name of the Important equipment
Weekly utilization status (all
the courses for which the lab is utilized)
Technical Manpower support
Name of the
technical staff
Designation
Qualification
1.
N.
55

6.2. Additional facilities created for improving the quality of learning experience
in laboratories (25)
6.3. Laboratories: Maintenance and overall ambiance (10)
Self-Explanatory
6.4. Project laboratory (5)
Mention facility & Utilization
Sr.
No. Facility Name Details
Reason(s) for
creating
facility
Utilization
Areas in which
students’ are
expected to have
enhanced learning
Relevance
to
POs/PSOs
1.
N.
56

6.5. Safety measures in laboratories (10)
Sr.
No.
Name of the Laboratory Safety measures
1.
N.
57

CRITERION 7 Continuous Improvement 50
7.1. Actions taken based on the results of evaluation of each of the POs &
PSOs (20)
• Identify the areas of weaknesses in the program based on the analysis of
evaluation of POs & PSOs attainment levels
• Measures identified and implemented to improve POs & PSOs attainment levels for the assessment years
Examples of analysis and proposed action
Sample 1:
• Course outcomes for a laboratory course did not measure up, as some of the lab
equipment did not have the capability to do the needful (e.g., single trace
oscilloscopes available where dual trace would have been better, or, non-
availability of some important support software etc.)
• Action taken-Equipment up-gradation was carried out (with details of up-
gradation)
58

Sample 2:
• In a course on EM theory student performance has been consistently low with
respect to some COs
• Analysis of answer scripts and discussions with the students revealed that this could be attributed to a weaker course on vector calculus
• Action taken-revision of the course syllabus was carried out (instructor/text book
changed too has been changed, when deemed appropriate)
Sample 3:
• In a course that had group projects it was determined that the expectations from
this course about PO3 (like: “to meet the specifications with consideration for
the public health and safety, and the cultural, societal, and environmental
considerations”) were not realized as there were no discussions about these
aspects while planning and execution of the project
• Action taken- Project planning, monitoring and evaluation included in rubrics
related to these aspects
59

Target
Level
Attainment
Level Observations
PO1: Engineering knowledge: Apply the
knowledge of mathematics, science,
engineering fundamentals, and an engineering
specialization to the solution of complex
engineering problems.
Action 1:
Action n:
PO2: Problem analysis: Identify, formulate,
research literature, and analyze complex
engineering problems reaching substantiated
conclusions using first principles of
mathematics, natural sciences, and engineering
sciences
POs & PSOs Attainment Levels and Actions for improvement – CAY
Similar Tables should be presented for all POs & PSOs 60

7.2. Academic Audit and actions taken thereof during the period of
Assessment (10)
• Assessment shall be based on conduct and actions taken in relation to
Continuous Improvement (10)
Assessment criteria, frequency, conduct mechanism, action plan, implementation
and effectiveness
7.3. Improvement in Placement, Higher Studies and Entrepreneurship (10)
Assessment is based on improvement in:
• Placement: number, quality placement, core industry, pay packages etc. (5) • Higher studies: performance in GATE, GRE, GMAT, CAT etc., and
admissions in premier institutions (3)
• Entrepreneurs (2)
7.4. Improvement in the quality of students admitted to the program (10)
Assessment is based on improvement in terms of ranks/score in qualifying –
• State level/National level entrances tests
• Percentage marks in Physics, Chemistry and Mathematics in 12th Standard
• Percentage marks of the lateral entry students
61

CRITERION 8 First Year Academics 50
8.1. First Year Student-Faculty Ratio (FYSFR) (5)
Assessment = (5 × 15)/Average FYSFR (Limited to Max. 5)
8.2. Qualification of Faculty Teaching First Year Common Courses (5)
Assessment of qualification = (5x +3y)/RF
x= Number of Regular Faculty with Ph.D
y = Number of Regular Faculty with Post-graduate qualification
RF= Number of faculty members required as per SFR of 15:1
8.3. First Year Academic Performance (10)
Academic Performance = ((Mean of 1st Year Grade Point Average of all successful Students
on a 10 point scale) or (Mean of the percentage of marks in First Year of all successful
students/10)) x (number of successful students/number of students appeared in the
examination)
Successful students are those who are permitted to proceed to the Second year
62

8.4. Attainment of Course Outcomes of first year courses (10)
8.4.1. Describe the assessment processes used to gather the data upon which the evaluation of Course Outcomes of first year is done (5)
Examples of data collection processes may include, but are not limited to –
• Specific exam questions
• Laboratory tests
• Internally developed assessment exams
• Oral exams
• Assignments
• Presentations
• Tutorial sheets etc.
8.4.2. Record the attainment of Course Outcomes of all first year courses (5)
Program shall have set attainment levels for all first year courses.
• The attainment levels shall be set considering average performance levels in the University Examination or any higher value set as target for the assessment years.
• Attainment level is to be measured in terms of student performance in internal
assessments with respect the COs of a subject plus the performance in the
University examination
63

8.5. Attainment of Program Outcomes of all first year courses (20)
8.5.1. Indicate results of evaluation of each relevant PO and/or PSO, if
applicable (15)
• The relevant program outcomes that are to be addressed at first year need to be
identified by the institution
• Program Outcome attainment levels shall be set for all relevant POs and/or PSOs
through first year courses
Course PO1 PO2 PO3 PO4 PO5 PO6 PO7 PO8 PO9 PO10 PO11 PO12
C101
C102
…
….
...
Direct
Attainment
64
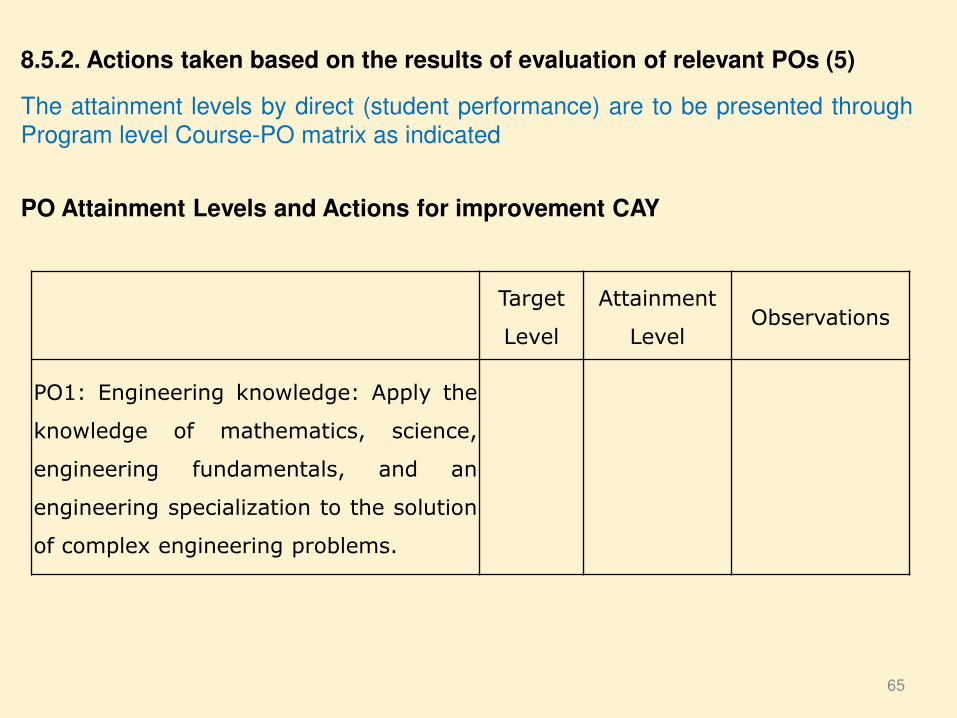
8.5.2. Actions taken based on the results of evaluation of relevant POs (5)
The attainment levels by direct (student performance) are to be presented through
Program level Course-PO matrix as indicated
PO Attainment Levels and Actions for improvement CAY
Target
Level
Attainment
Level Observations
PO1: Engineering knowledge: Apply the
knowledge of mathematics, science,
engineering fundamentals, and an
engineering specialization to the solution
of complex engineering problems.
65

Target
Level
Attainment
Level Observations
Action 1:
Action n:
PO2: Problem analysis: Identify, formulate,
research literature, and analyze complex
engineering problems reaching substantiated
conclusions using first principles of mathematics,
natural sciences, and engineering sciences
Action 1:
Action n:
Note: PSOs, if applicable to be added appropriately
66

CRITERION 8 First Year Academics 50
8.1. First Year Student-Faculty Ratio (FYSFR) (5)
Assessment = (5 × 15)/Average FYSFR (Limited to Max. 5)
8.2. Qualification of Faculty Teaching First Year Common Courses (5)
Assessment of qualification = (5x +3y)/RF
x= Number of Regular Faculty with Ph.D
y = Number of Regular Faculty with Post-graduate qualification
RF= Number of faculty members required as per SFR of 15:1
8.3. First Year Academic Performance (10)
Academic Performance = ((Mean of 1st Year Grade Point Average of all successful Students
on a 10 point scale) or (Mean of the percentage of marks in First Year of all successful
students/10)) x (number of successful students/number of students appeared in the
examination)
Successful students are those who are permitted to proceed to the Second year
67
8.4. Attainment of Course Outcomes of first year courses (10)
8.5. Attainment of Program Outcomes of all first year courses (20)

CRITERION 9 Student Support Systems 50
9.1 Mentoring system to help at individual level (5)
• Type of mentoring: Professional guidance / career advancement / course work
specific / laboratory specific / all-round development
• Number of faculty mentors
• Number of students per mentor
• Frequency of meeting
Terms of reference, implementation & effectiveness (during interaction also)
9.2. Feedback analysis and reward /corrective measures taken, if any (10)
• Feedback collected for all courses: YES/NO • Feedback questionnaire
• Specify the feedback collection process
• Average Percentage of students who participated
• Specify the feedback analysis process
• Basis of reward / corrective measures, if any: Indices used for measuring quality of teaching and learning
• Summary of the index values for all courses/teachers
• Number of corrective actions taken 68
implementation & effectiveness
(during interaction also)

9.3. Feedback on facilities (5)
Assessment is based on -
• Feedback collection
• Analysis and corrective action taken
9.4. Self Learning (5)
The institution needs to specify –
• Facilities • Materials
• Scope for self-learning / learning beyond syllabus
• Webinars
•Podcast
• MOOCs • Evaluate effectiveness
•Scope for self learning (2)
• Facilities and its effective utilization (3)
69

9.5. Career Guidance, Training, Placement (10)
The institution may specify –
• Facility
• Management
• Effectiveness for career guidance including counseling for higher studies
• Campus placement support • Industry interaction for training/internship/placement, etc.
Facility (2), Counseling for higher studies (2), Pre-placement training (3)
Placement process and support (3)
9.6. Entrepreneurship Cell (5)
The institution may specify –
• Facility
• Management
• Effectiveness in encouraging entrepreneurship and incubation
• Success stories for each of the assessment years
Entrepreneurship initiative (1), Students benefit (4)
9.7. Co-curricular and Extra-curricular Activities (10)
The institution may specify –
• Co-curricular and extra-curricular activities 70

CRITERION 10 Governance, Institutional Support
and Financial Resources 120
71
Differentiators: 2015 (2013)
Weightage: 120 (75)
Parameters: 4 (8)
1. Organization, Governance & Transparency: 40 (10)
2. Institute Budget Allocation, Utilization: 30 (10)
3. Program Budget Allocation, Utilization: 30 (10)
4. Library & Internet: 20 (25)
Deleted – Campus Infrastructure, Facilities, Safety norms, emergency medical care and first aid

CRITERION 10 Governance, Institutional Support
and Financial Resources 120
10.1 Organization, Governance and Transparency (40)
10.1.1. State the Vision and Mission of the Institute (5)
Vision statement typically indicates aspirations and Mission statement states the
broad approach to achieve aspirations
Availability (2)
Appropriateness/relevance (3)
•Availability of statement on Institute website
•Availability at Central facilities such as Library, Computer Centers, Principal
Chambers etc.
•Availability of one set of statements in each of the departments •Availability in Institute level documents
72

10.1.2. Governing body, administrative setup, functions of various bodies,
service rules, procedures, recruitment and promotional policies (10)
• List the governing, senate, and all other academic and administrative bodies; their
memberships, functions, and responsibilities; frequency of the meetings; and
attendance therein (4)
• The published rules including service rules, policies and procedures; year of
publication shall be listed (3)
• Minutes of the meetings, Action taken reports, extent of awareness among the
employees/students (3)
10.1.3. Decentralization in working and grievance redressal mechanism (10)
• List the names of the faculty members who have been delegated powers for
taking administrative decisions (1)
• Grievance Redressal cell (2)
• Action taken report for the above point (7)
73

10.1.4. Delegation of financial powers (10)
• Institution should explicitly mention financial powers delegated to the Principal,
Heads of Departments and relevant in-charges (3)
• Demonstrate the utilization of financial powers for each year of the assessment
years (7)
10.1.5. Transparency and availability of correct/unambiguous information in
public domain (5)
• Information on policies, rules, processes and dissemination of this information to
stakeholders is to be made available on the web site (2)
• Disseminating of information about student, faculty and staff (3)
10.2 Budget Allocation, Utilization, and Public Accounting at Institute level (30)
Summary of current financial year’s budget and actual expenditure incurred (for the
institution exclusively) in the three previous financial years.
74
Budget formulation, finalization, approval process
Requirement – allocation –adequacy – justification thereof

Total Income at Institute level: For CFY, CFYm1, CFYm2 & CFYm3
For CFY: Similar tables are to be prepared for CFYm1, CFYm2 & CFYm3
Total Income: Actual expenditure (till …):
Total No. of
students:
Fee Govt. Grant(s)
Other
Sources
(specify)
Recurring
including
Salaries
Non-
recurring
Special
Projects/Any
other, specify
Expenditure
per student
75

Items Budgeted
in CFY
Actual
expenses
in CFY
(till …)
Budgeted
in CFYm1
Actual
Expenses
in CFYm1
Budgeted
in CFYm2
Actual
Expenses
in CFYm2
Budgeted
in CFYm3
Actual
Expenses
in CFYm3
Infrastructure
Built-Up
Library
Laboratory
equipment
Laboratory
consumables
Teaching and
non-teaching
staff salary
Maintenance and
spares
R&D
Training and
Travel
Miscellaneous
expenses *
Others, specify
Total
* Items to be mentioned 76

10.2.1 Adequacy of budget allocation (10)
• The institution needs to justify that the budget allocated over the years was
adequate
Quantum of budget allocation (5), Justification (5)
10.2.2 Utilization of allocated funds (15)
• The institution needs to state how the budget was utilized during assessment
years
10.2.3 Availability of the audited statements on the institute’s website (5)
• The institution needs to make audited statements available on its website.
Balance sheet; effective utilization; random verification for atleast two of the three assessment years
10.3 Program Specific Budget Allocation, Utilization (30) Total Budget at program level: For CFY, CFYm1, CFYm2 & CFYm3
77
Budget formulation, finalization, approval, program allocation process
Requirement – allocation –adequacy – justification thereof

Total Budget: Actual expenditure (till …):
Total No. of
students:
Non recurring Recurring Non Recurring Recurring
Expenditure
per student
For CFY: Similar tables are to be prepared for CFYm1, CFYm2 & CFYm3.
Items Budgeted
in CFY
Actual
expenses
in CFY
(till …)
Budgeted
in CFYm1
Actual
Expenses
in CFYm1
Budget
ed in
CFYm2
Actual
Expens
es in
CFYm2
Budge
ted in
CFYm3
Actual
Expens
es in
CFYm3
Laboratory
equipment
Software
Laboratory
consumable
78

Items
Budget
ed in
CFY
Actual
expens
es in
CFY
(till …)
Budget
ed in
CFYm1
Actual
Expens
es in
CFYm1
Budget
ed in
CFYm2
Actual
Expens
es in
CFYm2
Budget
ed in
CFYm3
Actual
Expens
es in
CFYm3
R & D
Training and
Travel
Miscellaneous
expenses *
Total
* Items to be mentioned
79

10.3.1. Adequacy of budget allocation (10)
Program needs to justify that the budget allocated over the assessment years was
adequate for the program
Quantum of budget allocation (5), Justification (5)
10.3.2. Utilization of allocated funds (20)
Program needs to state how the budget was utilized during the last three
assessment years
Balance sheet; effective utilization; random verification for atleast two of the
three assessment years
10.4. Library and Internet (20)
• AICTE zero deficiency report for all the assessment years
• Effective availability
• Purchase records
• Utilization of facilities/equipment
• Documentation
80

10.4.1. Quality of learning resources (hard/soft) (10)
• Relevance of available learning resources including e-resources (7)
• Accessibility to students (3)
10.4.2. Internet (10)
• Name of the Internet provider
• Available bandwidth (4) • Wi Fi availability (2)
• Internet access in labs, classrooms, library and offices of all
Departments (2)
• Security arrangements (2)
81

Thanks
82