Embed Size (px)
Citation preview
Company Presentation
August 2017
Navios South American Logistics Inc.
2
This presentation contains forward-looking statements within the meaning of the Private Securities Reform Act of 1995. All statements herein other than statements of historical fact, including statements regarding business and industry prospects or future results of operations or financial position, and future dividends or distributions, should be considered forward-looking. Words such as “may,” “expects,” “intends,” “plans,” “believes,” “anticipates,” “hopes,” “estimates,” and variations of such words and similar expressions are intended to identify forward-looking statements. These forward looking statements are based on the information available to, and the expectations and assumptions deemed reasonable by, Navios Logistics at the time this presentation was made. Although Navios Logistics believes that the expectations reflected in such forward-looking statements are reasonable, no assurance can be given that such expectations will prove to have been correct. These statements involve known and unknown risks and are based upon a number of assumptions and estimates which are inherently subject to significant uncertainties and contingencies, many of which are beyond the control of Navios Logistics. Actual results may differ materially from those expressed or implied by such forward-looking statements. Included among the factors that, in management’s view, could cause actual results to differ materially from the forward-looking statements contained in this report are changes in any of the following: (i) demand and/or charter and contract rates for our vessels and port facilities; (ii) production or demand for the types of dry and liquid products that are transported by our vessels or stored in our ports; (iii) operating costs including, but not limited to, changes in crew salaries, insurance, provisions, repairs, maintenance and overhead expenses; (iv) changes in interest rates; and other factors listed from time to time in the Navios Logistics’ filings with the Securities and Exchange Commission, including its Form 20Fs and Form 6Ks. Navios Logistics expressly disclaims any obligations or undertaking to release publicly any updates or revisions to any forward-looking statements contained herein to reflect any change in Navios Logistics’ expectations with respect thereto or any change in events, conditions or circumstances on which any statement is based.
EBITDA represents Net Income/(Loss) attributable to Navios Logistics’ stockholders before interest, taxes, depreciation and amortization. Adjusted EBITDA represents EBITDA excluding certain items as described under “Earnings Highlights”. EBITDA is presented because it is used by certain investors to measure a company's operating performance. EBITDA and Adjusted EBITDA are “non-GAAP financial measures” and should not be considered a substitute for net income, cash flow from operating activities and other operations or cash flow statement data prepared in accordance with accounting principles generally accepted in the United States or as a measure of profitability or liquidity. While EBITDA is frequently used as a measure of operating performance, the definition of EBITDA used here may not be comparable to that used by other companies due to differences in methods of calculation.
Wood Mackenzie Notice on Market and Industry Data The information upon which the Wood Mackenzie report is based has either been supplied to Wood MacKenzie by Navios Logistics or comes from Wood Mackenzie own experience, knowledge and databases. The opinions expressed in the Wood Mackenzie report are those of Wood Mackenzie. They have been arrived at following careful consideration and enquiry but we do not guarantee their fairness, completeness or accuracy. The opinions, as of this date, are subject to change. We do not accept any liability for your reliance upon them.
Forward Looking Statements and Disclaimer
3
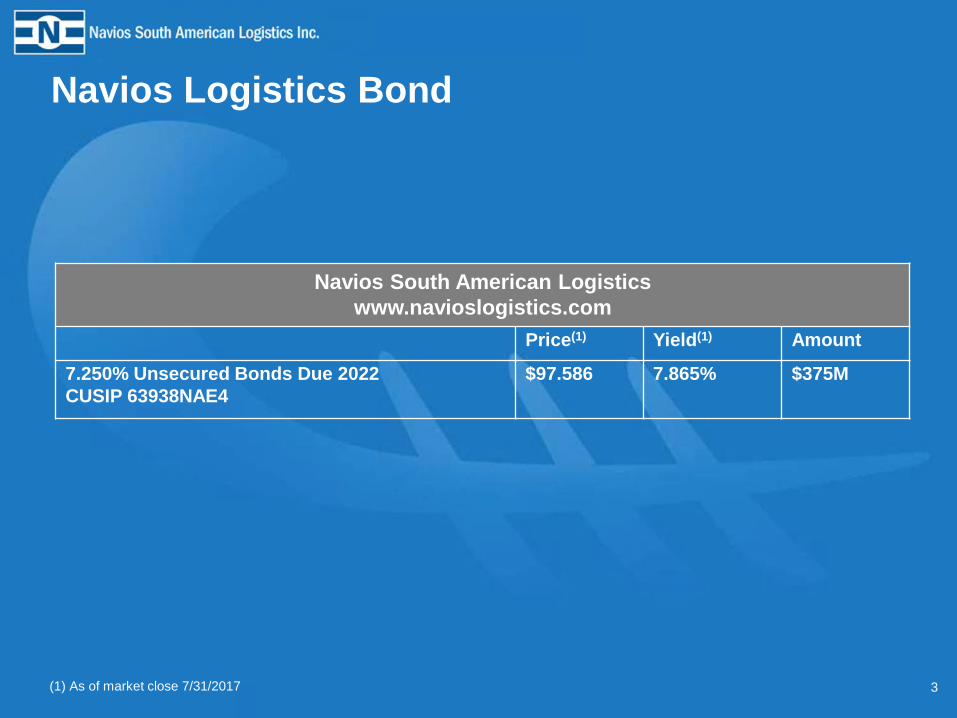
Navios South American Logistics
www.navioslogistics.com
Price(1) Yield(1) Amount
7.250% Unsecured Bonds Due 2022
CUSIP 63938NAE4
$97.586 7.865% $375M
Navios Logistics Bond
(1) As of market close 7/31/2017
4
Navios Logistics Overview
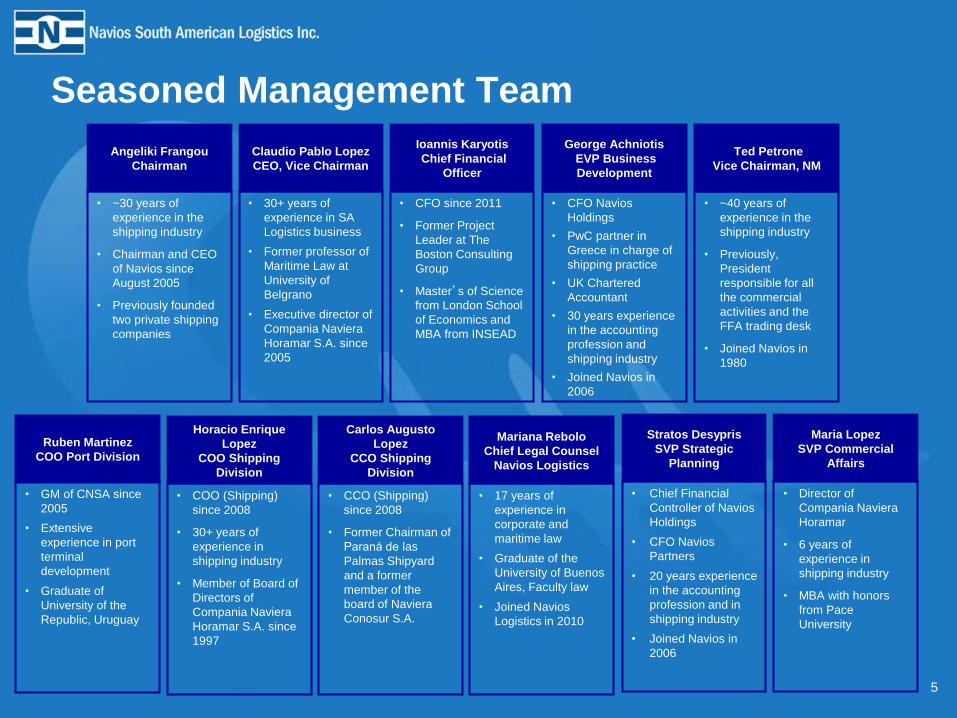
Seasoned Management Team
5
• CCO (Shipping)
since 2008
• Former Chairman of
Paraná de las
Palmas Shipyard
and a former
member of the
board of Naviera
Conosur S.A.
Carlos Augusto
Lopez
CCO Shipping
Division
• ~30 years of
experience in the
shipping industry
• Chairman and CEO
of Navios since
August 2005
• Previously founded
two private shipping
companies
Angeliki Frangou
Chairman
• GM of CNSA since
2005
• Extensive
experience in port
terminal
development
• Graduate of
University of the
Republic, Uruguay
Ruben Martinez
COO Port Division
• 30+ years of
experience in SA
Logistics business
• Former professor of
Maritime Law at
University of
Belgrano
• Executive director of
Compania Naviera
Horamar S.A. since
2005
Claudio Pablo Lopez
CEO, Vice Chairman
• CFO since 2011
• Former Project
Leader at The
Boston Consulting
Group
• Master’s of Science
from London School
of Economics and
MBA from INSEAD
Ioannis Karyotis
Chief Financial
Officer
• CFO Navios
Holdings
• PwC partner in
Greece in charge of
shipping practice
• UK Chartered
Accountant
• 30 years experience
in the accounting
profession and
shipping industry
• Joined Navios in
2006
George Achniotis
EVP Business
Development
• Director of
Compania Naviera
Horamar
• 6 years of
experience in
shipping industry
• MBA with honors
from Pace
University
Maria Lopez
SVP Commercial
Affairs
• COO (Shipping)
since 2008
• 30+ years of
experience in
shipping industry
• Member of Board of
Directors of
Compania Naviera
Horamar S.A. since
1997
Horacio Enrique
Lopez
COO Shipping
Division
• 17 years of
experience in
corporate and
maritime law
• Graduate of the
University of Buenos
Aires, Faculty law
• Joined Navios
Logistics in 2010
Mariana Rebolo
Chief Legal Counsel
Navios Logistics
• Chief Financial
Controller of Navios
Holdings
• CFO Navios
Partners
• 20 years experience
in the accounting
profession and in
shipping industry
• Joined Navios in
2006
Stratos Desypris
SVP Strategic
Planning
• ~40 years of
experience in the
shipping industry
• Previously,
President
responsible for all
the commercial
activities and the
FFA trading desk
• Joined Navios in
1980
Ted Petrone
Vice Chairman, NM
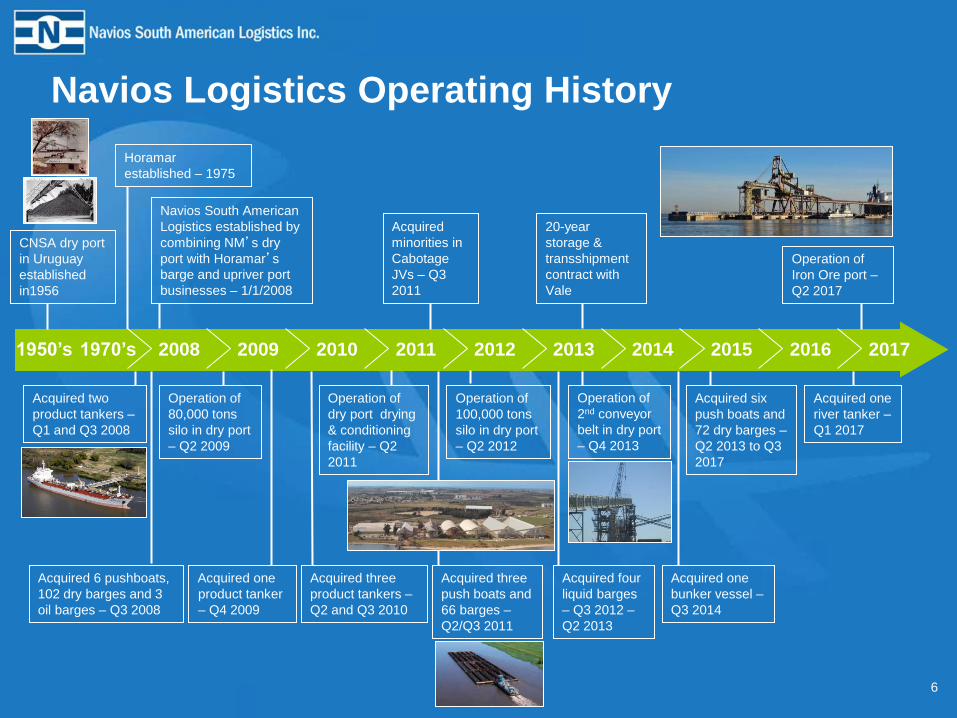
Navios Logistics Operating History
6
2008
Operation of
80,000 tons
silo in dry port
– Q2 2009
Acquired two
product tankers –
Q1 and Q3 2008
Acquired one
product tanker
– Q4 2009
Acquired three
product tankers –
Q2 and Q3 2010
Operation of
dry port drying
& conditioning
facility – Q2
2011
Navios South American
Logistics established by
combining NM’s dry
port with Horamar’s
barge and upriver port
businesses – 1/1/2008
Acquired 6 pushboats,
102 dry barges and 3
oil barges – Q3 2008
1950’s 1970’s
CNSA dry port
in Uruguay
established
in1956
Horamar
established – 1975
Acquired three
push boats and
66 barges –
Q2/Q3 2011
Acquired
minorities in
Cabotage
JVs – Q3
2011
Operation of
100,000 tons
silo in dry port
– Q2 2012
Acquired four
liquid barges
– Q3 2012 –
Q2 2013
Operation of
2nd conveyor
belt in dry port
– Q4 2013
2009 2010 2011 2012 2013
Acquired six
push boats and
72 dry barges –
Q2 2013 to Q3
2017
2014
Acquired one
bunker vessel –
Q3 2014
2015
20-year
storage &
transshipment
contract with
Vale
2016 2017
Operation of
Iron Ore port –
Q2 2017
Acquired one
river tanker –
Q1 2017
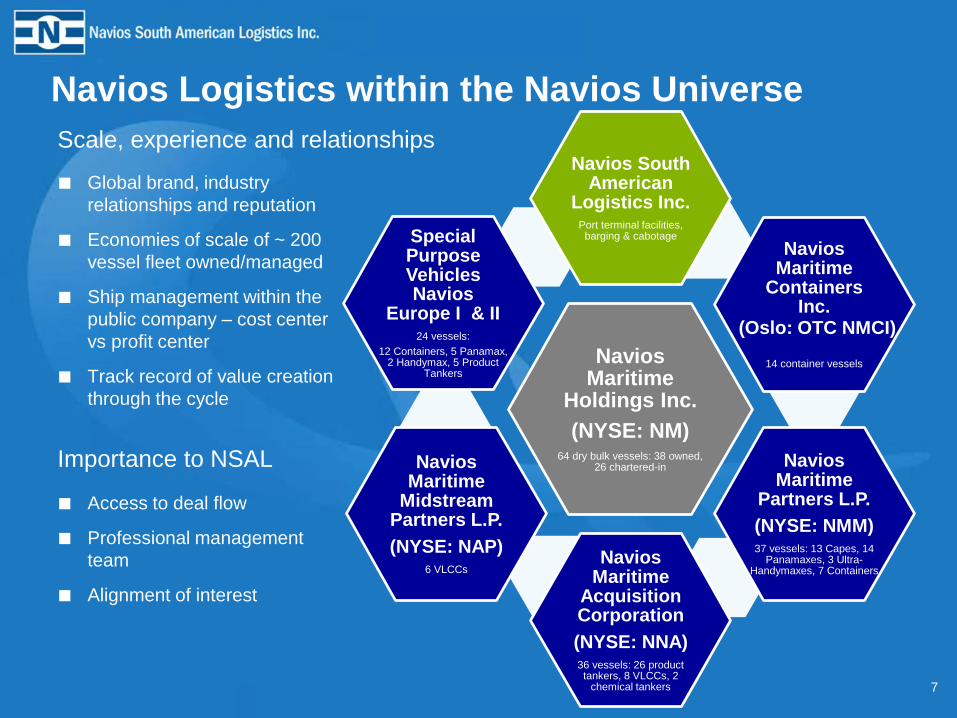
Navios Logistics within the Navios Universe
7
Navios Maritime
Holdings Inc.
(NYSE: NM) 64 dry bulk vessels: 38 owned,
26 chartered-in
Navios South American
Logistics Inc. Port terminal facilities,
barging & cabotage
Navios Maritime
Containers Inc.
14 container vessels
Navios Maritime
Partners L.P.
(NYSE: NMM) 37 vessels: 13 Capes, 14
Panamaxes, 3 Ultra-Handymaxes, 7 Containers
Navios Maritime
Acquisition Corporation
(NYSE: NNA) 36 vessels: 26 product tankers, 8 VLCCs, 2
chemical tankers
Navios Maritime
Midstream Partners L.P.
(NYSE: NAP) 6 VLCCs
Special Purpose Vehicles Navios
Europe I & II 24 vessels:
12 Containers, 5 Panamax, 2 Handymax, 5 Product
Tankers
Scale, experience and relationships
■ Global brand, industry
relationships and reputation
■ Economies of scale of ~ 200
vessel fleet owned/managed
■ Ship management within the
public company – cost center
vs profit center
■ Track record of value creation
through the cycle
■ Access to deal flow
■ Professional management
team
■ Alignment of interest
Importance to NSAL
(Oslo: OTC NMCI)
8
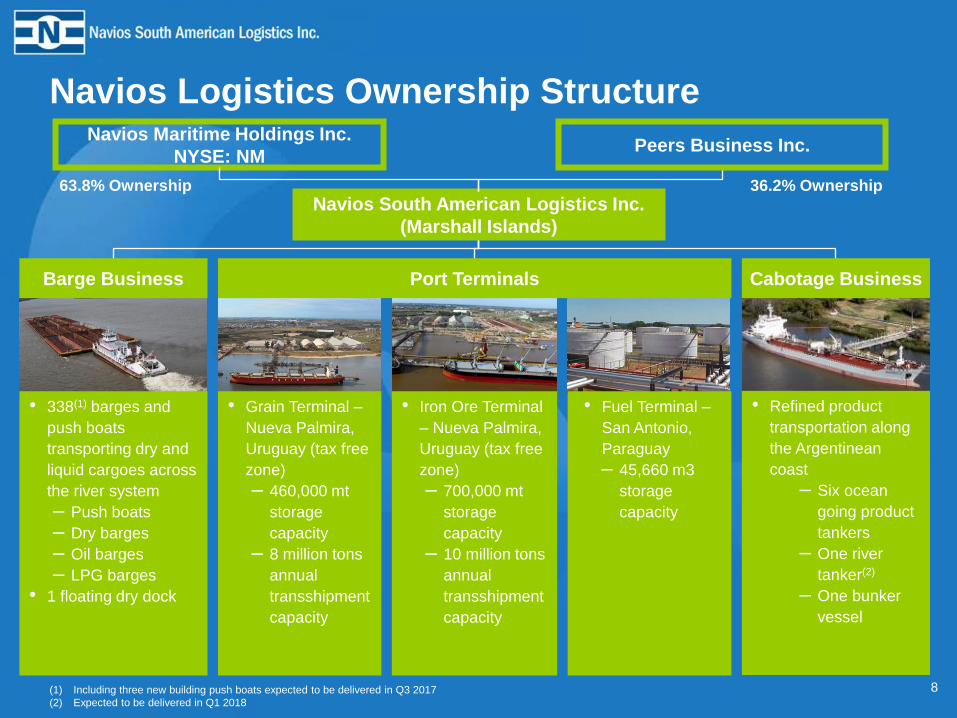
Navios Logistics Ownership Structure
Port Terminals
• 338(1) barges and
push boats
transporting dry and
liquid cargoes across
the river system
– Push boats
– Dry barges
– Oil barges
– LPG barges
• 1 floating dry dock
Cabotage Business
Navios South American Logistics Inc.
(Marshall Islands)
(1) Including three new building push boats expected to be delivered in Q3 2017
(2) Expected to be delivered in Q1 2018
Navios Maritime Holdings Inc.
NYSE: NM
63.8% Ownership 36.2% Ownership
Peers Business Inc.
Barge Business
• Grain Terminal –
Nueva Palmira,
Uruguay (tax free
zone)
– 460,000 mt
storage
capacity
– 8 million tons
annual
transshipment
capacity
• Iron Ore Terminal
– Nueva Palmira,
Uruguay (tax free
zone)
– 700,000 mt
storage
capacity
– 10 million tons
annual
transshipment
capacity
• Fuel Terminal –
San Antonio,
Paraguay
– 45,660 m3
storage
capacity
• Refined product
transportation along
the Argentinean
coast
– Six ocean
going product
tankers
– One river
tanker(2)
– One bunker
vessel
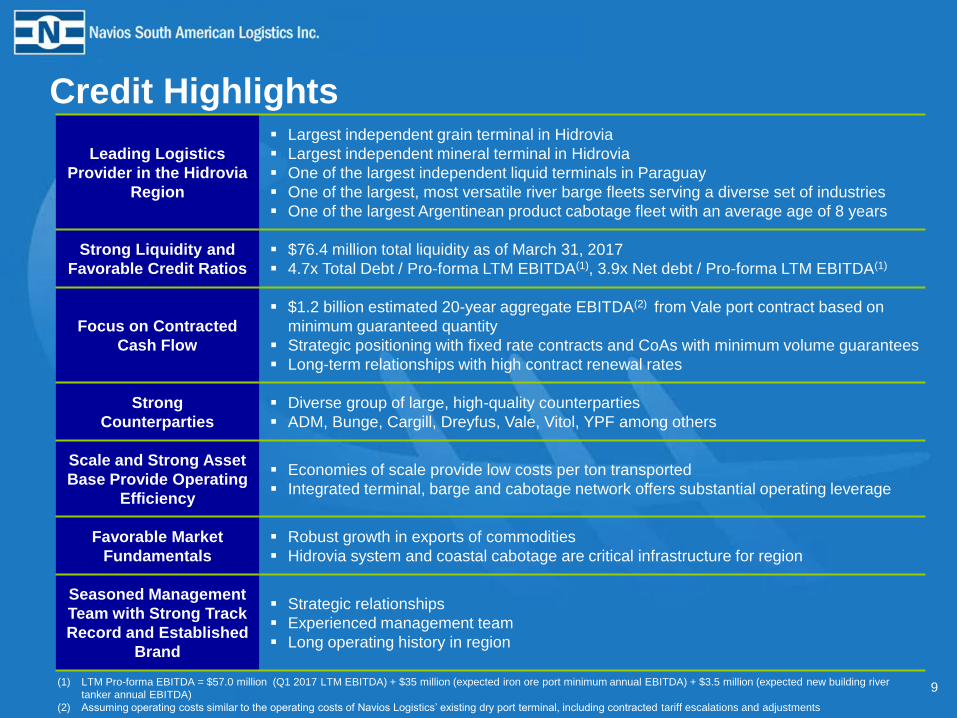
Credit Highlights
9
Leading Logistics
Provider in the Hidrovia
Region
Largest independent grain terminal in Hidrovia
Largest independent mineral terminal in Hidrovia
One of the largest independent liquid terminals in Paraguay
One of the largest, most versatile river barge fleets serving a diverse set of industries
One of the largest Argentinean product cabotage fleet with an average age of 8 years
Strong Liquidity and
Favorable Credit Ratios
$76.4 million total liquidity as of March 31, 2017
4.7x Total Debt / Pro-forma LTM EBITDA(1), 3.9x Net debt / Pro-forma LTM EBITDA(1)
Focus on Contracted
Cash Flow
$1.2 billion estimated 20-year aggregate EBITDA(2) from Vale port contract based on
minimum guaranteed quantity
Strategic positioning with fixed rate contracts and CoAs with minimum volume guarantees
Long-term relationships with high contract renewal rates
Strong
Counterparties
Diverse group of large, high-quality counterparties
ADM, Bunge, Cargill, Dreyfus, Vale, Vitol, YPF among others
Scale and Strong Asset
Base Provide Operating
Efficiency
Economies of scale provide low costs per ton transported
Integrated terminal, barge and cabotage network offers substantial operating leverage
Favorable Market
Fundamentals
Robust growth in exports of commodities
Hidrovia system and coastal cabotage are critical infrastructure for region
Seasoned Management
Team with Strong Track
Record and Established
Brand
Strategic relationships
Experienced management team
Long operating history in region
(1) LTM Pro-forma EBITDA = $57.0 million (Q1 2017 LTM EBITDA) + $35 million (expected iron ore port minimum annual EBITDA) + $3.5 million (expected new building river
tanker annual EBITDA)
(2) Assuming operating costs similar to the operating costs of Navios Logistics’ existing dry port terminal, including contracted tariff escalations and adjustments
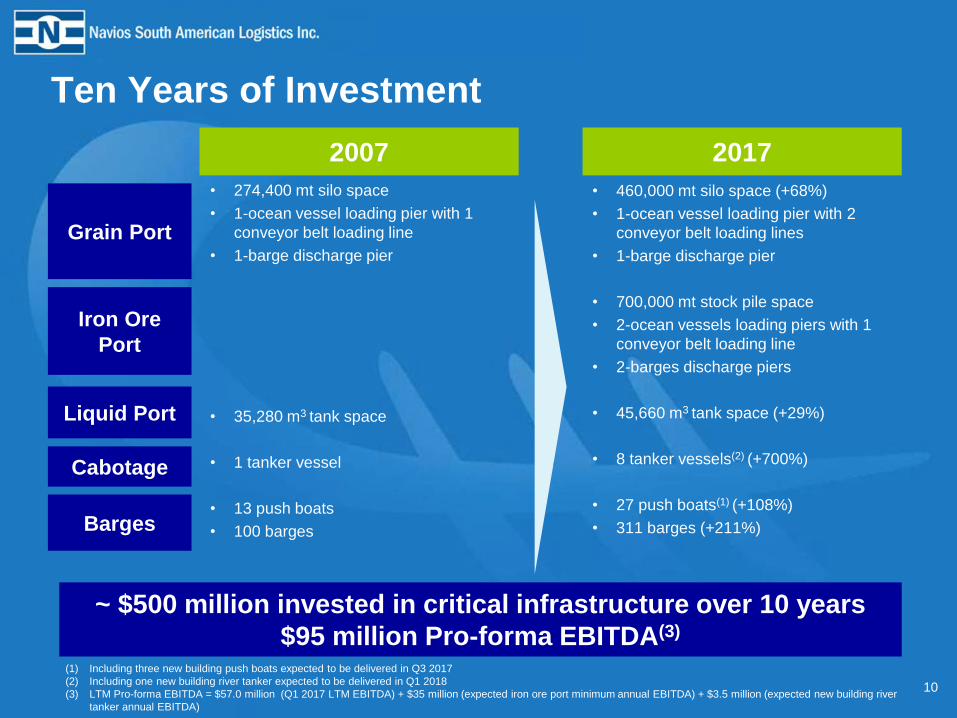
Ten Years of Investment
10
2007 2017
Grain Port
Liquid Port
Barges
Cabotage
• 274,400 mt silo space
• 1-ocean vessel loading pier with 1
conveyor belt loading line
• 1-barge discharge pier
• 35,280 m3 tank space
• 1 tanker vessel
• 13 push boats
• 100 barges
• 460,000 mt silo space (+68%)
• 1-ocean vessel loading pier with 2
conveyor belt loading lines
• 1-barge discharge pier
• 700,000 mt stock pile space
• 2-ocean vessels loading piers with 1
conveyor belt loading line
• 2-barges discharge piers
• 45,660 m3 tank space (+29%)
• 8 tanker vessels(2) (+700%)
• 27 push boats(1) (+108%)
• 311 barges (+211%)
(1) Including three new building push boats expected to be delivered in Q3 2017
(2) Including one new building river tanker expected to be delivered in Q1 2018
(3) LTM Pro-forma EBITDA = $57.0 million (Q1 2017 LTM EBITDA) + $35 million (expected iron ore port minimum annual EBITDA) + $3.5 million (expected new building river
tanker annual EBITDA)
~ $500 million invested in critical infrastructure over 10 years
$95 million Pro-forma EBITDA(3)
Iron Ore
Port
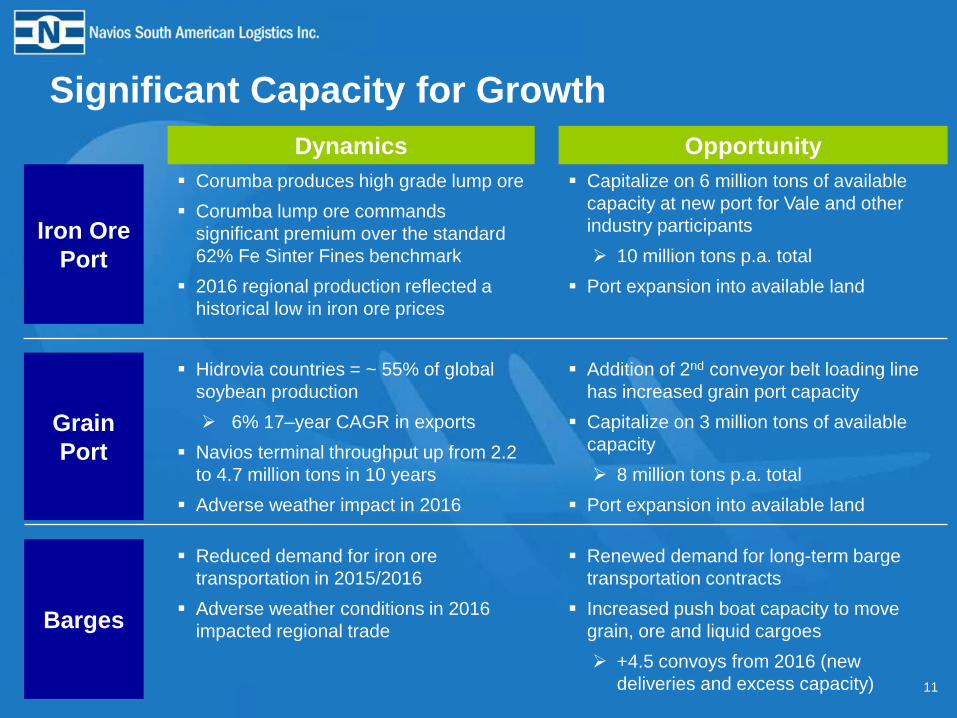
Barges
Reduced demand for iron ore
transportation in 2015/2016
Adverse weather conditions in 2016
impacted regional trade
Renewed demand for long-term barge
transportation contracts
Increased push boat capacity to move
grain, ore and liquid cargoes
+4.5 convoys from 2016 (new
deliveries and excess capacity) 11
Significant Capacity for Growth
Dynamics Opportunity
Iron Ore
Port
Corumba produces high grade lump ore
Corumba lump ore commands
significant premium over the standard
62% Fe Sinter Fines benchmark
2016 regional production reflected a
historical low in iron ore prices
Capitalize on 6 million tons of available
capacity at new port for Vale and other
industry participants
10 million tons p.a. total
Port expansion into available land
Grain
Port
Hidrovia countries = ~ 55% of global
soybean production
6% 17–year CAGR in exports
Navios terminal throughput up from 2.2
to 4.7 million tons in 10 years
Adverse weather impact in 2016
Addition of 2nd conveyor belt loading line
has increased grain port capacity
Capitalize on 3 million tons of available
capacity
8 million tons p.a. total
Port expansion into available land
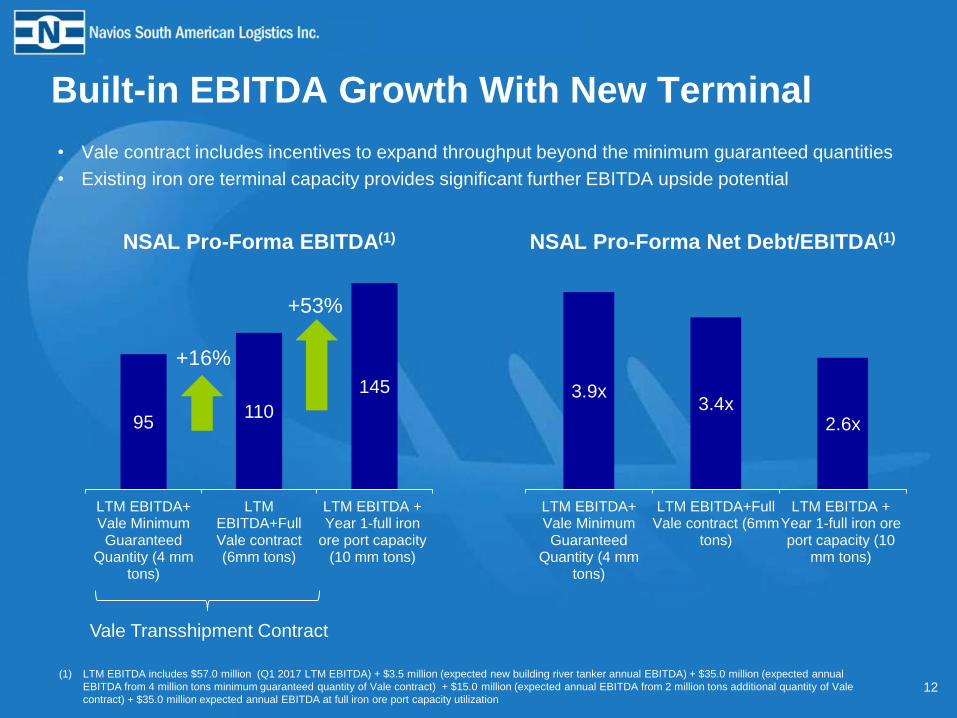
Built-in EBITDA Growth With New Terminal
• Vale contract includes incentives to expand throughput beyond the minimum guaranteed quantities
• Existing iron ore terminal capacity provides significant further EBITDA upside potential
12
3.9x 3.4x
2.6x
LTM EBITDA+Vale MinimumGuaranteed
Quantity (4 mmtons)
LTM EBITDA+FullVale contract (6mm
tons)
LTM EBITDA +Year 1-full iron oreport capacity (10
mm tons)
(1) LTM EBITDA includes $57.0 million (Q1 2017 LTM EBITDA) + $3.5 million (expected new building river tanker annual EBITDA) + $35.0 million (expected annual
EBITDA from 4 million tons minimum guaranteed quantity of Vale contract) + $15.0 million (expected annual EBITDA from 2 million tons additional quantity of Vale
contract) + $35.0 million expected annual EBITDA at full iron ore port capacity utilization
95 110
145
LTM EBITDA+Vale MinimumGuaranteed
Quantity (4 mmtons)
LTMEBITDA+FullVale contract(6mm tons)
LTM EBITDA +Year 1-full iron
ore port capacity(10 mm tons)
+16%
+53%
NSAL Pro-Forma EBITDA(1) NSAL Pro-Forma Net Debt/EBITDA(1)
Vale Transshipment Contract
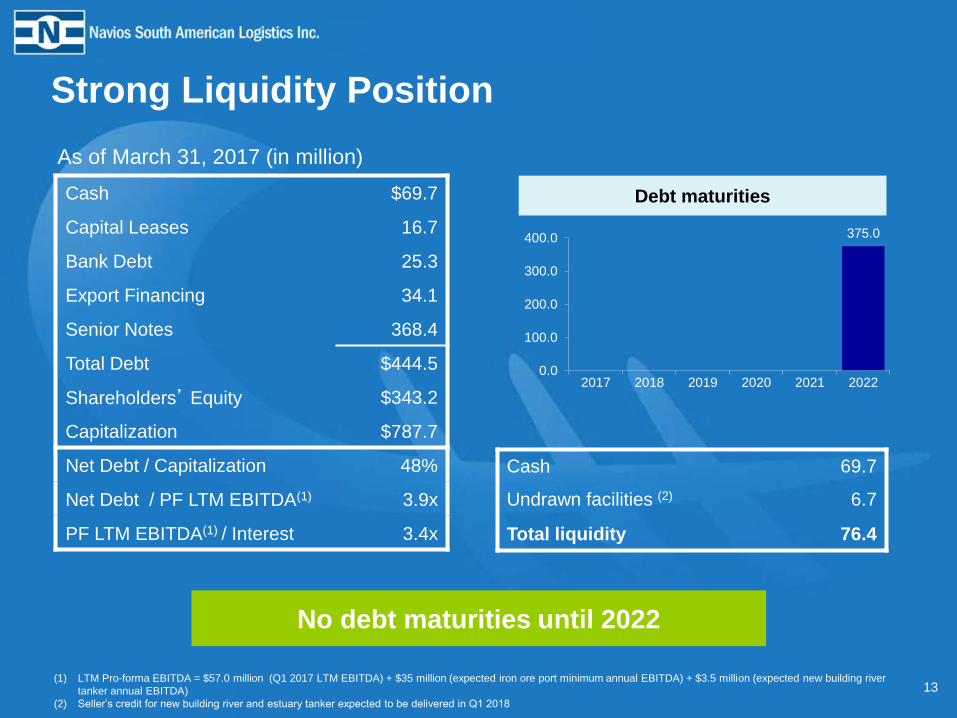
Strong Liquidity Position
13
375.0
0.0
100.0
200.0
300.0
400.0
2017 2018 2019 2020 2021 2022
Debt maturities Cash $69.7
Capital Leases 16.7
Bank Debt 25.3
Export Financing 34.1
Senior Notes 368.4
Total Debt $444.5
Shareholders’ Equity $343.2
Capitalization $787.7
Net Debt / Capitalization 48%
Net Debt / PF LTM EBITDA(1) 3.9x
PF LTM EBITDA(1) / Interest 3.4x
As of March 31, 2017 (in million)
Cash 69.7
Undrawn facilities (2) 6.7
Total liquidity 76.4
No debt maturities until 2022
(1) LTM Pro-forma EBITDA = $57.0 million (Q1 2017 LTM EBITDA) + $35 million (expected iron ore port minimum annual EBITDA) + $3.5 million (expected new building river
tanker annual EBITDA)
(2) Seller’s credit for new building river and estuary tanker expected to be delivered in Q1 2018
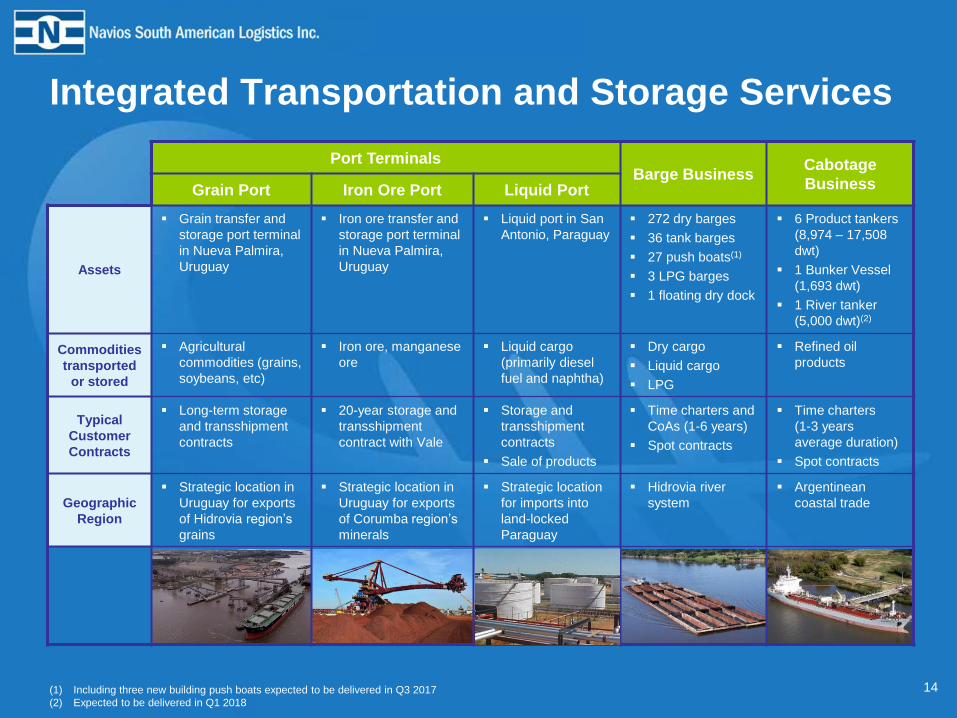
Integrated Transportation and Storage Services
Port Terminals Barge Business
Cabotage
Business Grain Port Iron Ore Port Liquid Port
Assets
Grain transfer and
storage port terminal
in Nueva Palmira,
Uruguay
Iron ore transfer and
storage port terminal
in Nueva Palmira,
Uruguay
Liquid port in San
Antonio, Paraguay
272 dry barges
36 tank barges
27 push boats(1)
3 LPG barges
1 floating dry dock
6 Product tankers
(8,974 – 17,508
dwt)
1 Bunker Vessel
(1,693 dwt)
1 River tanker
(5,000 dwt)(2)
Commodities
transported
or stored
Agricultural
commodities (grains,
soybeans, etc)
Iron ore, manganese
ore
Liquid cargo
(primarily diesel
fuel and naphtha)
Dry cargo
Liquid cargo
LPG
Refined oil
products
Typical
Customer
Contracts
Long-term storage
and transshipment
contracts
20-year storage and
transshipment
contract with Vale
Storage and
transshipment
contracts
Sale of products
Time charters and
CoAs (1-6 years)
Spot contracts
Time charters
(1-3 years
average duration)
Spot contracts
Geographic
Region
Strategic location in
Uruguay for exports
of Hidrovia region’s
grains
Strategic location in
Uruguay for exports
of Corumba region’s
minerals
Strategic location
for imports into
land-locked
Paraguay
Hidrovia river
system
Argentinean
coastal trade
14 (1) Including three new building push boats expected to be delivered in Q3 2017
(2) Expected to be delivered in Q1 2018
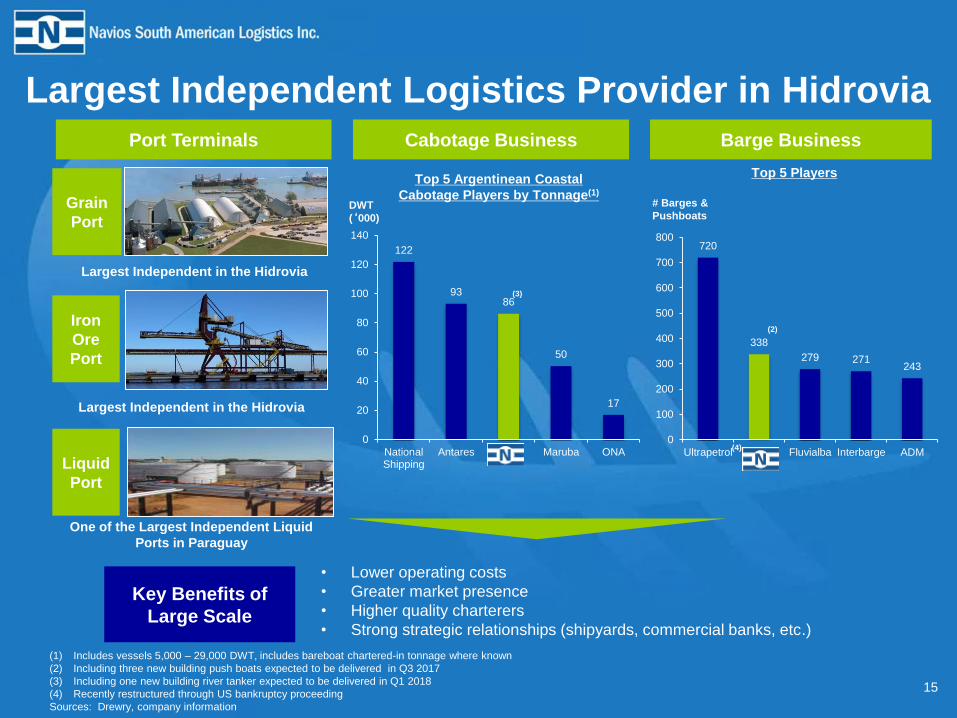
# Barges &
Pushboats
Largest Independent in the Hidrovia
One of the Largest Independent Liquid
Ports in Paraguay
• Lower operating costs
• Greater market presence
• Higher quality charterers
• Strong strategic relationships (shipyards, commercial banks, etc.)
DWT
(‘000)
Top 5 Players Top 5 Argentinean Coastal
Cabotage Players by Tonnage(1)
Largest Independent Logistics Provider in Hidrovia
15
720
338
279 271 243
0
100
200
300
400
500
600
700
800
Ultrapetrol NSAL Fluvialba Interbarge ADM
(2)
Port Terminals Barge Business Cabotage Business
Key Benefits of
Large Scale
122
93 86
50
17
0
20
40
60
80
100
120
140
NationalShipping
Antares NSAL Maruba ONA
(3)
(1) Includes vessels 5,000 – 29,000 DWT, includes bareboat chartered-in tonnage where known
(2) Including three new building push boats expected to be delivered in Q3 2017
(3) Including one new building river tanker expected to be delivered in Q1 2018
(4) Recently restructured through US bankruptcy proceeding
Sources: Drewry, company information
Largest Independent in the Hidrovia
(4)
Grain
Port
Iron
Ore
Port
Liquid
Port
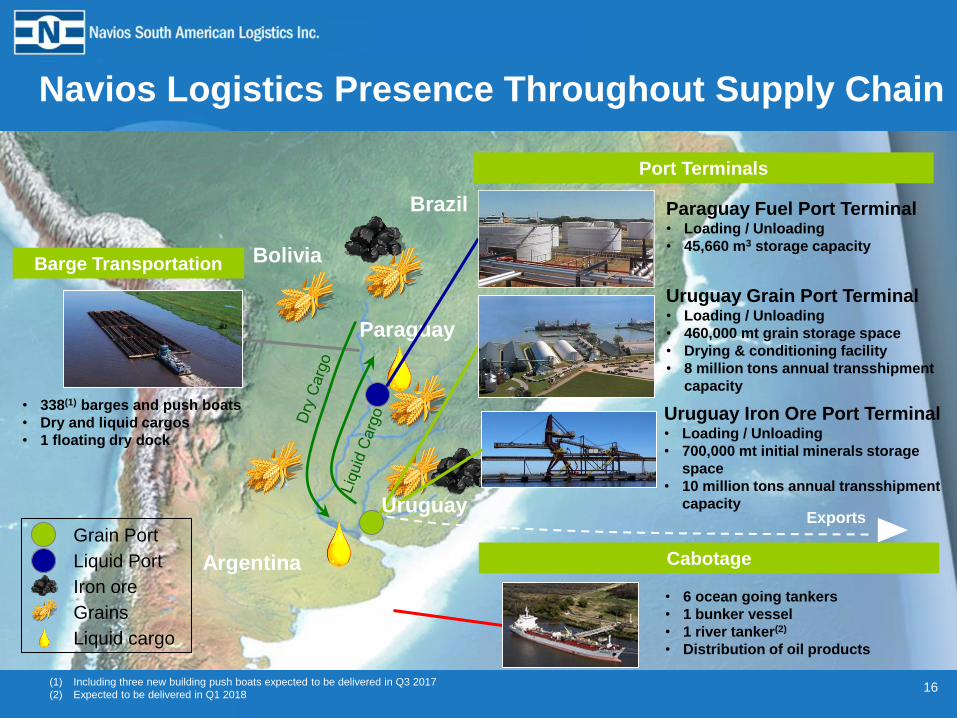
Navios Logistics Presence Throughout Supply Chain
16
Argentina
Paraguay
Brazil
Bolivia
Iron ore
Grains
Liquid cargo
Grain Port
Liquid Port
Paraguay Fuel Port Terminal • Loading / Unloading
• 45,660 m3 storage capacity
Uruguay Grain Port Terminal • Loading / Unloading
• 460,000 mt grain storage space
• Drying & conditioning facility
• 8 million tons annual transshipment
capacity
• 6 ocean going tankers
• 1 bunker vessel
• 1 river tanker(2)
• Distribution of oil products
• 338(1) barges and push boats
• Dry and liquid cargos
• 1 floating dry dock
Exports
(1) Including three new building push boats expected to be delivered in Q3 2017
(2) Expected to be delivered in Q1 2018
Uruguay Iron Ore Port Terminal • Loading / Unloading
• 700,000 mt initial minerals storage
space
• 10 million tons annual transshipment
capacity Uruguay
Port Terminals
Cabotage
Barge Transportation
17
The New Iron Ore Terminal
18
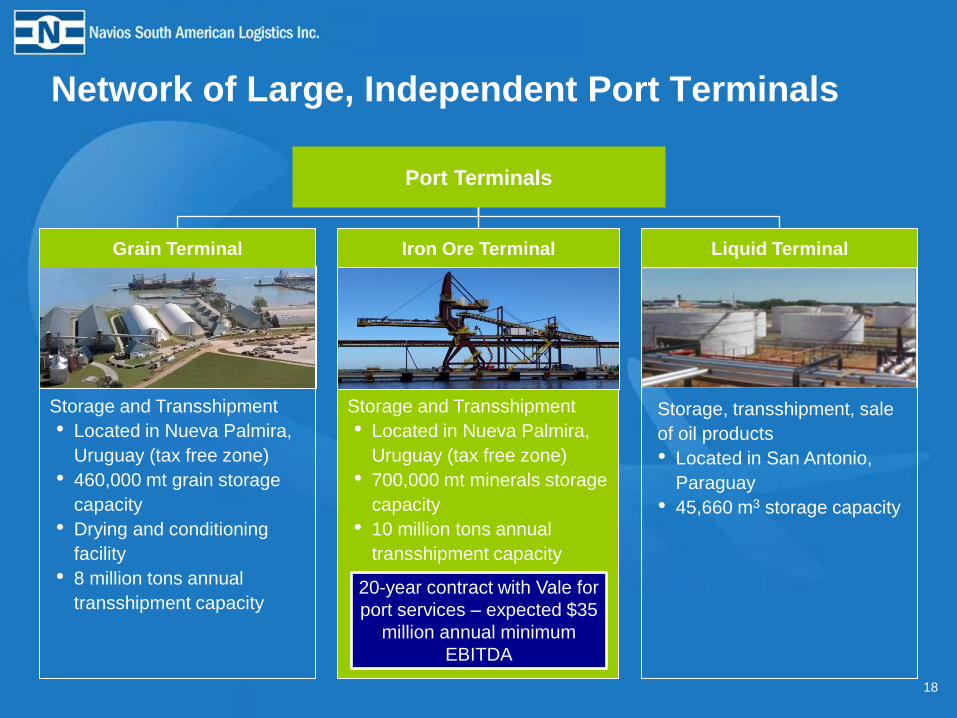
Network of Large, Independent Port Terminals
Grain Terminal
Storage and Transshipment
• Located in Nueva Palmira,
Uruguay (tax free zone)
• 460,000 mt grain storage
capacity
• Drying and conditioning
facility
• 8 million tons annual
transshipment capacity
Iron Ore Terminal Liquid Terminal
Storage, transshipment, sale
of oil products
• Located in San Antonio,
Paraguay
• 45,660 m3 storage capacity
Port Terminals
Storage and Transshipment
• Located in Nueva Palmira,
Uruguay (tax free zone)
• 700,000 mt minerals storage
capacity
• 10 million tons annual
transshipment capacity
20-year contract with Vale for
port services – expected $35
million annual minimum
EBITDA
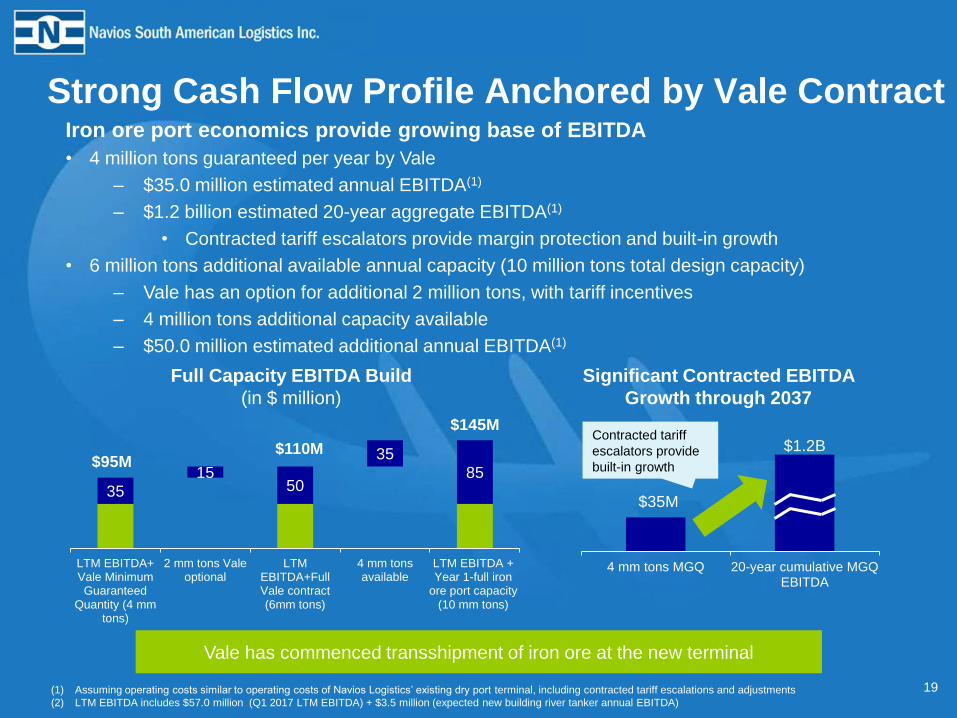
Strong Cash Flow Profile Anchored by Vale Contract Iron ore port economics provide growing base of EBITDA
• 4 million tons guaranteed per year by Vale
– $35.0 million estimated annual EBITDA(1)
– $1.2 billion estimated 20-year aggregate EBITDA(1)
• Contracted tariff escalators provide margin protection and built-in growth
• 6 million tons additional available annual capacity (10 million tons total design capacity)
– Vale has an option for additional 2 million tons, with tariff incentives
– 4 million tons additional capacity available
– $50.0 million estimated additional annual EBITDA(1)
(1) Assuming operating costs similar to operating costs of Navios Logistics’ existing dry port terminal, including contracted tariff escalations and adjustments
(2) LTM EBITDA includes $57.0 million (Q1 2017 LTM EBITDA) + $3.5 million (expected new building river tanker annual EBITDA)
19
35 15
50
35 85
LTM EBITDA+Vale MinimumGuaranteed
Quantity (4 mmtons)
2 mm tons Valeoptional
LTMEBITDA+FullVale contract(6mm tons)
4 mm tonsavailable
LTM EBITDA +Year 1-full iron
ore port capacity(10 mm tons)
4 mm tons MGQ 20-year cumulative MGQEBITDA
$35M
$1.2B
Full Capacity EBITDA Build
(in $ million)
Significant Contracted EBITDA
Growth through 2037
Contracted tariff
escalators provide
built-in growth
Vale has commenced transshipment of iron ore at the new terminal
$95M
$145M
$110M
20
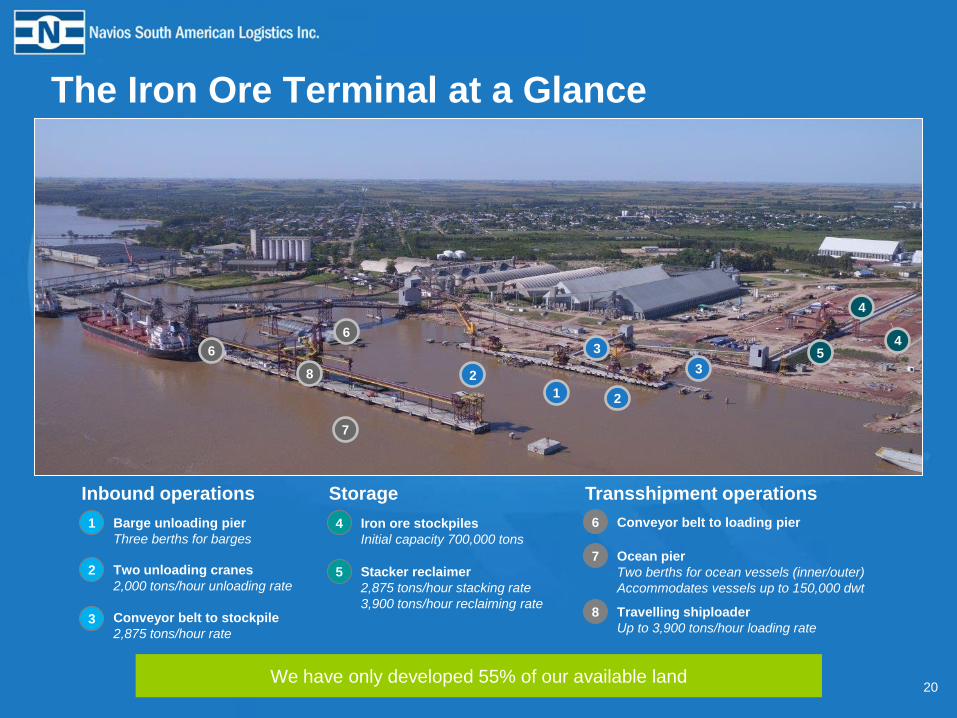
The Iron Ore Terminal at a Glance
1 Barge unloading pier
Three berths for barges
Inbound operations
2 Two unloading cranes
2,000 tons/hour unloading rate
3 Conveyor belt to stockpile
2,875 tons/hour rate
4 Iron ore stockpiles
Initial capacity 700,000 tons
Storage
5 Stacker reclaimer
2,875 tons/hour stacking rate
3,900 tons/hour reclaiming rate
6 Conveyor belt to loading pier
Transshipment operations
7 Ocean pier
Two berths for ocean vessels (inner/outer)
Accommodates vessels up to 150,000 dwt
8 Travelling shiploader
Up to 3,900 tons/hour loading rate
1
3
2
2
3
4
5
6
6
7
8
4
We have only developed 55% of our available land
21
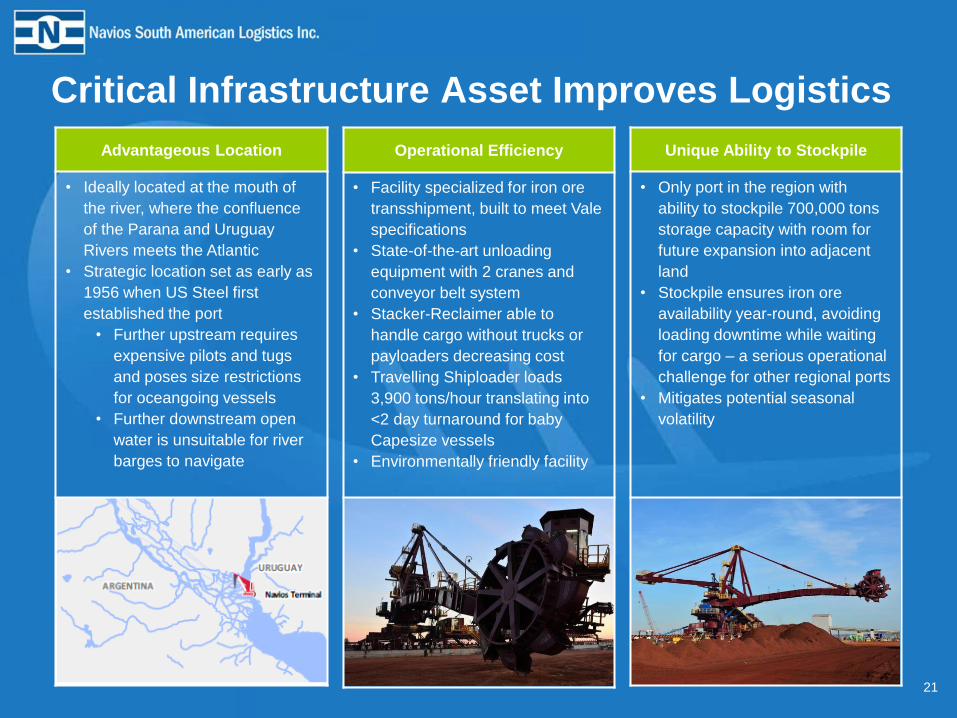
Critical Infrastructure Asset Improves Logistics
Advantageous Location
• Ideally located at the mouth of
the river, where the confluence
of the Parana and Uruguay
Rivers meets the Atlantic
• Strategic location set as early as
1956 when US Steel first
established the port
• Further upstream requires
expensive pilots and tugs
and poses size restrictions
for oceangoing vessels
• Further downstream open
water is unsuitable for river
barges to navigate
Operational Efficiency
• Facility specialized for iron ore
transshipment, built to meet Vale
specifications
• State-of-the-art unloading
equipment with 2 cranes and
conveyor belt system
• Stacker-Reclaimer able to
handle cargo without trucks or
payloaders decreasing cost
• Travelling Shiploader loads
3,900 tons/hour translating into
<2 day turnaround for baby
Capesize vessels
• Environmentally friendly facility
Unique Ability to Stockpile
• Only port in the region with
ability to stockpile 700,000 tons
storage capacity with room for
future expansion into adjacent
land
• Stockpile ensures iron ore
availability year-round, avoiding
loading downtime while waiting
for cargo – a serious operational
challenge for other regional ports
• Mitigates potential seasonal
volatility
22
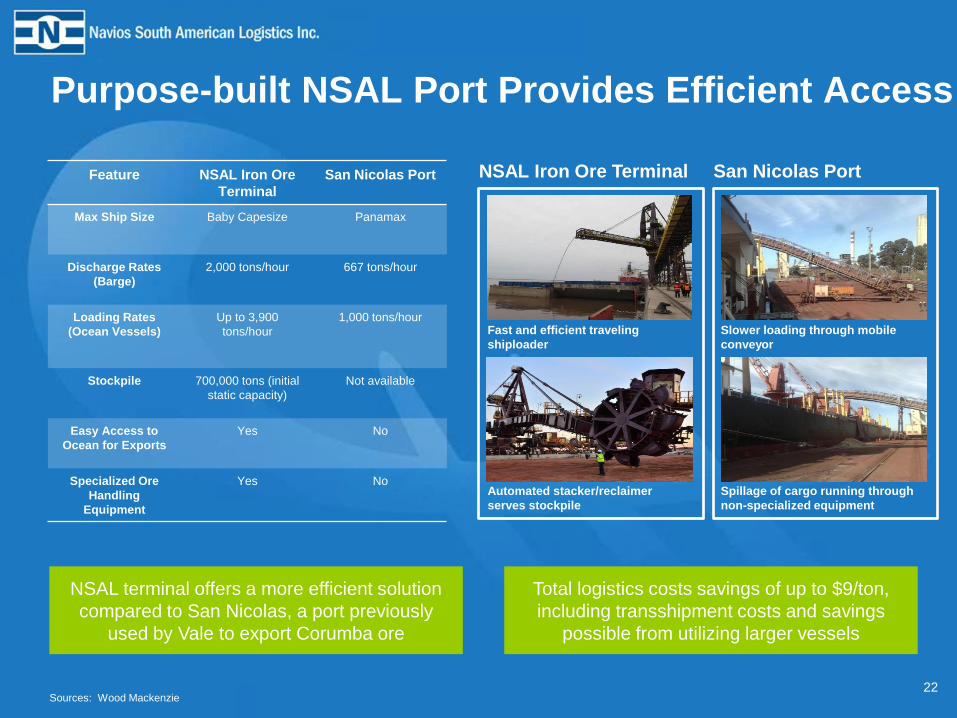
Purpose-built NSAL Port Provides Efficient Access
NSAL Iron Ore Terminal San Nicolas Port
Fast and efficient traveling
shiploader
Slower loading through mobile
conveyor
Automated stacker/reclaimer
serves stockpile
Spillage of cargo running through
non-specialized equipment
Feature NSAL Iron Ore
Terminal
San Nicolas Port
Max Ship Size Baby Capesize Panamax
Discharge Rates
(Barge)
2,000 tons/hour 667 tons/hour
Loading Rates
(Ocean Vessels)
Up to 3,900
tons/hour
1,000 tons/hour
Stockpile 700,000 tons (initial
static capacity)
Not available
Easy Access to
Ocean for Exports
Yes No
Specialized Ore
Handling
Equipment
Yes No
NSAL terminal offers a more efficient solution
compared to San Nicolas, a port previously
used by Vale to export Corumba ore
Total logistics costs savings of up to $9/ton,
including transshipment costs and savings
possible from utilizing larger vessels
Sources: Wood Mackenzie

23
Corumba Price Premium and Improved Logistics
Support Production Growth
High quality iron ore commands price premium
• The region’s mines produce lump ore of exceptional
quality in terms of Fe grade and trace elements
• The Corumbá mines ore quality matches demand
growth trends, especially in higher growth Direct
Reduced Iron (DRI) applications
• Price premium of high grade ore expected to grow
further over time given the geological erosion of
seaborne iron ore serving Asian markets
45.7
24.7
70.4
$/ton
Significant price
premium for 67% Fe
Corumba Lump Ore
Sinter Fines 62% Fe
FOB Price
Higher profitability supports production growth
• Corumba mine output is expected to rebound to
approximately 5 mm tons in the short term, and up to 10-
13mm tons by 2025
– Annual production was 5-8mm tons during 2010
to 2015
• The significant premium for Corumba lump ore provides
an attractive netback margin supporting regional
production volume growth
• The new purpose-built NSAL terminal improves export
logistics, further enhancing operational efficiency and
profitability for the Corumba mines
2016 FOB Price for Corumba Lump Ore
2016A 2017E-2018E 2019E-2020E 2025E
Corumba Mines Production Forecast (million tons per annum)
3.0 2.5-5.0
Up to
9.0-10.0
Up to
13.0-14.0
Sources: Wood Mackenzie
24
Market Overview
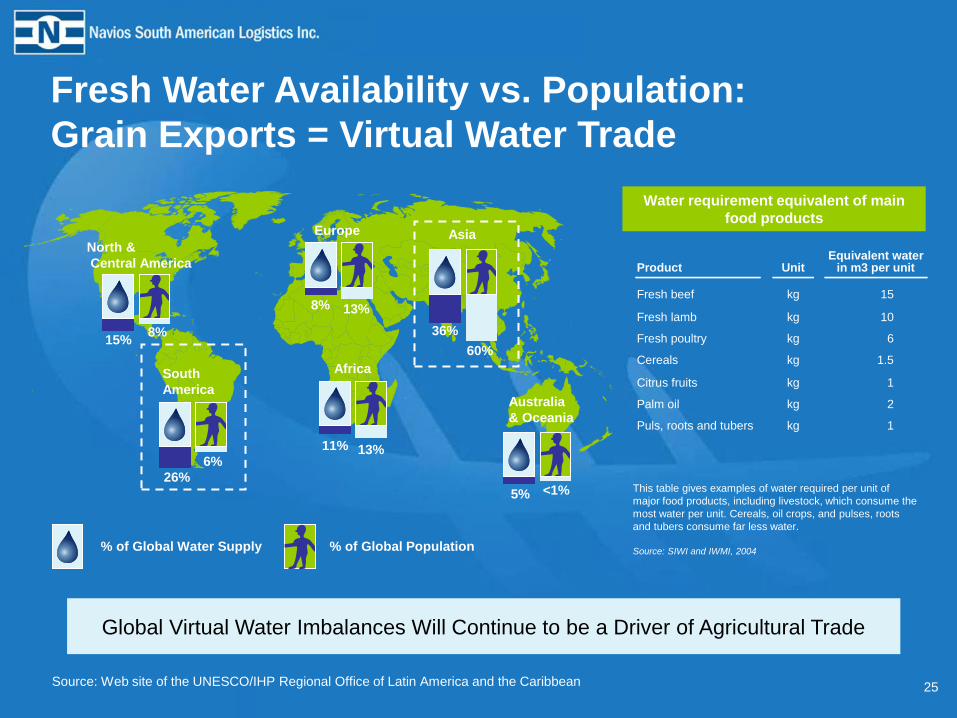
Source: Web site of the UNESCO/IHP Regional Office of Latin America and the Caribbean
Water requirement equivalent of main
food products
This table gives examples of water required per unit of
major food products, including livestock, which consume the
most water per unit. Cereals, oil crops, and pulses, roots
and tubers consume far less water.
Source: SIWI and IWMI, 2004
Product Unit Equivalent water
in m3 per unit
Fresh beef kg 15
Fresh lamb kg 10
Fresh poultry kg 6
Cereals kg 1.5
Citrus fruits kg 1
Palm oil kg 2
Puls, roots and tubers kg 1
North &
Central America
Africa
Asia
South
America
Europe
15% 8%
26%
6%
11% 13%
8% 13%
36%
60%
5% <1%
Australia
& Oceania
% of Global Water Supply % of Global Population
Fresh Water Availability vs. Population:
Grain Exports = Virtual Water Trade
25
Global Virtual Water Imbalances Will Continue to be a Driver of Agricultural Trade
26
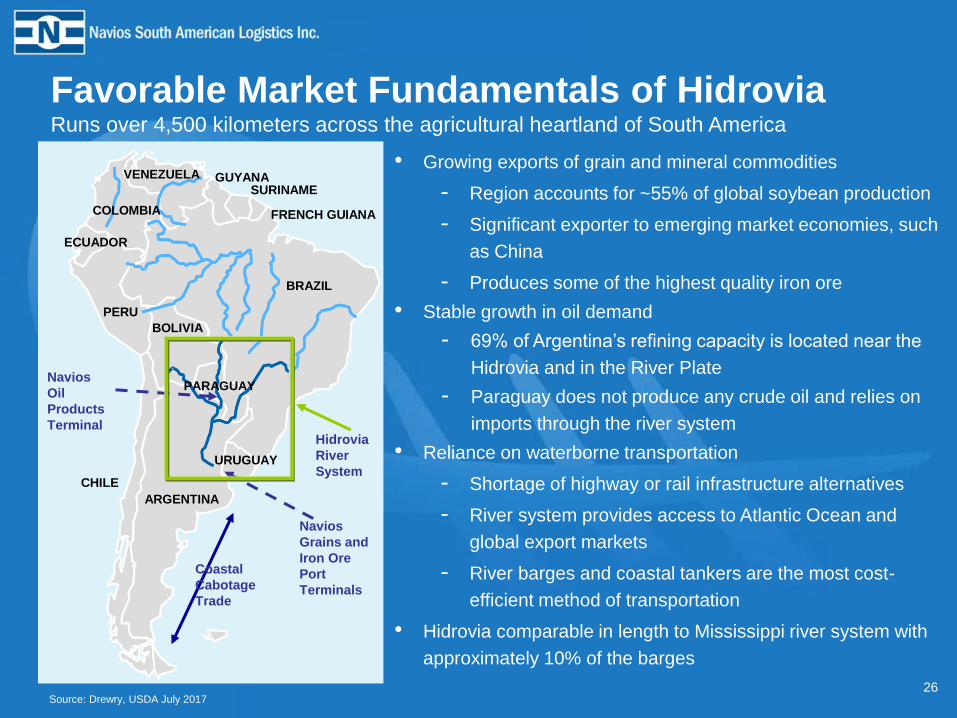
Favorable Market Fundamentals of Hidrovia Runs over 4,500 kilometers across the agricultural heartland of South America
VENEZUELA
BOLIVIA
ARGENTINA
BRAZIL
FRENCH GUIANA
SURINAMEGUYANA
COLOMBIA
ECUADOR
PERU
PARAGUAY
URUGUAY
CHILE
VENEZUELA
BOLIVIA
ARGENTINA
BRAZIL
FRENCH GUIANA
SURINAMEGUYANA
COLOMBIA
ECUADOR
PERU
PARAGUAY
URUGUAY
CHILE
• Growing exports of grain and mineral commodities
- Region accounts for ~55% of global soybean production
- Significant exporter to emerging market economies, such
as China
- Produces some of the highest quality iron ore
• Stable growth in oil demand
- 69% of Argentina’s refining capacity is located near the
Hidrovia and in the River Plate
- Paraguay does not produce any crude oil and relies on
imports through the river system
• Reliance on waterborne transportation
- Shortage of highway or rail infrastructure alternatives
- River system provides access to Atlantic Ocean and
global export markets
- River barges and coastal tankers are the most cost-
efficient method of transportation
• Hidrovia comparable in length to Mississippi river system with
approximately 10% of the barges
Coastal
Cabotage
Trade
Navios
Oil
Products
Terminal
Navios
Grains and
Iron Ore
Port
Terminals
Hidrovia
River
System
Source: Drewry, USDA July 2017
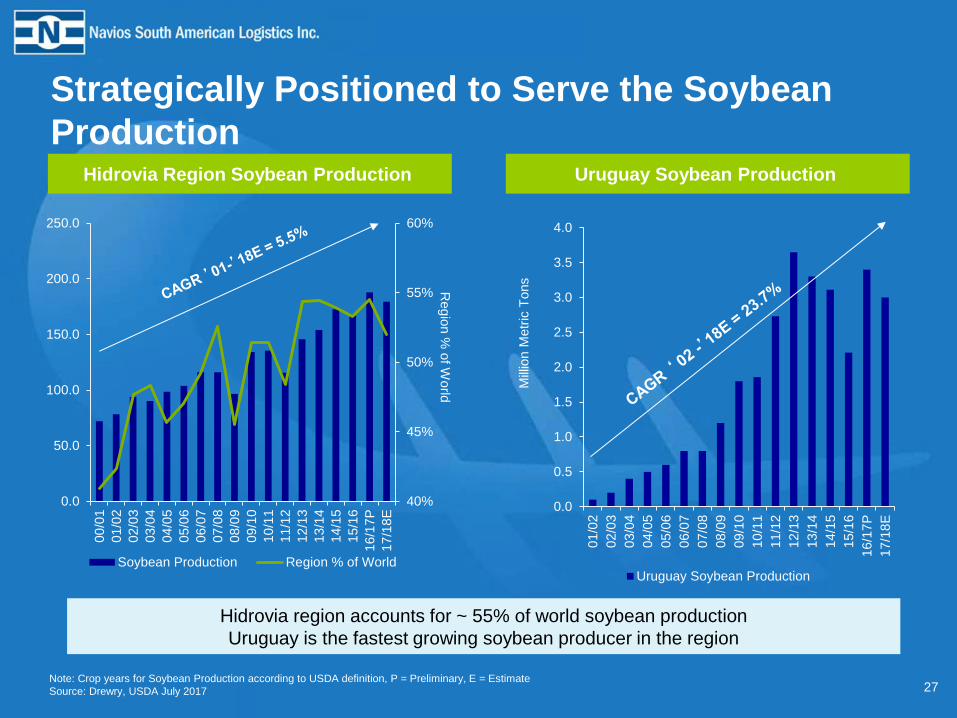
Strategically Positioned to Serve the Soybean
Production
27 Note: Crop years for Soybean Production according to USDA definition, P = Preliminary, E = Estimate
Source: Drewry, USDA July 2017
0.0
0.5
1.0
1.5
2.0
2.5
3.0
3.5
4.0
01
/02
02
/03
03
/04
04
/05
05
/06
06
/07
07
/08
08
/09
09
/10
10
/11
11
/12
12
/13
13
/14
14
/15
15
/16
16
/17
P
17
/18
E
Uruguay Soybean Production
Mill
ion M
etr
ic T
ons
Regio
n %
of W
orld
40%
45%
50%
55%
60%
0.0
50.0
100.0
150.0
200.0
250.0
00
/01
01
/02
02
/03
03
/04
04
/05
05
/06
06
/07
07
/08
08
/09
09
/10
10
/11
11
/12
12
/13
13
/14
14
/15
15
/16
16
/17
P
17
/18
E
Soybean Production Region % of World
Hidrovia Region Soybean Production Uruguay Soybean Production
Hidrovia region accounts for ~ 55% of world soybean production
Uruguay is the fastest growing soybean producer in the region
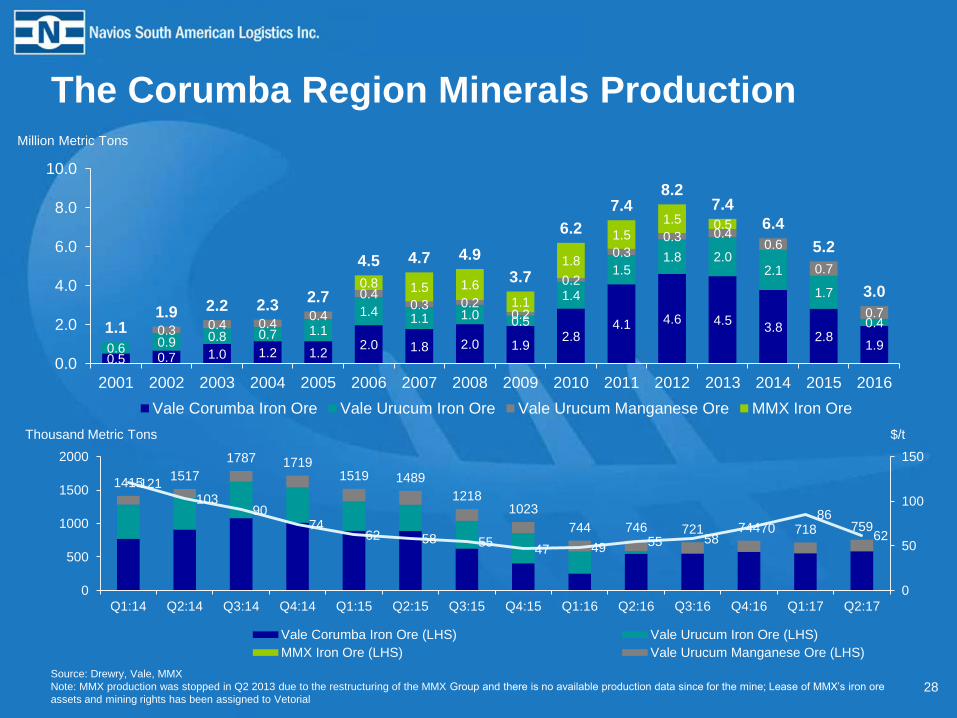
The Corumba Region Minerals Production
28
1415 1517
1787 1719 1519 1489
1218 1023
744 746 721 744 718 759
121
103 90
74 62 58 55
47 49 55 58 70
86
62
0
50
100
150
0
500
1000
1500
2000
Q1:14 Q2:14 Q3:14 Q4:14 Q1:15 Q2:15 Q3:15 Q4:15 Q1:16 Q2:16 Q3:16 Q4:16 Q1:17 Q2:17
Vale Corumba Iron Ore (LHS) Vale Urucum Iron Ore (LHS)
MMX Iron Ore (LHS) Vale Urucum Manganese Ore (LHS)
Million Metric Tons
Thousand Metric Tons
0.5 0.7 1.0 1.2 1.2 2.0 1.8 2.0 1.9
2.8 4.1 4.6 4.5
3.8 2.8
1.9 0.6 0.9 0.8 0.7 1.1
1.4 1.1 1.0
0.5
1.4
1.5 1.8 2.0
2.1
1.7
0.4 0.3 0.4 0.4
0.4
0.4 0.3 0.2
0.2
0.2
0.3
0.3 0.4 0.6
0.7
0.7
0.8 1.5 1.6
1.1
1.8
1.5
1.5 0.5
1.1 1.9 2.2 2.3
2.7
4.5 4.7 4.9
3.7
6.2
7.4 8.2
7.4
6.4
5.2
3.0
0.0
2.0
4.0
6.0
8.0
10.0
2001 2002 2003 2004 2005 2006 2007 2008 2009 2010 2011 2012 2013 2014 2015 2016
Vale Corumba Iron Ore Vale Urucum Iron Ore Vale Urucum Manganese Ore MMX Iron Ore
$/t
Source: Drewry, Vale, MMX
Note: MMX production was stopped in Q2 2013 due to the restructuring of the MMX Group and there is no available production data since for the mine; Lease of MMX’s iron ore
assets and mining rights has been assigned to Vetorial
2000 2001 2002 2003 2004 2005 2006 2007 2008 2009 2010 2011 2012 2013 2014 2015 2016P
Argentina Bolivia Brazil Paraguay Uruguay
29
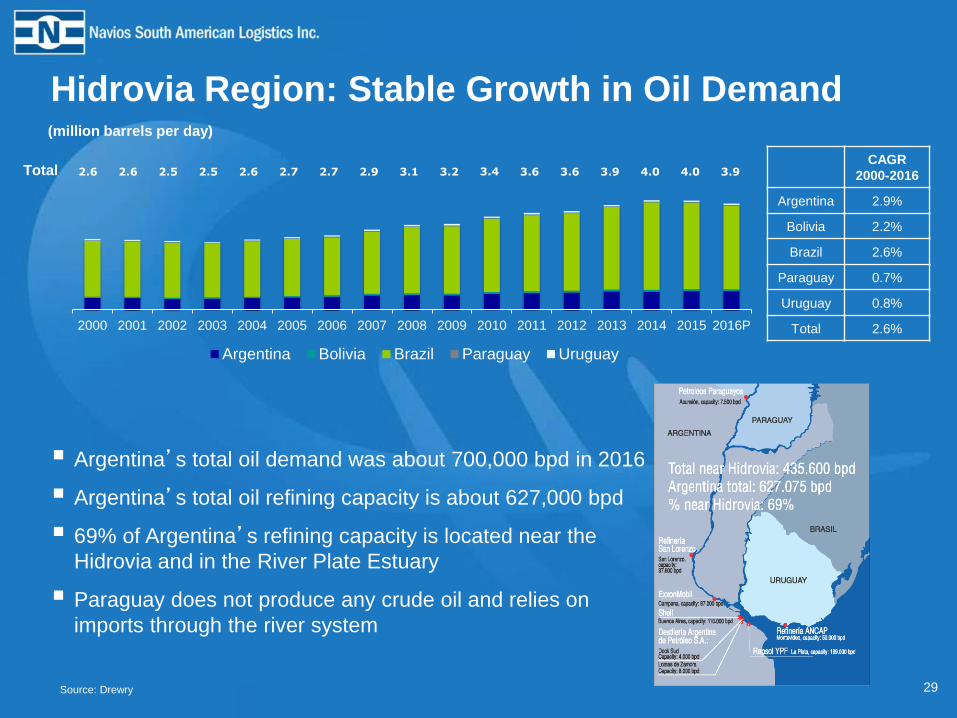
(million barrels per day)
Argentina’s total oil demand was about 700,000 bpd in 2016
Argentina’s total oil refining capacity is about 627,000 bpd
69% of Argentina’s refining capacity is located near the
Hidrovia and in the River Plate Estuary
Paraguay does not produce any crude oil and relies on
imports through the river system
2.6 2.6 2.5 2.5 2.6 2.7 2.7 2.9 3.1 3.2
CAGR
2000-2016
Argentina 2.9%
Bolivia 2.2%
Brazil 2.6%
Paraguay 0.7%
Uruguay 0.8%
Total 2.6%
Total
Hidrovia Region: Stable Growth in Oil Demand
3.6
Source: Drewry
3.6 3.4 3.9 4.0 4.0 3.9
30
Q1 2017 Financial Highlights
31
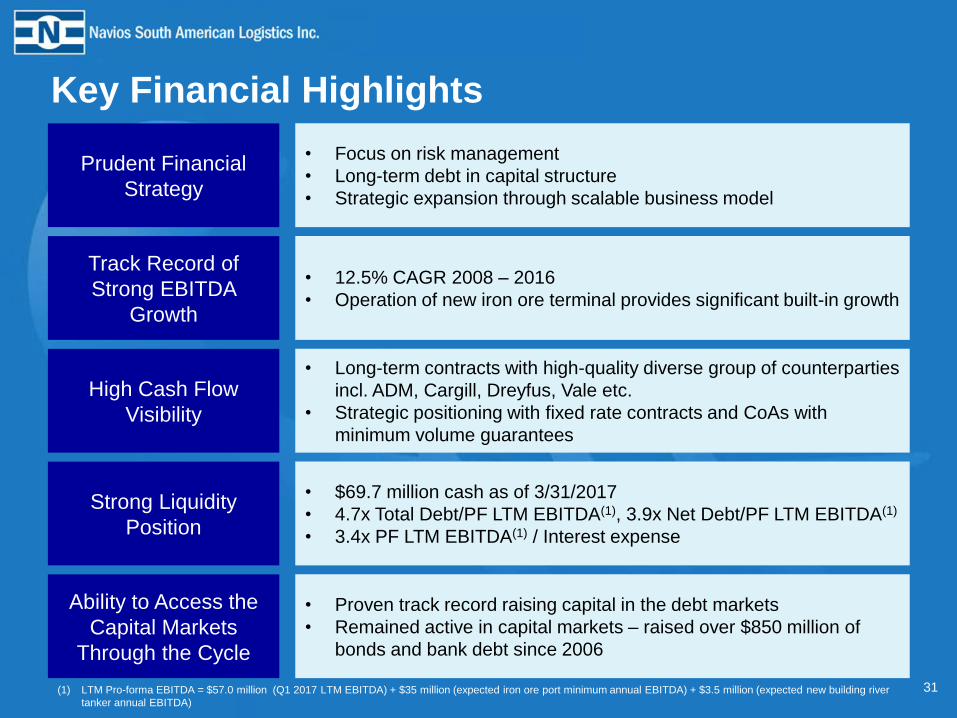
Key Financial Highlights
Prudent Financial
Strategy
Track Record of
Strong EBITDA
Growth
High Cash Flow
Visibility
Strong Liquidity
Position
Ability to Access the
Capital Markets
Through the Cycle
• Focus on risk management
• Long-term debt in capital structure
• Strategic expansion through scalable business model
• 12.5% CAGR 2008 – 2016
• Operation of new iron ore terminal provides significant built-in growth
• Long-term contracts with high-quality diverse group of counterparties
incl. ADM, Cargill, Dreyfus, Vale etc.
• Strategic positioning with fixed rate contracts and CoAs with
minimum volume guarantees
• $69.7 million cash as of 3/31/2017
• 4.7x Total Debt/PF LTM EBITDA(1), 3.9x Net Debt/PF LTM EBITDA(1)
• 3.4x PF LTM EBITDA(1) / Interest expense
• Proven track record raising capital in the debt markets
• Remained active in capital markets – raised over $850 million of
bonds and bank debt since 2006
(1) LTM Pro-forma EBITDA = $57.0 million (Q1 2017 LTM EBITDA) + $35 million (expected iron ore port minimum annual EBITDA) + $3.5 million (expected new building river
tanker annual EBITDA)
32
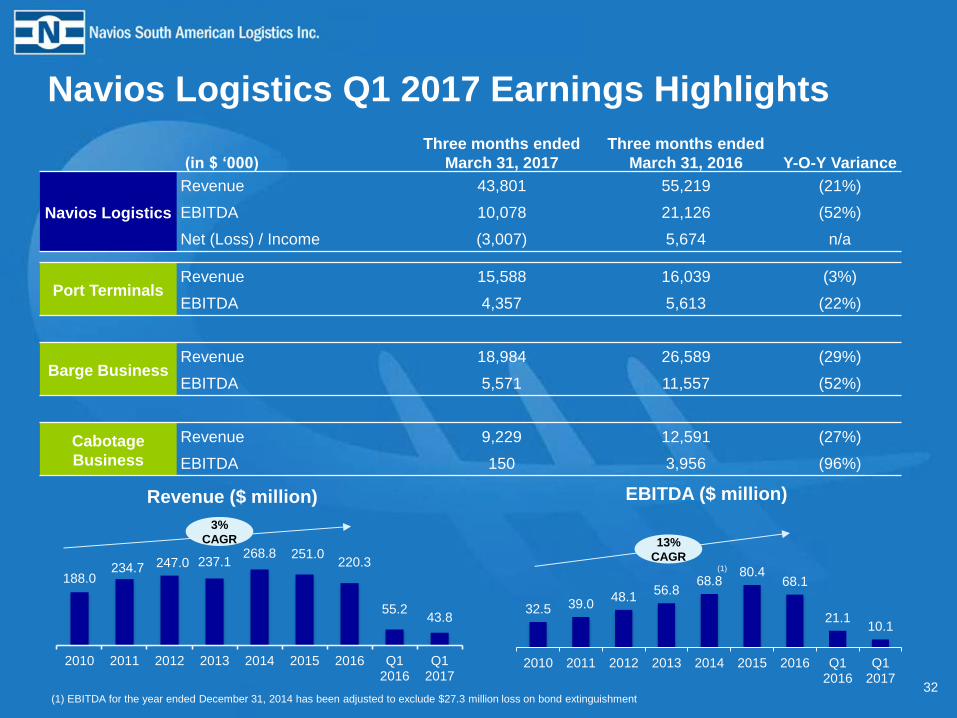
Navios Logistics Q1 2017 Earnings Highlights
(in $ ‘000)
Three months ended
March 31, 2017
Three months ended
March 31, 2016 Y-O-Y Variance
Navios Logistics
Revenue 43,801 55,219 (21%)
EBITDA 10,078 21,126 (52%)
Net (Loss) / Income (3,007) 5,674 n/a
Port Terminals Revenue 15,588 16,039 (3%)
EBITDA 4,357 5,613 (22%)
Barge Business Revenue 18,984 26,589 (29%)
EBITDA 5,571 11,557 (52%)
Cabotage
Business
Revenue 9,229 12,591 (27%)
EBITDA 150 3,956 (96%)
188.0 234.7 247.0 237.1
268.8 251.0 220.3
55.2 43.8
2010 2011 2012 2013 2014 2015 2016 Q12016
Q12017
32.5 39.0 48.1
56.8 68.8
80.4 68.1
21.1 10.1
2010 2011 2012 2013 2014 2015 2016 Q12016
Q12017
3%
CAGR 13%
CAGR
EBITDA ($ million) Revenue ($ million)
(1) EBITDA for the year ended December 31, 2014 has been adjusted to exclude $27.3 million loss on bond extinguishment
(1)
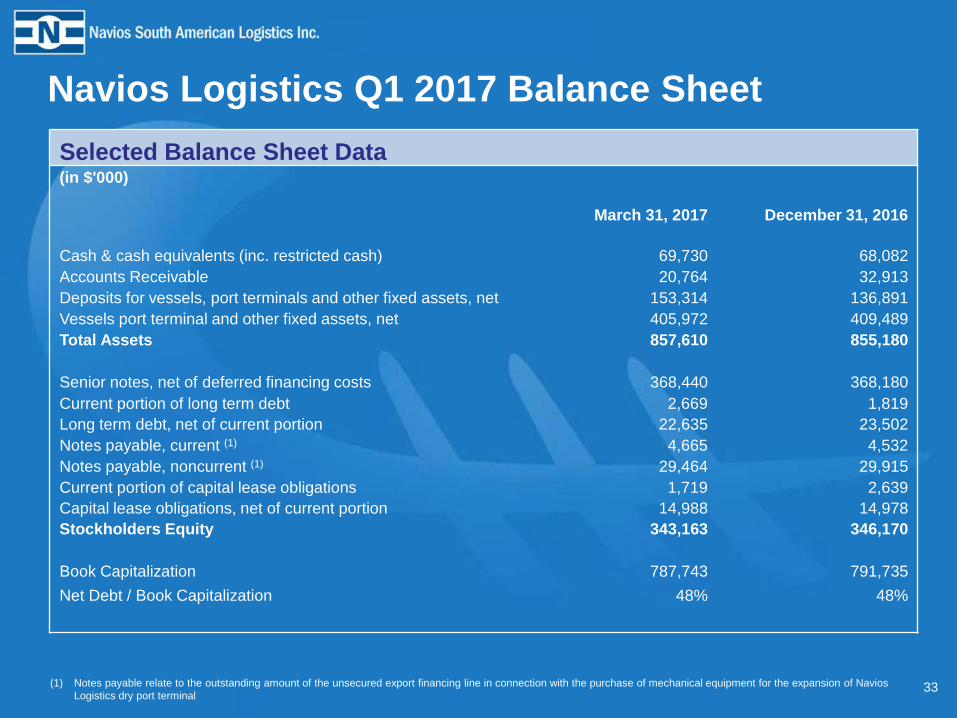
Navios Logistics Q1 2017 Balance Sheet
Selected Balance Sheet Data (in $'000)
March 31, 2017 December 31, 2016
Cash & cash equivalents (inc. restricted cash) 69,730 68,082
Accounts Receivable 20,764 32,913
Deposits for vessels, port terminals and other fixed assets, net 153,314 136,891
Vessels port terminal and other fixed assets, net 405,972 409,489
Total Assets 857,610 855,180
Senior notes, net of deferred financing costs 368,440 368,180
Current portion of long term debt 2,669 1,819
Long term debt, net of current portion 22,635 23,502
Notes payable, current (1) 4,665 4,532
Notes payable, noncurrent (1) 29,464 29,915
Current portion of capital lease obligations 1,719 2,639
Capital lease obligations, net of current portion 14,988 14,978
Stockholders Equity 343,163 346,170
Book Capitalization 787,743 791,735
Net Debt / Book Capitalization 48% 48%
(1) Notes payable relate to the outstanding amount of the unsecured export financing line in connection with the purchase of mechanical equipment for the expansion of Navios
Logistics dry port terminal
33
www.navioslogistics.com