Embed Size (px)
Citation preview
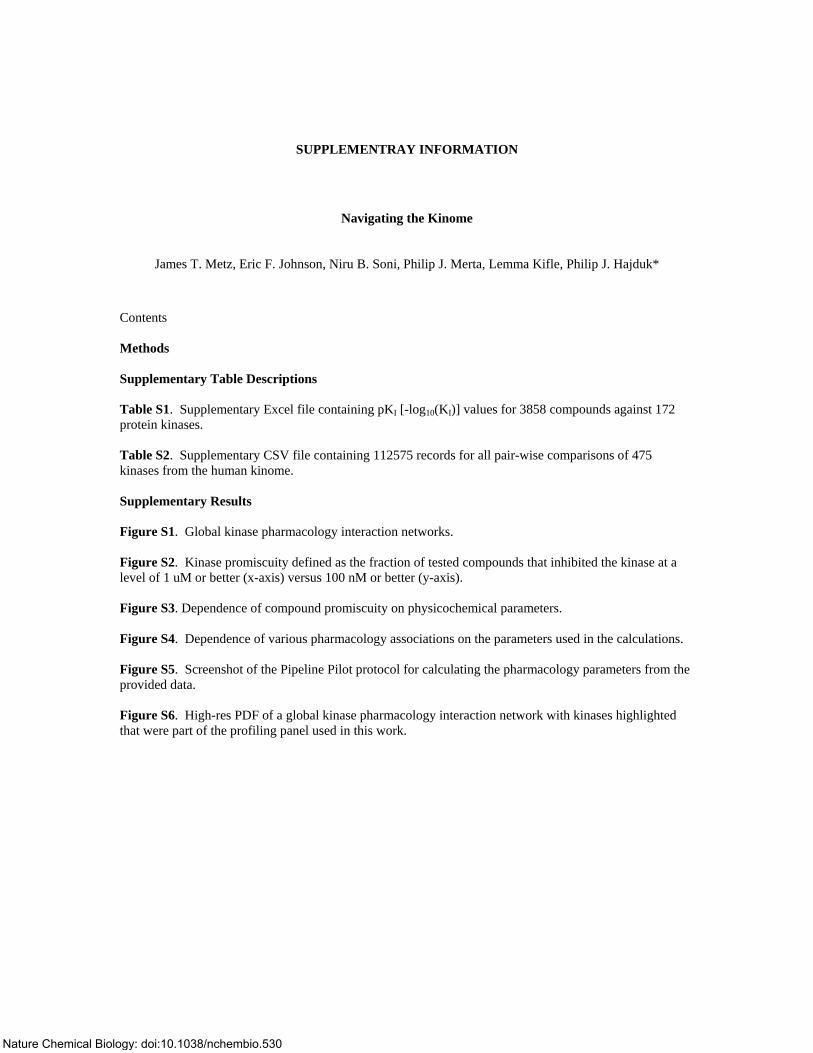
SUPPLEMENTRAY INFORMATION
Navigating the Kinome
James T. Metz, Eric F. Johnson, Niru B. Soni, Philip J. Merta, Lemma Kifle, Philip J. Hajduk*
Contents Methods Supplementary Table Descriptions Table S1. Supplementary Excel file containing pKI [-log10(KI)] values for 3858 compounds against 172 protein kinases. Table S2. Supplementary CSV file containing 112575 records for all pair-wise comparisons of 475 kinases from the human kinome. Supplementary Results Figure S1. Global kinase pharmacology interaction networks. Figure S2. Kinase promiscuity defined as the fraction of tested compounds that inhibited the kinase at a level of 1 uM or better (x-axis) versus 100 nM or better (y-axis). Figure S3. Dependence of compound promiscuity on physicochemical parameters. Figure S4. Dependence of various pharmacology associations on the parameters used in the calculations. Figure S5. Screenshot of the Pipeline Pilot protocol for calculating the pharmacology parameters from the provided data. Figure S6. High-res PDF of a global kinase pharmacology interaction network with kinases highlighted that were part of the profiling panel used in this work.
Nature Chemical Biology: doi:10.1038/nchembio.530
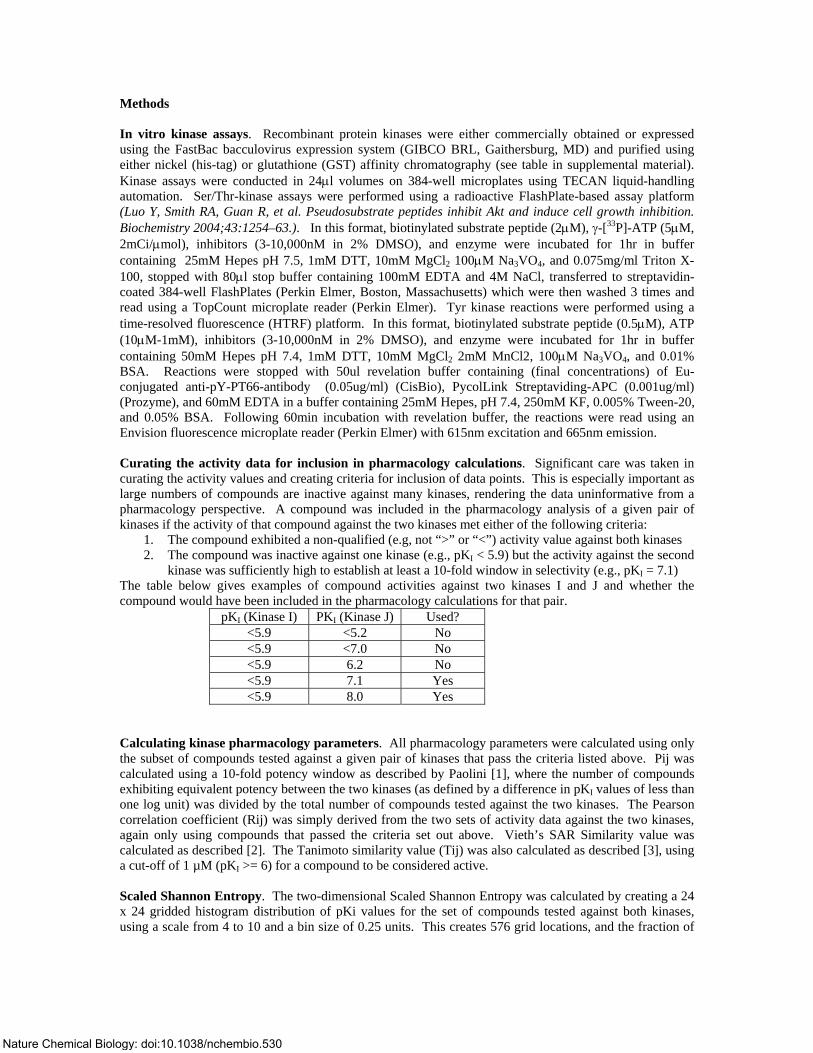
Methods In vitro kinase assays. Recombinant protein kinases were either commercially obtained or expressed using the FastBac bacculovirus expression system (GIBCO BRL, Gaithersburg, MD) and purified using either nickel (his-tag) or glutathione (GST) affinity chromatography (see table in supplemental material). Kinase assays were conducted in 24μl volumes on 384-well microplates using TECAN liquid-handling automation. Ser/Thr-kinase assays were performed using a radioactive FlashPlate-based assay platform (Luo Y, Smith RA, Guan R, et al. Pseudosubstrate peptides inhibit Akt and induce cell growth inhibition. Biochemistry 2004;43:1254–63.). In this format, biotinylated substrate peptide (2μM), γ-[33P]-ATP (5μM, 2mCi/μmol), inhibitors (3-10,000nM in 2% DMSO), and enzyme were incubated for 1hr in buffer containing 25mM Hepes pH 7.5, 1mM DTT, 10mM MgCl2 100μM Na3VO4, and 0.075mg/ml Triton X-100, stopped with 80μl stop buffer containing 100mM EDTA and 4M NaCl, transferred to streptavidin-coated 384-well FlashPlates (Perkin Elmer, Boston, Massachusetts) which were then washed 3 times and read using a TopCount microplate reader (Perkin Elmer). Tyr kinase reactions were performed using a time-resolved fluorescence (HTRF) platform. In this format, biotinylated substrate peptide (0.5μM), ATP (10μM-1mM), inhibitors (3-10,000nM in 2% DMSO), and enzyme were incubated for 1hr in buffer containing 50mM Hepes pH 7.4, 1mM DTT, 10mM MgCl2 2mM MnCl2, 100μM Na3VO4, and 0.01% BSA. Reactions were stopped with 50ul revelation buffer containing (final concentrations) of Eu-conjugated anti-pY-PT66-antibody (0.05ug/ml) (CisBio), PycolLink Streptaviding-APC (0.001ug/ml) (Prozyme), and 60mM EDTA in a buffer containing 25mM Hepes, pH 7.4, 250mM KF, 0.005% Tween-20, and 0.05% BSA. Following 60min incubation with revelation buffer, the reactions were read using an Envision fluorescence microplate reader (Perkin Elmer) with 615nm excitation and 665nm emission. Curating the activity data for inclusion in pharmacology calculations. Significant care was taken in curating the activity values and creating criteria for inclusion of data points. This is especially important as large numbers of compounds are inactive against many kinases, rendering the data uninformative from a pharmacology perspective. A compound was included in the pharmacology analysis of a given pair of kinases if the activity of that compound against the two kinases met either of the following criteria:
1. The compound exhibited a non-qualified (e.g, not “>” or “<”) activity value against both kinases 2. The compound was inactive against one kinase (e.g., pKI < 5.9) but the activity against the second
kinase was sufficiently high to establish at least a 10-fold window in selectivity (e.g., pKI = 7.1) The table below gives examples of compound activities against two kinases I and J and whether the compound would have been included in the pharmacology calculations for that pair.
pKI (Kinase I) PKI (Kinase J) Used? <5.9 <5.2 No <5.9 <7.0 No <5.9 6.2 No <5.9 7.1 Yes <5.9 8.0 Yes
Calculating kinase pharmacology parameters. All pharmacology parameters were calculated using only the subset of compounds tested against a given pair of kinases that pass the criteria listed above. Pij was calculated using a 10-fold potency window as described by Paolini [1], where the number of compounds exhibiting equivalent potency between the two kinases (as defined by a difference in pKI values of less than one log unit) was divided by the total number of compounds tested against the two kinases. The Pearson correlation coefficient (Rij) was simply derived from the two sets of activity data against the two kinases, again only using compounds that passed the criteria set out above. Vieth’s SAR Similarity value was calculated as described [2]. The Tanimoto similarity value (Tij) was also calculated as described [3], using a cut-off of 1 µM (pKI >= 6) for a compound to be considered active. Scaled Shannon Entropy. The two-dimensional Scaled Shannon Entropy was calculated by creating a 24 x 24 gridded histogram distribution of pKi values for the set of compounds tested against both kinases, using a scale from 4 to 10 and a bin size of 0.25 units. This creates 576 grid locations, and the fraction of
Nature Chemical Biology: doi:10.1038/nchembio.530
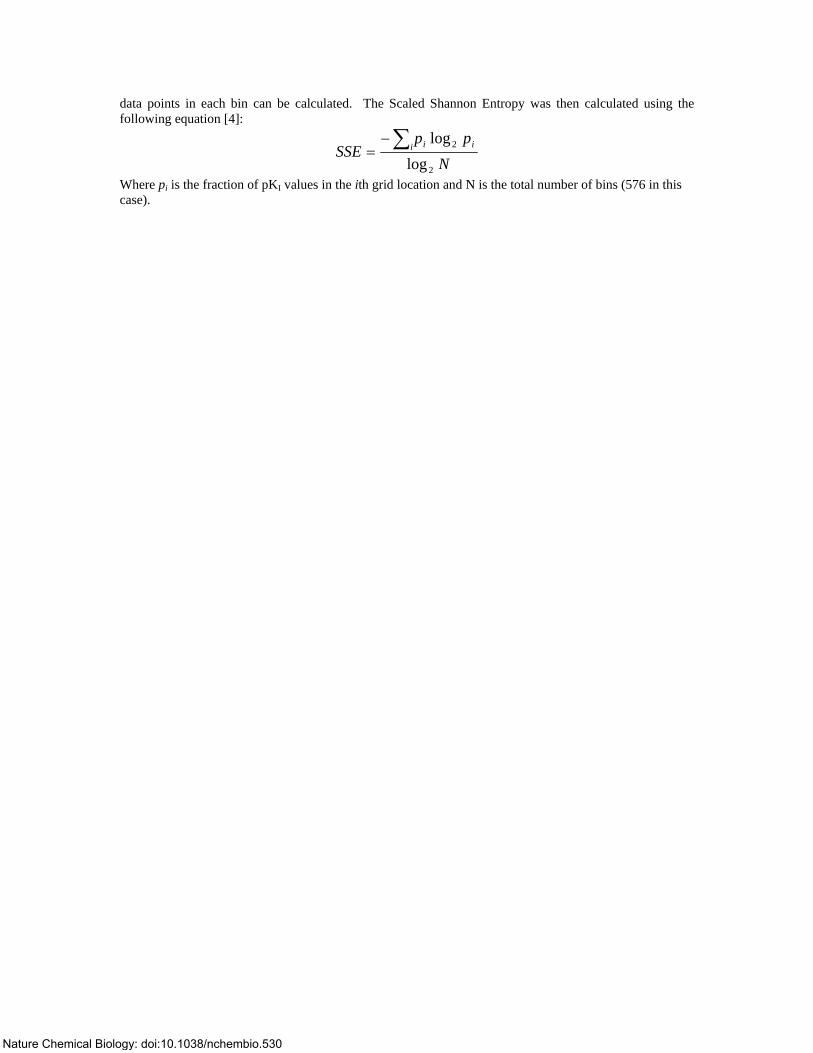
data points in each bin can be calculated. The Scaled Shannon Entropy was then calculated using the following equation [4]:
Npp
SSE i ii
2
2
loglog∑−=
Where pi is the fraction of pKI values in the ith grid location and N is the total number of bins (576 in this case).
Nature Chemical Biology: doi:10.1038/nchembio.530
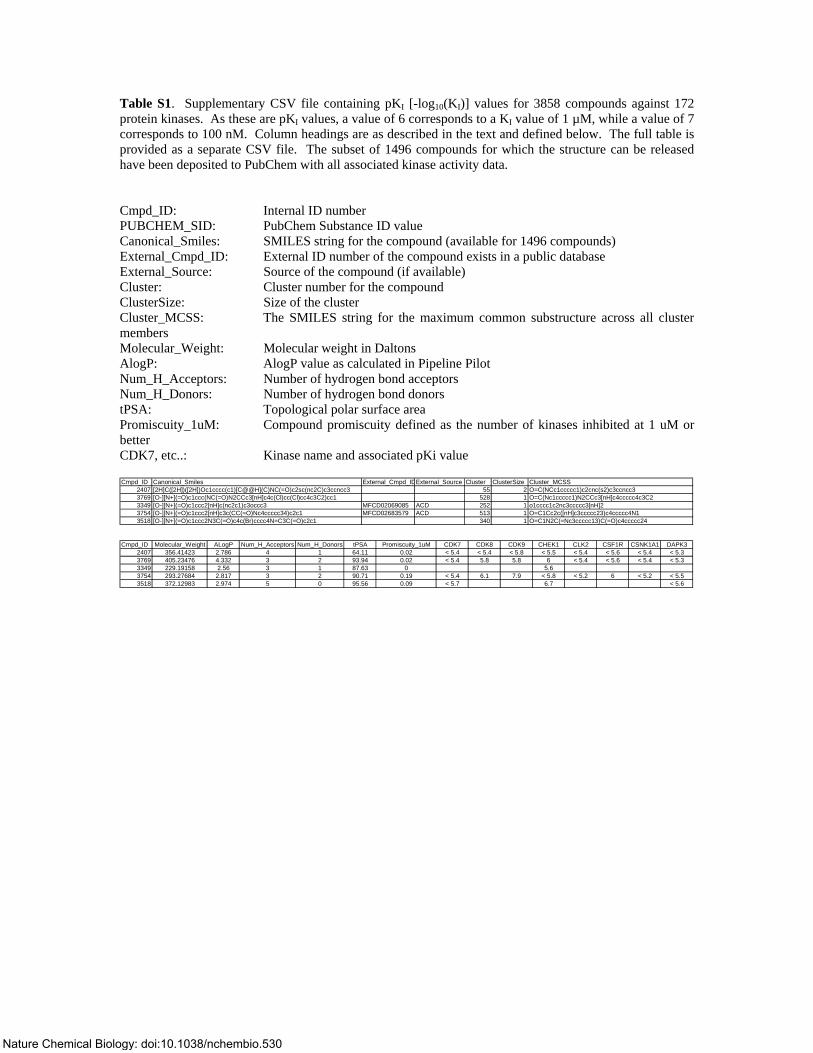
Table S1. Supplementary CSV file containing pKI [-log10(KI)] values for 3858 compounds against 172 protein kinases. As these are pKI values, a value of 6 corresponds to a KI value of 1 µM, while a value of 7 corresponds to 100 nM. Column headings are as described in the text and defined below. The full table is provided as a separate CSV file. The subset of 1496 compounds for which the structure can be released have been deposited to PubChem with all associated kinase activity data. Cmpd_ID: Internal ID number PUBCHEM_SID: PubChem Substance ID value Canonical_Smiles: SMILES string for the compound (available for 1496 compounds) External_Cmpd_ID: External ID number of the compound exists in a public database External_Source: Source of the compound (if available) Cluster: Cluster number for the compound ClusterSize: Size of the cluster Cluster_MCSS: The SMILES string for the maximum common substructure across all cluster members Molecular_Weight: Molecular weight in Daltons AlogP: AlogP value as calculated in Pipeline Pilot Num_H_Acceptors: Number of hydrogen bond acceptors Num_H_Donors: Number of hydrogen bond donors tPSA: Topological polar surface area Promiscuity_1uM: Compound promiscuity defined as the number of kinases inhibited at 1 uM or better CDK7, etc..: Kinase name and associated pKi value Cmpd_ID Canonical_Smiles External_Cmpd_IDExternal_Source Cluster ClusterSize Cluster_MCSS
2407 [2H]C([2H])([2H])Oc1cccc(c1)[C@@H](C)NC(=O)c2sc(nc2C)c3ccncc3 55 2 O=C(NCc1ccccc1)c2cnc(s2)c3ccncc33769 [O-][N+](=O)c1ccc(NC(=O)N2CCc3[nH]c4c(Cl)cc(Cl)cc4c3C2)cc1 528 1 O=C(Nc1ccccc1)N2CCc3[nH]c4ccccc4c3C23349 [O-][N+](=O)c1ccc2[nH]c(nc2c1)c3occc3 MFCD02069085 ACD 252 1 o1cccc1c2nc3ccccc3[nH]23754 [O-][N+](=O)c1ccc2[nH]c3c(CC(=O)Nc4ccccc34)c2c1 MFCD02683579 ACD 513 1 O=C1Cc2c([nH]c3ccccc23)c4ccccc4N13518 [O-][N+](=O)c1ccc2N3C(=O)c4c(Br)cccc4N=C3C(=O)c2c1 340 1 O=C1N2C(=Nc3ccccc13)C(=O)c4ccccc24
Cmpd_ID Molecular_Weight ALogP Num_H_Acceptors Num_H_Donors tPSA Promiscuity_1uM CDK7 CDK8 CDK9 CHEK1 CLK2 CSF1R CSNK1A1 DAPK3
2407 356.41423 2.786 4 1 64.11 0.02 < 5.4 < 5.4 < 5.8 < 5.5 < 5.4 < 5.6 < 5.4 < 5.33769 405.23476 4.332 3 2 93.94 0.02 < 5.4 5.8 5.8 6 < 5.4 < 5.6 < 5.4 < 5.33349 229.19158 2.56 3 1 87.63 0 5.63754 293.27684 2.817 3 2 90.71 0.19 < 5.4 6.1 7.9 < 5.8 < 5.2 6 < 5.2 < 5.53518 372.12983 2.974 5 0 95.56 0.09 < 5.7 6.7 < 5.6
Nature Chemical Biology: doi:10.1038/nchembio.530
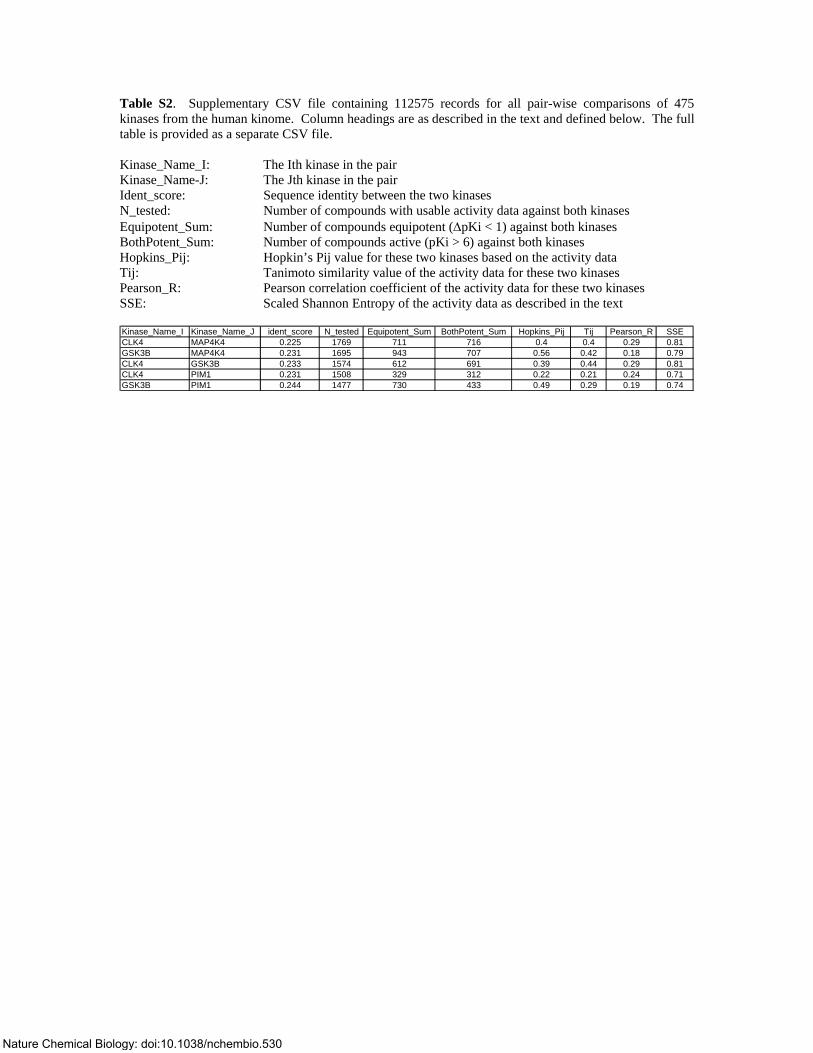
Table S2. Supplementary CSV file containing 112575 records for all pair-wise comparisons of 475 kinases from the human kinome. Column headings are as described in the text and defined below. The full table is provided as a separate CSV file. Kinase_Name_I: The Ith kinase in the pair Kinase_Name-J: The Jth kinase in the pair Ident_score: Sequence identity between the two kinases N_tested: Number of compounds with usable activity data against both kinases Equipotent_Sum: Number of compounds equipotent (ΔpKi < 1) against both kinases BothPotent_Sum: Number of compounds active (pKi > 6) against both kinases Hopkins_Pij: Hopkin’s Pij value for these two kinases based on the activity data Tij: Tanimoto similarity value of the activity data for these two kinases Pearson_R: Pearson correlation coefficient of the activity data for these two kinases SSE: Scaled Shannon Entropy of the activity data as described in the text Kinase_Name_I Kinase_Name_J ident_score N_tested Equipotent_Sum BothPotent_Sum Hopkins_Pij Tij Pearson_R SSECLK4 MAP4K4 0.225 1769 711 716 0.4 0.4 0.29 0.81GSK3B MAP4K4 0.231 1695 943 707 0.56 0.42 0.18 0.79CLK4 GSK3B 0.233 1574 612 691 0.39 0.44 0.29 0.81CLK4 PIM1 0.231 1508 329 312 0.22 0.21 0.24 0.71GSK3B PIM1 0.244 1477 730 433 0.49 0.29 0.19 0.74
Nature Chemical Biology: doi:10.1038/nchembio.530
Supplementary Results
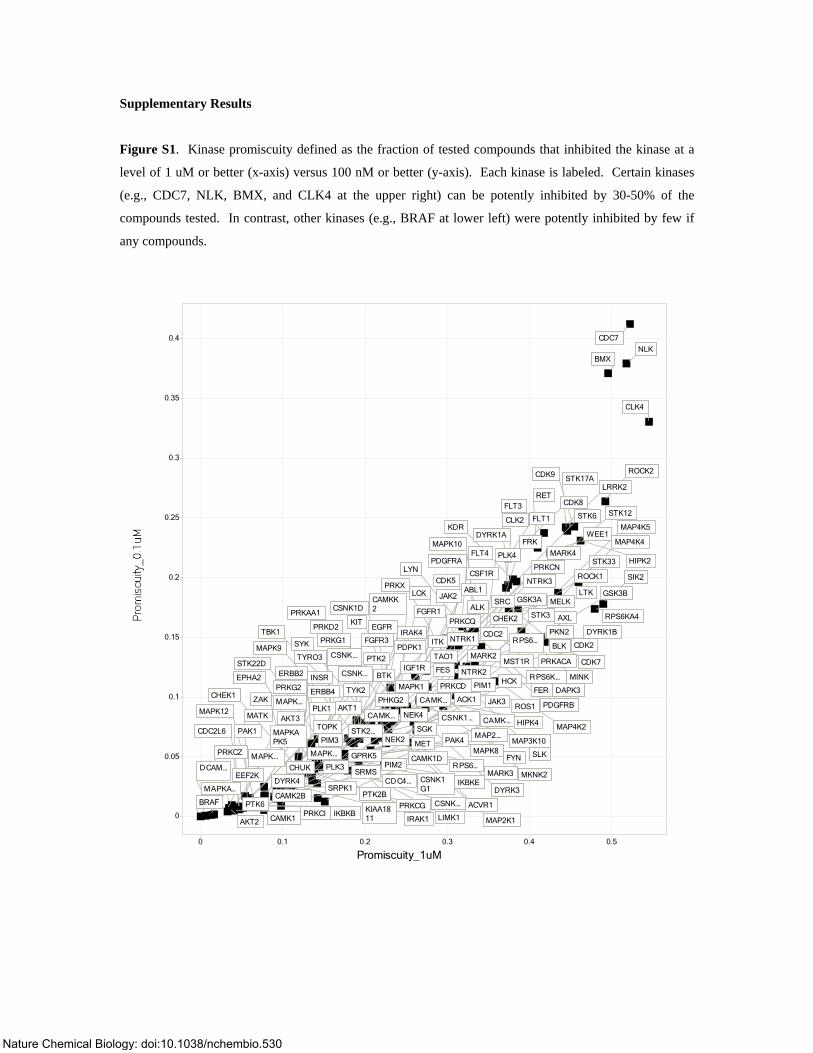
Figure S1. Kinase promiscuity defined as the fraction of tested compounds that inhibited the kinase at a
level of 1 uM or better (x-axis) versus 100 nM or better (y-axis). Each kinase is labeled. Certain kinases
(e.g., CDC7, NLK, BMX, and CLK4 at the upper right) can be potently inhibited by 30-50% of the
compounds tested. In contrast, other kinases (e.g., BRAF at lower left) were potently inhibited by few if
any compounds.
Promiscuity_1uM
0
0.05
0.1
0.15
0.2
0.25
0.3
0.35
0.4
0 0.1 0.2 0.3 0.4 0.5
BRAF
MAPKA…
EEF2KDCAM…
MAPK…
AKT2
PRKCZ
CAMK1
MAPKAPK5
PAK1CDC2L6
PRKCI
TOPKAKT3MATK
AKT1
SRPK1
MAPK12
IKBKB
CAMK2B
PLK1
DYRK4
CHUK
MAPK…
PLK3
STK2…
GPRK5
SRMS
CAMK…
PTK2B
KIAA1811
MAPK… PHKG2ZAKTYK2ERBB4
NEK2
PRKG2CHEK1
PTK6
PIM2
CDC4…
INSRMAPK1
PRKCG
EPHA2 BTKIGF1R
NEK4
CSNK…
SGK
ERBB2
PTK2
PIM3
CAMK1D
MET
STK22DCSNK…
CAMK…
CSNK1G1
TAO1TYRO3
FES
PRKCD
CSNK1…
IRAK1
PAK4
PDPK1
CSNK…
NTRK1FGFR3
RPS6…
ITKMAPK9
IKBKE
PRKG1
LIMK1
IRAK4
ACK1
MARK2
SYK
NTRK2
PIM1
MAP2…
TBK1
ACVR1
CDC2
CAMK…
EGFR
MAPK8
PRKCQ
MARK3
JAK3
KITPRKD2
FGFR1CHEK2
SRCALK
CAMKK2CSNK1D
HCK
DYRK3
PRKAA1
MAP2K1
RPS6…
JAK2ABL1
MST1R
FYN
MAP3K10
LCK
ROS1
NTRK3
HIPK4
STK3
CSF1R
MKNK2
PRKXCDK5
RPS6K…
GSK3A
SLK
PRKCNPDGFRA
PRKACA
LYN
FER
FLT4MAPK10
MARK4
PKN2
MELK
PDGFRB
PLK4
DAPK3
MAP4K2
FRK
BLK
DYRK1A
FLT1CLK2
AXL
KDR
CDK2
ROCK1
STK6
LTK
MINK
DYRK1B
CDK8RET
GSK3B
FLT3
STK33
CDK7
WEE1MAP4K5
STK12
LRRK2STK17ACDK9
MAP4K4
HIPK2
RPS6KA4
SIK2
ROCK2
BMXNLK
CDC7
CLK4
Nature Chemical Biology: doi:10.1038/nchembio.530
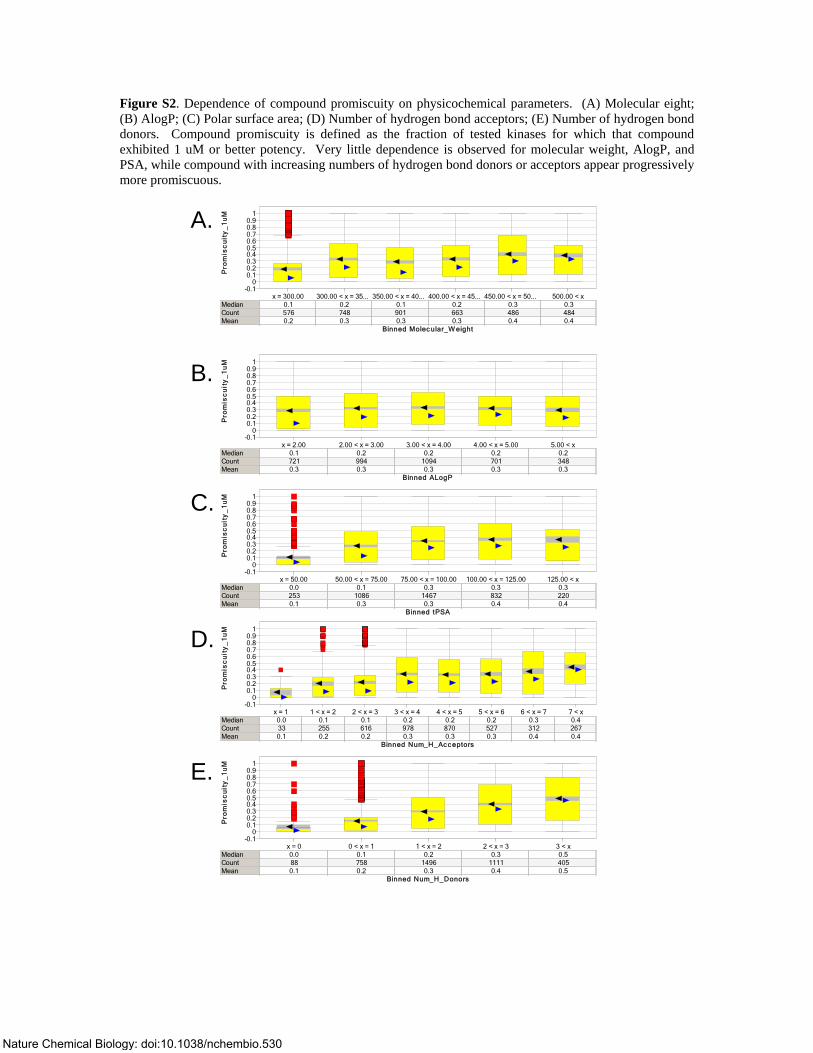
Figure S2. Dependence of compound promiscuity on physicochemical parameters. (A) Molecular eight; (B) AlogP; (C) Polar surface area; (D) Number of hydrogen bond acceptors; (E) Number of hydrogen bond donors. Compound promiscuity is defined as the fraction of tested kinases for which that compound exhibited 1 uM or better potency. Very little dependence is observed for molecular weight, AlogP, and PSA, while compound with increasing numbers of hydrogen bond donors or acceptors appear progressively more promiscuous.
A.
B.
-0.10
0.10.20.30.40.50.60.70.80.9
1
x = 300.00 300.00 < x = 35... 350.00 < x = 40... 400.00 < x = 45... 450.00 < x = 50... 500.00 < xMedianCountMean
0.1 0.2 0.1 0.2 0.3 0.3576 748 901 663 486 4840.2 0.3 0.3 0.3 0.4 0.4
Binned Molec ular_W eight
Pro
mis
cu
ity
_1
uM
-0.10
0.10.20.30.40.50.60.70.80.9
1
x = 2.00 2.00 < x = 3.00 3.00 < x = 4.00 4.00 < x = 5.00 5.00 < xMedianCountMean
0.1 0.2 0.2 0.2 0.2721 994 1094 701 3480.3 0.3 0.3 0.3 0.3
Binned ALogP
Pro
mis
cu
ity
_1
uM
-0.10
0.10.20.30.40.50.60.70.80.9
1
x = 50.00 50.00 < x = 75.00 75.00 < x = 100.00 100.00 < x = 125.00 125.00 < xMedianCountMean
0.0 0.1 0.3 0.3 0.3253 1086 1467 832 2200.1 0.3 0.3 0.4 0.4
Binned tPSA
Pro
mis
cu
ity
_1
uM
-0.10
0.10.20.30.40.50.60.70.80.9
1
x = 1 1 < x = 2 2 < x = 3 3 < x = 4 4 < x = 5 5 < x = 6 6 < x = 7 7 < xMedianCountMean
0.0 0.1 0.1 0.2 0.2 0.2 0.3 0.433 255 616 978 870 527 312 2670.1 0.2 0.2 0.3 0.3 0.3 0.4 0.4
Binned Num_H_Ac c eptors
Pro
mis
cu
ity
_1
uM
-0.10
0.10.20.30.40.50.60.70.80.9
1
x = 0 0 < x = 1 1 < x = 2 2 < x = 3 3 < xMedianCountMean
0.0 0.1 0.2 0.3 0.588 758 1496 1111 4050.1 0.2 0.3 0.4 0.5
Binned Num_H_Donors
Pro
mis
cu
ity
_1
uM
C.
D.
E.
Nature Chemical Biology: doi:10.1038/nchembio.530
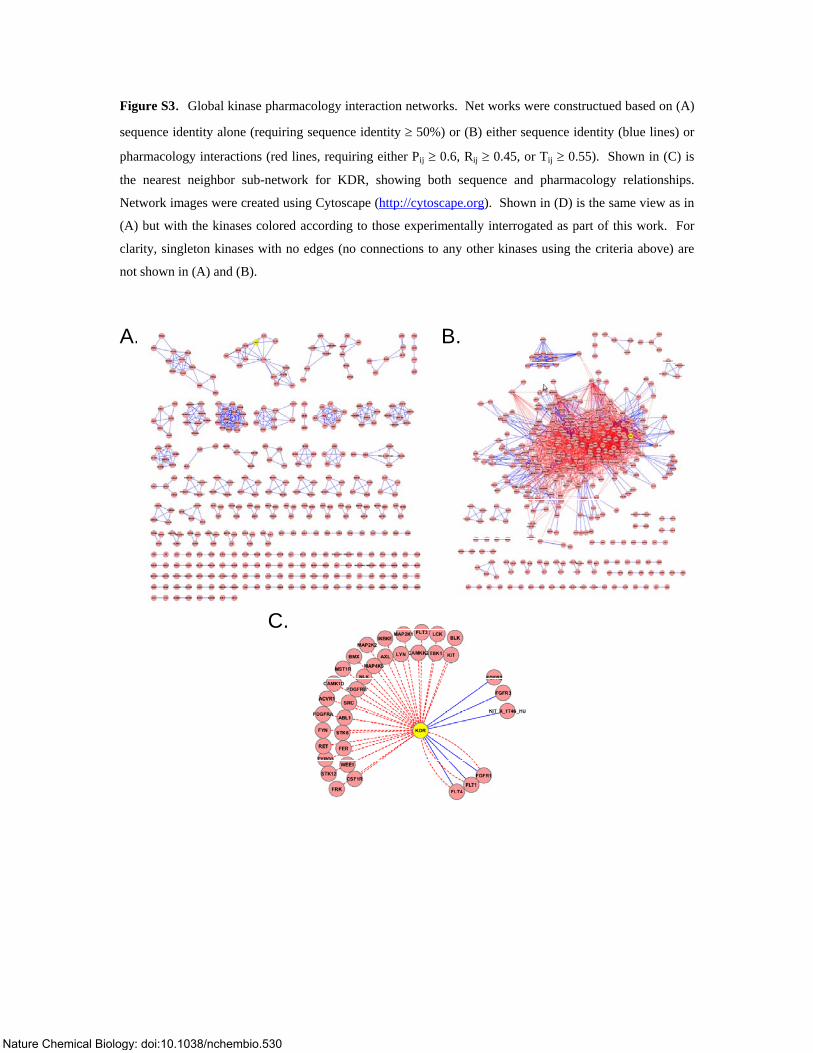
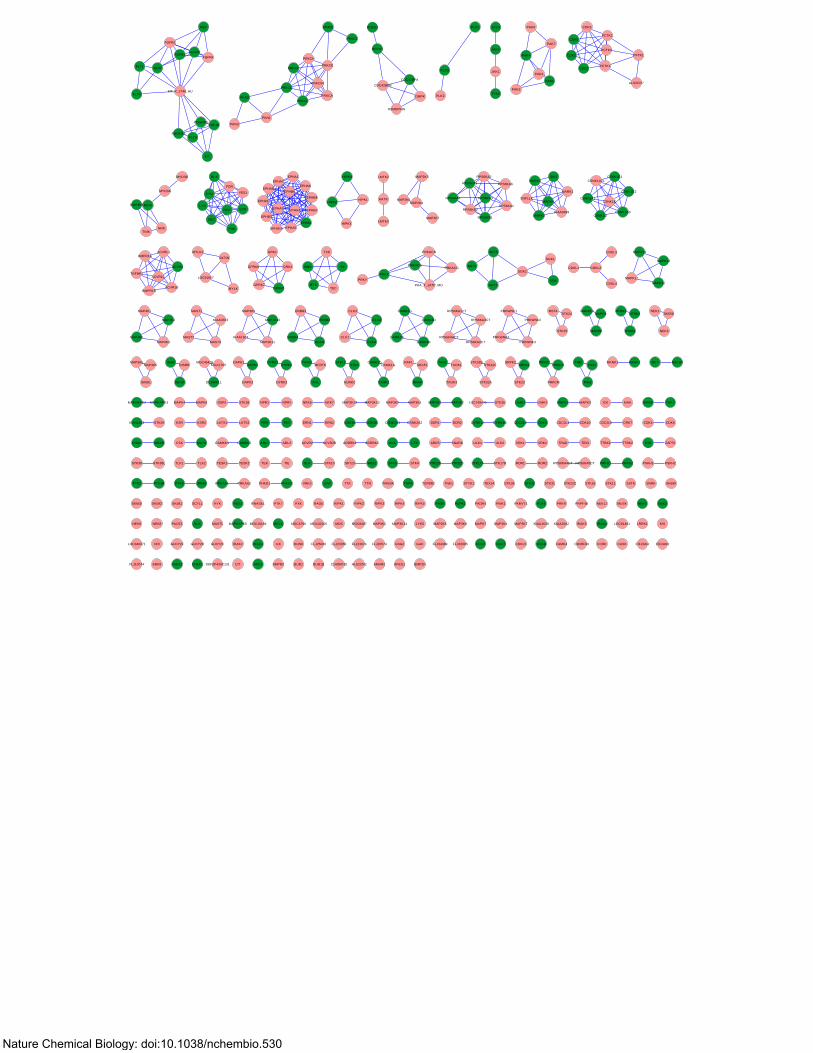
Figure S3. Global kinase pharmacology interaction networks. Net works were constructued based on (A)
sequence identity alone (requiring sequence identity ≥ 50%) or (B) either sequence identity (blue lines) or
pharmacology interactions (red lines, requiring either Pij ≥ 0.6, Rij ≥ 0.45, or Tij ≥ 0.55). Shown in (C) is
the nearest neighbor sub-network for KDR, showing both sequence and pharmacology relationships.
Network images were created using Cytoscape (http://cytoscape.org). Shown in (D) is the same view as in
(A) but with the kinases colored according to those experimentally interrogated as part of this work. For
clarity, singleton kinases with no edges (no connections to any other kinases using the criteria above) are
not shown in (A) and (B).
A. B.
C.
Nature Chemical Biology: doi:10.1038/nchembio.530
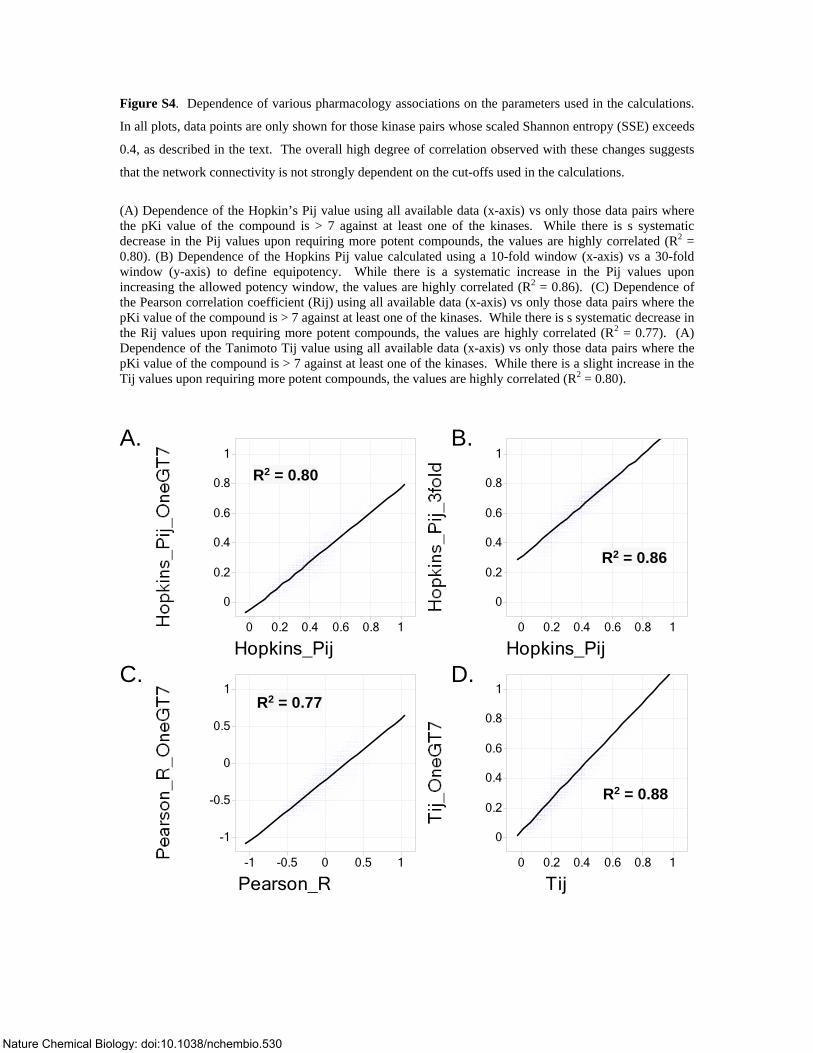
Figure S4. Dependence of various pharmacology associations on the parameters used in the calculations.
In all plots, data points are only shown for those kinase pairs whose scaled Shannon entropy (SSE) exceeds
0.4, as described in the text. The overall high degree of correlation observed with these changes suggests
that the network connectivity is not strongly dependent on the cut-offs used in the calculations.
(A) Dependence of the Hopkin’s Pij value using all available data (x-axis) vs only those data pairs where the pKi value of the compound is > 7 against at least one of the kinases. While there is s systematic decrease in the Pij values upon requiring more potent compounds, the values are highly correlated (R2 = 0.80). (B) Dependence of the Hopkins Pij value calculated using a 10-fold window (x-axis) vs a 30-fold window (y-axis) to define equipotency. While there is a systematic increase in the Pij values upon increasing the allowed potency window, the values are highly correlated (R2 = 0.86). (C) Dependence of the Pearson correlation coefficient (Rij) using all available data (x-axis) vs only those data pairs where the pKi value of the compound is > 7 against at least one of the kinases. While there is s systematic decrease in the Rij values upon requiring more potent compounds, the values are highly correlated (R2 = 0.77). (A) Dependence of the Tanimoto Tij value using all available data (x-axis) vs only those data pairs where the pKi value of the compound is > 7 against at least one of the kinases. While there is a slight increase in the Tij values upon requiring more potent compounds, the values are highly correlated (R2 = 0.80).
Hopkins_Pij
0
0.2
0.4
0.6
0.8
1
0 0.2 0.4 0.6 0.8 1
R2 = 0.80
Hopkins_Pij
0
0.2
0.4
0.6
0.8
1
0 0.2 0.4 0.6 0.8 1
R2 = 0.86
Pearson_R
-1
-0.5
0
0.5
1
-1 -0.5 0 0.5 1
R2 = 0.77
Tij
0
0.2
0.4
0.6
0.8
1
0 0.2 0.4 0.6 0.8 1
R2 = 0.88
A. B.
C. D.
Nature Chemical Biology: doi:10.1038/nchembio.530
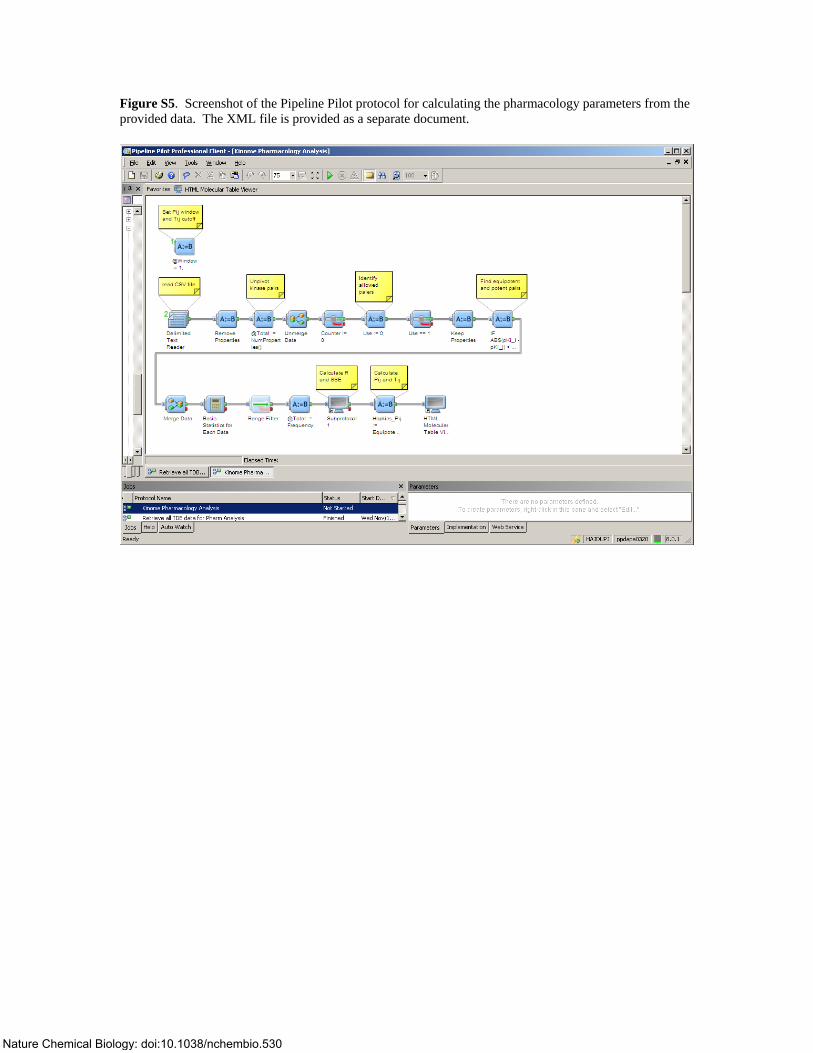
Figure S5. Screenshot of the Pipeline Pilot protocol for calculating the pharmacology parameters from the provided data. The XML file is provided as a separate document.
Nature Chemical Biology: doi:10.1038/nchembio.530
CHEK1CHEK2
GUCY2F
PACE1
SK581
NLK
SCYL1
GUCY2D
PTK6
TLK1
CSK
KSR
MAPK4
INSRR
TLK2
MATK
IGF1R
MGC45428
SRMS
MYLK2
KSR2
MAST2
MAPK6
ACVR1
FLT3
PDGFRB
MYO3B
FGFR1
FGFR2
FGFR3
KIT_X_1T46_HU
PDGFRA
EPHB1
LCK
SK709
KIAA1804
GPRK7
MAP3K9
MYLK
HCK
GPRK6
EPHA7
EPHA4
GRK4
ERBB3
EPHB6
EPHB2
GRK1
EPHA8
EPHA5
EPHA3
EPHA2
TESK1
LATS1
OSR1
CAMKK2
KIAA1765
MAST3
CAMKK1
TESK2
DCAMKL1
PRKAA1
ROS1
MASTL MAPKAPK5
GUCY2C
PRKAA2
IRAK2
DKFZP434C131 CIT
RYK
BUB1BBUB1
FLJ25006HUNK
BMPR2ACK1
ILKIRAK1
VRK3
SLK
ACVR2
ERN1
NEK6
ERBB2
EGFR
MERTK
ERBB4
TYRO3
AXL
DAPK1DAPK3
DAPK2
STK39
LATS2
RNASEL PTK7 RAGE
MELK MGC4796MGC16169 MGC42105
PXK
DYRK4
DYRK2
NPR2
FES
ABL2
TIE
PHKG2PHKG1
TEK
ABL1
FER
NPR1
MAP3K11
DYRK3
EIF2AK3EIF2AK4CASK
KISLRRK1LOC91461
CCRK
IRAK4
TTBK1 TTBK2
CDC2L5 CRK7
SYK ZAP70
CDK4 CDK6CDK8
LIMK2
PRKCM
TRAD
CDC2L1
MAPK1
PRKCN
MAPK3
PIM3
MAPK8
MAPK9
NTRK1
NTRK3
CDKL4
MAPK11
MKNK2MKNK1
CSNK1A1L
CSNK1D
CSNK1E
CSNK1G3
CDKL3 MAPK14
CSNK1G2
CSNK1A1MARK4
SGKL
PIM1
SK690SNRK
PSKH2
STK11
PRKG1 PRKG2 PSKH1
SSTKSTK16
PRKR NEK11 MUSK NEK4 NEK2
MAPK13
MAPK12
MET
NEK3
SK558NEK1
MST1R
TBK1IKBKEMAKICK
TAOK3
TAOK1
RPS6KA6CT
LOC149420
STK32A
STK32BSTK32C
RPS6KA2CT
RPS6KA1CT
PRKACG
MAP2K2
SNARK ULK1
DYRK1B CDC2L6
TRIOVRK1
CDK10DDR2 DYRK1A
ULK2 VRK2
STK35
SRPK1SRPK2
PRKWNK4
STK23
LIMK1
RPS6KA5CTRPS6KA4CTROR2STK17BSTK17ASTK22D ROR1
FLJ32685
MAP3K8
CDKL5
MAPK7
CDK7 CDC7
MAP3K4
PIM2
MAPK10STK24
STK25
PRKD2
PRKWNK3
PRKWNK1
PRKWNK2
AKT3
RPS6KB2
AKT2
RPS6KA3CT
RPS6KB1
C9ORF96CAMK4CDK9
IRAK3KIAA2002MAP3K7 KIAA1639
TNK1 TEX14 STK36 STK33 STK31 STK22CSTYK1
PDPK1 PIK3R4 PINK1 PKMYT1 PLK4 PRPF4B
MARK3KIAA0999
CDKL1
MST4
SGK
KIAA0303
MAST1
SRC
LOC91807
FRK EPHA10
EPHB3
YES1
FGR
EPHA1
EPHA6
EPHB4
TXK
SGK2
TECBTK
GPRK5
BMX
AKT1
CDKL2
CAMK2GNTRK2
MAP3K10
SIK2MARK2
RPS6KA2
RPS6KA6
MARK1
RPS6KA5
SNF1LK
RPS6KA1
CSNK1G1
RPS6KA3HIPK2
HIPK4
RPS6KA4
MAP2K3
FLJ34389GAKGSG2
LYK5
APEG1 BMP2K
MAP3K1 MAP3K14
AMHR2
FLJ20574
MAP2K5
RIPK5
TGFBR2
STK22B
ARK5
STK4
CSNK2A2
TOPK
RIPK4 PASK
CAMK2B
RAF1
DDR1
LTK
PKA_X_1ATP_MO
BRAF
TAO1
MAP2K1
ARAF1
CAMK2D
MAP3K3
STK10
ZAK TTK TTN
ITK
PRKY
CLK2
CLK3
MAP2K6
LMTK2
HIPK3
PRKX
MAP2K4
LMTK3
HIPK1
PRKACB
PRKACA
AATK
MAP2K7
GSK3B
ADRBK2
MAP3K12NEK7
ERN2
WEE1
GSK3A
ADRBK1
MAP3K13
SK723
ACVR2B
CSNK2A1
ALK
STK3
TNNI3K
RIPK3
MAP3K2
CAMK1
CAMK1G
CAMK2A
CAMK1D
CLK4
AURKC
STK6
CLK1
STK12
ALS2CR2
FLJ23074
MGC8407
RIPK2
C14ORF20
FLJ23356
MOS
RIPK1
PAK7CDK5
CDK2
PAK1
PCTK2
PCTK3
PAK3
CDK3
ALS2CR7
PFTK1
PCTK1CDC2
PAK6JAK3PLK1
PAK2
PAK4
JAK2
JAK1
CDC42BPA
PLK2
PLK3
TYK2DMPK
PRKCD
PRKCA
PRKCB1
PRKCE
PRKCH
HSMDPKIN
CDC42BPB
PKN3
PKN1
PKN2
PRKCG
PRKCQ
LYN
RET
FGFR4
CSF1R
KIT
BLK
FYN
PRKCI ROCK2
ROCK1
PRKCZ
ERK8
HRI
SK592
PTK2B
STK38L
IKBKB
STK29
MAPKAPK3
ACVR1B
MAP4K2
INSR
MAP4K3
LOC340371
NEK9
SK650
CHUK
KIAA1811
MAP3K6
STK38
MAPKAPK2
FLJ10074
MAP4K5
PTK2
BMPR1B
MAP4K1
NEK8
FLT1
MAP3K5
SK681
MINK
BMPR1A
ACVR1C
ACVRL1
TNIK
TGFBR1
KDR
NRK
MAP4K4
FLT4
MYO3A
Nature Chemical Biology: doi:10.1038/nchembio.530
References 1 Paolini, G.V., Shapland, R.H., van Hoorn, W.P., Mason, J.S. and Hopkins, A.L. (2006) Global
mapping of pharmacological space. Nat Biotechnol 24 (7), 805-815 2 Vieth, M., Higgs, R.E., Robertson, D.H., Shapiro, M., Gragg, E.A. and Hemmerle, H. (2004)
Kinomics-structural biology and chemogenomics of kinase inhibitors and targets. Biochim Biophys Acta 1697 (1-2), 243-257
3 Bamborough, P., Drewry, D., Harper, G., Smith, G.K. and Schneider, K. (2008) Assessment of chemical coverage of kinome space and its implications for kinase drug discovery. J Med Chem 51 (24), 7898-7914
4 Godden, J.W. and Bajorath, J. (2000) Shannon entropy--a novel concept in molecular descriptor and diversity analysis. J Mol Graph Model 18 (1), 73-76
Nature Chemical Biology: doi:10.1038/nchembio.530


![CDC7 BOZAR 27okt2015 - Febelcem · 2015-10-28 · English completed identity form [cf. website] completed ownership declaration [cf. website] a copy of the school registration card](https://img.pdfslide.us/doc/110x75/5f0c10017e708231d4338f5c/cdc7-bozar-27okt2015-febelcem-2015-10-28-english-completed-identity-form-cf.jpg)