Embed Size (px)
Citation preview
Supplementary Figure 1
Schematic phylogenetic tree showing the main chordate species used in the present study.
Red stars correspond to the two WGD events that occurred in the vertebrate ancestor (2R) and the extra WGD round that happened at the origin of teleost fish (3R). The asterisk indicates that, in zebrafish in contrast to other teleost species, HoxDb has been secondarily lost and only mir10 and the anterior and posterior Hox-neighboring genes still remain in this genomic region.
Nature Genetics: doi:10.1038/ng.3497

Supplementary Figure 2
‘Desertification’ of HoxD clusters.
(a–c) Genomic organization of the mouse HoxA and HoxD and elephant shark HoxD clusters. Symbols for Hox, anterior and posterior neighboring genes are colored in black, blue and red, respectively. Several mouse long-range enhancers and their orthologs in elephant shark are represented by green bars. Red arrows indicate the two paralogous CsB enhancers that demonstrate the loss of a Hibadh2 gene from HoxA-neighboring regions and the pseudogenized remnant of mouse Jazf2. (d) VISTA plot of the Jazf2 genomic region in elephant shark (reference sequence) and mouse, showing the mouse Jazf2 pseudoexon (red asterisk) and the ancestral intronic location of mouse regulatory islands I and II. VISTA colored peaks (blue, coding; turquoise, UTR; pink, noncoding; green, mouse regulatory islands) indicate regions of at least 70 bp and ≥65% similarity. The alignment below the plot corresponds to the region indicated by the asterisk, showing several mutations in the mouse Jazf2 sequence, including splice sites (in lower case) and frameshifts.
Nature Genetics: doi:10.1038/ng.3497

Supplementary Figure 3
Conservation of microsynteny around Hox-neighboring genes.
(a) Microsynteny arrangements around the Hox clusters of different bilaterian species and the ‘ghost’ Hox locus of the placozoan Trichoplax adhaerens. Note that, because of the lack of synteny conservation, we could not infer a consensus for different vertebrate species beyond the genes included in the vertebrate ancestor reconstruction. Thus, for genes beyond these limits, the information displayed in this figure corresponds mainly to the mouse genome. (b) Conserved linkage of vertebrate posterior neighboring genes in amphioxus and non-chordate species. (c) Conserved linkage of amphioxus posterior neighboring genes in non-chordate species. Genes are represented by arrows (white, Hox clusters; blue, chordate anterior neighboring genes; red, vertebrate posterior neighboring genes; orange, amphioxus posterior neighboring genes; green, non-chordate neighboring genes linked to Hox genes in at least two species; black, non-Hox ANTP-class homeobox genes). Question marks represent genes whose status in the vertebrate ancestor could not be inferred. Slashes indicate the presence of genes not represented in the figure. Black circles represent the end of the genomic scaffold. Small black rectangles indicate the presence of predicted gene model(s) with no clear orthologs in other species and that in most cases have multiple additional copies in their corresponding genomes. The black asterisk within the Hox cluster arrow of L. gigantea indicates the reversed orientation of the last Hox posterior gene in this species.
Nature Genetics: doi:10.1038/ng.3497

Supplementary Figure 4
4C-seq interaction profiles of the zebrafish HoxDa region
Normalized 4C-seq profiles of the promoters for several Hox and neighboring genes in the zebrafish HoxDa region (labeled as in Fig. 2). The 4C-seq profiles corresponding to neighboring genes are indicated with large brackets at the left margin of the figure. Spider plots are color-coded as in Fig. 2. Green lines indicate the positions of the viewpoints. Dotted lines indicate the genomic region containing the HoxDa cluster. Units on the y axes correspond to normalized interacting counts.
Nature Genetics: doi:10.1038/ng.3497

Supplementary Figure 5
Nature Genetics: doi:10.1038/ng.3497
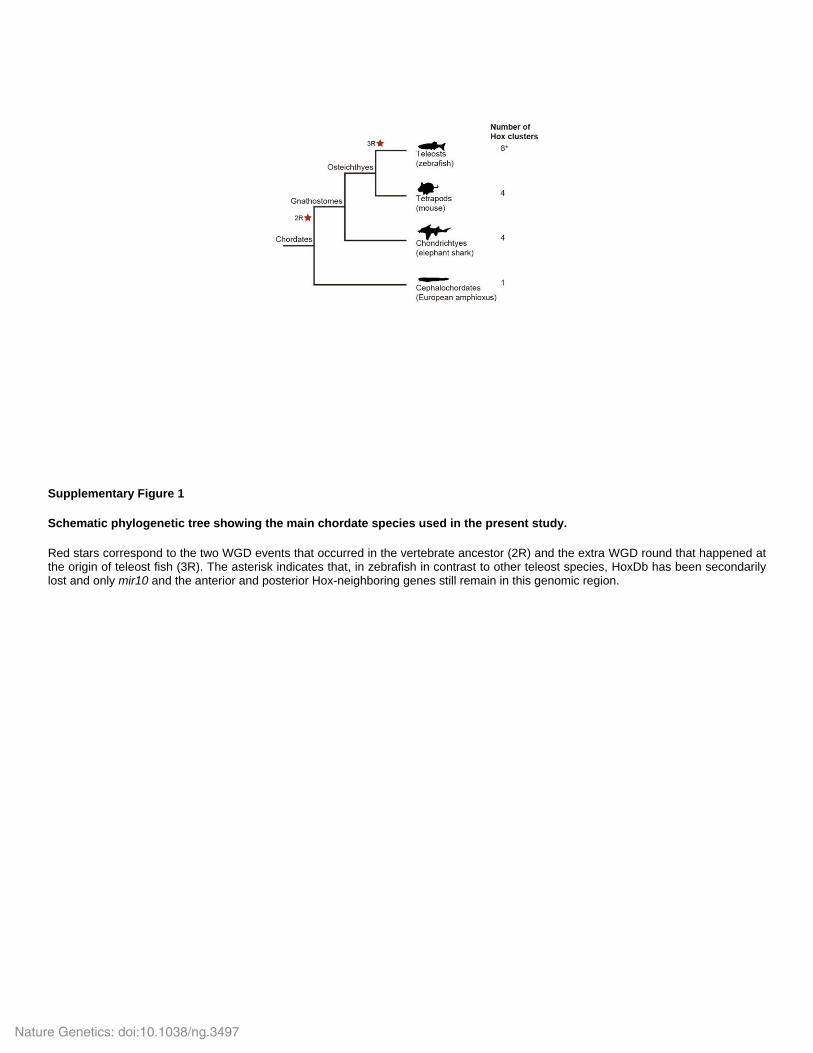
4C-seq interaction profiles of amphioxus Hox regions.
Normalized 4C-seq profiles of the promoters for several Hox and neighboring genes in amphioxus Hox region (labeled as in Fig. 2). The 4C-seq profiles corresponding to neighboring genes are indicated with large brackets at the left margin of the figure. Spider plots are color-coded as in Fig. 2. Green lines indicate the positions of the viewpoints. Dotted lines indicate the genomic region containing the Hox cluster. Units on the y axes correspond to normalized interacting counts.
Nature Genetics: doi:10.1038/ng.3497

Supplementary Figure 6
Temporal dynamics of the 4C-seq interaction profiles of amphioxus Hox genes during development.
The amphioxus Hox genomic region showing one replicate for each of the 4C-seq profiles of the promoters of several Hox genes. The three different developmental stages are colored in red (8 h.p.f. gastrula), black (15 h.p.f. early neurula) and blue (36 h.p.f. larva). Dashed lines indicate the positions of the viewpoints.
Nature Genetics: doi:10.1038/ng.3497
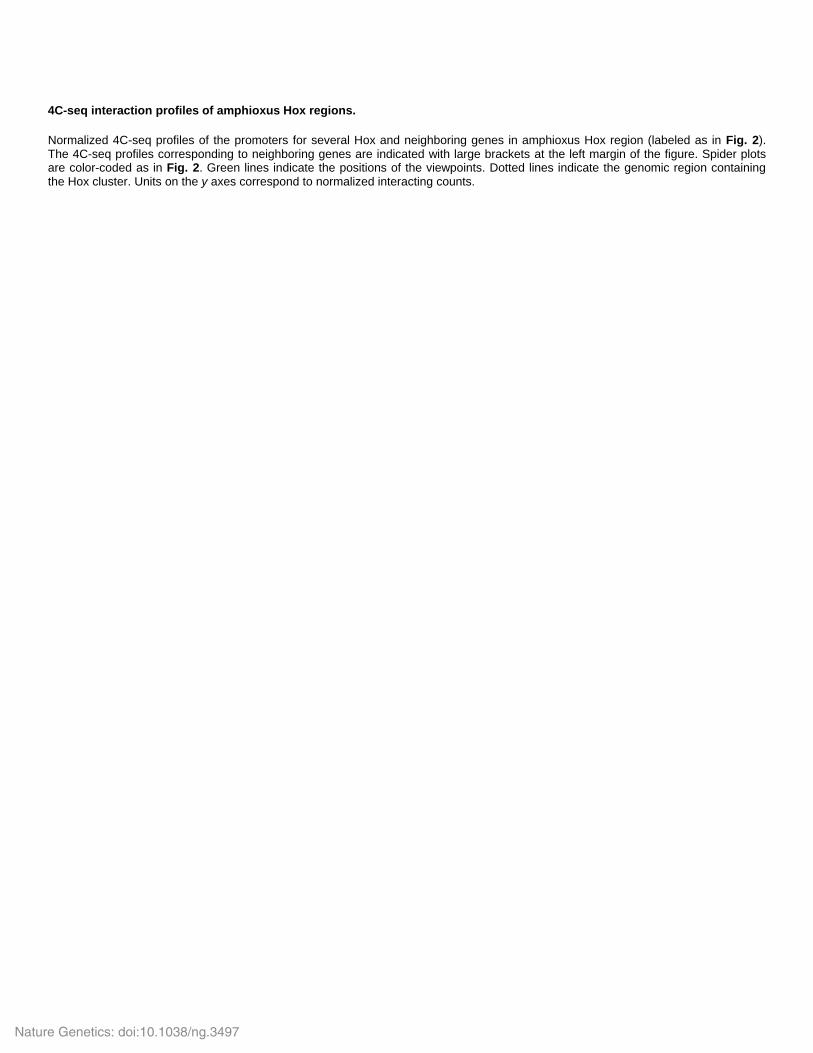
Supplementary Figure 7
Flowchart describing the generation of the models and the virtual Hi-C data.
Nature Genetics: doi:10.1038/ng.3497
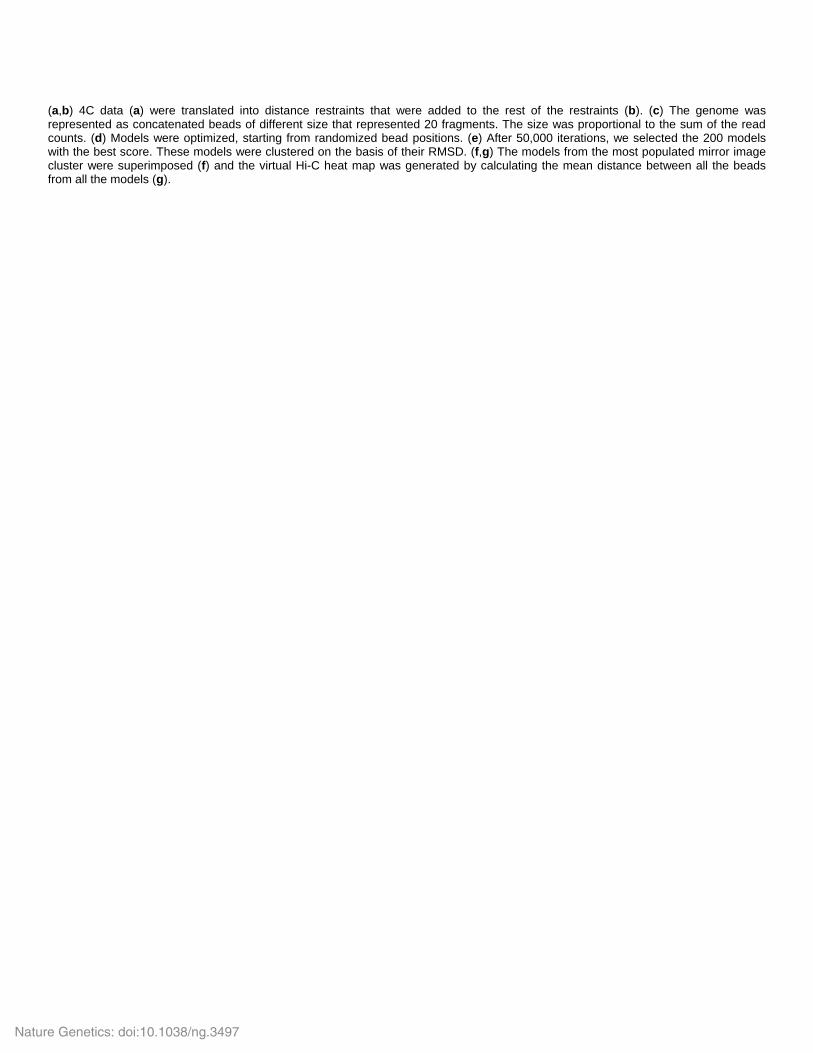
(a,b) 4C data (a) were translated into distance restraints that were added to the rest of the restraints (b). (c) The genome was represented as concatenated beads of different size that represented 20 fragments. The size was proportional to the sum of the read counts. (d) Models were optimized, starting from randomized bead positions. (e) After 50,000 iterations, we selected the 200 models with the best score. These models were clustered on the basis of their RMSD. (f,g) The models from the most populated mirror image cluster were superimposed (f) and the virtual Hi-C heat map was generated by calculating the mean distance between all the beads from all the models (g).
Nature Genetics: doi:10.1038/ng.3497
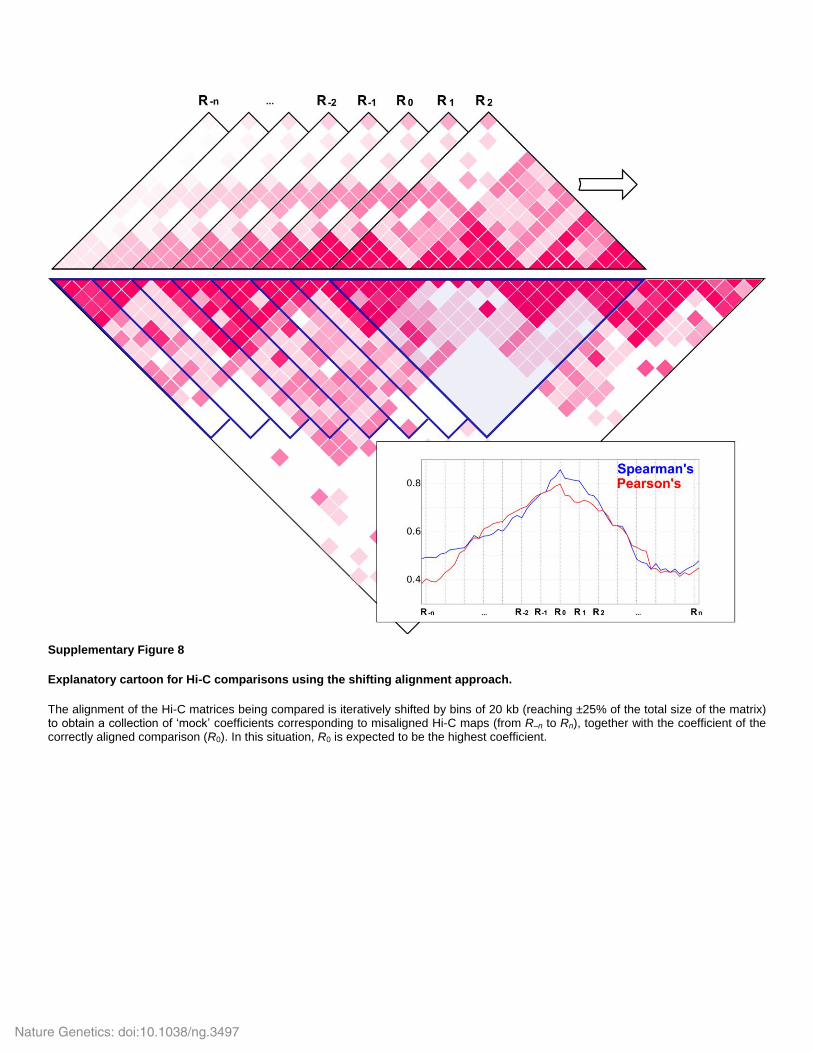
Supplementary Figure 8
Explanatory cartoon for Hi-C comparisons using the shifting alignment approach.
The alignment of the Hi-C matrices being compared is iteratively shifted by bins of 20 kb (reaching ±25% of the total size of the matrix) to obtain a collection of ‘mock’ coefficients corresponding to misaligned Hi-C maps (from R–n to Rn), together with the coefficient of the correctly aligned comparison (R0). In this situation, R0 is expected to be the highest coefficient.
Nature Genetics: doi:10.1038/ng.3497
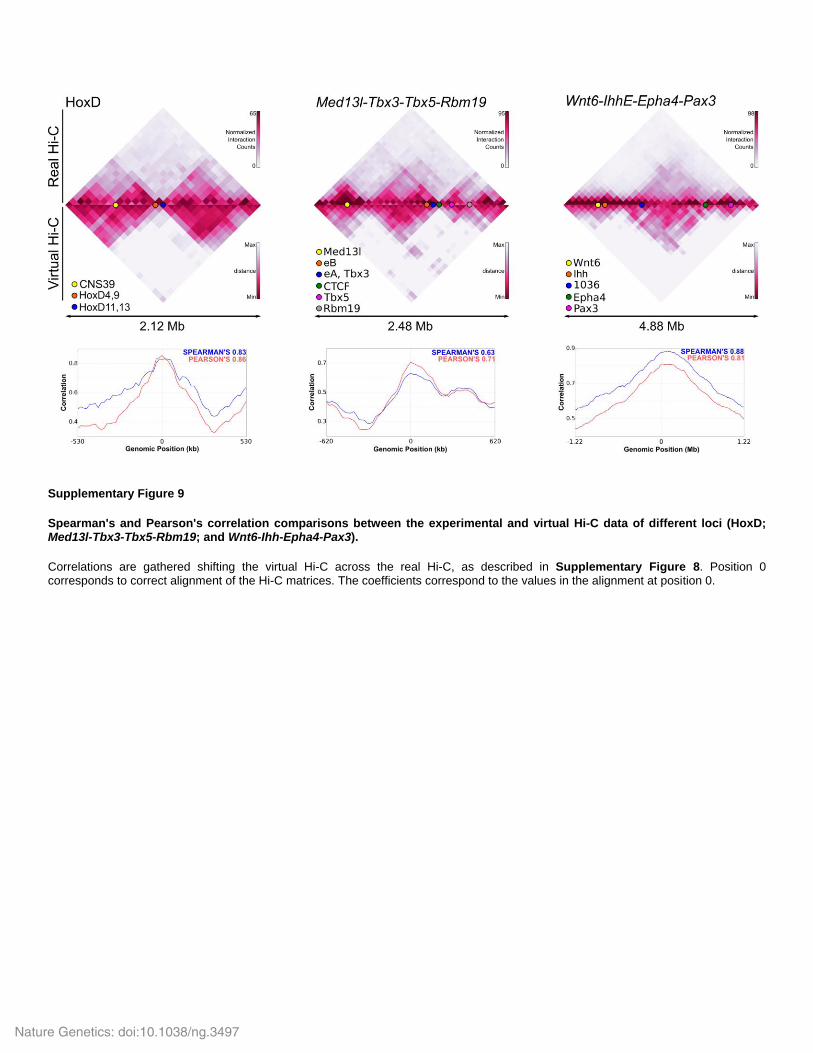
Supplementary Figure 9
Spearman's and Pearson's correlation comparisons between the experimental and virtual Hi-C data of different loci (HoxD; Med13l-Tbx3-Tbx5-Rbm19; and Wnt6-Ihh-Epha4-Pax3).
Correlations are gathered shifting the virtual Hi-C across the real Hi-C, as described in Supplementary Figure 8. Position 0 corresponds to correct alignment of the Hi-C matrices. The coefficients correspond to the values in the alignment at position 0.
Nature Genetics: doi:10.1038/ng.3497

Supplementary Figure 10
Virtual Hi-C jackknife resampling experiments.
(a,b) Zebrafish (a) and amphioxus (b) Spearman’s correlation coefficients between the virtual Hi-Cs obtained from the final 3D models and those resultant from the jackknife resampling experiments. For each number of viewpoints eliminated, five different combinations of viewpoint subsets were randomly generated and compared, except in those eliminating a single viewpoint, where all possible combinations were assayed. Black circles correspond to the correlation coefficients of each individual comparison (Supplementary Table 3), and red circles indicate the average for each resampling category.
Nature Genetics: doi:10.1038/ng.3497

Supplementary Figure 11
ATAC-seq signal distribution in amphioxus Hox-neighboring regions.
(a,b) ATAC-seq profiles of the anterior (a) and posterior (b) regions showing accessible chromatin regions. The ATAC signal is depicted in black, except in cases having overlap with repetitive elements (gray) or transcriptional start sites (green). Elements tested in reporter assays are colored in blue (anterior) and red (posterior). Regions overlapping with the Evx loci ±5 kb are shaded in light red.
Nature Genetics: doi:10.1038/ng.3497
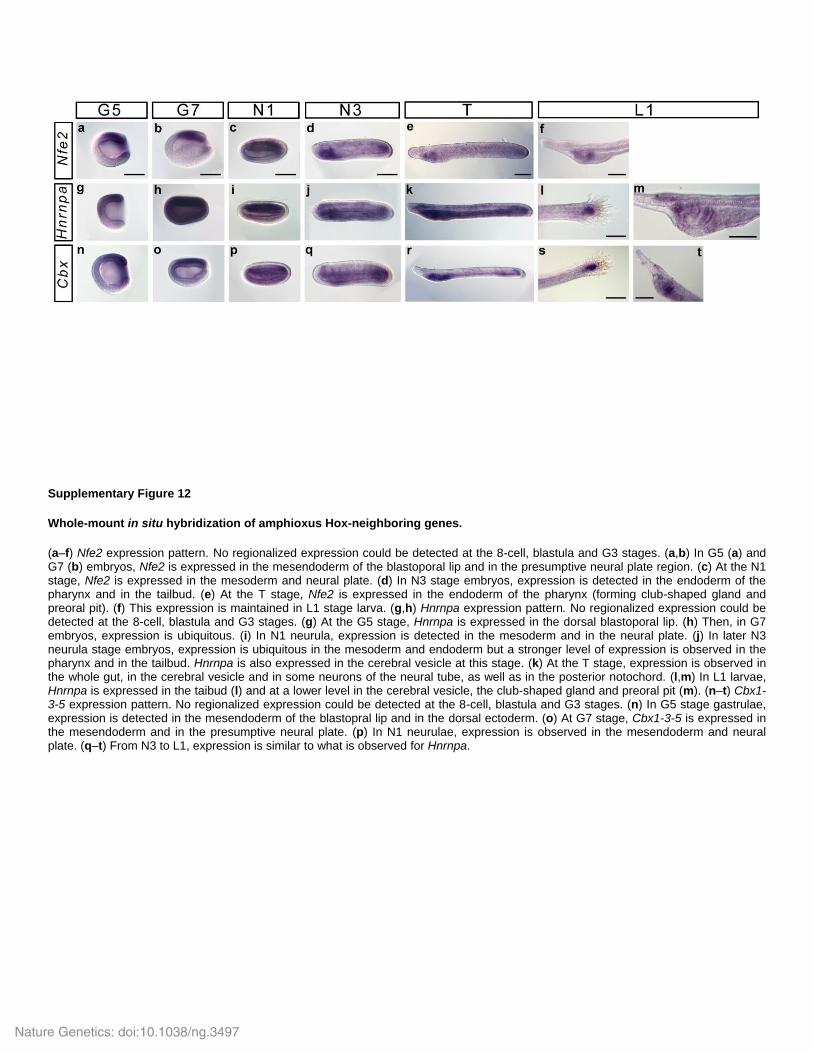
Supplementary Figure 12
Whole-mount in situ hybridization of amphioxus Hox-neighboring genes.
(a–f) Nfe2 expression pattern. No regionalized expression could be detected at the 8-cell, blastula and G3 stages. (a,b) In G5 (a) and G7 (b) embryos, Nfe2 is expressed in the mesendoderm of the blastoporal lip and in the presumptive neural plate region. (c) At the N1 stage, Nfe2 is expressed in the mesoderm and neural plate. (d) In N3 stage embryos, expression is detected in the endoderm of the pharynx and in the tailbud. (e) At the T stage, Nfe2 is expressed in the endoderm of the pharynx (forming club-shaped gland and preoral pit). (f) This expression is maintained in L1 stage larva. (g,h) Hnrnpa expression pattern. No regionalized expression could be detected at the 8-cell, blastula and G3 stages. (g) At the G5 stage, Hnrnpa is expressed in the dorsal blastoporal lip. (h) Then, in G7 embryos, expression is ubiquitous. (i) In N1 neurula, expression is detected in the mesoderm and in the neural plate. (j) In later N3 neurula stage embryos, expression is ubiquitous in the mesoderm and endoderm but a stronger level of expression is observed in the pharynx and in the tailbud. Hnrnpa is also expressed in the cerebral vesicle at this stage. (k) At the T stage, expression is observed in the whole gut, in the cerebral vesicle and in some neurons of the neural tube, as well as in the posterior notochord. (l,m) In L1 larvae, Hnrnpa is expressed in the taibud (l) and at a lower level in the cerebral vesicle, the club-shaped gland and preoral pit (m). (n–t) Cbx1-3-5 expression pattern. No regionalized expression could be detected at the 8-cell, blastula and G3 stages. (n) In G5 stage gastrulae, expression is detected in the mesendoderm of the blastopral lip and in the dorsal ectoderm. (o) At G7 stage, Cbx1-3-5 is expressed in the mesendoderm and in the presumptive neural plate. (p) In N1 neurulae, expression is observed in the mesendoderm and neural plate. (q–t) From N3 to L1, expression is similar to what is observed for Hnrnpa.
Nature Genetics: doi:10.1038/ng.3497

Supplementary Figure 13
Translation of the 4C-seq data into distance restraints.
We used the upper Z score and lower Z score (uZ and lZ, represented as dashed lines in blue). Statistically significant data were defined as the ones above the uZ and below the lZ. On the basis of these boundaries, the reach window was established (in purple), an area that covers all fragments between the first (upstream) and last (downstream) fragment above the uZ. Those read counts inside the reach window above the uZ or below the lZ were translated as harmonic distance restraints (yellow), and the rest (red) were translated as harmonic lower-bound distance restraints.
Nature Genetics: doi:10.1038/ng.3497

Supplementary Figure 14
Comparisons of amphioxus, zebrafish and mouse models.
(a–c) Heat map plots showing the RMSD of the 200 models compared between them. All models of each species were clustered in one of the two mirror-image clusters. Blue squares stand for an RMSD of 0 Å. Red squares are for maximum RSMD.
Nature Genetics: doi:10.1038/ng.3497

Supplementary Figure 15
Comparisons of different sets of bins for each species.
(a,c,e) 3D bar plots comparing the scores of different sets of bins with the maximum distance, the upper Z score and the lower Z score as parameters. The gradient of colors depends on the score, from blue (lowest) to red (highest). The score is the mean of the sum of the differences between the calculated distance for each bead from the 4C data and the measured distance in each model. The lower the score, the smaller the difference between the models and the 4C data. (b,d,f) Heat maps comparing the computed distances from the 4C data for each bead and the mean of the measured distances of the models with the best set of bins: 7,000 for maximum distance, 0.2 for uZ and –0.2 for the lZ.
Nature Genetics: doi:10.1038/ng.3497
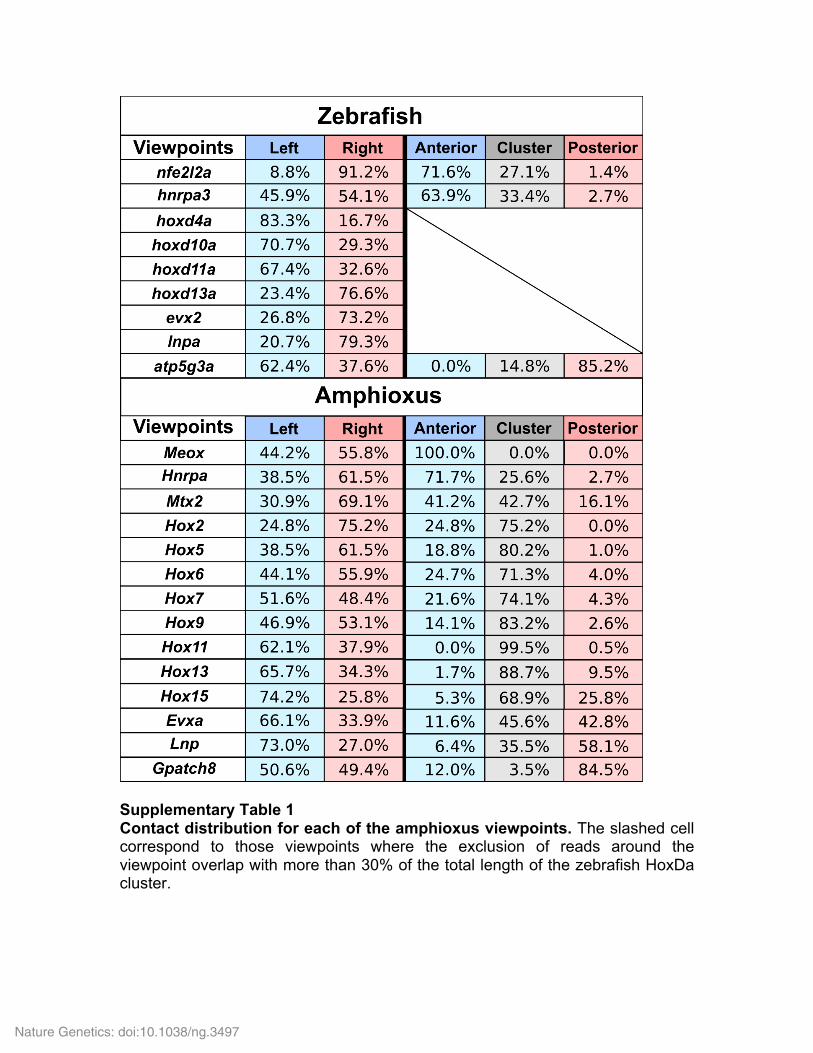
Supplementary Table 1 Contact distribution for each of the amphioxus viewpoints. The slashed cell correspond to those viewpoints where the exclusion of reads around the viewpoint overlap with more than 30% of the total length of the zebrafish HoxDa cluster.
Nature Genetics: doi:10.1038/ng.3497

Supplementary Table 2 Spearman’s correlations of the virtual Hi-C jackknife resampling experiments
Nature Genetics: doi:10.1038/ng.3497

Supplementary Table 3 Correlation coefficients for the mouse HoxD locus between Hi-C datasets corresponding to different experimental replicates and tissues.
Nature Genetics: doi:10.1038/ng.3497

Supplementary Table 4 Primers used in the 4C-seq and enhancer cloning experiments.
Nature Genetics: doi:10.1038/ng.3497
Supplementary Note Vertebrate Hox gene deserts were ancestrally populated by a conserved array of neighboring genes.
In most jawed vertebrate species, the genomic arrangements of HoxA and
HoxD neighborhoods show little similarity: many HoxA long-range cis-regulatory
elements (CREs) are embedded in introns of neighboring genes, while HoxD
long-range CREs are located in gene deserts 2,8. Therefore, the long-range
regulatory interactions of HoxA and HoxD could have evolved independently 9,10.
Here, we show that these differences are a derived situation and that the
genomic organisations of the four Hox clusters neighboring regions were
ancestrally very similar. First, out of the 15 gene families consistently found in the
vicinity of the four clusters, 6 of them (Nfe2, Hnrnpa, Cbx1-3-5, Calcoco, Atp5g
and Creb) have 3 to 4 members in the Hox regions of at least one gnathostome
species, confirming that their close Hox linkages predate the WGDs (Fig. 1b).
Second, ‘desertification’ process (erosion of flanking genes’ exons 13 while non-
coding introns containing CREs are maintained) has probably been rampant
thanks to the functionally redundant genes copies generated by the two
vertebrate WGD duplications. The genomes of slow evolving species such as
elephant shark, still retain additional paralogs of Hox-neighboring genes that
have been secondarily lost in mammals and teleosts (such as Eve1 linked to
HoxB, Lnp2 linked to HoxC, and Jazf2 linked to HoxD); in turn, the HoxD-linked
Atp5g3 is present in mammals but has been lost in elephant shark (Fig. 1b, 54).
The presence of Hox distal CREs within the introns of some of these lost
paralogs further demonstrate that the coding regions of Hox neighboring genes
were selectively lost, generating gene deserts in the process. In elephant shark,
two of the four conserved distal regulatory islands (I and II) of mouse HoxD
posterior desert are located inside the introns of the additional Jazf2 copy, in an
arrangement almost identical to that typically found in HoxA clusters
(Supplementary Figure 2). In fact, a pseudogenic relict of a Jafz2 exon is still
detectable in mouse (Supplementary Figure 2). Furthermore, part of the HoxD
global control region, the CsB element, has a paralogous copy in HoxA posterior
Nature Genetics: doi:10.1038/ng.3497

side inside the intron 4 of the gene Hibadh, implying that a paralog of this gene
was also present in the HoxD posterior neighborhood (Supplementary Figure 1, 12). Thus, HoxD ‘gene desert’ was originally occupied by a Hibadh2 and a Jazf2
genes, showing that HoxA and D genomic organisations are in fact almost
identical. In sum, these results show that the syntenic organisation of the four
clusters was originally very similar and the close linkage of most Hox neighboring
genes predate the WGDs.
Reconstruction of the syntenic arrangement around the Hox cluster of the pre-
WGD vertebrate ancestor.
Comparisons between the four paralogous clusters in different vertebrates
species allow us to infer that several Hox-neighboring genes were already
present around the single cluster of the pre-WGD vertebrate ancestor. We
recovered 6 genes that have at least 3 paralogous copies (Nfe2, Hnrnpa, Cbx1-
3-5, Calcoco, Atp5g and Creb). Five other genes only have one or two copies in
vertebrates (Copz, Skap, Smug1, Mtx2 and Lnp) but their locations and
orientations in amphioxus are almost identical to those of vertebrates, and
therefore their syntenic arrangement was already present in the chordate
ancestor (Fig. 1b). In the case of three other jawed vertebrate genes with less
than 3 copies, Hibadh, Jafz and Ube2z, a conserved tight linkage with their
closest vertebrate neighbor is also present in at least one additional species
outside vertebrates, indicating that they belong to ancestral microsyntenic pairs
that predate the origin of vertebrates (Supplementary Figure 3). Finally, for the
two remaining jawed vertebrate neighboring genes, Snx10-11 and Ttll6, we have
not found any data that could help to infer their status in the pre-WGD vertebrate
ancestor.
Most chordate Hox neighboring genes belong to the same ancestral Hox
macrosyntenic linkage group.
The majority of chordate Hox neighboring genes, including the conserved
anterior genes and the vertebrate and amphioxus specific posterior ones (Agps,
Nature Genetics: doi:10.1038/ng.3497
Copz, Nfe2, Skap, Smug1, Mtx2, Evx, Lnp, Hibadh, Calcoco, Jafz, Atp5g, Ube2z,
Creb, Nifk, Mdh1b, Dlgap1-4, Ubp1-Tfcp2, Asb1 and Gpatch8) are tightly linked
to at least another chordate neighboring gene in at least one non-chordate
species (Supplementary Figure 3). This indicates that they all belong to the same
ancestral large macrosyntenic linkage group that also contained the Hox cluster
(or the putative Hox ‘ghost’ locus, in the case of placozoans 55) as well as
additional related ANTP homeobox genes (such as Evx, Mnx, Dlx and Meox),
and some other genes showing conserved Hox macrosyntenic associations in
different non vertebrate species (Elac1, Mcm6, Tmem169, Nhej1, Smarcc,
Myd98, Supplementary Figure 3). In general, these inferred ancestral linkages
between different neighboring genes and the Hox cluster and between
neighboring genes with other neighboring genes show an extremely patchy
phylogenetic distribution: most of these syntenic associations have been heavily
reshuffled in different animal lineages and gene order and orientations are highly
variable. Thus, although all these genes were probably located in the same Hox
chromosome in the bilaterian ancestor, in most phyla their linkage has only been
maintained at the macrosyntenic level.
Supplementary References 54. Ravi, V. et al. Elephant shark (Callorhinchus milii) provides insights into
the evolution of Hox gene clusters in gnathostomes. Proc Natl Acad Sci U S A 106, 16327-32 (2009).
55. Mendivil Ramos, O., Barker, D. & Ferrier, D.E. Ghost loci imply Hox and ParaHox existence in the last common ancestor of animals. Curr Biol 22, 1951-6 (2012).
Nature Genetics: doi:10.1038/ng.3497