Embed Size (px)
Citation preview
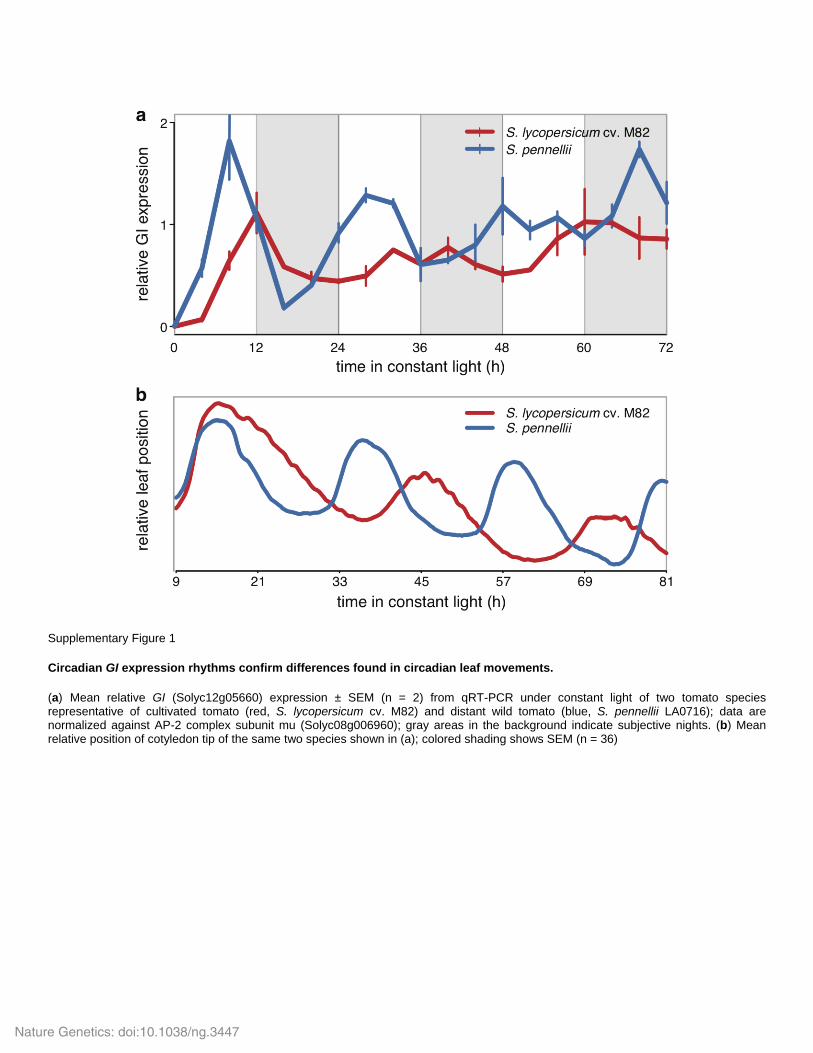
Supplementary Figure 1
Circadian GI expression rhythms confirm differences found in circadian leaf movements.
(a) Mean relative GI (Solyc12g05660) expression ± SEM (n = 2) from qRT-PCR under constant light of two tomato species representative of cultivated tomato (red, S. lycopersicum cv. M82) and distant wild tomato (blue, S. pennellii LA0716); data are normalized against AP-2 complex subunit mu (Solyc08g006960); gray areas in the background indicate subjective nights. (b) Mean relative position of cotyledon tip of the same two species shown in (a); colored shading shows SEM (n = 36)
Nature Genetics: doi:10.1038/ng.3447
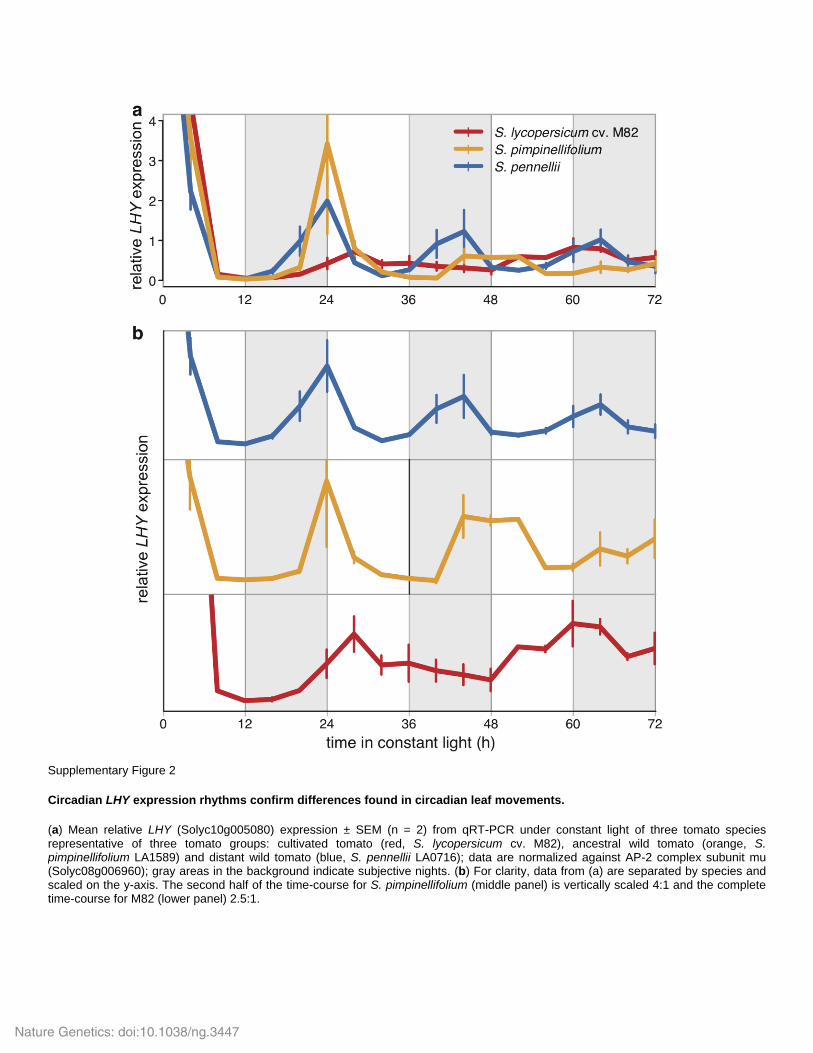
Supplementary Figure 2
Circadian LHY expression rhythms confirm differences found in circadian leaf movements.
(a) Mean relative LHY (Solyc10g005080) expression ± SEM (n = 2) from qRT-PCR under constant light of three tomato species representative of three tomato groups: cultivated tomato (red, S. lycopersicum cv. M82), ancestral wild tomato (orange, S. pimpinellifolium LA1589) and distant wild tomato (blue, S. pennellii LA0716); data are normalized against AP-2 complex subunit mu (Solyc08g006960); gray areas in the background indicate subjective nights. (b) For clarity, data from (a) are separated by species and scaled on the y-axis. The second half of the time-course for S. pimpinellifolium (middle panel) is vertically scaled 4:1 and the complete time-course for M82 (lower panel) 2.5:1.
Nature Genetics: doi:10.1038/ng.3447
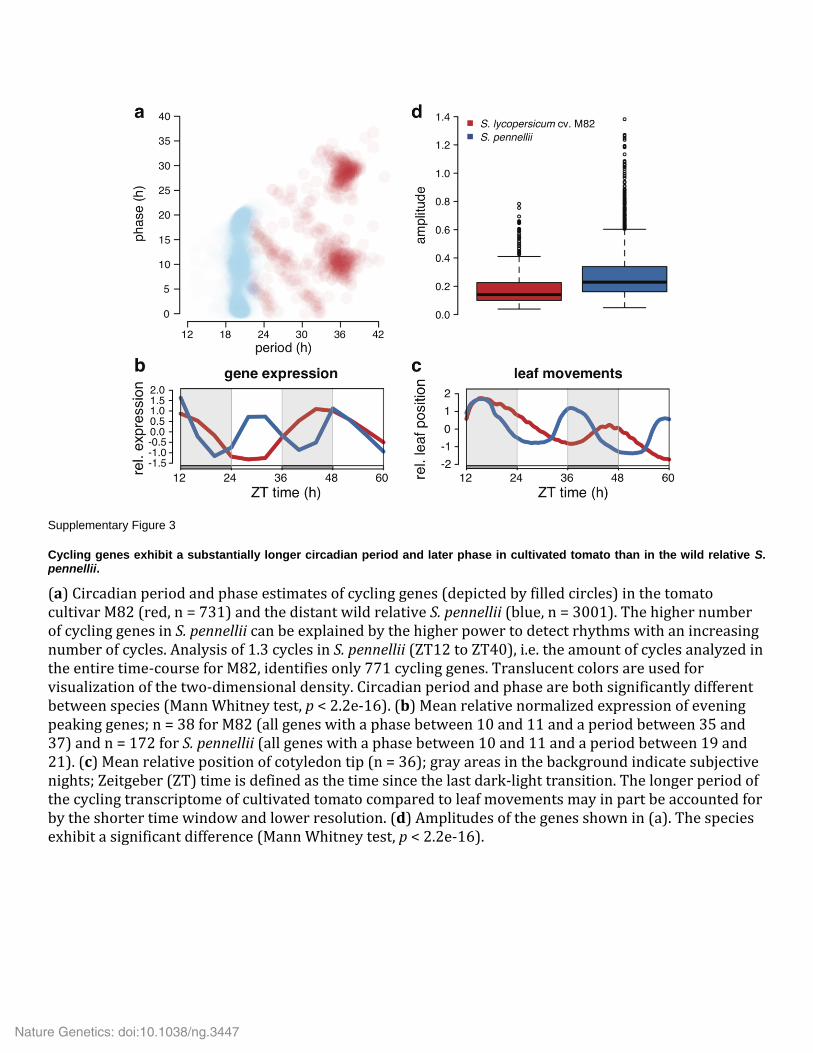
Supplementary Figure 3
Cycling genes exhibit a substantially longer circadian period and later phase in cultivated tomato than in the wild relative S. pennellii.
(a) Circadian period and phase estimates of cycling genes (depicted by filled circles) in the tomato cultivar M82 (red, n = 731) and the distant wild relative S. pennellii (blue, n = 3001). The higher number of cycling genes in S. pennellii can be explained by the higher power to detect rhythms with an increasing number of cycles. Analysis of 1.3 cycles in S. pennellii (ZT12 to ZT40), i.e. the amount of cycles analyzed in the entire time-course for M82, identifies only 771 cycling genes. Translucent colors are used for visualization of the two-dimensional density. Circadian period and phase are both significantly different between species (Mann Whitney test, p < 2.2e-16). (b) Mean relative normalized expression of evening peaking genes; n = 38 for M82 (all genes with a phase between 10 and 11 and a period between 35 and 37) and n = 172 for S. pennellii (all genes with a phase between 10 and 11 and a period between 19 and 21). (c) Mean relative position of cotyledon tip (n = 36); gray areas in the background indicate subjective nights; Zeitgeber (ZT) time is defined as the time since the last dark-light transition. The longer period of the cycling transcriptome of cultivated tomato compared to leaf movements may in part be accounted for by the shorter time window and lower resolution. (d) Amplitudes of the genes shown in (a). The species exhibit a significant difference (Mann Whitney test, p < 2.2e-16).
Nature Genetics: doi:10.1038/ng.3447
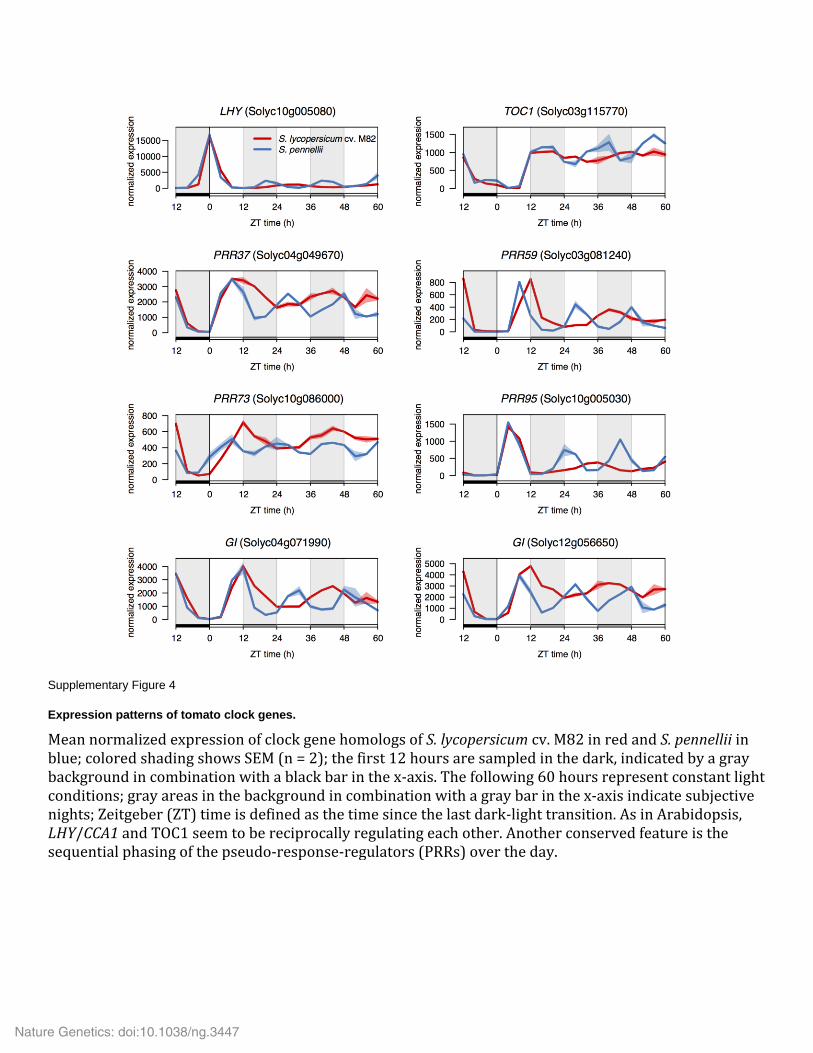
Supplementary Figure 4
Expression patterns of tomato clock genes.
Mean normalized expression of clock gene homologs of S. lycopersicum cv. M82 in red and S. pennellii in blue; colored shading shows SEM (n = 2); the first 12 hours are sampled in the dark, indicated by a gray background in combination with a black bar in the x-axis. The following 60 hours represent constant light conditions; gray areas in the background in combination with a gray bar in the x-axis indicate subjective nights; Zeitgeber (ZT) time is defined as the time since the last dark-light transition. As in Arabidopsis, LHY/CCA1 and TOC1 seem to be reciprocally regulating each other. Another conserved feature is the sequential phasing of the pseudo-response-regulators (PRRs) over the day.
Nature Genetics: doi:10.1038/ng.3447
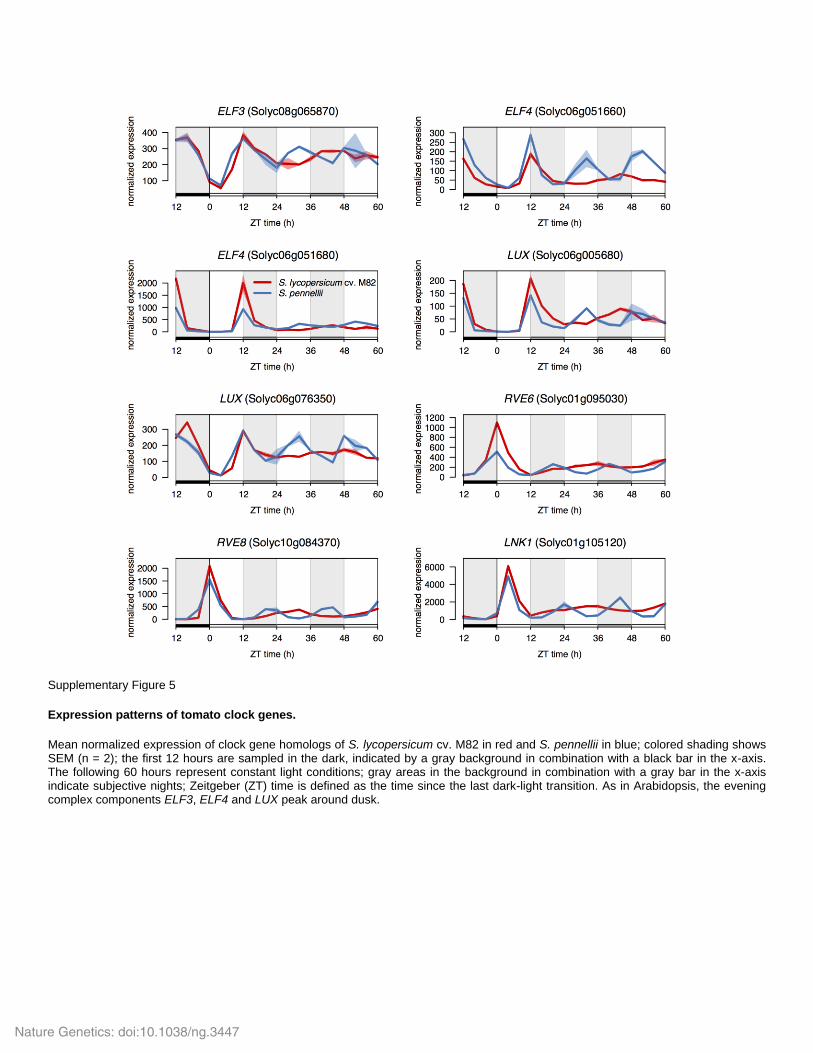
Supplementary Figure 5
Expression patterns of tomato clock genes.
Mean normalized expression of clock gene homologs of S. lycopersicum cv. M82 in red and S. pennellii in blue; colored shading shows SEM (n = 2); the first 12 hours are sampled in the dark, indicated by a gray background in combination with a black bar in the x-axis. The following 60 hours represent constant light conditions; gray areas in the background in combination with a gray bar in the x-axis indicate subjective nights; Zeitgeber (ZT) time is defined as the time since the last dark-light transition. As in Arabidopsis, the evening complex components ELF3, ELF4 and LUX peak around dusk.
Nature Genetics: doi:10.1038/ng.3447
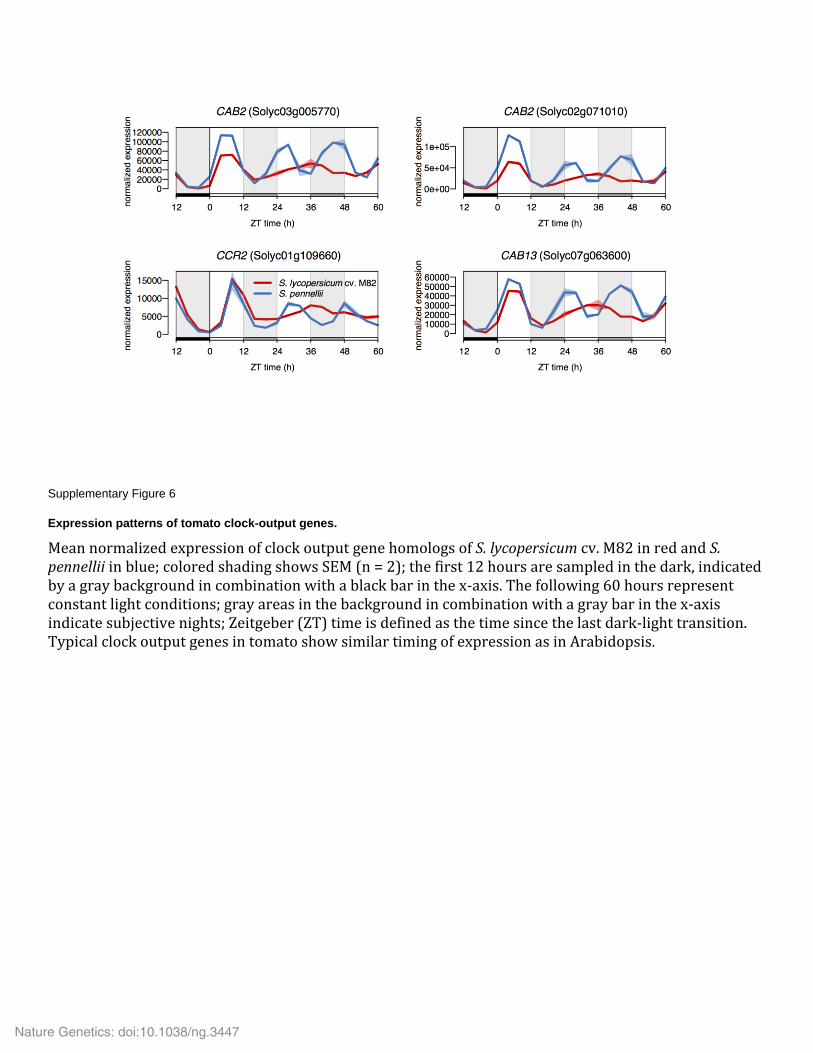
Supplementary Figure 6
Expression patterns of tomato clock-output genes.
Mean normalized expression of clock output gene homologs of S. lycopersicum cv. M82 in red and S. pennellii in blue; colored shading shows SEM (n = 2); the first 12 hours are sampled in the dark, indicated by a gray background in combination with a black bar in the x-axis. The following 60 hours represent constant light conditions; gray areas in the background in combination with a gray bar in the x-axis indicate subjective nights; Zeitgeber (ZT) time is defined as the time since the last dark-light transition. Typical clock output genes in tomato show similar timing of expression as in Arabidopsis.
Nature Genetics: doi:10.1038/ng.3447
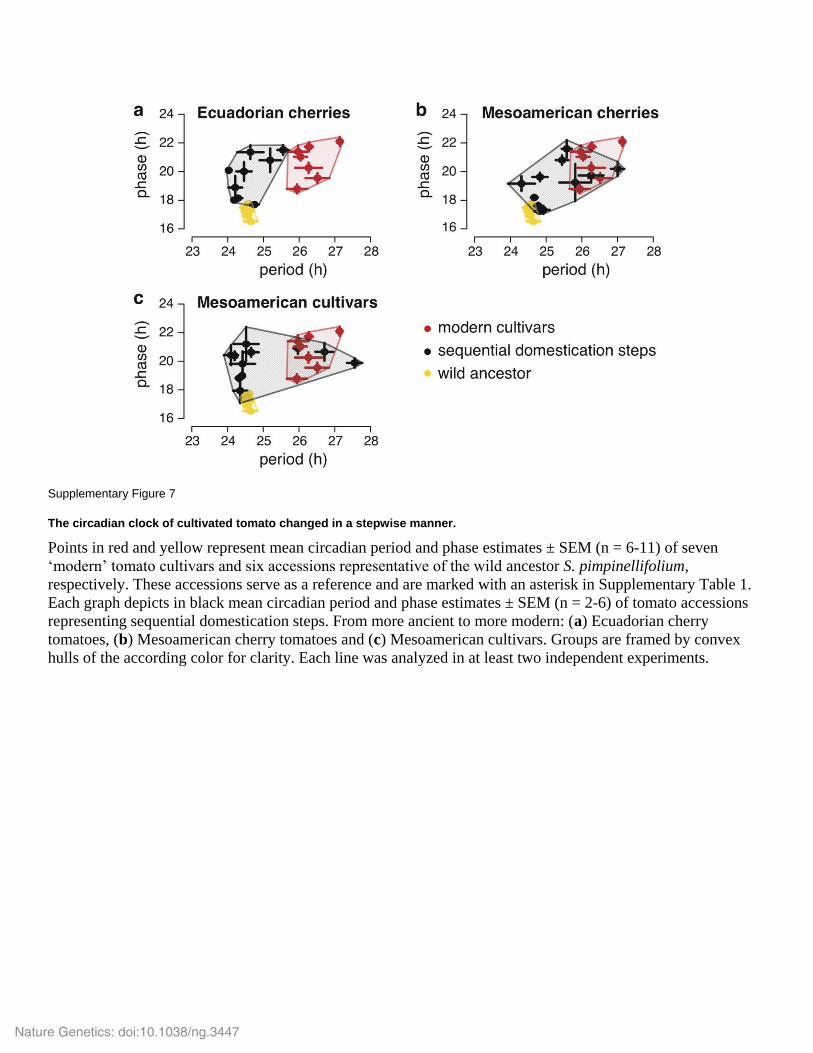
Supplementary Figure 7
The circadian clock of cultivated tomato changed in a stepwise manner.
Points in red and yellow represent mean circadian period and phase estimates ± SEM (n = 6-11) of seven
‘modern’ tomato cultivars and six accessions representative of the wild ancestor S. pimpinellifolium,
respectively. These accessions serve as a reference and are marked with an asterisk in Supplementary Table 1.
Each graph depicts in black mean circadian period and phase estimates ± SEM (n = 2-6) of tomato accessions
representing sequential domestication steps. From more ancient to more modern: (a) Ecuadorian cherry
tomatoes, (b) Mesoamerican cherry tomatoes and (c) Mesoamerican cultivars. Groups are framed by convex
hulls of the according color for clarity. Each line was analyzed in at least two independent experiments.
Nature Genetics: doi:10.1038/ng.3447
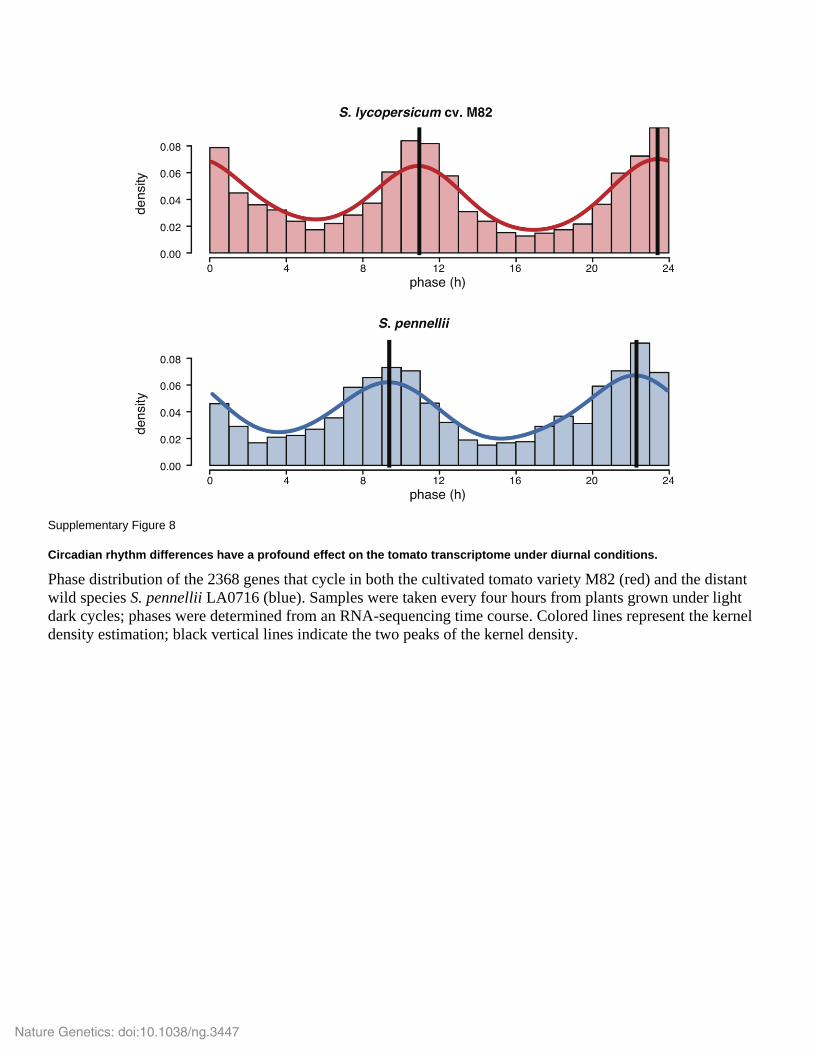
Supplementary Figure 8
Circadian rhythm differences have a profound effect on the tomato transcriptome under diurnal conditions.
Phase distribution of the 2368 genes that cycle in both the cultivated tomato variety M82 (red) and the distant
wild species S. pennellii LA0716 (blue). Samples were taken every four hours from plants grown under light
dark cycles; phases were determined from an RNA-sequencing time course. Colored lines represent the kernel
density estimation; black vertical lines indicate the two peaks of the kernel density.
Nature Genetics: doi:10.1038/ng.3447
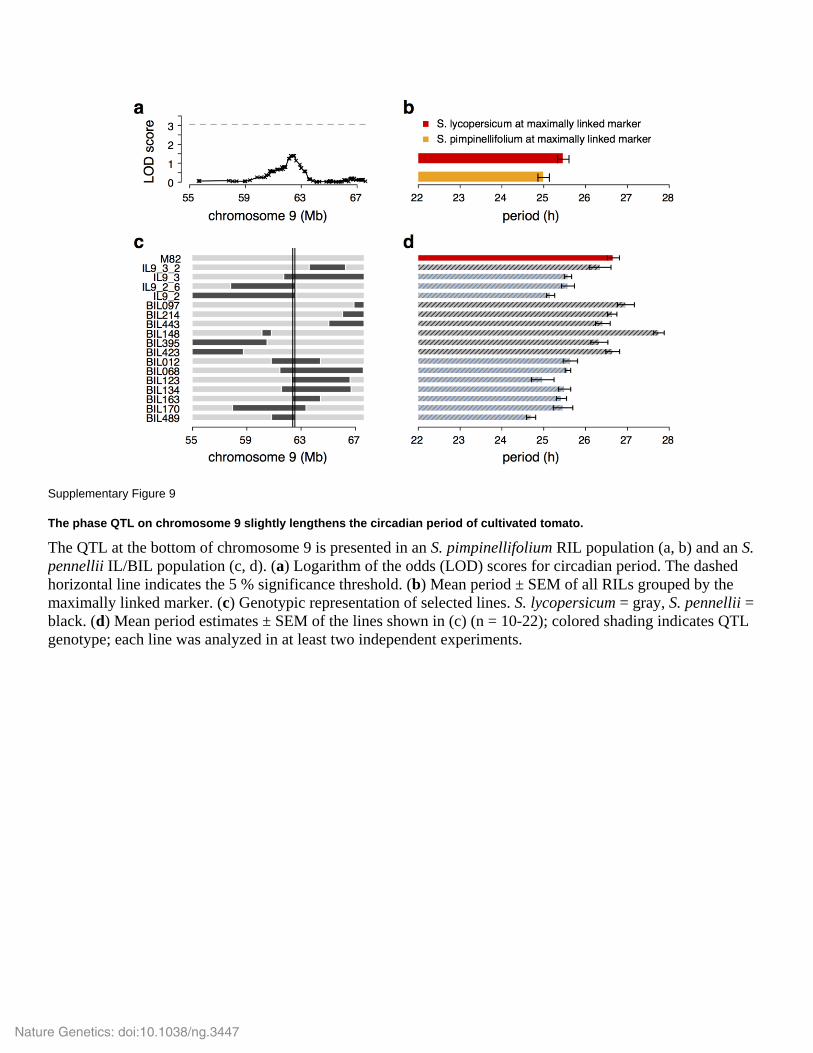
Supplementary Figure 9
The phase QTL on chromosome 9 slightly lengthens the circadian period of cultivated tomato.
The QTL at the bottom of chromosome 9 is presented in an S. pimpinellifolium RIL population (a, b) and an S.
pennellii IL/BIL population (c, d). (a) Logarithm of the odds (LOD) scores for circadian period. The dashed
horizontal line indicates the 5 % significance threshold. (b) Mean period ± SEM of all RILs grouped by the
maximally linked marker. (c) Genotypic representation of selected lines. S. lycopersicum = gray, S. pennellii =
black. (d) Mean period estimates ± SEM of the lines shown in (c) (n = 10-22); colored shading indicates QTL
genotype; each line was analyzed in at least two independent experiments.
Nature Genetics: doi:10.1038/ng.3447
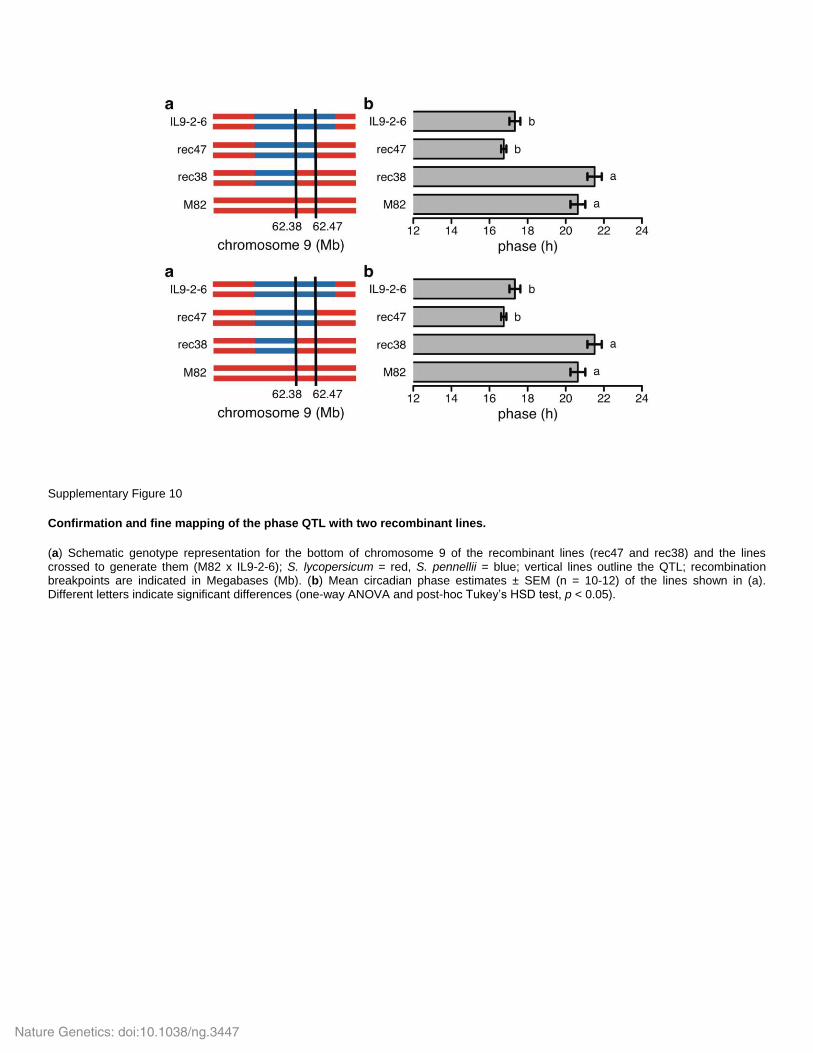
Supplementary Figure 10
Confirmation and fine mapping of the phase QTL with two recombinant lines.
(a) Schematic genotype representation for the bottom of chromosome 9 of the recombinant lines (rec47 and rec38) and the lines crossed to generate them (M82 x IL9-2-6); S. lycopersicum = red, S. pennellii = blue; vertical lines outline the QTL; recombination breakpoints are indicated in Megabases (Mb). (b) Mean circadian phase estimates ± SEM (n = 10-12) of the lines shown in (a). Different letters indicate significant differences (one-way ANOVA and post-hoc Tukey’s HSD test, p < 0.05).
Nature Genetics: doi:10.1038/ng.3447
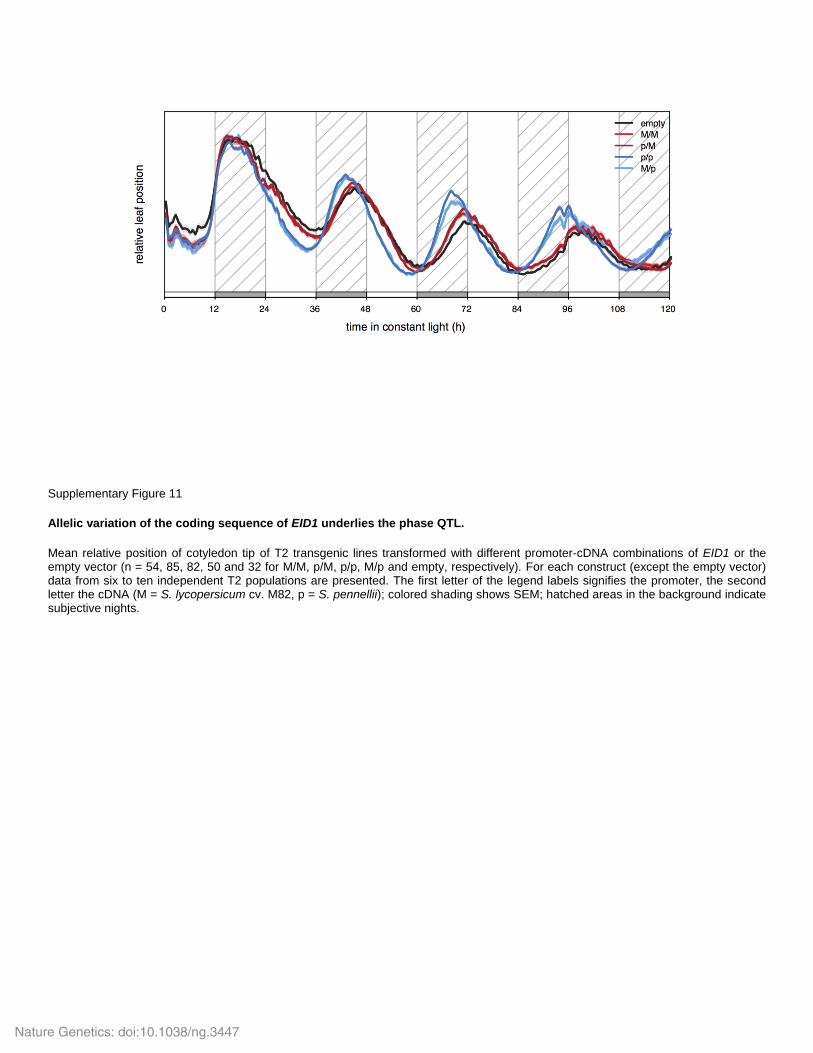
Supplementary Figure 11
Allelic variation of the coding sequence of EID1 underlies the phase QTL.
Mean relative position of cotyledon tip of T2 transgenic lines transformed with different promoter-cDNA combinations of EID1 or the empty vector (n = 54, 85, 82, 50 and 32 for M/M, p/M, p/p, M/p and empty, respectively). For each construct (except the empty vector) data from six to ten independent T2 populations are presented. The first letter of the legend labels signifies the promoter, the second letter the cDNA (M = S. lycopersicum cv. M82, p = S. pennellii); colored shading shows SEM; hatched areas in the background indicate subjective nights.
Nature Genetics: doi:10.1038/ng.3447
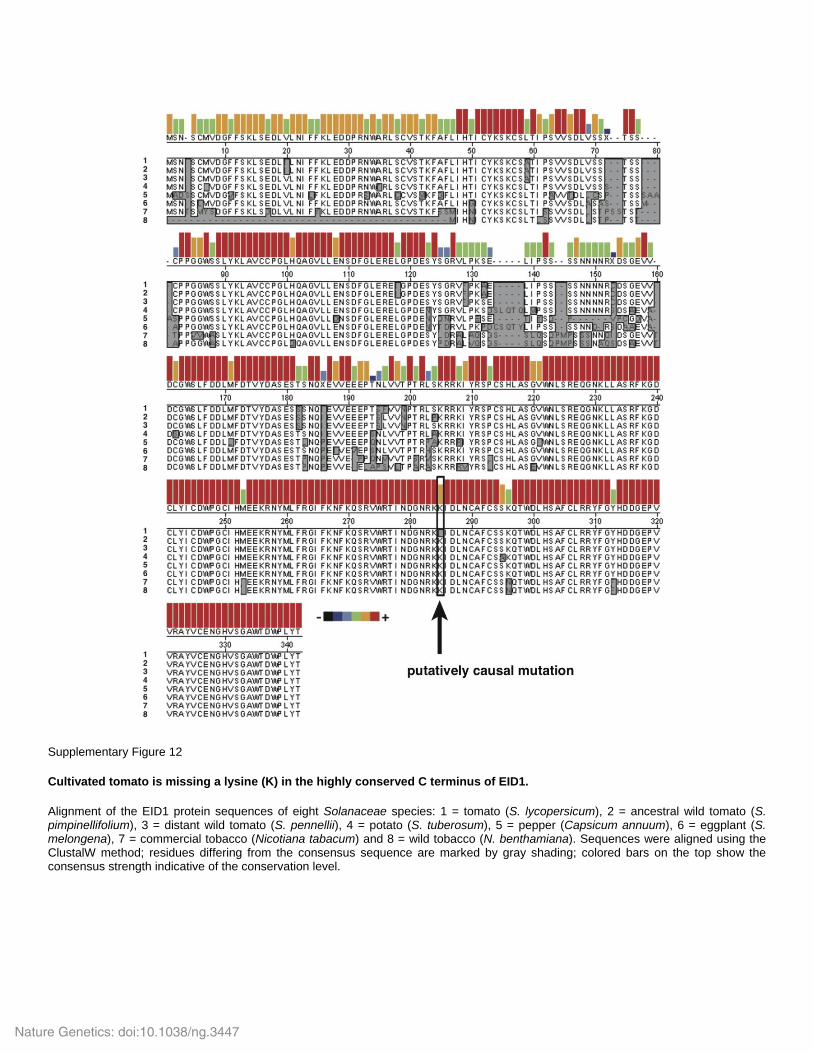
Supplementary Figure 12
Cultivated tomato is missing a lysine (K) in the highly conserved C terminus of EID1.
Alignment of the EID1 protein sequences of eight Solanaceae species: 1 = tomato (S. lycopersicum), 2 = ancestral wild tomato (S. pimpinellifolium), 3 = distant wild tomato (S. pennellii), 4 = potato (S. tuberosum), 5 = pepper (Capsicum annuum), 6 = eggplant (S. melongena), 7 = commercial tobacco (Nicotiana tabacum) and 8 = wild tobacco (N. benthamiana). Sequences were aligned using the ClustalW method; residues differing from the consensus sequence are marked by gray shading; colored bars on the top show the consensus strength indicative of the conservation level.
Nature Genetics: doi:10.1038/ng.3447
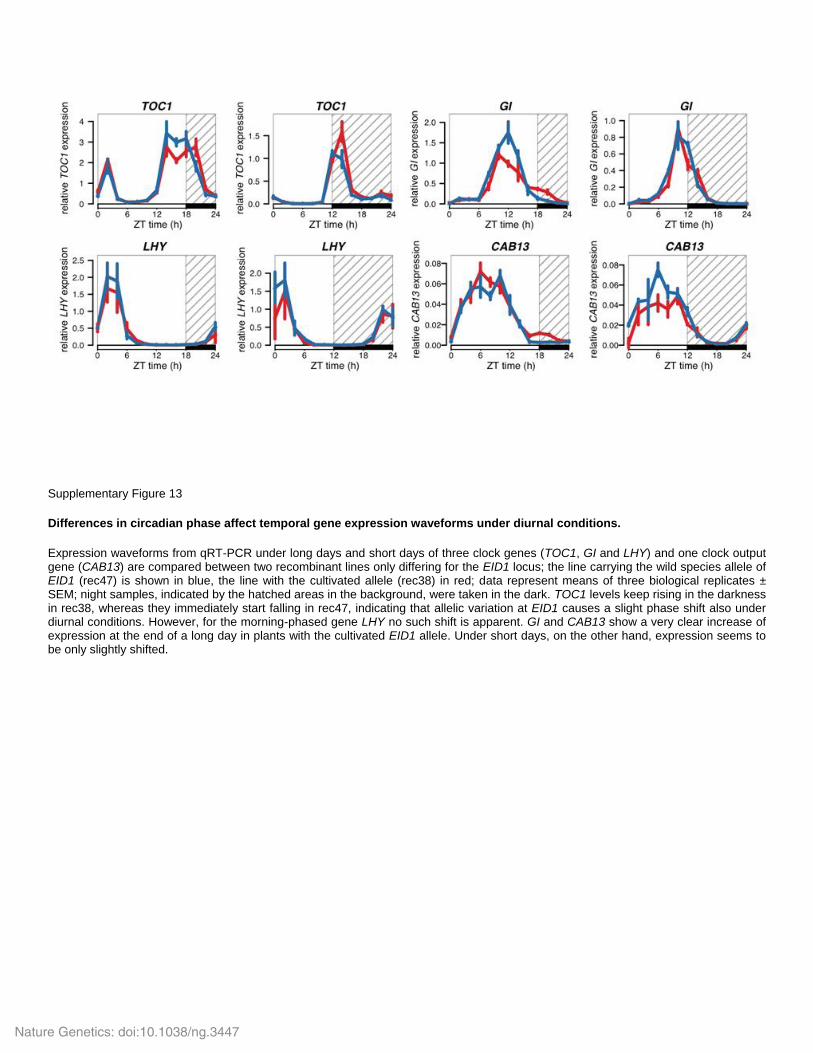
Supplementary Figure 13
Differences in circadian phase affect temporal gene expression waveforms under diurnal conditions.
Expression waveforms from qRT-PCR under long days and short days of three clock genes (TOC1, GI and LHY) and one clock output gene (CAB13) are compared between two recombinant lines only differing for the EID1 locus; the line carrying the wild species allele of EID1 (rec47) is shown in blue, the line with the cultivated allele (rec38) in red; data represent means of three biological replicates ± SEM; night samples, indicated by the hatched areas in the background, were taken in the dark. TOC1 levels keep rising in the darkness in rec38, whereas they immediately start falling in rec47, indicating that allelic variation at EID1 causes a slight phase shift also under diurnal conditions. However, for the morning-phased gene LHY no such shift is apparent. GI and CAB13 show a very clear increase of expression at the end of a long day in plants with the cultivated EID1 allele. Under short days, on the other hand, expression seems to be only slightly shifted.
Nature Genetics: doi:10.1038/ng.3447
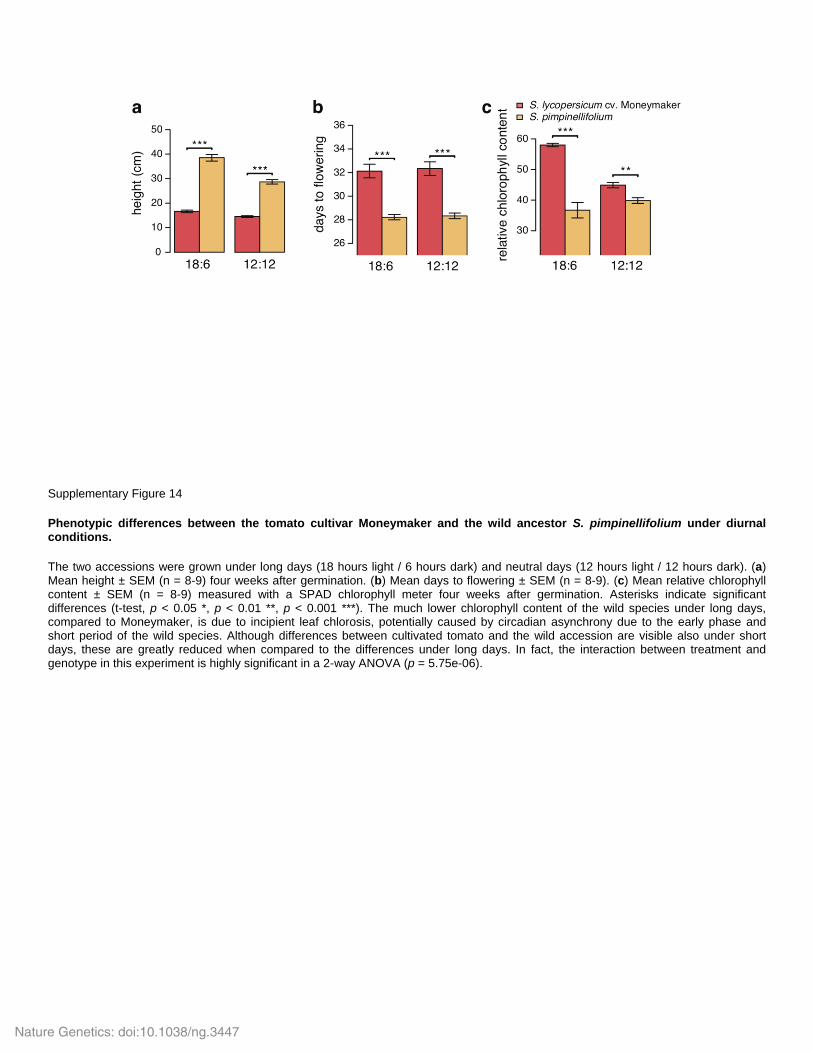
Supplementary Figure 14
Phenotypic differences between the tomato cultivar Moneymaker and the wild ancestor S. pimpinellifolium under diurnal conditions.
The two accessions were grown under long days (18 hours light / 6 hours dark) and neutral days (12 hours light / 12 hours dark). (a) Mean height ± SEM (n = 8-9) four weeks after germination. (b) Mean days to flowering ± SEM (n = 8-9). (c) Mean relative chlorophyll content ± SEM (n = 8-9) measured with a SPAD chlorophyll meter four weeks after germination. Asterisks indicate significant differences (t-test, p < 0.05 *, p < 0.01 **, p < 0.001 ***). The much lower chlorophyll content of the wild species under long days, compared to Moneymaker, is due to incipient leaf chlorosis, potentially caused by circadian asynchrony due to the early phase and short period of the wild species. Although differences between cultivated tomato and the wild accession are visible also under short days, these are greatly reduced when compared to the differences under long days. In fact, the interaction between treatment and genotype in this experiment is highly significant in a 2-way ANOVA (p = 5.75e-06).
Nature Genetics: doi:10.1038/ng.3447
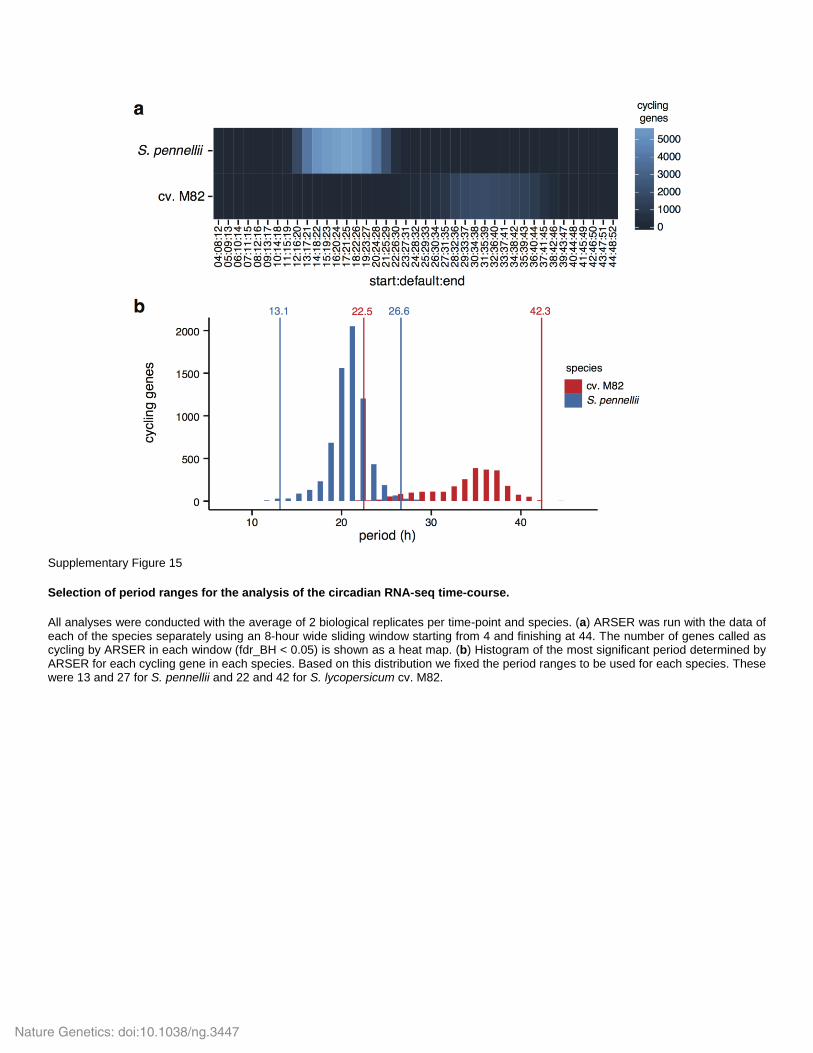
Supplementary Figure 15
Selection of period ranges for the analysis of the circadian RNA-seq time-course.
All analyses were conducted with the average of 2 biological replicates per time-point and species. (a) ARSER was run with the data of each of the species separately using an 8-hour wide sliding window starting from 4 and finishing at 44. The number of genes called as cycling by ARSER in each window (fdr_BH < 0.05) is shown as a heat map. (b) Histogram of the most significant period determined by ARSER for each cycling gene in each species. Based on this distribution we fixed the period ranges to be used for each species. These were 13 and 27 for S. pennellii and 22 and 42 for S. lycopersicum cv. M82.
Nature Genetics: doi:10.1038/ng.3447
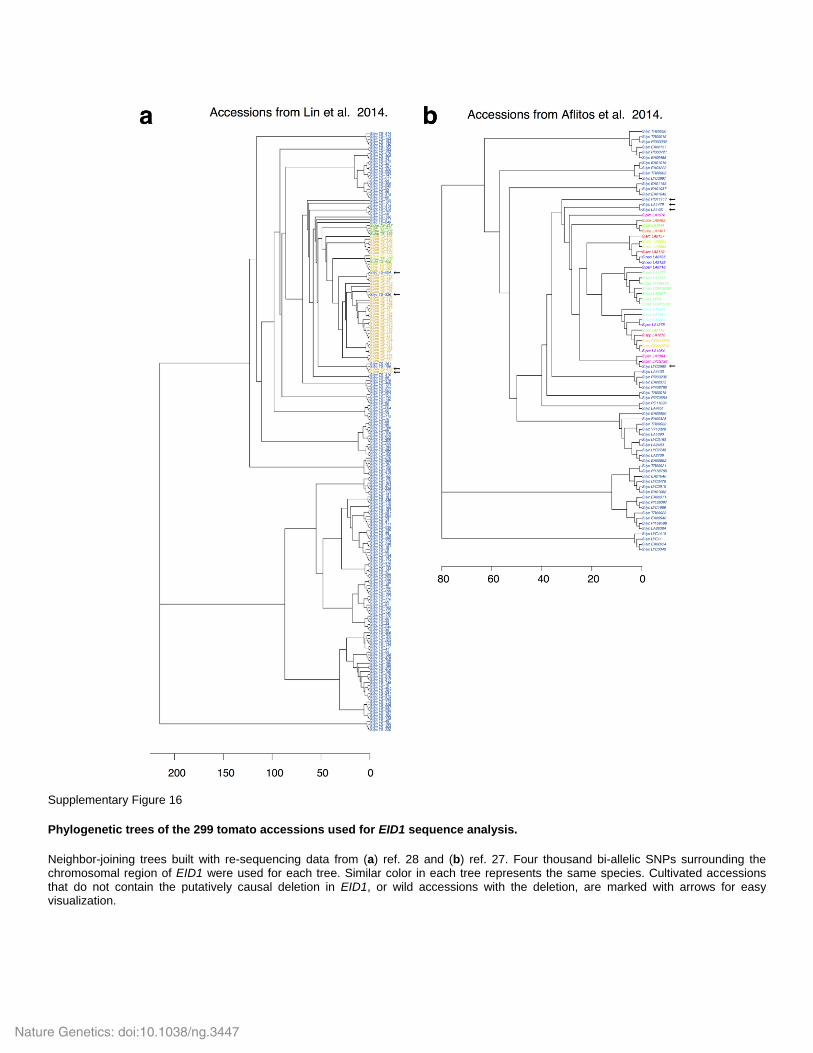
Supplementary Figure 16
Phylogenetic trees of the 299 tomato accessions used for EID1 sequence analysis.
Neighbor-joining trees built with re-sequencing data from (a) ref. 28 and (b) ref. 27. Four thousand bi-allelic SNPs surrounding the chromosomal region of EID1 were used for each tree. Similar color in each tree represents the same species. Cultivated accessions that do not contain the putatively causal deletion in EID1, or wild accessions with the deletion, are marked with arrows for easy visualization.
Nature Genetics: doi:10.1038/ng.3447
1
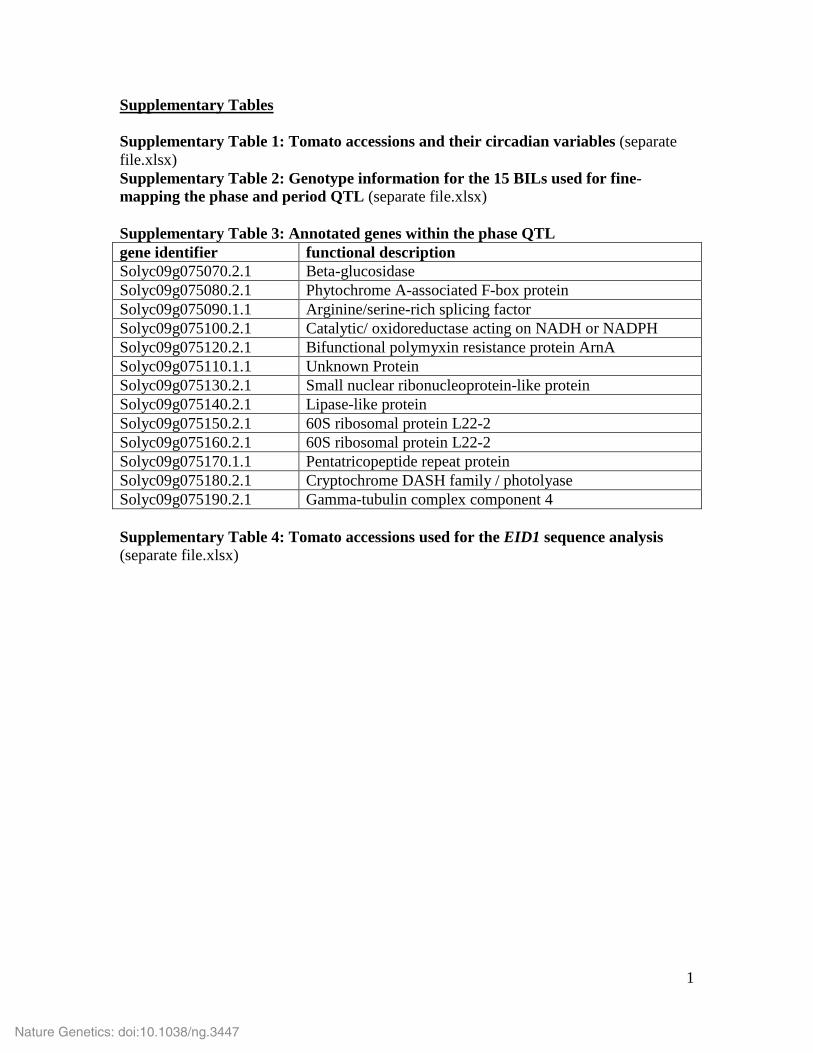
Supplementary Tables Supplementary Table 1: Tomato accessions and their circadian variables (separate file.xlsx) Supplementary Table 2: Genotype information for the 15 BILs used for fine-mapping the phase and period QTL (separate file.xlsx) Supplementary Table 3: Annotated genes within the phase QTL gene identifier functional description Solyc09g075070.2.1 Beta-glucosidase Solyc09g075080.2.1 Phytochrome A-associated F-box protein Solyc09g075090.1.1 Arginine/serine-rich splicing factor Solyc09g075100.2.1 Catalytic/ oxidoreductase acting on NADH or NADPH Solyc09g075120.2.1 Bifunctional polymyxin resistance protein ArnA Solyc09g075110.1.1 Unknown Protein Solyc09g075130.2.1 Small nuclear ribonucleoprotein-like protein Solyc09g075140.2.1 Lipase-like protein Solyc09g075150.2.1 60S ribosomal protein L22-2 Solyc09g075160.2.1 60S ribosomal protein L22-2 Solyc09g075170.1.1 Pentatricopeptide repeat protein Solyc09g075180.2.1 Cryptochrome DASH family / photolyase Solyc09g075190.2.1 Gamma-tubulin complex component 4 Supplementary Table 4: Tomato accessions used for the EID1 sequence analysis (separate file.xlsx)
Nature Genetics: doi:10.1038/ng.3447
2
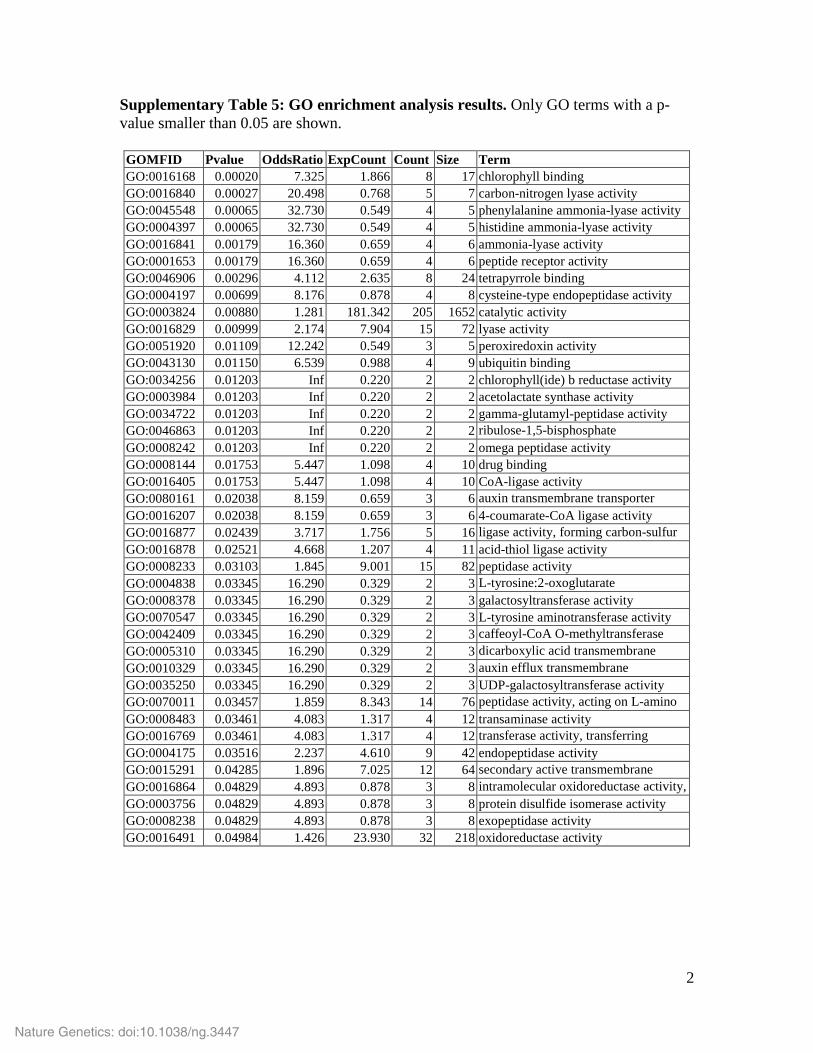
Supplementary Table 5: GO enrichment analysis results. Only GO terms with a p-value smaller than 0.05 are shown. GOMFID Pvalue OddsRatio ExpCount Count Size Term GO:0016168 0.00020 7.325 1.866 8 17 chlorophyll binding GO:0016840 0.00027 20.498 0.768 5 7 carbon-nitrogen lyase activity GO:0045548 0.00065 32.730 0.549 4 5 phenylalanine ammonia-lyase activity GO:0004397 0.00065 32.730 0.549 4 5 histidine ammonia-lyase activity GO:0016841 0.00179 16.360 0.659 4 6 ammonia-lyase activity GO:0001653 0.00179 16.360 0.659 4 6 peptide receptor activity GO:0046906 0.00296 4.112 2.635 8 24 tetrapyrrole binding GO:0004197 0.00699 8.176 0.878 4 8 cysteine-type endopeptidase activity GO:0003824 0.00880 1.281 181.342 205 1652 catalytic activity GO:0016829 0.00999 2.174 7.904 15 72 lyase activity GO:0051920 0.01109 12.242 0.549 3 5 peroxiredoxin activity GO:0043130 0.01150 6.539 0.988 4 9 ubiquitin binding GO:0034256 0.01203 Inf 0.220 2 2 chlorophyll(ide) b reductase activity GO:0003984 0.01203 Inf 0.220 2 2 acetolactate synthase activity GO:0034722 0.01203 Inf 0.220 2 2 gamma-glutamyl-peptidase activity GO:0046863 0.01203 Inf 0.220 2 2 ribulose-1,5-bisphosphate
GO:0008242 0.01203 Inf 0.220 2 2 omega peptidase activity GO:0008144 0.01753 5.447 1.098 4 10 drug binding GO:0016405 0.01753 5.447 1.098 4 10 CoA-ligase activity GO:0080161 0.02038 8.159 0.659 3 6 auxin transmembrane transporter
GO:0016207 0.02038 8.159 0.659 3 6 4-coumarate-CoA ligase activity GO:0016877 0.02439 3.717 1.756 5 16 ligase activity, forming carbon-sulfur
GO:0016878 0.02521 4.668 1.207 4 11 acid-thiol ligase activity GO:0008233 0.03103 1.845 9.001 15 82 peptidase activity GO:0004838 0.03345 16.290 0.329 2 3 L-tyrosine:2-oxoglutarate
GO:0008378 0.03345 16.290 0.329 2 3 galactosyltransferase activity GO:0070547 0.03345 16.290 0.329 2 3 L-tyrosine aminotransferase activity GO:0042409 0.03345 16.290 0.329 2 3 caffeoyl-CoA O-methyltransferase
GO:0005310 0.03345 16.290 0.329 2 3 dicarboxylic acid transmembrane GO:0010329 0.03345 16.290 0.329 2 3 auxin efflux transmembrane GO:0035250 0.03345 16.290 0.329 2 3 UDP-galactosyltransferase activity
GO:0070011 0.03457 1.859 8.343 14 76 peptidase activity, acting on L-amino GO:0008483 0.03461 4.083 1.317 4 12 transaminase activity
GO:0016769 0.03461 4.083 1.317 4 12 transferase activity, transferring GO:0004175 0.03516 2.237 4.610 9 42 endopeptidase activity
GO:0015291 0.04285 1.896 7.025 12 64 secondary active transmembrane GO:0016864 0.04829 4.893 0.878 3 8 intramolecular oxidoreductase activity, GO:0003756 0.04829 4.893 0.878 3 8 protein disulfide isomerase activity
GO:0008238 0.04829 4.893 0.878 3 8 exopeptidase activity GO:0016491 0.04984 1.426 23.930 32 218 oxidoreductase activity
Nature Genetics: doi:10.1038/ng.3447
3
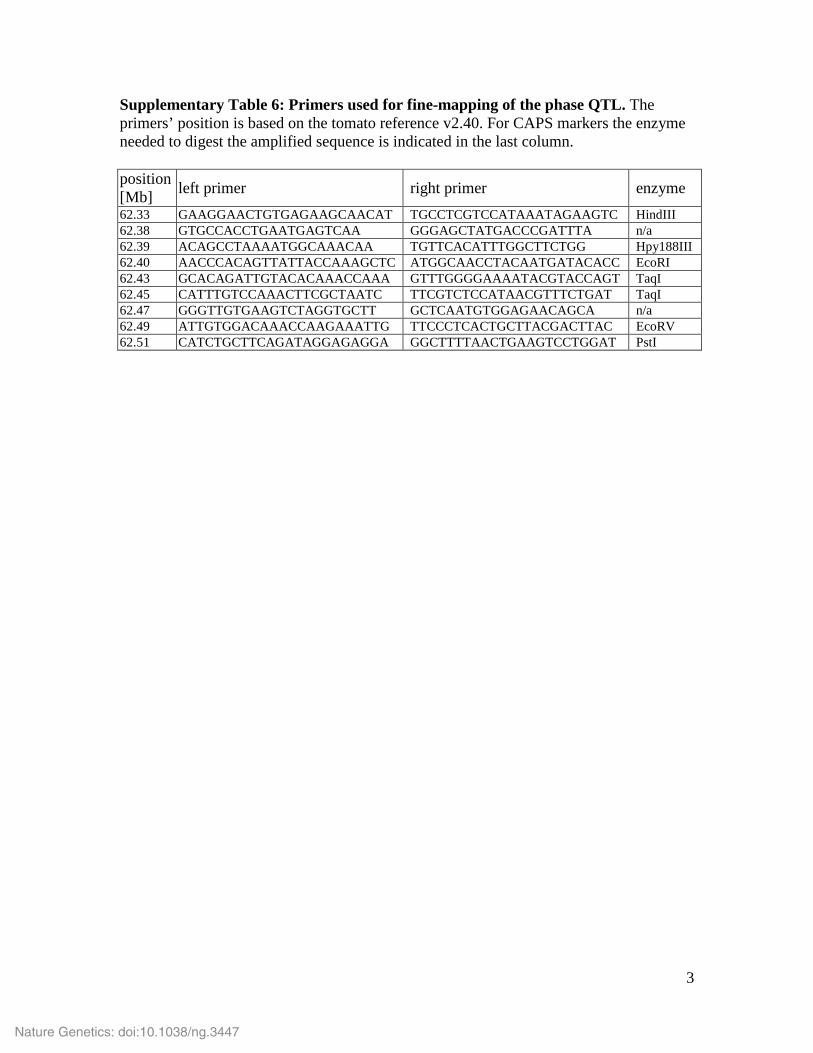
Supplementary Table 6: Primers used for fine-mapping of the phase QTL. The primers’ position is based on the tomato reference v2.40. For CAPS markers the enzyme needed to digest the amplified sequence is indicated in the last column. position [Mb]
left primer right primer enzyme 62.33 GAAGGAACTGTGAGAAGCAACAT TGCCTCGTCCATAAATAGAAGTC HindIII 62.38 GTGCCACCTGAATGAGTCAA GGGAGCTATGACCCGATTTA n/a 62.39 ACAGCCTAAAATGGCAAACAA TGTTCACATTTGGCTTCTGG Hpy188III 62.40 AACCCACAGTTATTACCAAAGCTC ATGGCAACCTACAATGATACACC EcoRI 62.43 GCACAGATTGTACACAAACCAAA GTTTGGGGAAAATACGTACCAGT TaqI 62.45 CATTTGTCCAAACTTCGCTAATC TTCGTCTCCATAACGTTTCTGAT TaqI 62.47 GGGTTGTGAAGTCTAGGTGCTT GCTCAATGTGGAGAACAGCA n/a 62.49 ATTGTGGACAAACCAAGAAATTG TTCCCTCACTGCTTACGACTTAC EcoRV 62.51 CATCTGCTTCAGATAGGAGAGGA GGCTTTTAACTGAAGTCCTGGAT PstI
Nature Genetics: doi:10.1038/ng.3447
4
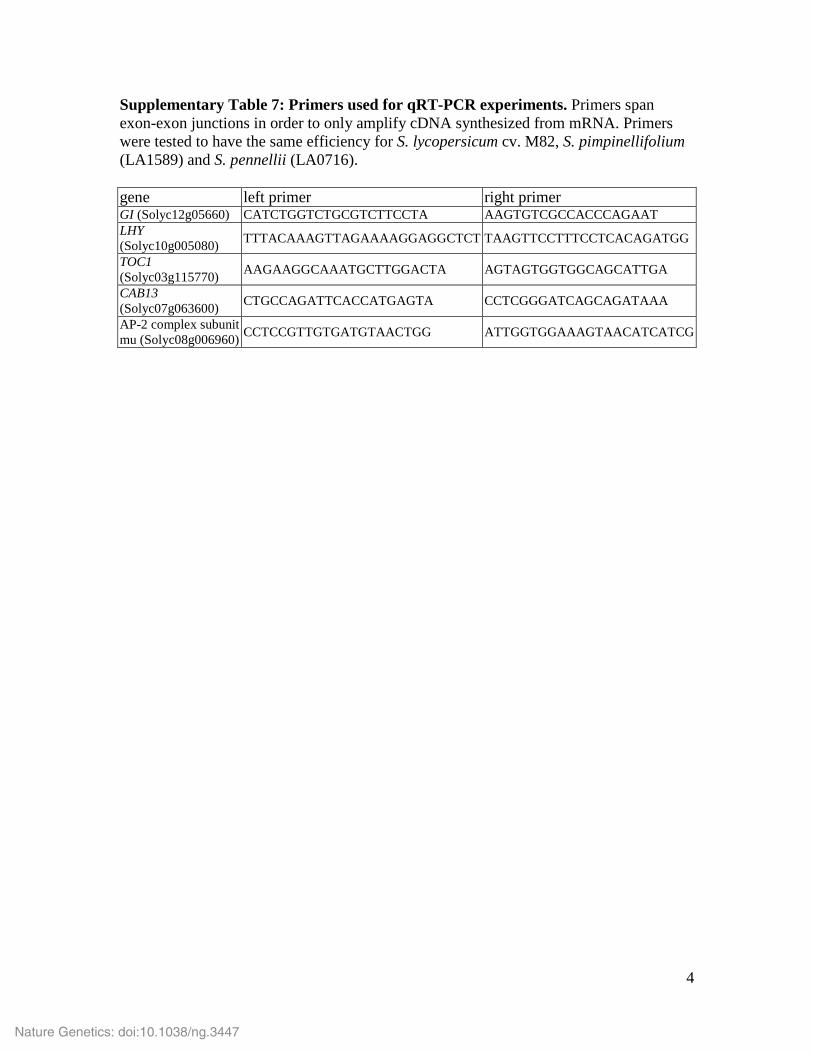
Supplementary Table 7: Primers used for qRT-PCR experiments. Primers span exon-exon junctions in order to only amplify cDNA synthesized from mRNA. Primers were tested to have the same efficiency for S. lycopersicum cv. M82, S. pimpinellifolium (LA1589) and S. pennellii (LA0716). gene left primer right primer GI (Solyc12g05660) CATCTGGTCTGCGTCTTCCTA AAGTGTCGCCACCCAGAAT LHY (Solyc10g005080) TTTACAAAGTTAGAAAAGGAGGCTCT TAAGTTCCTTTCCTCACAGATGG
TOC1 (Solyc03g115770) AAGAAGGCAAATGCTTGGACTA AGTAGTGGTGGCAGCATTGA
CAB13 (Solyc07g063600) CTGCCAGATTCACCATGAGTA CCTCGGGATCAGCAGATAAA
AP-2 complex subunit mu (Solyc08g006960) CCTCCGTTGTGATGTAACTGG ATTGGTGGAAAGTAACATCATCG
Nature Genetics: doi:10.1038/ng.3447
5
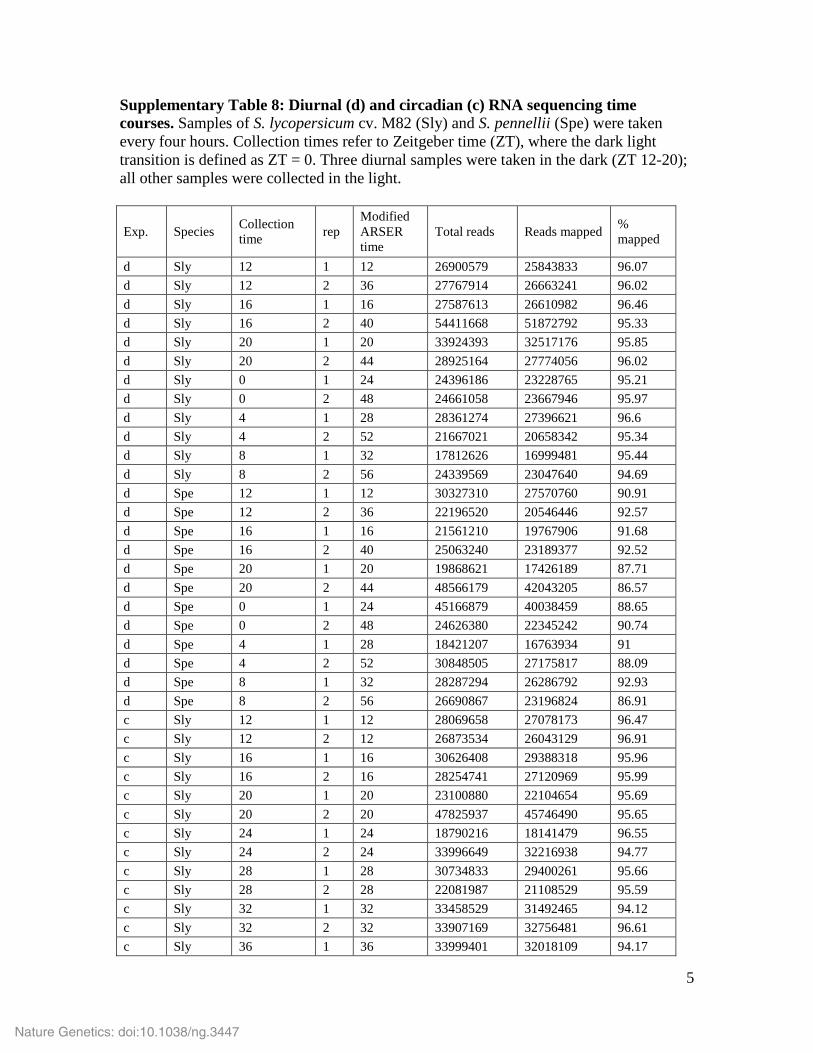
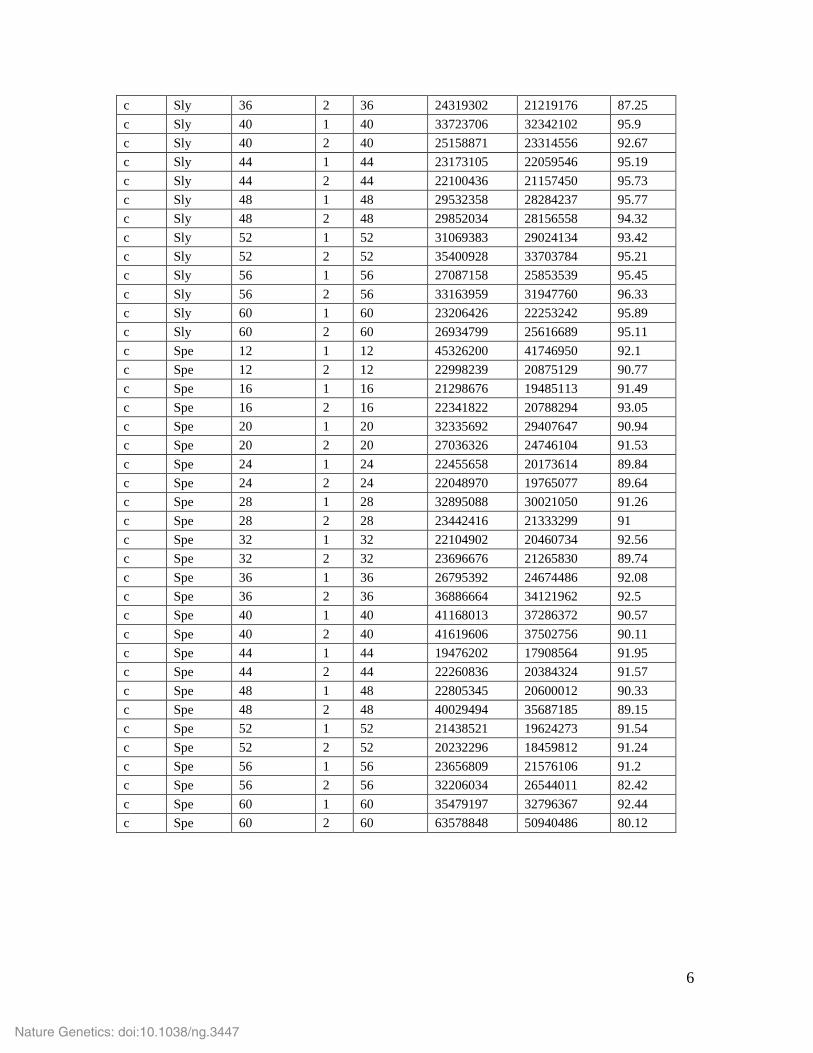
Supplementary Table 8: Diurnal (d) and circadian (c) RNA sequencing time courses. Samples of S. lycopersicum cv. M82 (Sly) and S. pennellii (Spe) were taken every four hours. Collection times refer to Zeitgeber time (ZT), where the dark light transition is defined as ZT = 0. Three diurnal samples were taken in the dark (ZT 12-20); all other samples were collected in the light.
Exp. Species Collection time rep
Modified ARSER time
Total reads Reads mapped % mapped
d Sly 12 1 12 26900579 25843833 96.07 d Sly 12 2 36 27767914 26663241 96.02 d Sly 16 1 16 27587613 26610982 96.46 d Sly 16 2 40 54411668 51872792 95.33 d Sly 20 1 20 33924393 32517176 95.85 d Sly 20 2 44 28925164 27774056 96.02 d Sly 0 1 24 24396186 23228765 95.21 d Sly 0 2 48 24661058 23667946 95.97 d Sly 4 1 28 28361274 27396621 96.6 d Sly 4 2 52 21667021 20658342 95.34 d Sly 8 1 32 17812626 16999481 95.44 d Sly 8 2 56 24339569 23047640 94.69 d Spe 12 1 12 30327310 27570760 90.91 d Spe 12 2 36 22196520 20546446 92.57 d Spe 16 1 16 21561210 19767906 91.68 d Spe 16 2 40 25063240 23189377 92.52 d Spe 20 1 20 19868621 17426189 87.71 d Spe 20 2 44 48566179 42043205 86.57 d Spe 0 1 24 45166879 40038459 88.65 d Spe 0 2 48 24626380 22345242 90.74 d Spe 4 1 28 18421207 16763934 91 d Spe 4 2 52 30848505 27175817 88.09 d Spe 8 1 32 28287294 26286792 92.93 d Spe 8 2 56 26690867 23196824 86.91 c Sly 12 1 12 28069658 27078173 96.47 c Sly 12 2 12 26873534 26043129 96.91 c Sly 16 1 16 30626408 29388318 95.96 c Sly 16 2 16 28254741 27120969 95.99 c Sly 20 1 20 23100880 22104654 95.69 c Sly 20 2 20 47825937 45746490 95.65 c Sly 24 1 24 18790216 18141479 96.55 c Sly 24 2 24 33996649 32216938 94.77 c Sly 28 1 28 30734833 29400261 95.66 c Sly 28 2 28 22081987 21108529 95.59 c Sly 32 1 32 33458529 31492465 94.12 c Sly 32 2 32 33907169 32756481 96.61 c Sly 36 1 36 33999401 32018109 94.17
Nature Genetics: doi:10.1038/ng.3447
6
c Sly 36 2 36 24319302 21219176 87.25 c Sly 40 1 40 33723706 32342102 95.9 c Sly 40 2 40 25158871 23314556 92.67 c Sly 44 1 44 23173105 22059546 95.19 c Sly 44 2 44 22100436 21157450 95.73 c Sly 48 1 48 29532358 28284237 95.77 c Sly 48 2 48 29852034 28156558 94.32 c Sly 52 1 52 31069383 29024134 93.42 c Sly 52 2 52 35400928 33703784 95.21 c Sly 56 1 56 27087158 25853539 95.45 c Sly 56 2 56 33163959 31947760 96.33 c Sly 60 1 60 23206426 22253242 95.89 c Sly 60 2 60 26934799 25616689 95.11 c Spe 12 1 12 45326200 41746950 92.1 c Spe 12 2 12 22998239 20875129 90.77 c Spe 16 1 16 21298676 19485113 91.49 c Spe 16 2 16 22341822 20788294 93.05 c Spe 20 1 20 32335692 29407647 90.94 c Spe 20 2 20 27036326 24746104 91.53 c Spe 24 1 24 22455658 20173614 89.84 c Spe 24 2 24 22048970 19765077 89.64 c Spe 28 1 28 32895088 30021050 91.26 c Spe 28 2 28 23442416 21333299 91 c Spe 32 1 32 22104902 20460734 92.56 c Spe 32 2 32 23696676 21265830 89.74 c Spe 36 1 36 26795392 24674486 92.08 c Spe 36 2 36 36886664 34121962 92.5 c Spe 40 1 40 41168013 37286372 90.57 c Spe 40 2 40 41619606 37502756 90.11 c Spe 44 1 44 19476202 17908564 91.95 c Spe 44 2 44 22260836 20384324 91.57 c Spe 48 1 48 22805345 20600012 90.33 c Spe 48 2 48 40029494 35687185 89.15 c Spe 52 1 52 21438521 19624273 91.54 c Spe 52 2 52 20232296 18459812 91.24 c Spe 56 1 56 23656809 21576106 91.2 c Spe 56 2 56 32206034 26544011 82.42 c Spe 60 1 60 35479197 32796367 92.44 c Spe 60 2 60 63578848 50940486 80.12
Nature Genetics: doi:10.1038/ng.3447
7
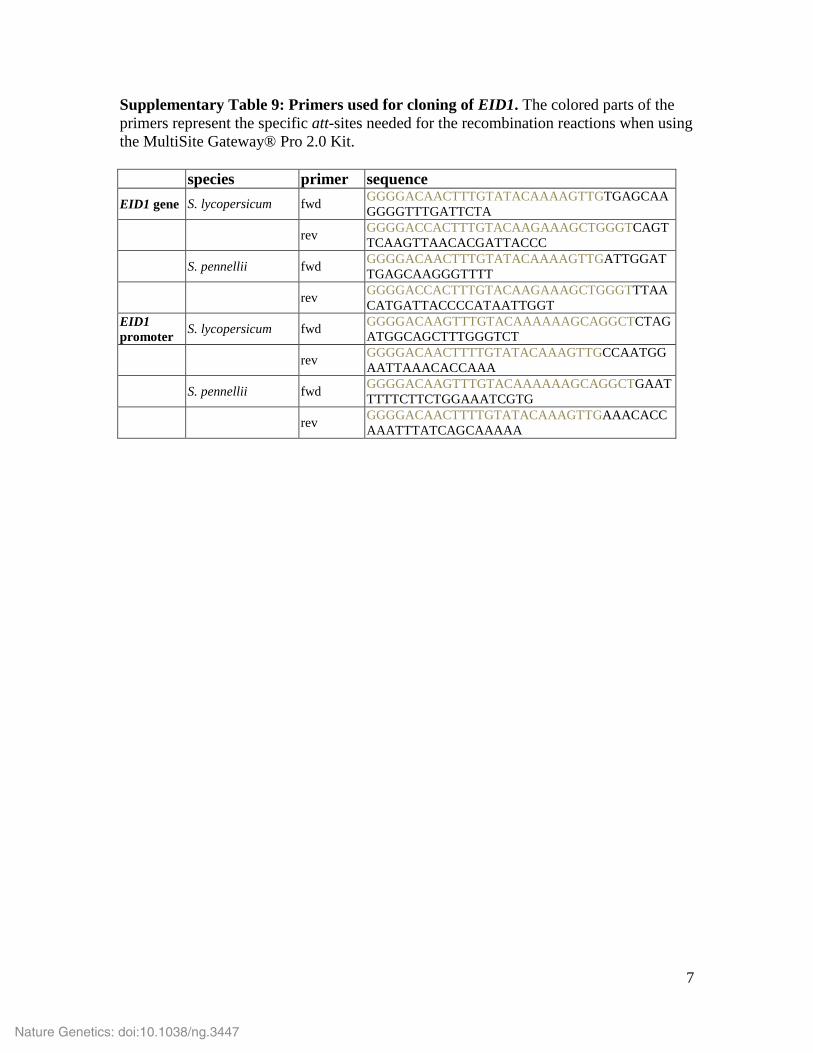
Supplementary Table 9: Primers used for cloning of EID1. The colored parts of the primers represent the specific att-sites needed for the recombination reactions when using the MultiSite Gateway® Pro 2.0 Kit. species primer sequence EID1 gene S. lycopersicum fwd GGGGACAACTTTGTATACAAAAGTTGTGAGCAA
GGGGTTTGATTCTA
rev GGGGACCACTTTGTACAAGAAAGCTGGGTCAGTTCAAGTTAACACGATTACCC
S. pennellii fwd GGGGACAACTTTGTATACAAAAGTTGATTGGATTGAGCAAGGGTTTT
rev GGGGACCACTTTGTACAAGAAAGCTGGGTTTAACATGATTACCCCATAATTGGT
EID1 promoter S. lycopersicum fwd GGGGACAAGTTTGTACAAAAAAGCAGGCTCTAG
ATGGCAGCTTTGGGTCT
rev GGGGACAACTTTTGTATACAAAGTTGCCAATGGAATTAAACACCAAA
S. pennellii fwd GGGGACAAGTTTGTACAAAAAAGCAGGCTGAATTTTTCTTCTGGAAATCGTG
rev GGGGACAACTTTTGTATACAAAGTTGAAACACCAAATTTATCAGCAAAAA
Nature Genetics: doi:10.1038/ng.3447
8
SUPPLEMENTARY NOTE
Circadian leaf movements in adult plants
To test whether adult plants exhibit the same differences in circadian leaf
movements as seedlings, we monitored rhythmic leaf growth of the third to fourth true
leaf of four weeks old plants. We analyzed two cultivated varieties (Moneymaker and
M82) and two accessions of the wild ancestor S. pimpinellifolium (LA1589 and G1.1554)
under the same conditions used for the experiments done with seedlings. We observed
differences between wild and cultivated tomato plants very similar to the differences
present in seedlings. Thus we conclude that the deceleration of the circadian clock of
cultivated tomato is true for different developmental stages.
Nature Genetics: doi:10.1038/ng.3447