Embed Size (px)
Citation preview

S t a t k r a f t A n n u a l R e p o r t 2 0 0 0
Nature at Work

C o n t e n t s
P r e s i d e n t a n d C h i e f E x e c u t i v e O f f i c e r 2 0 0 0
I n t r o d u c i n g S t a t k r a f t
T h e y e a r 2 0 0 0 a t a g l a n c e
A n n u a l R e p o r t 2 0 0 0
S t a t s k r a f t ’ s b u s i n e s s a r e a s
R e g u l a t o r y f r a m e w o r k a n d h a r m o n i s a t i o n
T h e e n e r g y s e c t o r 2 0 y e a r s h e n c e
S t a t k r a f t S F a n d t h e c r e a t i o n o f v a l u e
I n c o m e s t a t e m e n t
B a l a n c e s h e e t
C a s h f l o w a n a l y s i s
A c c o u n t i n g p r i n c i p l e s
N o t e s t o t h e a c c o u n t s
A u d i t o r ' s r e p o r t f o r 2 0 0 0
K e y f i g u r e s
S o c i a l a u d i t – v a l u e a d d e d s t a t e m e n t
E n v i r o n m e n t a l c h a l l e n g e s
W a t e r f a l l s i n n o r w e g i a n p a i n t i n g
A d d r e s s e s
The 1900s have been referred to as the hydro power century in
Norwegian history.To mark this,Statkraft has chosen to illustrate this
annual report, as we enter into a newcentury, with Norwegian rivers and
waterfalls, as seen through the eyes ofNorwegian painters. Dorthea Hysing,
an art historian, has selected thepaintings and commented on them.
Nikolai Astrup (1880-1928)Kvennagong, (Going to the Mill), undated. Hand-coloured woodcut. 40.5 x 51.5 cm. In private ownership.Photo: O. Væring eftf. AS.In many ways Astrup's paintings depict the quintessence of what is Norwegian. He gives a picture of hardship andfrugality, enterprise and the art of engineering, beauty of scenery and mysticism. It is the human aspects in thepicture that made Astrup a popular artist.The basis for this woodcut is a painting from 1902. Astrup worked on thismotif for many years and repeated it a number of times. It is almost impossible to translate the title – it mightmean that the mill is turning or in use or that one, in this case father and son, is on one's way to the mill. MaybeAstrup liked this double entendre. At the heart of the picture is the cascading water.This is a good symbol forStatkraft – a representative of hydro power.
1
2
6
8
20
29
31
34
36
37
38
39
42
60
61
62
64
67

Head OfficeStatkraft SF
P.O. Box 494
N-1323 Høvik
Tel.: +47 67 57 70 00
Fax: +47 67 57 70 01
e-mail: [email protected]
Web site: www.statkraft.no
Visiting address:Veritasveien 26, Høvik
Region Northern NorwayP.O. Box 163
N-8512 Narvik
Tel.: +47 76 96 40 00
Fax: +47 76 96 40 01
Visiting address: Stasjonsveien 60
Region Central NorwayGaupnegrandane
N-6868 Gaupne
Tel.: +47 57 68 28 00
Fax: +47 57 68 15 69
Region Western NorwayP.O. Box 249
N-4201 Sauda
Tel.: +47 52 78 64 00
Fax: +47 52 78 64 01
Region Eastern NorwayP.O. Box 4
N-3880 Dalen
Tel.: +47 35 07 75 64
Fax: +47 35 07 72 27
Statkraft Energy Nederland BVWorld Wide Building
Bouwerij 38
NL-1185 XX Amstelveen
The Netherlands
Tel.: +31 20 347 2780
Fax: +31 20 347 2799
Statkraft Energi Deutschland GmbHNiederkasseler Lohweg 18
DE-40547 Düsseldorf
Germany
Tel.: +49 211 60 244 000
Fax: +49 211 60 244 199
Statoil’s and Statkraft's EU-representationHolidaystraat 5
BE-1831 DIEGEM
Belgium
Tel.: +32 2 725 40 30
Fax: +32 2 725 47 45
Statkraft Grøner ASP.O. Box 400
N-1327 Lysaker
Tel.: +47 67 12 80 00
Fax: +47 67 12 58 40
e-mail: [email protected]
Visiting address: Fornebuveien 11, Lysaker
Statkraft in SwedenLars-Eric Kindstedt
Tel./Fax: +46 8 712 8688
Mobil: +46 70 439 3475
Web site: www.statkraft.se
A d d r e s s e s

Between important countries in Europe and
the Nordic region there is now an unrestricted
flow of energy across borders, with access to
the national grids. A shift toward free
competition through to end-users in the EU
states is reaching full steam.The Skagerrak
cables are now available for transmission of
energy for all those who engage in power trad-
ing.The whole of Denmark has become part
of the Nord Pool power exchange system that
now embraces all of the Nordic countries.
New exchanges are also being developed in
other EU countries.These are unalterable signs
that competition is getting tougher and that
the majority of European countries will soon
belong to one large power market.
Statkraft is part of this pulsating energy world.
We have strengthened our position in the
Norwegian and Nordic energy market during
the last year.When electricity flows freely over
national borders and buyers select suppliers in
an open market, those who are effective,
efficient and innovative will be the winners.
Statkraft intends to be one of them! We are
therefore active in Norway – looking for growth
through acquisitions in energy companies
Our main obstacles lie in getting capital and
acting quickly. In December 1999 the Storting
(Parliament), in its Budget proposal, indicated
quite clearly that it wanted a long-term dividend
policy for Statkraft.This was a step in the right
direction.The increased competition makes it
absolutely essential that capital is available and
that decisions can be made without too much
delaying red tape. In a report produced for
account of the Ministry of Petroleum and
Energy, the consultancy firm Ernst & Young
underlined that competition with heavy energy
players in the Nordic region and in Europe
make it difficult to foresee investment oppor-
tunities. It therefore recommends that Statkraft
be given "ample" owner's capital and flexibility to
acquire fresh capital through higher loans and
guarantee limits, and a system which ensures
that the authorities quickly process applications
for amendments to the financial framework.
If we are to play the central role we have been
given by the authorities, as a leading energy
company in Northern Europe, words must be
followed by actions.The Minister of Trade and
Commerce wrote a short while ago that rapid
change in global business calls for owners who
engage more actively than before. Government
ownership must not be a hindrance for
companies that are engaged in markets
exposed to competition. Among other things
she admits that the decision-making structure is
extremely demanding and at times makes it
impossible for the Government to make quick
decisions. In the future, it is essential for
Statkraft that the Government, as owner,
adapts its systems to market demands..
Statkraft returned a reasonable result in 2000.
Ample precipitation resulted in a record-high
production level, namely 40.2 TWh. But it also
resulted in low prices.The Government, as
owner, took NOK 631 million of our net
income of NOK 847 million. If we are to play a
significant role on the European energy scene
the company must retain a larger part of the
profit or be supplied with adequate equity.The
restructuring has only just started. Sufficient
capital, a high level of competence and
equitable regulatory frameworks are decisive
factors.The Government's proposal to limit
dividends to 50 per cent in the years to come
is a step in the right direction, even if this still
implies a high payout ratio compared to other
companies. I am very pleased to note that work
on health, safety and the environment is
generating positive results, for the company's
employees and in areas where we are operating.
The past year has been
characterised by
substantial changes in
the Norwegian and
European energy industry.
Among other things,
large energy companies
have pooled their
resources and become
even more powerful
players. One of the
newly merged companies
in Germany, for example,
has at its disposal more
production capacity than
all Norwegian power
plants together and has
12 million customers.
1S T A T K R A F T A N N U A L R E P O R T 2 0 0 0
P r e s i d e n t a n d C h i e f E x e c u t i v e O f f i c e r
Major marketchangesby President and Chief Executive Officer Lars U.Thulin

Statkraft Group recorded gross operating
revenues of NOK 5,285 million in 2000. Pre-tax
income was NOK 1,765 million.The capital
ratio, 39.1 per cent, shows that the company is
financially sound. Statkraft is Norway's largest
land-based taxpayer.
The company has a staff of about 1,200.
Statkraft's employees are among the most com-
petent in the world in a range of areas relating
to the development and operation of hydro
power plants, as well as in trading in electrical
power in markets exposed to competition.
Statkraft owns directly an aggregate production
capacity of 34.3 TWh, which accounts for about
30 per cent of the country's hydro power
production.This makes Statkraft Norway's largest
producer of electric power and the second
largest producer of hydro power in the Nordic
region, after Vattenfall. Production takes place at
93 power stations that the company owns wholly
or partly. Statkraft is responsible for operating 57
of these, while others operate 36. Statkraft owns
wholly or partly a total of 113 water reservoirs
corresponding to a good 40 per cent of the
nation's water reservoir capacity.
Statkraft also has ownership interests in other
energy companies, some wholly owned and
some partly owned.These companies are mainly
engaged in the development and operation of
power plants, power distribution, power trading
and engineering, both in Norway and interna-
tionally. In the year 2000, Statkraft acquired 34
per cent of the shares in Skiensfjordens kommu-
nale kraftselskap AS (SKK) and in Vestfold Kraft
AS (VK) as well as a 33.3 per cent interest in
Hedmark Energi AS (HEAS).This reflects
Statkraft's ambition to be a substantial partici-
pant in the Northern European energy market
by increasing its stakes in production capacity.
Figure 2 shows the ownership interests and
how these are linked to Statkraft's organisation.
Statkraft SF was established
on 1 January 1992 following
a resolution adopted by the
Storting (Parliament). The
company is managed in
accordance with the Act
governing State Enterprises,
and the Minister of
Petroleum and Energy is
Statkraft's corporate
meeting. It operates on
commercial principles. The
company's vision is to be
one of the leading Northern
European energy companies
with cutting edge
competence in the field of
hydro power. It is to own,
build and operate power
plants, engage in power
trading and in other
naturally related activities.
2 S T A T K R A F T A N N U A L R E P O R T 2 0 0 0 S T A T K R A F T
I n t r o d u c i n g S t a t k r a f t
Introducing Statkraft
Region NorthernNorway
Ottar Gaard
Region EasternNorway
Rolf Normann
Region WesternNorway Jan Alne
Region CentralNorway
Dag Smedbold
Group ManagementLars U.Thulin, Christian Rynning-Tønnesen,Bjørn Blaker, Helge Skudal and Finn Quale
EconomyKristin A.
Norenberg
FinanceHalvor Liaaen
CorporateCommunications
Trond Rostad
OrganisationFinn Quale
Strategic businessdevelopment
Øystein Løseth
Market NordicJørgen Kildahl
Technology Jon Brandsar
InternationalSverre Nygaard
ProductionTron
Engebrethsen
Group Management
Fig.1
3S T A T K R A F T A N N U A L R E P O R T 2 0 0 0
I n t r o d u c i n g S t a t k r a f t
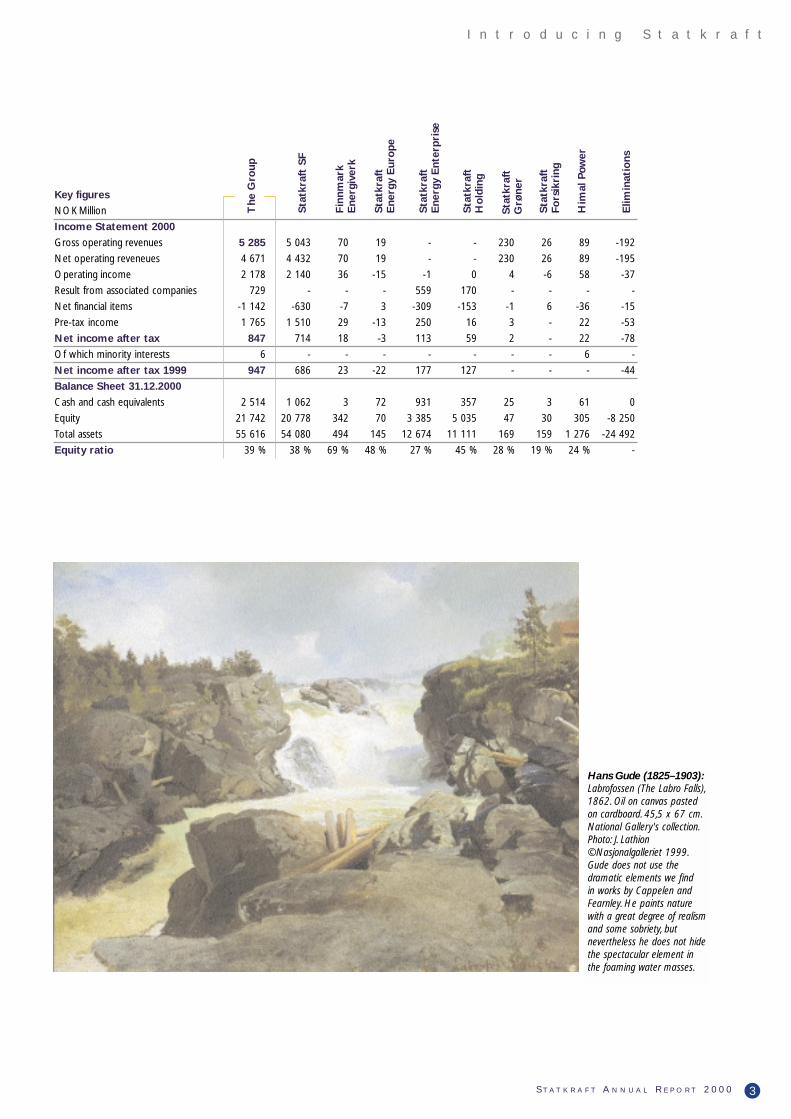
Key figures
NOK Million
Income Statement 2000
Gross operating revenues 5 285 5 043 70 19 - - 230 26 89 -192
Net operating reveneues 4 671 4 432 70 19 - - 230 26 89 -195
Operating income 2 178 2 140 36 -15 -1 0 4 -6 58 -37
Result from associated companies 729 - - - 559 170 - - - -
Net financial items -1 142 -630 -7 3 -309 -153 -1 6 -36 -15
Pre-tax income 1 765 1 510 29 -13 250 16 3 - 22 -53
Net income after tax 847 714 18 -3 113 59 2 - 22 -78
Of which minority interests 6 - - - - - - - 6 -
Net income after tax 1999 947 686 23 -22 177 127 - - - -44
Balance Sheet 31.12.2000
Cash and cash equivalents 2 514 1 062 3 72 931 357 25 3 61 0
Equity 21 742 20 778 342 70 3 385 5 035 47 30 305 -8 250
Total assets 55 616 54 080 494 145 12 674 11 111 169 159 1 276 -24 492
Equity ratio 39 % 38 % 69 % 48 % 27 % 45 % 28 % 19 % 24 % -
The
Gro
up
Sta
tkra
ft S
F
Fin
nmar
kE
nerg
iver
k
Sta
tkra
ftE
nerg
y E
uro
pe
Sta
tkra
ftH
old
ing
Sta
tkra
ftFo
rsik
ring
Him
al P
ower
Elim
inat
ions
Sta
tkra
ft
Ene
rgy
Ent
erpr
ise
Sta
tkra
ftG
røne
r
Hans Gude (1825–1903):Labrofossen (The Labro Falls),1862. Oil on canvas pastedon cardboard. 45,5 x 67 cm.National Gallery's collection.Photo: J. Lathion©Nasjonalgalleriet 1999.Gude does not use thedramatic elements we find in works by Cappelen andFearnley. He paints naturewith a great degree of realismand some sobriety, butnevertheless he does not hidethe spectacular element inthe foaming water masses.

4 S T A T K R A F T A N N U A L R E P O R T 2 0 0 0 S T A T K R A F T
I n t r o d u c i n g S t a t k r a f t
Power produc-tion and trading
Retructuring inNorthern Europe
Strategic business development
Power plant develop-ment in Norway
International powerdevelopment
Statkraft SF,own plants
Finnmark Energi100%
Statkraft EnergyEurope 100%
StatkraftForsikring
100%
Statkraft EnergyEnterprise
100%
StatkraftHolding 100%
StatkraftInvest 100%
Oslo EnergiProduksjon
20%
BKK 26%
Sydkraft AB35,1%
ScanEnergi23,75%
BKKKraftsalg49,5%
Vestfold 1
Kraft 34%
Hedmark 2
Energi33,33%
EnergyFuture
Invest 50%
SKK 1
34%
Production/ Market Nordic
StatkraftEnergy
Nederland BV100%
StatkraftEnergy
DeutschlandGmbH100%
Statkraft SF,own organisation
Technology
Statkraft Grøner100%
Statkraft Peru100%
Himal PowerLtd. (Nepal)
74%
NordicHydropower AB
50%
Theun-HinbounPower Company
(Laos) 20%
Peru Hydro(Peru) 50%
Naturkraft33,33%
International
Statkraft Group
1 Merged into Skagerak Energi AS as of 01.01.2001
2 Increased ownership share to 49% as of 01.01.2001
Corporatestructure
Owned by the parent company
Owned byother groupcompanies
Divisions
Statkraft has defined the following areas of
concentration:
• Strategic business development
This division follows up, analyses and proposes
new business areas in Norway, the Nordic
region and Northern Europe. Framework
conditions and market development are
important areas of focus.This work shall
provide a sound basis for decisions relating to
Statkraft's development in the years to come.
• MarketBy analysing, among other things, markets,
prices and position-taking in the market, this
division seeks to maximise earnings in the
short and long term by optimal exploitation of
own water resources and buying and selling
energy.
• ProductionThis division is primarily responsible for all
technical activities related to the operation,
upgrading and maintenance of the company's
power production facilities so that Statkraft's
added value over time is as high as possible.
• TechnologyThis division is responsible for planning and
realising Statkraft's new power production
capacity. In addition it follows up projects
where Statkraft has a stake or interest and is
responsible for research and development
activities in the company.
• InternationalStatkraft is to be an energy company with an
international image in its core areas.This
division is responsible for developing, owning
and operating energy projects in countries
outside of Northern Europe.
Fig.2
5S T A T K R A F T A N N U A L R E P O R T 2 0 0 0
I n t r o d u c i n g S t a t k r a f t
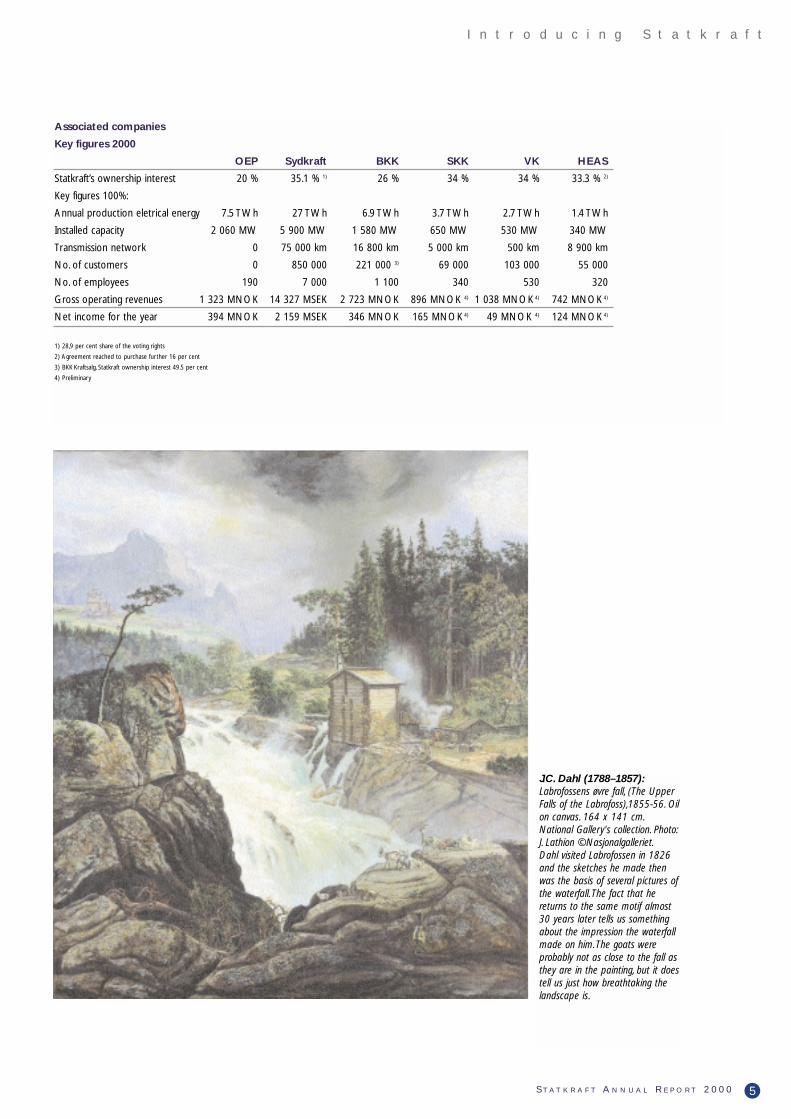
Associated companies
Key figures 2000
OEP Sydkraft BKK SKK VK HEAS
Statkraft’s ownership interest 20 % 35.1 % 1) 26 % 34 % 34 % 33.3 % 2)
Key figures 100%:
Annual production eletrical energy 7.5 TWh 27 TWh 6.9 TWh 3.7 TWh 2.7 TWh 1.4 TWh
Installed capacity 2 060 MW 5 900 MW 1 580 MW 650 MW 530 MW 340 MW
Transmission network 0 75 000 km 16 800 km 5 000 km 500 km 8 900 km
No. of customers 0 850 000 221 000 3) 69 000 103 000 55 000
No. of employees 190 7 000 1 100 340 530 320
Gross operating revenues 1 323 MNOK 14 327 MSEK 2 723 MNOK 896 MNOK 4) 1 038 MNOK 4) 742 MNOK 4)
Net income for the year 394 MNOK 2 159 MSEK 346 MNOK 165 MNOK 4) 49 MNOK 4) 124 MNOK 4)
1) 28,9 per cent share of the voting rights
2) Agreement reached to purchase further 16 per cent
3) BKK Kraftsalg, Statkraft ownership interest 49.5 per cent
4) Preliminary
J.C. Dahl (1788–1857):Labrofossens øvre fall, (The UpperFalls of the Labrofoss),1855-56. Oilon canvas. 164 x 141 cm.National Gallery's collection. Photo:J. Lathion ©Nasjonalgalleriet.Dahl visited Labrofossen in 1826and the sketches he made thenwas the basis of several pictures ofthe waterfall. The fact that hereturns to the same motif almost30 years later tells us somethingabout the impression the waterfallmade on him.The goats wereprobably not as close to the fall asthey are in the painting, but it doestell us just how breathtaking thelandscape is.
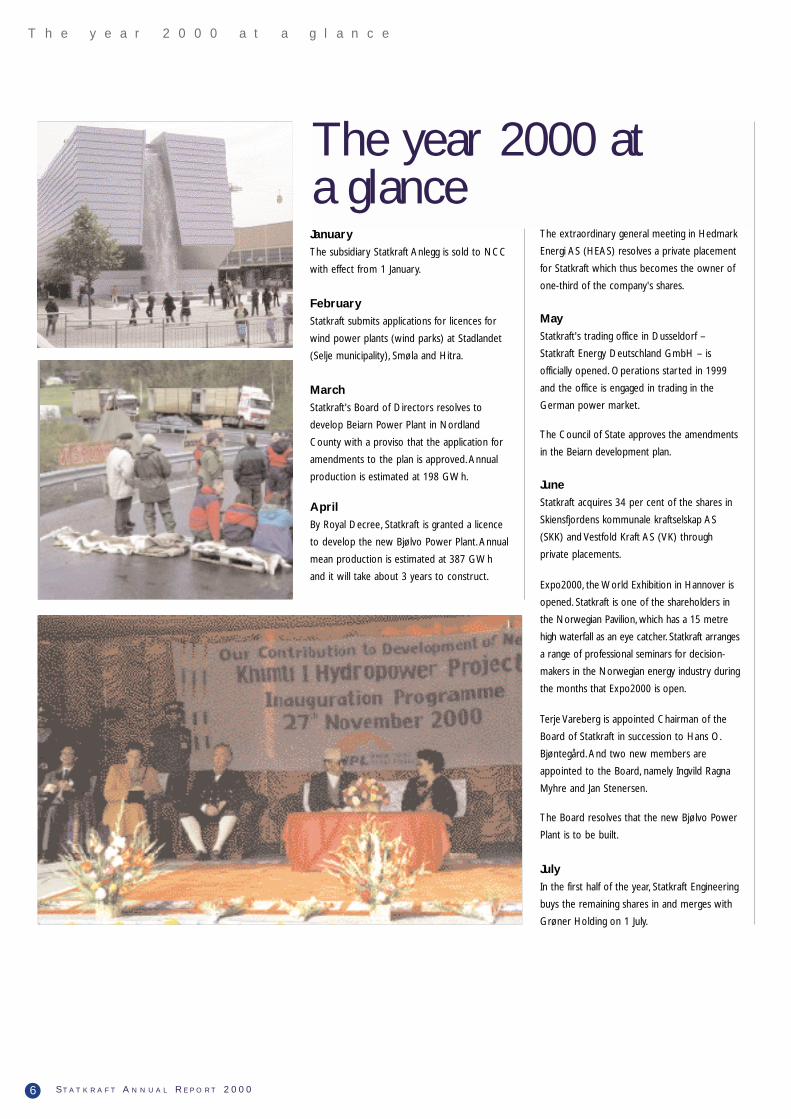
JanuaryThe subsidiary Statkraft Anlegg is sold to NCC
with effect from 1 January.
FebruaryStatkraft submits applications for licences for
wind power plants (wind parks) at Stadlandet
(Selje municipality), Smøla and Hitra.
MarchStatkraft's Board of Directors resolves to
develop Beiarn Power Plant in Nordland
County with a proviso that the application for
amendments to the plan is approved. Annual
production is estimated at 198 GWh.
AprilBy Royal Decree, Statkraft is granted a licence
to develop the new Bjølvo Power Plant. Annual
mean production is estimated at 387 GWh
and it will take about 3 years to construct.
The extraordinary general meeting in Hedmark
Energi AS (HEAS) resolves a private placement
for Statkraft which thus becomes the owner of
one-third of the company's shares.
MayStatkraft's trading office in Dusseldorf –
Statkraft Energy Deutschland GmbH – is
officially opened. Operations started in 1999
and the office is engaged in trading in the
German power market.
The Council of State approves the amendments
in the Beiarn development plan.
JuneStatkraft acquires 34 per cent of the shares in
Skiensfjordens kommunale kraftselskap AS
(SKK) and Vestfold Kraft AS (VK) through
private placements.
Expo2000, the World Exhibition in Hannover is
opened. Statkraft is one of the shareholders in
the Norwegian Pavilion, which has a 15 metre
high waterfall as an eye catcher. Statkraft arranges
a range of professional seminars for decision-
makers in the Norwegian energy industry during
the months that Expo2000 is open.
Terje Vareberg is appointed Chairman of the
Board of Statkraft in succession to Hans O.
Bjøntegård. And two new members are
appointed to the Board, namely Ingvild Ragna
Myhre and Jan Stenersen.
The Board resolves that the new Bjølvo Power
Plant is to be built.
JulyIn the first half of the year, Statkraft Engineering
buys the remaining shares in and merges with
Grøner Holding on 1 July.
6 S T A T K R A F T A N N U A L R E P O R T 2 0 0 0 S T A T K R A F T
T h e y e a r 2 0 0 0 a t a g l a n c e
The year 2000 at a glance
AugustWork on Beiarn starts.
SeptemberOpponents of the Beiarn development block
the highway and Statkraft opts to avoid open
confrontation.
At an extraordinary corporate meeting,
Minster of Petroleum and Energy Akselsen
instructs Statkraft to postpone construction
work at Beiarn.
In association with Hedmark Energi AS, Statkraft
Energy Future Invest (EFI) is established on a
50/50 basis. EFI is a development and investment
company that will look at future challenges and
opportunities in the energy sector.
Construction starts on Statkraft's new head
office at Lilleaker, Oslo.The new offices will be
on the banks of the Lysaker River and the
company plans to take possession in the
summer of 2002.
The Ministry of Petroleum and Energy
publishes the valuations of Statkraft SF carried
out by Ernst & Young and Dresdner Kleinwort
Benson respectively. Depending on the
assumption made the value is between NOK
27 billion and NOK 50 billion.
OctoberIn co-operation with Norsk Hydro and Statoil,
Statkraft arranges an international conference -
"Energy and Environment. Challenges and
Objectives for a New Millennium" in Hannover,
in conjunction with Expo2000.
Construction begins on the new Bjølvo Power
Plant.
NovemberHis Majesty the King of Nepal officially opens
the Khimti I Power Plant.This is the first privately
financed power project in Nepal and increases
the nation's power production by 25 per cent.
Khimti I Power Plant's installed effect is 60 MW
and the annual production is about 350 GWh.
DecemberAgreement is reached with Elkem and
Tyssefaldene for extended leases for Sauda I-IV,
Svelgen I-II and Tysso II on terms that reflect
the anticipated development in the market.
The Norwegian Water Resources and Energy
Directorate (NVE) issues licences to Statkraft for
the building of wind parks at Stadlandet, Smøla
and Hitra.The Smøla permit is for 72 windmills
with a total effect of 150 MW.At Stadlandet
Statkraft's licence is for 35 mills with a total effect
of 70 MW while at Hitra the licence covers 28
windmills with a total effect of 56 MW.
Skiensfjordens kommunale kraftselskap AS
(SKK) and Vestfold Kraft AS (VK) merge and
become Skagerak Energi AS with effect from 1
January 2001. Statkraft's stake is 34 per cent.
In the course of 2000, Statkraft has bought and
sold shares in Sydkraft AB. At year-end Statkraft
owns 35.1 per cent of the capital and has 28.9
per cent of the votes in Sydkraft.
7S T A T K R A F T A N N U A L R E P O R T 2 0 0 0
T h e y e a r 2 0 0 0 a t a g l a n c e
Key figures
Unit 2000 1999 1998 1997 1996
Gross operating revenues NOK mill. 5 285 5 601 5 314 5 353 5 562
Operating income NOK mill. 2 178 2 174 2 198 1 998 2 354
Net income for the year NOK mill. 847 947 890 1 238 455
Total assets NOK mill. 55 616 47 067 42 430 40 075 39 089
Equity ratio % 39.1 45.7 40.8 41.6 37.0
Net cash flow provided by operations NOK mill. 1 772 1 849 1 256 1 427 1 814
Production after pumping and loss TWh 40.2 32.5 32.4 27.5 32.2
PostScript bilde
(Logo SKK.eps)

The Nordic energymarket Weather-wise, the year 2000 was an abnormal
year and the fourth consecutive wet-year.
Exploitable inflow was a record high 140.2
TWh in Norway and 81.6 TWh in Sweden, a
total of 221.8 TWh.This is the second wettest
year since 1930 with an inflow above the mean
of about 43 TWh or almost 25 per cent.
Geographically, there were considerable differ-
ences with precipitation records in the south-
east of the country, while other parts of the
country were dryer than usual.
Furthermore, the year was extremely mild with
temperatures in Norway and Sweden that
were 1.5°C and 1.9 °C higher than the norm.
It was the warmest year in Norway in 130
years.
Following three successive wet-years, reservoir
levels at the beginning of 2000 were as high as
79 per cent of the maximum capacity in
Norway and 62 per cent in Sweden.This is
considerably higher than the average level. At
year-end reservoir levels were unchanged in
Norway, while reservoir levels in Sweden had
increased to 76 per cent of normal levels.
Domestic power consumption in Norway was
120.9 TWh or 1.9 TWh (1.6 per cent) higher
than in the preceding year.The power-intensive
industries increased their consumption by 1.5
per cent to 32.8 TWh. Disconnectable electric
boilers rose by 20.2 per cent to 5.1 TWh as a
result of high oil prices. General supply
consumption rose modestly because of the
mild weather and, at 83 TWh, was 0.5 per cent
higher than in 1999.The mild weather in 2000
led to lower consumption compared to a
normal year.The temperature-adjusted
growth rate is still high, probably 2-3 per
cent a year and shows no signs of levelling
off.
Climatic conditions put pressure on power
prices and for the year as a whole the average
spot price was NOK 0.103 /kWh.This is NOK
0.009/kWh lower than in 1999 and the lowest
power price since 1993.
The high inflow resulted in record high power
production. In 2000 Norway produced, for the
first time, more electricity than Sweden.
Norwegian power production was as high as
141.4 TWh, while in Sweden it was 140.8
TWh. Despite high production, it was not
sufficient to avoid substantial water losses.
Exports from Norway were high through
much of the year. Net exports to Sweden and
Denmark reached 20.5 TWh, which is an all-
time high. Capacity to Sweden and Denmark -
approximately 4,000 MW - was at times fully
utilised.
As a result of the limited new power
development, the underlying deficit in the
Norwegian power balance is growing.This is
also the case in Sweden.
Even though price determination in the Nordic
Power Exchange region is now subject to com-
mon guidelines, with a common price system,
no corresponding harmonisation has taken
place among the Nordic system operators for
the transmission network. Svenska Kraftnätt
limits the capacity of the international connec-
tions in order to deal with internal bottlenecks
in Sweden.This results in increasing dissatisfac-
tion among market participants regarding price
determination in the spot market. A common
Despite constantly low
power prices, Statkraft
achieved income before
tax of NOK 1,765 million
in the year 2000. This is
NOK 74 million or 4 per
cent more than in 1999.
Net income amounted to
NOK 847 million
compared to NOK 947
million in the preceding
year. The Group has
shown sturdiness in a
difficult energy market
but earnings are
nevertheless not
sufficient to give a
reasonable return on
capital. In 2000 the
return on equity was 3.9
per cent compared to
4.9 per cent in 1999.
8 S T A T K R A F T A N N U A L R E P O R T 2 0 0 0 S T A T K R A F T
A n n u a l R e p o r t 2 0 0 0
Annual Report 2000
Nordic system operator and harmonisation of
transmission tariffs within the Nordic region
will allow for better socio-economic
exploitation of the power system, and result in
investments that will increase utilisation of the
Nordic distribution network.
Statkraft's powerproduction and trading A wet year combined with high reservoir levels
at the beginning of the year gave Statkraft a
new production record of 40.2 TWh in 2000,
as much as 7.0 TWh or 21 per cent higher
than the mean production of 33.2 TWh.This
helped maintain income from power sales for
the year despite low market prices.
About half of Statkraft's production volume is
sold to the power-intensive industries at politi-
cally determined prices. In 1999 the Storting
(Parliament) adopted a future industrial power
regime to replace the former publicly decided
contracts when it debated Proposition to the
Storting No. 52. EFTA's surveillance agency
(ESA) has later voiced objections to some
elements in the adopted scheme. Against this
background, certain amendments were
presented to the Storting in Proposition to the
Storting No. 78, which was debated in May
2000. Price-wise the offer in the new contracts
is the same as before, but the old contracts
must expire before the new contracts come
into effect. Of the 17 companies that were
offered new industrial contracts only one has
accepted.This means that from 2011 to 2021
Statkraft has one power contract that is
politically priced. Furthermore, the authorities
have extended the leases for power plants in
three watercourses.These are Sauda,Tysso II
and Svelgen I and II.The leases expire in 2031.
9S T A T K R A F T A N N U A L R E P O R T 2 0 0 0
A n n u a l R e p o r t 2 0 0 0
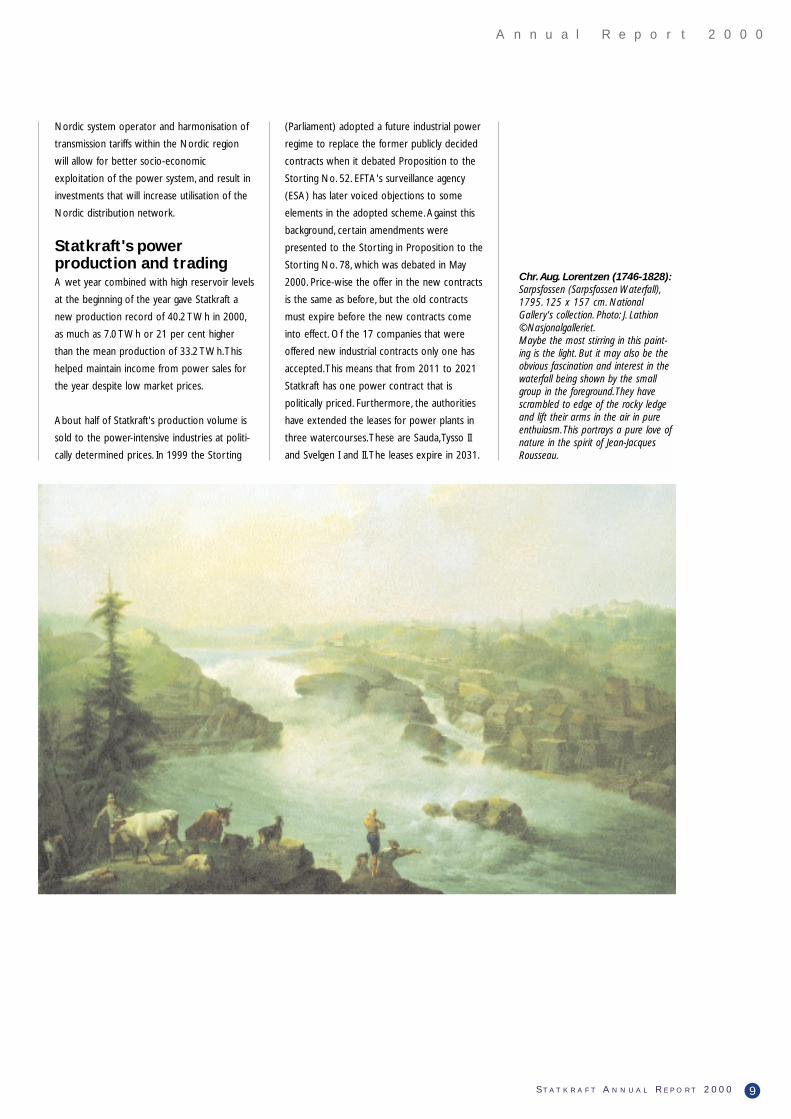
Chr.Aug. Lorentzen (1746-1828):Sarpsfossen (Sarpsfossen Waterfall),1795. 125 x 157 cm. NationalGallery's collection. Photo: J. Lathion©Nasjonalgalleriet.Maybe the most stirring in this paint-ing is the light. But it may also be theobvious fascination and interest in thewaterfall being shown by the smallgroup in the foreground.They havescrambled to edge of the rocky ledgeand lift their arms in the air in pureenthuiasm.This portrays a pure love ofnature in the spirit of Jean-JacquesRousseau.

In the autumn of 2000 Statnett introduced a
market for backup effect. Producers can now
be paid for having stand-by production capacity
and correspondingly industry can be paid for
being able to disconnect consumption at short
notice.The backup will be reported in the
regulatory energy market. Statnett reserved
1,745 MW for the period November 2000 to
January 2001. Statkraft places substantial pro-
duction capacity at the disposal of this market.
This arrangement represents a significant step
forward and in the long term will give partici-
pants more correct price signals.
In the year 2000, 0.1 TWh was imported and
4.6 TWh was exported over the Skagerrak
connection.The power exchange agreement
with Elsam and the transit agreement with
E.On (formerly PreussenElektra) were
renegotiated in 2000 to financial agreements.
This implies that the disposal of the Skagerrak
connection is in the hands of the system
operators Statnett and Eltra, and that it was
opened for energy transfers on market terms
from 1 January 2001. No amendments have
been made to the agreements relating to the
planned Viking Cable to Germany or the
NorNed cable to the Netherlands.The
agreements have been sent to the EU for
notification.
Statkraft has already established the power
trading companies Statkraft Energy Nederland
in Amsterdam and Statkraft Energy
Deutschland in Dusseldorf.These companies
trade in standard contracts on the local power
exchanges or via brokers, and they also enter
into bilateral contracts.The Northern
European market and the Nordic market are
gradually being knitted closer together because
of better transmission capacity and lower
cross-border tariffs and Statkraft's trading
companies will, in light of this, be integrated
into Statkraft's Nordic market operations with
effect from 1 January 2001.
Power plant operations The basis for operating Statkraft’s power plants
is that the plants should be able to produce as
efficiently in the future as they do today. High
availability is a goal, and each plant should
function in accordance to production plans.
Statkraft's fundamental principle for technical
maintenance is that it shall be production
steered.This means that current power
production weighs heavily when planning and
carrying out maintenance work. In addition,
maintenance is based on a technical status
analysis, co-ordinated and long-term planning
and the most effective implementation possible
in terms of time and costs. Production steered
maintenance also means that maintenance is
carried out as far as possible at times when
low market prices for energy are expected.
Availability at the company's production plants
was somewhat lower in 2000 than in the last
few years, namely 95.4 per cent, compared to
98.7 per cent in 1999.The most important
reason for this decline was generator break-
downs in Kvilldal and Saurdal in April/May.
These did not place any significant limitations on
Statkraft's exploitation of its energy resources.
Statkraft's dam rehabilitation continues, based
on the improvement plan from 1994.With the
exception of some minor tidying up, both
Kvilesteinsdams, Røssvassdam, Bleikvasslidam
and Altevannsdam were completed in 2000.
The plan is for the rehabilitation programme to
be completed before the end of 2006.
The modernisation of the power plants at
Vikfalli is for the most part completed.These
works include among other things the rebuild-
ing of the turbine at Refsdal II and the closure
10 S T A T K R A F T A N N U A L R E P O R T 2 0 0 0
A n n u a l R e p o r t 2 0 0 0
IncomeNOK Million
96 97 98 99 00
1800
1600
1400
1200
1000
800
600
400
200
0
Net income Pre-tax income
455
1686
1277
1631 1691 1765
1238
890947
847
96 97 98 99 00
2 000
1 500
1 000
500
0
Gross profit margin
Pre-tax income
35%30%25%20%15%10%5%0%
Pre-tax incomeNOK Million

of Refsdal I, the rehabilitation of the waterway
Hove-Refsdal, and new control facilities for the
generators at Hove, Refsdal and Målset.
Involvement in NorthernEuropean power marketsEuropean power markets have entered a phase
where changes are rapid and comprehensive.
Deregulation of the European power market
has increased competition.The industry is
characterised by restructuring and
consolidation. Statkraft is taking an active part
in this restructuring.
In the year 2000 Statkraft has bought and sold
shares in Sydkraft AB. 10.8 million shares were
purchased (net). At year-end Statkraft owned
35.1 per cent of the company's capital and 28.9
per cent of the votes. Sydkraft is the second
largest energy company in Sweden after
Vattenfall.The company's mean annual produc-
tion is about 27 TWh, mainly nuclear power and
hydro power. Germany's E.On has made an
offer for all of the shares.This is because E.On,
the largest shareholder in Sydkraft, has increased
its stake to more than 40 per cent of the voting
rights.This triggers, under Swedish law, an
obligation to make such an offer.The offer is for
SEK 240 for A-shares (voting shares) and SEK
200 for C shares.The Board will consider the
offer within the deadline for acceptance.
In 2000 Statkraft has been active in the
restructuring of the energy sector in Norway.
Statkraft acquired 34 per cent of the shares in
Skiensfjordens kommunale kraftselskap AS
(SKK) and 34 per cent of the shares in Vestfold
Kraft AS (VK).With effect from 1 January 2001
these have merged into a company named
Skagerak Energi AS. Furthermore, 33.33 of the
shares in Hedmark Energi AS (HEAS) were
acquired in 2000. An agreement has been
reached which implies that Statkraft's owner-
ship interest in HEAS will rise to 49 per cent in
the course of 2001. Furthermore, the other
owners of VK have an option to sell further
shares in the company to Statkraft. Should the
option be exercised in full Statkraft's stake in
VK will rise to 66.6 per cent in the course of
the year. BKK and Skagerak Energi have agreed
to merge all end-user activities into a joint
owned company.
Power plant developmentprojects in NorwayThe Norwegian power balance shows a con-
siderable deficit. Electricity consumption
continues to rise, and is rising at a faster rate
than new power production.The deficit in the
Norwegian market will therefore continue to
grow.
Statkraft considers contributing to new power
being available in the Norwegian important.
Statkraft's main focus area has been, and is,
new hydro power projects. In addition comes
engagement in other renewable energy, where
wind power is the energy form of most
immediate interest. Statkraft also owns one-
third of Naturkraft AS, which develops gas-fired
power plant projects in Norway based on the
best technology commercially available.
The regulatory framework conditions for the
development of new hydro power projects in
Norway changed during the year.The Prime
Minister's New Year's speech to the nation
signalled a general tightening, implying that
more stringent terms will be set if Norwegian
hydro power is to be developed in the future.
This may limit the number of new projects.
Upgrading existing power plants and
developing smaller and more cautious projects
represent some new hydro power potential.
Specifically, the new framework conditions
resulted in the Minister of Petroleum and
Energy instructing Statkraft, at the Corporate
Meeting, to stop all work on the Beiarn,
Bjellåga and Melfjord development projects.
Beiarn was halted at a time when all permits
had been granted and construction work had
started. If the Storting's (Parliament) debate on
these issues results in the Beiarn, Bjellåga and
Melfjord projects not being implemented, this
means that new capacity of about 1 TWh will
11S T A T K R A F T A N N U A L R E P O R T 2 0 0 0
A n n u a l R e p o r t 2 0 0 0
NOK Million
96 97 98 99 00
2 000
1 500
1 000
500
0
Physical power balanceTWh
96 97 98 99 00
50.0
40.0
30.0
20.0
10.0
0.0
100 %
95 %
90 %
85 %
80 %
75 %
70 %
Power purchased Production
Gross operating revenuesNOK Million
Power revenues
Other operating revenues
Operating income
96 97 98 99 00
6 000
5 000
4 000
3 000
2 000
1 000
0
Own production ratio
Cash flow provided by the year’soperations

12 S T A T K R A F T A N N U A L R E P O R T 2 0 0 0
A n n u a l R e p o r t 2 0 0 0
Gerhard Munthe(1849–1929):
Driva (The River Driva),1895. Oil on canvas 97 x66 cm. National Gallery'scollection. Photo: J. Lathion
©Nasjonalgalleriet.Probably without any ulteriormotive regarding the power
of the waterfall, Munthesucceeded in making a
fantastic point of how timeand water bring about majorchanges together.That is alsoa way of showing the forces
of water.

not be developed. Statkraft's Board of
Directors presumes that Statkraft will be
compensated for all three projects.
In April 2000, Statkraft received permission to
renew Bjølvo Power Plant. Statkraft's Board
approved the investment in June and
construction work started in October.
Statkraft has been working for some time on
specific wind power projects. In December, the
company was granted a licence to build
windmill parks at Smøla, Hitra and Stadlandet, a
development representing annual mean
production of 768 GWh.The resolution has
been appealed and processing the appeal is
expected to take up to 6 months.The develop-
ment of these windmill projects requires that
framework conditions allow for the projects to
be profitable, among other things through the
granting of investment support.
In the spring of 2000, Naturkraft AS received
new emission permits for the Kårstø and Kollsnes
plants.These plants represent about 5.6 TWh in
new production capacity.The emission require-
ments for CO2 were eased in the new permits,
but the stringent emission requirements for
NOx were upheld. However, it opened up for
Naturkraft being credited, on certain conditions,
with NOx reducing measures at other emission
sources, so-called "flexible NOx measures". At
present, an assessment is being made as to
whether the projects are commercially viable
under the given framework conditions.
Research anddevelopmentR&D is an important tool with which to reach
Statkraft's long-term goals.The company
expects the importance of technology and
innovation to rise in the industry in the future
and will actively participate in the development
work related to production of new energy and
investigate the feasibility of new energy carriers.
One of the greatest challenges is to ensure the
long-term profitability of existing and new
hydro power projects.This can be achieved, for
example, by applying new technical solutions
and new production methods.
The development of alternatives to traditional
hydro power is important since the
unexploited hydro power potential in Norway
is limited. Statkraft has a long-term perspective
on this development and emphasises the effort
to find environmentally sound solutions
Participation in R&D projects under the
auspices of EU programmes is one of the R&D
ambitions for the future.The EU will support
projects where emphasis is on making the
distance between research and industry as
short as possible.
Statkraft's work on wind power has resulted in
a considerable increase in the level of compe-
tence and given good insight into wind power
technology. Participation in an R&D project
under the auspices of the Norwegian Research
Council on large-scale integration of wind
power has provided greater understanding of
component development, local wind conditions
and problems linked to the transmission grid.
The projects looking at the possibility of
producing electricity with the help of salt
gradients and large-scale production of hydro-
gen continued in 2000. A more detailed
description of the projects is given in the article
"Power plant development projects in Norway".
International developmentprojectsIn order to exploit Statkraft's competence in
developing and operating hydro power plants,
the company has engaged in hydro power
13S T A T K R A F T A N N U A L R E P O R T 2 0 0 0
A n n u a l R e p o r t 2 0 0 0
Balance sheet structure
Current liabilities
NOK Million
Long-term liabilities
Subordinated loan
Fixed assets
48 %
46 %
44 %
42 %
40 %
38 %
36 %
34 %
32 %
30 %
96 97 98 99 00
60 000
50 000
40 000
30 000
20 000
10 000
0
InvestmentsNOK Million
96 97 98 99 00
10 000
8 000
6 000
4 000
2 000
0
Equity

development in certain markets outside of
Europe.This provides the companies with
opportunities that are profitable. Statkraft is not
involved in politically disputed areas or projects
considered environmentally controversial.
The Theun Hinboun Power Plant (210 MW)
in Laos has been in operation since 1998, with
satisfactory production and earnings. 95 per
cent of the electricity produced is sold to
Thailand on a long-term power agreement
with the state owned energy company EGAT.
Statkraft owns 10 per cent of Theun Hinboun.
The 60 MW run-of-the-river power plant in
Nepal, Khimti I, started commercial production
in July 2000, after a construction period of 4
years. Since start-up the power plant has
achieved satisfactory production and earnings.
The entire production volume is sold to the
state owned energy company NEA on a
long-term USD-based sales agreement running
for 20 years. Statkraft owns 74 per cent of the
shares in Himal Power Limited which was
established to build and operate Khimti Power
Plant. In November 1999 Statkraft signed an
agreement with BKK for the transfer of 23 per
cent of the shares in Himal Power Limited.The
necessary approvals from the Nepalese authori-
ties and the company's lenders have recently
been given and the parties signed the
agreements regarding the change in ownership
on 15 February 2001.The actual transfer of
shares is expected to take place in the first half
of 2001.
Engineering andconstructionIn the first half of 2000, Statkraft Engineering
acquired the remaining shares in Grøner
Holding AS thus becoming the company's sole
shareholder.The companies merged to
become Statkraft Grøner on 1 July 2000.
Subsequent to the merger, Statkraft Grøner
restructured the organisation in order to be
better equipped to meet a market undergoing
change.The company's operations in 2000 were
characterised by difficult market conditions in
some of its business areas.This was particularly
so in the Energy business area as a result of
delays and stoppages of development projects
at Saltfjellet.This increases the need to shift
focus and competence. Revenue and net
income were lower than expected at NOK
230 million and NOK 2 million respectively.The
company expects the restructuring to have a
positive impact on the result for 2001.
The subsidiary Statkraft Anlegg was sold to
NCC with effect from 1 January 2000.The sale
reduces the Group's operating revenues and
operating costs by a good NOK 300 million on
an annual basis.
Income statementStatkraft's accounts for 2000 are prepared on
a going concern assumption.
Revenues. Statkraft's combined revenues in
2000 amounted to NOK 5,285 million, which is
a net decline of NOK 316 million compared to
the preceding year.The most important reason
for this fall was a loss of revenue caused by the
sale of Statkraft Anlegg at the beginning of the
year.
Transmission costs fell from 1999 to 2000
by NOK 75 million.This was due to the
reversal of a provision made for a dispute,
where, during the year, a ruling was given in
Statkraft's favour. Net operating revenues
after covering transmission costs totalled
NOK 4,671 million compared to NOK 4,912
million in 1999.
The contribution to revenues from net power
sales rose by about NOK 200 million when
adjusted for extraordinary items related to
provisions.This increase is mainly a result of
very high power production volumes that
14 S T A T K R A F T A N N U A L R E P O R T 2 0 0 0
A n n u a l R e p o r t 2 0 0 0
Social audit – distribution of valueadded
Owners
Employees
Lenders
Central/localauthorities
NOK Million
96 97 98 99 00
4500
4000
3500
3000
2500
2000
1500
1000
500
0
96 97 98 99 00
14.0 %12.0 %10.0 %8.0 %6.0 %4.0 %2.0 %0.0 %
Return on assets and equity
Equity before taxReturn on total assets
Equity after tax

more than compensated for the low power
prices.
Costs. Operating costs fell by NOK 245
million, from NOK 2,738 million in 1999 to
NOK 2,493 million in 2000.This reduction was
mainly a result of the exclusion of operating
costs for Statkraft Anlegg following the sale.
Costs of operating and maintaining power
production and trading rose insignificantly. A
provision of NOK 80 million has been made
for restructuring and workforce reductions at
Statkraft SF.
Net financial costs rose by NOK 217 million,
from NOK 925 million in 1999 to NOK 1,142
million in 2000.This was mainly higher costs
due to higher borrowing, inter alia in connec-
tion with the acquisition of interests in other
companies.Total borrowings rose by about
NOK 8 billion during the year.
Taxes and duties.Taxes were charged against
income in the amount of NOK 918 million in
2000 compared to NOK 744 million in 1999.
Taxes payable were NOK 267 million higher in
2000 than in 1999.
Including licence-related duties and compensa-
tion, the total tax and duty burden was NOK
1,170 million in 2000, corresponding to almost
58 per cent of net income before taxes and
duties.
There are considerable differences in the level of
taxes and duties on power production in the
different countries in the Northern European
power market, and Norwegian power producers
have a considerably heavier tax and duties bur-
den than producers in other countries. Similarly,
tariff systems for distributing transmission costs
between producers and receivers of power are
a relatively heavier burden on Norwegian pro-
ducers than on producers in other countries.
15S T A T K R A F T A N N U A L R E P O R T 2 0 0 0
A n n u a l R e p o r t 2 0 0 0
August Cappelen (1827–1852):Foss i nedre Telemark (Waterfall in LowerTelemark), ca. 1852. 77 x 102.5 cm.National Gallery's collection.Photo: J. Lathion ©Nasjonalgalleriet.Contrary to most of his generation,Cappelen paints Norwegian nature withthe insight of someone who knows thelandscape.These are the forests of hischildhood and he masters the task ofdepicting dramatic atmospheres. A lonelyriver driver battles the forces of water.His job is to save the valuable logs thatare wedged and stuck while the artisthas chosen to view the scene from a mountain shelf, safely elevated aboveall danger.

Statkraft is pleased that there has been some
advance in 2000 to harmonise these framework
conditions, but these efforts should continue so
that the Norwegian producers are offered the
same terms as the competition.
Results. Operating income in 2000 amounted
to NOK 2,178 million compared to NOK
2,174 million in 1999.
In 2000, the company's share of the results of
the associated companies Sydkraft AB, Oslo
Energi Produksjon, BKK, SKK/VK and HEAS
have been included in the aggregate amount of
NOK 729 million, compared to NOK 442
million in the preceding year.This increase is
mainly a result of acquiring ownership interests
in SKK/VK and HEAS in 2000 and a higher
ownership interest in Sydkraft.
Income before taxes amounted to NOK 1,765
million, compared to NOK 1,691 million in
1999. After taxes, net income for the year
amounted to NOK 847 million compared to
NOK 947 million in 1999.
The Board thanks it's employees and
management for their contribution to the
achievements made in 2000.
Balance sheet, invest-ments and liquidityStatkraft invested a total of NOK 9,411 million
in 2000.
NOK 394 million was invested in Statkraft's
own facilities in Norway, covering a range of
rehabilitation projects on power plants and
dams. NOK 236 million refers to investments
in plants etc. in subsidiaries, including the Khimti
development project in Nepal.
NOK 8,781 million was spent on purchasing
ownership interests in other companies.This
refers first and foremost to the purchase of a
33.33 per cent interest in HEAS, 34 per cent of
the shares in SKK and VK and the purchase of
further shares in Sydkraft.
The year's operations generated a net cash
flow of NOK 1,340 million.
16 S T A T K R A F T A N N U A L R E P O R T 2 0 0 0
A n n u a l R e p o r t 2 0 0 0
Thomas Fearnley (1802–1842):Labrofossen near Kongsberg (TheLabro falls at Kongsberg), 1837.
Oil on canvas 150 x 224 cm.National Gallery's collection. Photo:J. Lathion ©Nasjonalgalleriet 1998.
Labrofossen has been a favouredmotif for many painters, but this ver-sion is one of the most dramatic and
impressive.Water comes roaring downfrom way up in the valley and buttsagainst the wood logs.The majestic
eagle holds a watchful eye over it all, underlining the wild and
inhospitable nature.

Statkraft took up loans at home and abroad in
2000. New long-term loans aggregating NOK
10.3 billion were raised, of which NOK 2.5
billion in Statkraft's first Euro bond issue, NOK
2.9 billion in the Swiss bond market, NOK 1.7
billion through public placements and NOK 3.2
billion in the Norwegian bond market.
Repayments of long-term liabilities totalled
NOK 1.2 billion.The average remaining term of
the company's long-term liabilities at year-end
was 4.8 years. Statkraft SF's total loan and
guarantee obligations amounted to NOK 32.5
billion at the end of the year. Hence, the
company can increase its loan and guarantee
obligations by up to NOK 10 billion before
reaching the limit of NOK 42.5 billion that has
been set by the Storting (Parliament). Some of
this has been used in 2001 so that the real
remaining amount is about NOK 5 billion.
Moody's continues its stable Aaa long-term
rating of Statkraft and Standard & Poor's
maintains its rating of the company at AA+. In
the light of Statkraft's plans to grow by
acquiring interests in other energy companies it
is engaged in a dialogue with its owner on an
increase in owner's capital and in the limit for
loan and guarantee obligations.
Statkraft's liquidity was satisfactory throughout
the year and at year-end the Group's net cash
and cash equivalents amounted to NOK 2.5
billion. Furthermore, unutilised drawing rights
totalled NOK 2.7 billion. By way of comparison,
short-term liabilities accounted for NOK 0.1
billion and the current portion of long-term
liabilities totalled NOK 3.7 billion.
At the end of 1999, Statkraft's equity totalled
NOK 21,742 billion.The equity ratio stood at
39.1 per cent.
As part of the Ministry of Petroleum and
Energy's supervision of Statkraft, an international
investment bank and a Norwegian-based
consultancy and auditing company have been
engaged in an external valuation of the company.
The companies estimate that Statkraft's market
value is between NOK 27 billion and NOK 50
billion, depending on the assumptions made.
This is nevertheless considerably higher than
the company's equity.
The working environmentIn 2000 Statkraft worked on arranging activity-
based management development. Measures
started in the autumn of 2000 and will be
continued in the years to come.
Furthermore, Statkraft has started a one-year
programme for developing management
capacity, with 12 participants from Statkraft and
6 from partner companies.The programme
content builds on studies at the Norwegian
School of Management (BI)/Henly, practical
training with wide use of management
simulation, mentors' guidance and discussion, as
well as project assignments.
In the year 2000 a great deal of focus has been
put on safety and the working environment at
all levels in Statkraft. Multi-year enhancement
programmes have been initiated to ensure
local involvement and management follow-up
of HSE (Health, Safety and the Environment).
Focus has also been on surveying risks and on
safety planning during the implementation of
projects.This has already resulted in a sharp
rise in the number of reports on dangerous
situations, giving us a good basis for evaluating
risk and implementing improvement measures.
HES figures rose from 1998 to 1999. As a
result of intensified efforts in 2000 the negative
trend is about to turn and the figures are now
flattening out or in part falling. In 2000 Statkraft
Group recorded 25 injuries resulting in lost
time, compared to 24 in the preceding year.
The injury frequency (H1 factor) was 6.1 in
2000 compared to 11 in 1999.The injury
frequency based on total injuries, with and
17S T A T K R A F T A N N U A L R E P O R T 2 0 0 0
A n n u a l R e p o r t 2 0 0 0
30
20
10
0
Øre/kWh
1997
1998
1999
2000
Energy volume sold, by market segment
Spotpower
TWh
Export
General consumption
Licence power
Power-intensiveindustry
96 97 98 99 00
45
40
35
30
25
20
15
10
5
0
Spotprices
Reservoir Generator Mean production
100 %
75 %
50 %
25 %
0 %
Statkraft Others
Share of Norway’s production,installed generator and reservoir capacity
41% 31% 28%
Definitions:H1 factor :lost-time injuries x 1 million/total number ofhours worked.H2 factor :injuries with or without lost time x 1million/total number of hours worked.F factor :no. of lost-time days from injuries x 1million/total number of hours worked.

without sick leave (H2 factor), was 13.9
compared to 20.1 in 1999.
Injury absence figures or the injury seriousness
factor (F factor) was 57 compared to 110 one
year earlier.
Sick leave stood at 4.2 per cent in 2000, the
same as in 1999.
The external environmentHydro power is a clean and renewable energy
source that is environmentally friendly seen in
comparison to other dominant energy carriers
and does not result in any significant emissions
or discharges. However, the development and
operation of hydro power plants does result in
encroachment on nature and has an impact on
the environment. Statkraft emphasises following
up environmental aspects.
In 2000, Statkraft carried out a number of
measures to increase its knowledge of local
environmental impacts of hydro power.Work
on life cycle analyses continued and Statkraft
has participated actively in making environment
cost evaluations of Norwegian hydro power
and finances a series of research activities
linked to the environmental aspects of hydro
power and alternative energy. Statkraft seeks to
further develop the constructive co-operation
with local authorities and landowners and
other interested parties as regards planning
measures in and around watercourses.
"Environmental Survey 98", a report that
looked at tips, waste deposit sites and other
areas that are potentially polluting has been
completed and relevant action will be taken
where this is necessary.
Compensatory environmental measures in
the form of maintenance of thresholds, fish
ladders and other bio-tope adjustment
measures are part of the day-to-day
operations and are continual. In 2000 about
450,000 smolt, young fish and fry of salmon
and trout were released. Statkraft owns and
operates 5 fish hatcheries.
In 2000, Statkraft registered certain minor
breaches of requirements regarding minimum
water flow.Work on improving equipment,
reporting routines and follow-up has been
intensified. Furthermore, some minor oil
spillages were recorded.These were quickly
dealt with and they caused no traceable
damage.
Statkraft is participating in a Nordic
co-operation aiming at improving the certified
environmental product description for hydro
power.This might increase demand for
environmentally friendly energy.
Statkraft has started work on environmental
certification in accordance with the rules in the
international environmental standard
ISO-14001 and in this connection it has
systemised and improved environmental
reporting routines. A separate environmental
report will be published for the year 2000.
Reference is also made to a separate section
of the annual report that takes an in-depth
look at environmental challenges relating to
hydro power.
Legal disputesThe new taxation system for power plants was
introduced from 1997.There are currently two
cases outstanding regarding Statkraft's tax
assessment under the new system. Both refer
to the possibility of deduction when calculating
resource rent income.
Some assessment proceedings have been
18 S T A T K R A F T A N N U A L R E P O R T 2 0 0 0
A n n u a l R e p o r t 2 0 0 0

brought against Statkraft but their scope is
limited.
Provisions have been made in the accounts
based on a conservative assessment of the
obligations relating to the disputes.
ProspectsThe regulatory framework for the Norwegian
and European energy industry is changing
greatly. In Europe, development is toward more
market opening and deregulation. In Norway
municipal authorities and county authorities are
starting to sell their ownership interests in
energy companies and this is changing struc-
ture in the energy sector. Statkraft will continue
to develope its existing core activities – power
production and trading.This implies, inter alia,
active participation in the restructuring of the
Norwegian energy sector and increased power
trading activity in the Nordic region and on the
Continent in order to exploit the company's
competence and realise economies of scale.
This will call for substantial investments in the
years to come, in acquisitions in Norway and in
connection with the development of new
power projects. Statkraft will continue to
develop Norwegian power potential on a
commercial basis within the framework
conditions that are given.This applies both to
the remaining hydro power possibilities and the
development of other renewable energy,
including wind power.
The more stringent evaluation of new hydro
power development that political signals point
to will limit the possibilities of strengthening
the Norwegian power balance.
Important preconditions for realising Statkraft's
strategy are adequate access to capital and a
regulatory framework for the business that
provide the same terms as the competition
with regard to taxes, duties and tariff systems.
In a longer perspective, Statkraft has enjoyed a
significant improvement in its financial results
and has had stable earnings in a difficult power
market. Nevertheless, the possibilities it has of
financing the substantial investments needed to
participate in the restructuring from operations
are limited. Carrying out Statkraft's investment
plans assumes an equity injection and an
increase in the loan and guarantee limit, and
the company has applied to the Ministry of
Petroleum and Energy for these.
In the short term, Statkraft enters 2001 with
fuller water reservoirs than is normal. Assuming
that inflow and market conditions in 2001 are
more normal than in 2000, the result of the
company's power production and trading
should improve in 2001. However, the power
market is volatile and there is therefore some
uncertainty surrounding the development in
the financial results.
Allocation of the netincome for the yearPreviously, no long-term dividend policy has
been adopted for Statkraft, and the dividend for
1998 and 1999 accounted for 43 per cent and
63 per cent respectively of the Group's net
income after tax.The Board has proposed a
dividend policy where 30 per cent of the
Group's net income after tax is distributed.The
background for this proposal is that the dividend
policy should ensure that Statkraft has the
financial strength needed to realise its strategies.
In the State Budget for 2001 Statkraft's dividend
distribution for 2000 is set at 75 per cent of the
Group's net income after tax, limited upwards
to NOK 750 million. For the period 2001 to
2003 the dividend is indicated at 50 per cent
of the Group's net income.The Board makes
due note of this and proposes the following
allocation of the net income for 2000:
(Amounts in NOK million) Statkraft SF
Dividend 631
Transferred to other equity 83
Net income for the year 714
19S T A T K R A F T A N N U A L R E P O R T 2 0 0 0
A n n u a l R e p o r t 2 0 0 0
The Board of Directors of Statkraft SF
Bærum, 6. March 2001
Terje VarebergChairman
Jon Ivar Nålsund Odd Vanvik Marit Büch-Holm Anders Eckhoff
Tom Andersen Jan Stenersen Toril Mølmshaug Ingvild Ragna Myhre Lars Uno ThulinPresident and C.E.O.
POWER PRODUCTIONAND SALESStatkraft has a mean annual production of 33.2
TWh at its wholly and partly owned plants.
The value of the power production varies as a
function of water inflow to the power plants,
the price of power in the market and the
prices achieved on power contracts entered
into at earlier points in time. Statkraft strives to
manage power production so that earnings are
maximised. For this purpose, Statkraft has a
considerable operative section that monitors
market development as well as advanced
models that provide decision support for
power dispositions.
Power production also includes operations,
maintenance, renewals and development.
Improvements in profitability are related to a
number of primary conditions:
AvailabilityA high level of availability of production
facilities (power stations, water reservoirs etc,)
is costly but provides flexibility. Some of
Statkraft's plants produce only in the winter,
spring and autumn, and maintenance is
scheduled accordingly.
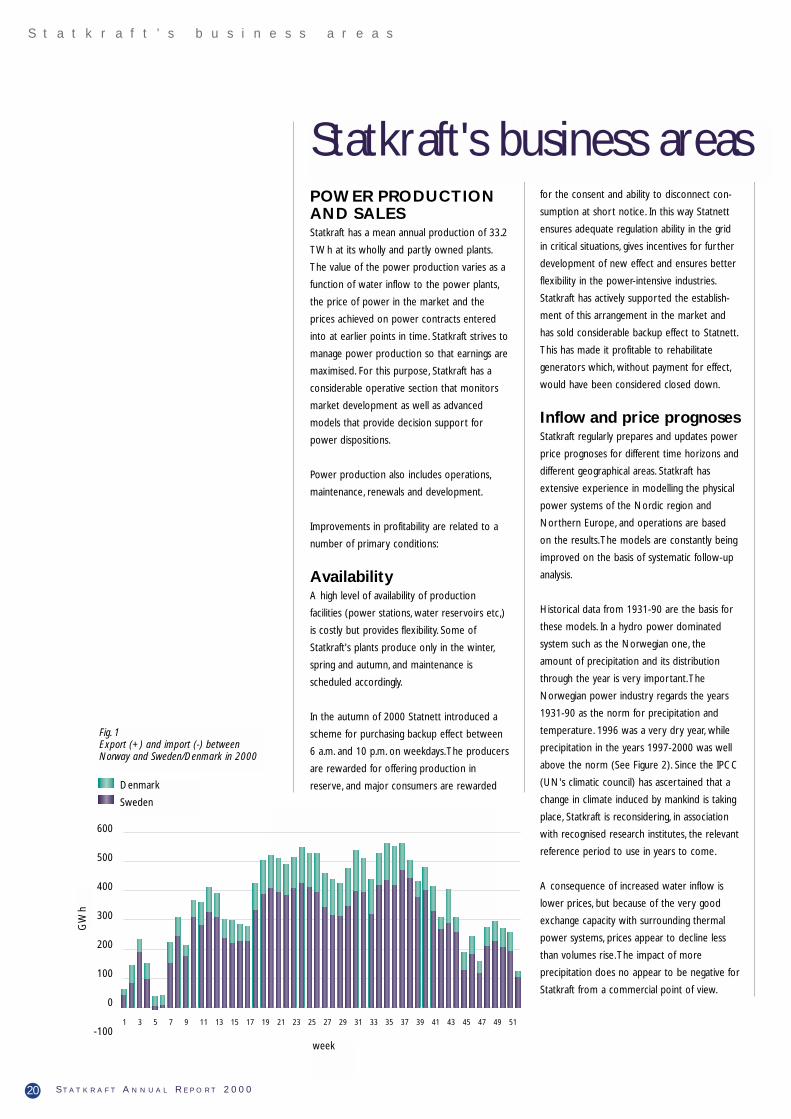
In the autumn of 2000 Statnett introduced a
scheme for purchasing backup effect between
6 a.m. and 10 p.m. on weekdays.The producers
are rewarded for offering production in
reserve, and major consumers are rewarded
for the consent and ability to disconnect con-
sumption at short notice. In this way Statnett
ensures adequate regulation ability in the grid
in critical situations, gives incentives for further
development of new effect and ensures better
flexibility in the power-intensive industries.
Statkraft has actively supported the establish-
ment of this arrangement in the market and
has sold considerable backup effect to Statnett.
This has made it profitable to rehabilitate
generators which, without payment for effect,
would have been considered closed down.
Inflow and price prognosesStatkraft regularly prepares and updates power
price prognoses for different time horizons and
different geographical areas. Statkraft has
extensive experience in modelling the physical
power systems of the Nordic region and
Northern Europe, and operations are based
on the results.The models are constantly being
improved on the basis of systematic follow-up
analysis.
Historical data from 1931-90 are the basis for
these models. In a hydro power dominated
system such as the Norwegian one, the
amount of precipitation and its distribution
through the year is very important.The
Norwegian power industry regards the years
1931-90 as the norm for precipitation and
temperature. 1996 was a very dry year, while
precipitation in the years 1997-2000 was well
above the norm (See Figure 2). Since the IPCC
(UN's climatic council) has ascertained that a
change in climate induced by mankind is taking
place, Statkraft is reconsidering, in association
with recognised research institutes, the relevant
reference period to use in years to come.
A consequence of increased water inflow is
lower prices, but because of the very good
exchange capacity with surrounding thermal
power systems, prices appear to decline less
than volumes rise.The impact of more
precipitation does no appear to be negative for
Statkraft from a commercial point of view.
20 S T A T K R A F T A N N U A L R E P O R T 2 0 0 0
S t a t k r a f t ’ s b u s i n e s s a r e a s
Statkraft's business areas
600
500
400
300
200
100
0
-1001 3 5 7 9 11 13 15 17 19 21 23 25 27 29 31 33 35 37 39 41 43 45 47 49 51
Denmark
Sweden
Fig. 1Export (+) and import (-) betweenNorway and Sweden/Denmark in 2000
GW
h
week

One important reason for the price decline
being relatively moderate, taking into
consideration the extreme precipitation, is that
Swedish nuclear power producers are
increasingly inclined to reduce nuclear power
production at low and to some extent
moderate prices.
Power salesIn addition to active management of its own
power production, Statkraft is also engaged in
trading with a view to generating profits from
short-term price fluctuations.This operation is
subject to stringent risk management and gives
a good indication of Statkraft's understanding
of the market. Statkraft also issues options as
part of a strategy aimed at developing a
leading environment for physical and financial
power trading in Northern Europe within
Statkraft, inter alia through Nord Pool (the
Nordic Power Exchange).
Nord Pool is growing substantially. In 2000
physical trading in the spot market rose to 97
TWh or 28 per cent more than the preceding
year. Financial trading rose by 66 per cent to
359 TWh.The volume of contracts cleared
rose by 72.5 per cent to 1,180 TWh.The
aggregate contract value of the more than
1,600 TWh traded was NOK 177 billion.
Through much of the year exports from
Norway were high. Net exports to Sweden
and Denmark amounted to a good 20 TWh,
which is a new export record, despite some
import from Finland and Russia. Periodically, the
capacity to Sweden and Denmark of about
4,000 MW was fully exploited.
Technical operations andmaintenanceThe power market indirectly steers
maintenance of facilities to periods when
demand for power and market prices are
expected to be low.The varying demand for
power, combined with an analysis’ of the plants'
technical status thus decide when scheduled
maintenance is carried out.
The expressed goal is to minimise total
maintenance. It is simultaneously a goal to
maintain the highest degree of availability
possible, particularly for those plants that have
high costs when they are not available, as well
as having a high degree of availability at times
when market prices are high.The power plants
are generally characterised by regular and good
maintenance.
In all, technical maintenance shall ensure that
production facilities are flexible enough to
exploit financial opportunities presented by the
current variations in market prices, thus
contributing to an optimal financial result for
Statkraft as a whole.
Over the last few years Statkraft has rehabilitated
a number of dams, focusing on safety, based on
a plan from 1994. Most of the projects in the
original plan have now been completed, but
power plants reverted to the state and
transferred to Statkraft, general ageing, and
new public safety requirements have resulted
in the scope of the plan being expanded. It is
now planned that the programme will be
completed by the end of 2006.
21S T A T K R A F T A N N U A L R E P O R T 2 0 0 0
S t a t k r a f t ’ s b u s i n e s s a r e a s
1938
1990
1989
1949
1943
1998
1950
1961
1957
1999
1987
1948
1988
1985
1981
1973
1932
1946
1979
1958
1986
1974
1952
1991
1939
1968
1956
1963
1951
1955
1960
1970
250000
200000
150000
100000
50000
0
1980
1941
1947
20001998
1999 1997
1996
GW
h
Fig. 2Exploitable inflow inNorway and Sweden
year
Statkraft's power production capacity Installed ProductionNo. of generator media yearplants output in MW in GWh 2)
Plants operated by Statkraft 1) 57 9,147 34,941- Others' rights in 18 of these - -1,385 -4,880
+ Statkraft's share of plants operated by others 30 868 3,102
Total at Statkraft's disposal 87 8,630 33,163+ Power plants leased to others 6 185 1,110
Statkraft total 3) 93 8,815 34,273
1) Including Finnmark Energiverk AS.
2) Estimated loss and consumption for pumping has been deducted
3) In addition to which is the production related to the ownership interests in OEP, BKK, HEAS, SKK and VK in Norway and Sydkraft in Sweden.

RESTRUCTURING OFTHE ENERGY INDUSTRY
Major changes in theEuropean marketThe energy markets in Europe are currently
experiencing rapid and wide-reaching changes.
The Directive for liberalisation of the electricity
market was implemented in 1999 and
deregulation of the European power market
has resulted in increased competition.
Combined with excess power capacity on the
Continent, the result is falling wholesale prices.
Falling wholesale prices have resulted in
reclining profit margins and increased focus on
profit enhancing measures.This, combined with
economies of scale, has brought about
restructuring of the business and consolidation
of power companies. New and bigger
companies are being established. At the same
time some companies are being split up into
smaller units that focus on core areas.
The EU-directive on liberalisation of the gas
market was introduced in 2000.The clear goal
of the directive is to ensure an open gas mar-
ket, similarly to the electricity directive, with a
requirement that at least 30 per cent of the
market shall be able to select a supplier from
August 2000.
Gas is much more widely used as an energy
source on the Continent than in Norway.
Increased integration between gas and electric
power is expected in the future, due to an
increase in the consumption of gas for electricity
production and because many consumer groups
require supplies of both electricity and gas.
Trading in power and gas is expected to
increase in the time to come and will shift
from physical to financial trading.This is
confirmed by the establishment of several
power exchanges on the Continent in 2000,
including those at Leipzig (LPX) and Frankfurt
(EEX). But physical trading is still important,
and a functioning market for financial trade is
not expected for another year or two. And a
well functioning gas market is not expected for
a few more years.
In European terms, the Nordic region has
come far in liberalising and opening the power
market.The same applies to the scope of
financial trading. Greater competition in power
production and the end-user market causes
pressure on margins on power sales. As a result,
one has seen a great deal of restructuring,
among other things through major changes in
the ownership structures.This is particularly
the case in Sweden and Finland where a few
players control relatively high market shares. In
Norway, on the other hand, this tendency has
not been so strong. It is expected that the
Nordic power industry will see more mergers
and the growth of a few dominant energy
companies in the years to come.There is also
considerable interest among European
companies to establish themselves in Norway.
The development in the energy sector is also
in the direction of greater focus on
environmental issues. EU is currently preparing
a directive that promotes production of
renewable energy.The EU has great ambitions
in this respect and has proposed an increase in
renewable energy from 13.9 per cent of total
electricity production in 1997 to 22.1 per cent
in 2010. Renewable energy today is for the
most part based on hydro power, where the
potential for increase is limited. Statkraft has
been working to have electricity from
large-scale hydro power being treated, in
principle, like electricity from windmills,
bio-energy and solar energy. Optimal utilisation
of hydro power resources will be important if
the EU is to achieve its goals.
Statkraft's strategyStatkraft's goal is to expand production capacity,
inter alia by way of acquisitions. In Norway
the objective is to strengthen its position by
acquiring regional companies, and through
them being better suited to face increasing
22 S T A T K R A F T A N N U A L R E P O R T 2 0 0 0
S t a t k r a f t ’ s b u s i n e s s a r e a s
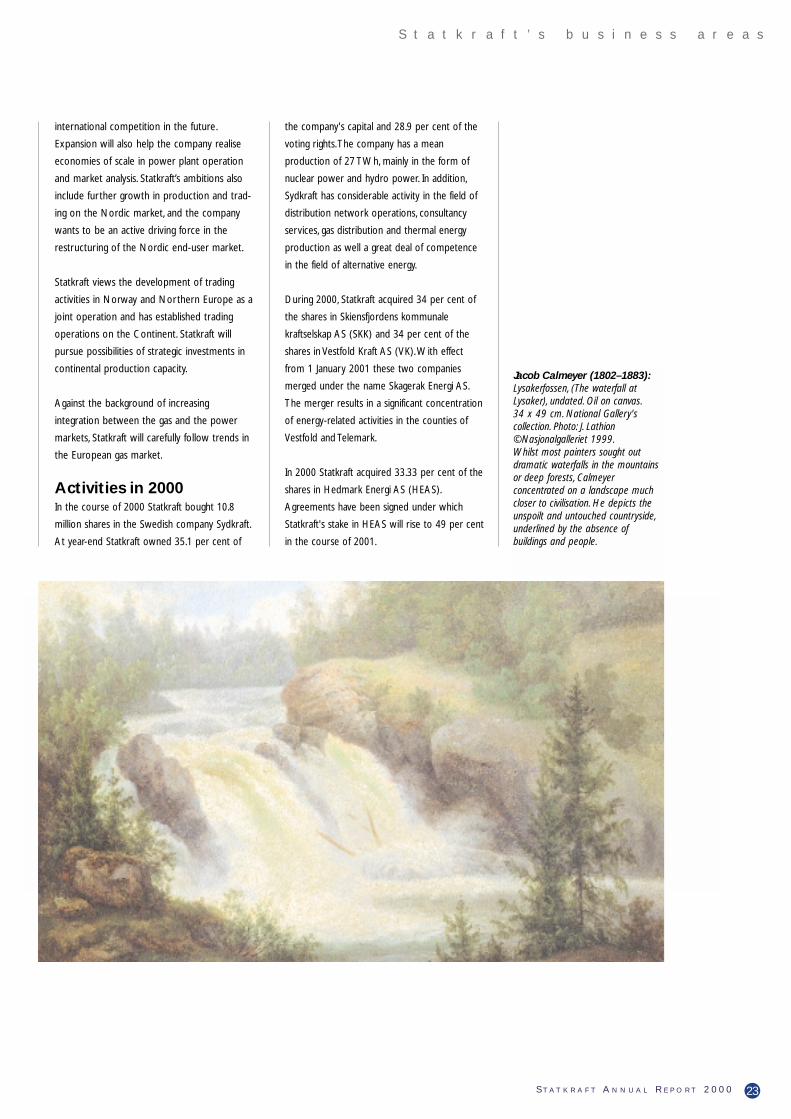
international competition in the future.
Expansion will also help the company realise
economies of scale in power plant operation
and market analysis. Statkraft’s ambitions also
include further growth in production and trad-
ing on the Nordic market, and the company
wants to be an active driving force in the
restructuring of the Nordic end-user market.
Statkraft views the development of trading
activities in Norway and Northern Europe as a
joint operation and has established trading
operations on the Continent. Statkraft will
pursue possibilities of strategic investments in
continental production capacity.
Against the background of increasing
integration between the gas and the power
markets, Statkraft will carefully follow trends in
the European gas market.
Activities in 2000In the course of 2000 Statkraft bought 10.8
million shares in the Swedish company Sydkraft.
At year-end Statkraft owned 35.1 per cent of
the company's capital and 28.9 per cent of the
voting rights.The company has a mean
production of 27 TWh, mainly in the form of
nuclear power and hydro power. In addition,
Sydkraft has considerable activity in the field of
distribution network operations, consultancy
services, gas distribution and thermal energy
production as well a great deal of competence
in the field of alternative energy.
During 2000, Statkraft acquired 34 per cent of
the shares in Skiensfjordens kommunale
kraftselskap AS (SKK) and 34 per cent of the
shares in Vestfold Kraft AS (VK).With effect
from 1 January 2001 these two companies
merged under the name Skagerak Energi AS.
The merger results in a significant concentration
of energy-related activities in the counties of
Vestfold and Telemark.
In 2000 Statkraft acquired 33.33 per cent of the
shares in Hedmark Energi AS (HEAS).
Agreements have been signed under which
Statkraft's stake in HEAS will rise to 49 per cent
in the course of 2001.
23S T A T K R A F T A N N U A L R E P O R T 2 0 0 0
S t a t k r a f t ’ s b u s i n e s s a r e a s
Jacob Calmeyer (1802–1883):Lysakerfossen, (The waterfall atLysaker), undated. Oil on canvas.34 x 49 cm. National Gallery'scollection. Photo: J. Lathion©Nasjonalgalleriet 1999.Whilst most painters sought outdramatic waterfalls in the mountainsor deep forests, Calmeyerconcentrated on a landscape muchcloser to civilisation. He depicts theunspoilt and untouched countryside,underlined by the absence ofbuildings and people.
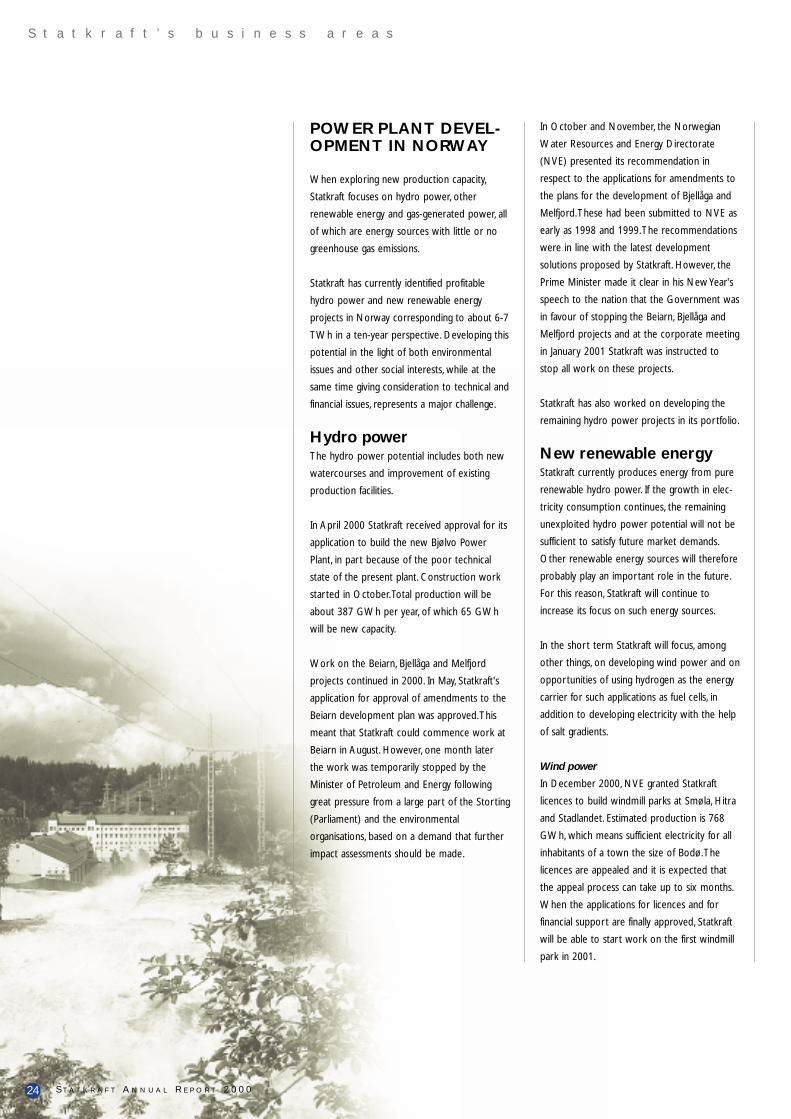
POWER PLANT DEVEL-OPMENT IN NORWAY
When exploring new production capacity,
Statkraft focuses on hydro power, other
renewable energy and gas-generated power, all
of which are energy sources with little or no
greenhouse gas emissions.
Statkraft has currently identified profitable
hydro power and new renewable energy
projects in Norway corresponding to about 6-7
TWh in a ten-year perspective. Developing this
potential in the light of both environmental
issues and other social interests, while at the
same time giving consideration to technical and
financial issues, represents a major challenge.
Hydro powerThe hydro power potential includes both new
watercourses and improvement of existing
production facilities.
In April 2000 Statkraft received approval for its
application to build the new Bjølvo Power
Plant, in part because of the poor technical
state of the present plant. Construction work
started in October.Total production will be
about 387 GWh per year, of which 65 GWh
will be new capacity.
Work on the Beiarn, Bjellåga and Melfjord
projects continued in 2000. In May, Statkraft's
application for approval of amendments to the
Beiarn development plan was approved.This
meant that Statkraft could commence work at
Beiarn in August. However, one month later
the work was temporarily stopped by the
Minister of Petroleum and Energy following
great pressure from a large part of the Storting
(Parliament) and the environmental
organisations, based on a demand that further
impact assessments should be made.
In October and November, the Norwegian
Water Resources and Energy Directorate
(NVE) presented its recommendation in
respect to the applications for amendments to
the plans for the development of Bjellåga and
Melfjord.These had been submitted to NVE as
early as 1998 and 1999.The recommendations
were in line with the latest development
solutions proposed by Statkraft. However, the
Prime Minister made it clear in his New Year's
speech to the nation that the Government was
in favour of stopping the Beiarn, Bjellåga and
Melfjord projects and at the corporate meeting
in January 2001 Statkraft was instructed to
stop all work on these projects.
Statkraft has also worked on developing the
remaining hydro power projects in its portfolio.
New renewable energyStatkraft currently produces energy from pure
renewable hydro power. If the growth in elec-
tricity consumption continues, the remaining
unexploited hydro power potential will not be
sufficient to satisfy future market demands.
Other renewable energy sources will therefore
probably play an important role in the future.
For this reason, Statkraft will continue to
increase its focus on such energy sources.
In the short term Statkraft will focus, among
other things, on developing wind power and on
opportunities of using hydrogen as the energy
carrier for such applications as fuel cells, in
addition to developing electricity with the help
of salt gradients.
Wind power
In December 2000, NVE granted Statkraft
licences to build windmill parks at Smøla, Hitra
and Stadlandet. Estimated production is 768
GWh, which means sufficient electricity for all
inhabitants of a town the size of Bodø.The
licences are appealed and it is expected that
the appeal process can take up to six months.
When the applications for licences and for
financial support are finally approved, Statkraft
will be able to start work on the first windmill
park in 2001.
24 S T A T K R A F T A N N U A L R E P O R T 2 0 0 0
S t a t k r a f t ’ s b u s i n e s s a r e a s

Statkraft's ambition is to develop 2 TWh wind
power by 2010.The company is therefore
considering several other potential locations
along the Norwegian coast as part of its
commitment to wind power. In 2000 wind
conditions were monitored at seven new
coastal sites.
Statkraft's commitment to wind power has
been a major contributor in raising the level of
competence in and insight into wind power
technology. Participation in an R&D project
under the auspices of the Norwegian Research
Council on large-scale integration of wind
power has provided a greater understanding of
component development, local wind conditions
and problems relating to the grid.
Hydrogen
In association with Sydkraft, Statkraft is
undertaking a project that is looking at
hydrogen as an energy carrier in the energy
system of the future.This project has generated
considerable insight into production, storage,
transportation and application of hydrogen,
including ancillary technologies’ potential.
Salt gradients
Statkraft's work on the possibility of using salt
gradients in electricity production continued in
2000.This technology is based on exploiting
pressure differences that arise in an osmosis
process when salt water and fresh water are
kept apart by way of a membrane. In theory,
this pressure is the equivalent of a 270 metre
waterfall that can be used for power
production. A two-year study has verified the
theoretical potential. Furthermore, in association
with the Foundation for Scientific and Industrial
Research (SINTEF) Statkraft has considered
how realistic the exploitation of salt gradients
for the purpose of producing energy is. It is
believed that there is a considerable
exploitable potential in Norway, but there is
still much work to be done before this can
technically and commercially be a supplement
25S T A T K R A F T A N N U A L R E P O R T 2 0 0 0
S t a t k r a f t ’ s b u s i n e s s a r e a s
Johan Gørbitz(1782–1853)Landskapsstudie med vannrenne, (Landscape studywith water pipe), undated. Oilon paper pasted on canvas.30.5 x 39.5 cm. NationalGallery's collection. Photo: K.Ø.Nerdrum ©Nasjonalgalleriet2000.The need to tame nature is acornerstone in the building ofall civilisations.This simplewater pipe is a unambiguoussymbol of how a small devicecan ease day-to-day life andrationalise work for many abusy hand.

to our existing electricity production. It will
probably take many years before the quality of
the membranes is adequate and have the
other qualities necessary.
Gas-fired power plants
Norsk Hydro, Statoil and Statkraft each own
one third of Naturkraft.
In 2000, the company had its emission permit
for the new plants at Kårstø and Kollsnes
changed.The emission requirements for CO2
were eased, but the stringent emission
requirements for NOx were upheld. However,
it opened up for Naturkraft being credited, on
certain conditions, with NOx reducing
measures at other emission sources, so-called
"flexible NOx measures".
As yet, no final decision to build gas-powered
plants has been made.
INTERNATIONALPOWER DEVELOPMENT
An increase in energy demand, market
liberalisation and the privatisation of energy
markets also outside of Europe present
profitable business opportunities for companies
with hydro power competence. Statkraft
therefore wants to be an energy company that
develops and operates electricity production
facilities in selected geographic markets outside
of Europe that have a considerable potential
for new hydro power development. Statkraft
does not involve itself in projects that are
considered to be controversial from an
environmental point of view.
Currently, Statkraft has ownership interests in
two international hydro power companies, one
in Laos and one in Nepal.
LaosTheun Hinboun Power Company has
constructed, owns and operates a 210 MW
run-of-the-river power plant in Laos. Statkraft
has an indirect 10 per cent interest in the
Laotian company through its 50 per cent stake in
Nordic Hydropower AB (NH).Vattenfall owns
the other 50 per cent of NH, which controls a
total of 20 per cent of Theun Hinboun.
The power plant has been in operation since
April 1998. In 2000, about 1.5 TWh was
produced and the company achieved sales of
USD 59.1 million.Virtually all of the power is
sold to Thailand under a 25-year power sales
agreement with EGAT, the state owned energy
company.The power agreement is based 50
per cent on US Dollars and 50 per cent on
Thai Baht. Statkraft received USD 3.2 million as
its return on the investment in Theun Hinboun
in 2000. Since 1998 the company has received
USD 6.8 million in dividends. Statkraft has
invested USD 11 million in Theun Hinboun.
NepalStatkraft owns 74 per cent of the Nepalese
company Himal Power Limited which has built,
owns and operates a 60 MW run-of-the-river
power plant, Khimti I, in Nepal.The power plant
commenced commercial operations on 11 July
2000 and is the first privately financed project
of its type in Nepal.The project was completed
in accordance with the budget and on time.
Khimti I Power Plant increases Nepal's power
production by 25 per cent and generated sales
of USD 12 million in 2000.This is in line with
the budget.The entire electricity production is
sold to the state owned energy company NEA
on a 20-year USD-based power sales
agreement.
In November 1999 the sale of a 23 per cent
shareholding in Himal Power Limited to BKK
AS was negotiated as part of a long planned
reduction in Statkraft's holding.The Nepalese
26 S T A T K R A F T A N N U A L R E P O R T 2 0 0 0
S t a t k r a f t ’ s b u s i n e s s a r e a s

27S T A T K R A F T A N N U A L R E P O R T 2 0 0 0
S t a t k r a f t ’ s b u s i n e s s a r e a s
Frits Thaulow (1847–1906):Haugsfossen ved Modum, (Thewaterfall Haugsfossen at Modum),1883. Oil on canvas. 152 x 100.5cm. National Gallery's collection.Photo: J. Lathion ©Nasjonalgalleriet1995.In many ways, this roaring water-fall, which mankind has learned toexploit, is a good symbol of hydropower. By painting the waterfallfrom a viewpoint directly above thewater, we are invited to see all ofthe fascinating performance thatnature has put on display.

government has now issued the necessary
approval and the agreement was formally
signed in February 2001.
In December 2000 Statkraft received a licence
to consider developing the 27 MW Khimti II,
which is upstream of Khimti I. Further studies
will show whether the project can successfully
be developed.
PeruFor some years, Statkraft has been studying
several projects in Peru, but after the
authorities opted for development of the
Camisea gas field in 1999, no licences have
been issued for hydro power projects. Elections
will be held in the spring of 2001 and it is
expected that a new president will reconsider
the situation in the energy market and that
hydro power development will again be put on
the agenda. Statkraft's project, Cheves (525
MW), was refused a licence in 1999 but the
decision has been appealed.The authorities are
still processing the appeal.
ProspectsStatkraft's ambition is to engage in hydro power
projects in prioritised geographic markets
outside of Europe.Through the developments in
Nepal and Laos the company has documented
that it has the essential competence necessary
to undertake such projects.
28 S T A T K R A F T A N N U A L R E P O R T 2 0 0 0
S t a t k r a f t ’ s b u s i n e s s a r e a s
J.C. Dahl (1788–1857):Labrofossens øvre fall, (The Upper Falls of
the Labrofoss),1855-56. Oil on canvas.164 x 141 cm. National Gallery's collection.
Photo: J. Lathion ©Nasjonalgalleriet.Dahl visited Labrofossen in 1826 and thesketches he made then was the basis ofseveral pictures of the waterfall. The fact
that he returns to the same motif almost30 years later tells us something about theimpression the waterfall made on him.The
goats were probably not as close to the fallas they are in the painting, but it does tellus just how breathtaking the landscape is.

The open electricity market was introduced in
Norway with the Energy Act of 1991.
Simultaneously, distribution network activities
were subjected to strict monopoly control.The
objective was to ensure that the nation's
energy resources should be produced, sold and
consumed in an efficient manner and that
market prices should reflect the scarcity and
thus the optimal value of the electricity. Since
then competition has become fiercer with an
increasing number of countries being linked
into one competitive market.Today, this is
particularly the case for the Nordic countries.
Through its Electricity Directive, which ensures
access to the transmission networks, and other
competition measures, the EU aims to accelerate
the pace of liberalisation in Europe.
Competition calls forharmonisationEach country has its regulatory framework for
the production and sale of electric power.When
several nations are linked in a large energy
market, competition cannot be conducted on
equal terms unless the conditions set by way
of legislation, rules, taxes and duties by the
authorities have a neutral impact on producers
and sellers, irrespective of which country the
activity takes place in. Nor will power be
produced in an efficient manner, and this will
be a loss to society, be it in Norway or in the
Nordic region.
Competitive conditions within the Nordic
countries are not equitable as regards electricity
production and sales. Economic theory says
that fiscal taxes should be levied at consumer
level in order to avoid distortion of competition
between types of energy (nuclear power, hydro
power, bio-power etc.) and between countries.
And environmental duties should be objective
and charged exactly to achieve the effect the
authorities want, e.g. to have an impact on CO2
emissions from various types of fossil energy
carriers (coal, oil, gas) and thus aimed at
production or the means of production.
If the taxes are distorting, the most efficient
producer will not reach the market with the
right volume of his production.The producers
will receive incorrect signals through the tax
system and can therefore be motivated to
increase non-optimal production.This can
result in the "wrong" producers enjoying capital
accumulation and growth.
Framework conditions inthe Nordic regionNorway, Sweden, Finland and Denmark are
now connected to Nord Pool (The Nordic
Power Exchange) and trade power across
national borders under common exchange
regulations. Simultaneously the governments'
terms and conditions for power production are
quite different between the countries. Figure 1
shows the tax and duty system in each country.
In figure 2 one can see that Norway and
Sweden, in the basic case, have more or less
the same tax burden from electricity-related
taxes, but that the Norwegian producers are
adversely affected as prices rise. In this
comparison it should be pointed out that
Sweden has a high nuclear power tax.The
resource rent tax that is specific to Norway is
important, and its affect is quite substantial as
power prices rise. At the same time figure 2
illustrates the importance of the distinctly
Norwegian licence power supplies which, in the
case of rising prices, results in the producers
losing more and more revenue.This
relinquishment of electricity is linked to the
licences that the authorities issue, which might
include a clause stating that up to 10 per cent
of the volume produced shall be transferred to
29S T A T K R A F T A N N U A L R E P O R T 2 0 0 0
R e g u l a t o r y f r a m e w o r k a n d h a r m o n i s a t i o n
Regulatoryframework andharmonisation
Noway Sweden Finland Denmark
Income tax • • • •Resource rent tax •Property tax • • • •Natural resource tax •Nuclear power tax •Licence fees • •Consumption tax • • • •Environmental tax • •1) Natural resource tax is co-ordinated with income tax.
2) The Rural district and fish levy in Sweden might be regarded as a licence fee
Source: ECON
1)
2)
Fig. 1. Power sector taxes and levies inthe Nordic countries
5.0
4.5
4.0
3.5
3.0
2.5
2.0
1.5
1.0
0.5
0.0
Property tax
Nuclear power tax
Licence fee
Rural district and fish levy
Resource rent tax
Compensatory power
Effluent levies and disposalfee for ash
N S SF DK N S SF DK N S SF DK
Base case11.2 øre/kWh
+5 øre/kWh +10 øre/kWh
øre/
kWh
Fig. 2. Simulated changes in electricity taxes asa result of higher prices
N=Norway, S=Sweden, DK=Denmark, SF=Finland
Source: ECON

involved municipal authorities at a price
determined by the Ministry of Petroleum and
Energy. If the market price exceeds the price
determined by the Ministry, the producers lose
the difference between the market price and
the governmentally determined price.
Norwegian electricity production is almost 100
per cent hydro power based. It is therefore
interesting to look more closely at how hydro
power-related taxation is practised in the other
Nordic countries. Denmark's hydro power
production is quite marginal and therefore not
discussed, while the other three countries have
significant production.This is shown in Figure 3.
Again we see that the resource rent tax is a
heavy tax element in Norwegian hydro power
production.
In addition, the transmission of electricity over
the grids must be paid for. If we consider the
duties that the producers must pay to feed
into or use the central grid, Norway has much
higher prices than the other Nordic countries.
This again is in Norwegian producers' disfavour
vis-à-vis producers in the neighbouring
countries. See Figure 4.
In Norway the electricity-specific taxes rise
with rising prices. In our neighbouring countries
and other countries with whom we compete,
taxes are production-dependent or they are
calculated on the basis of an assessment of
value, e.g. property tax, which is not affected by
the price of power.
In addition to the direct financial consequences
of the Norwegian regulatory framework already
mentioned, licensing laws make it difficult to sell
interests in Norwegian energy companies and
therefore hinders the restructuring.
The consequences forhydro power producers inNorwaySeveral framework conditions related to hydro
power production put Norwegian companies
in a weak position, competitively speaking,
compared to companies in the other Nordic
countries:
• Licensing laws make reorganisation that arises
from mergers or acquisition of power plants
difficult.They impair Norwegian competitiveness
compared to similar companies in the Nordic
region and in Europe.
• The Norwegian tax system is more stringent
and takes a larger share of the profit.This
weakens future investment capacity and thus
the ability to restructure. It also reduces the
value of the companies. Calculations indicate
that Norwegian power production facilities
would be worth NOK 70 billion more had tax
rules applicable in Sweden or Finland been
applied in Norway. Norwegian producers are
particularly burdened by the resource rent tax.
• The distribution of tariffs for transmitting
electricity in the central grid between producers
and consumers levies a heavier financial burden
on Norwegian producers than on producers in
neighbouring countries, hence reducing the
value of the Norwegian companies.
In addition to the elements mentioned above,
property tax also distorts competition.
Over the last few years Statkraft, in addition to
ordinary tax on profits, has had its profits
reduced because the Government, as owners,
has taken out an especially high dividend. Seen
in isolation this reduces the company’s future
financial muscle that could have been used in
the restructuring process.
If Norwegian environmentally friendly hydro
power is to be able to compete on equal
terms with power production in other
countries, and if the energy companies are to
be able to obtain sufficient financial strength to
grow and be important players in the future
European market, the authorities must
harmonise legislation and taxes with other
countries.
30 S T A T K R A F T A N N U A L R E P O R T 2 0 0 0
R e g u l a t o r y f r a m e w o r k a n d h a r m o n i s a t i o n
Norway Sweden Finland
Property tax
Income tax
Resource rent tax
1.8
1.6
1.4
1.2
1.0
0.8
0.6
0.4
0.2
0
Fig. 3.Taxation of identical hydropower projectsin Sweden, Finland and Norway. Present valueper kWh in NOK.
Norway Sweden Finland Jutland Sjælland
4.5
4
3.5
3
2.5
2
1.5
1
0.5
0
Fig. 4. Average transmission tariff in maingrids 1999
Kr/k
Wh
øre/
kWh
Source: ECON
Source: Harmonisation Group for Nordic GridEnterprises, Nordel's annual report 1998.
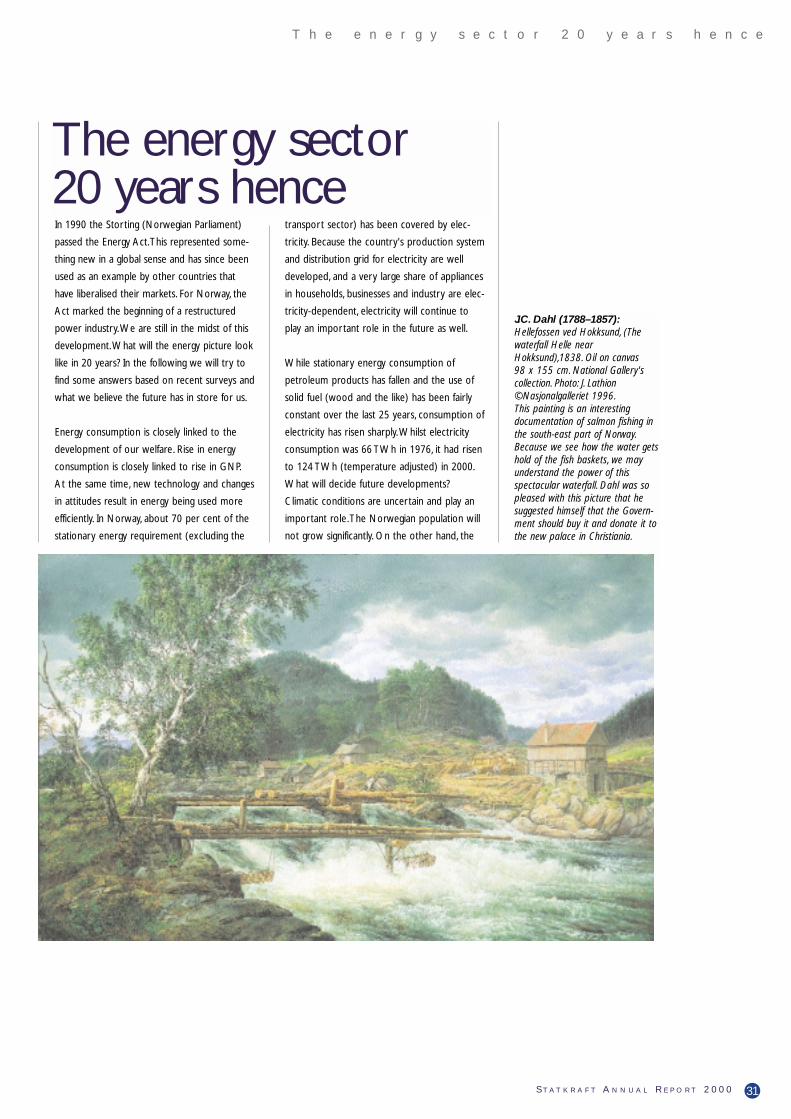
In 1990 the Storting (Norwegian Parliament)
passed the Energy Act.This represented some-
thing new in a global sense and has since been
used as an example by other countries that
have liberalised their markets. For Norway, the
Act marked the beginning of a restructured
power industry.We are still in the midst of this
development.What will the energy picture look
like in 20 years? In the following we will try to
find some answers based on recent surveys and
what we believe the future has in store for us.
Energy consumption is closely linked to the
development of our welfare. Rise in energy
consumption is closely linked to rise in GNP.
At the same time, new technology and changes
in attitudes result in energy being used more
efficiently. In Norway, about 70 per cent of the
stationary energy requirement (excluding the
transport sector) has been covered by elec-
tricity. Because the country's production system
and distribution grid for electricity are well
developed, and a very large share of appliances
in households, businesses and industry are elec-
tricity-dependent, electricity will continue to
play an important role in the future as well.
While stationary energy consumption of
petroleum products has fallen and the use of
solid fuel (wood and the like) has been fairly
constant over the last 25 years, consumption of
electricity has risen sharply.Whilst electricity
consumption was 66 TWh in 1976, it had risen
to 124 TWh (temperature adjusted) in 2000.
What will decide future developments?
Climatic conditions are uncertain and play an
important role.The Norwegian population will
not grow significantly. On the other hand, the
31S T A T K R A F T A N N U A L R E P O R T 2 0 0 0
T h e e n e r g y s e c t o r 2 0 y e a r s h e n c e
The energy sector 20 years hence
J.C. Dahl (1788–1857):Hellefossen ved Hokksund, (Thewaterfall Helle nearHokksund),1838. Oil on canvas 98 x 155 cm. National Gallery'scollection. Photo: J. Lathion©Nasjonalgalleriet 1996.This painting is an interestingdocumentation of salmon fishing inthe south-east part of Norway.Because we see how the water getshold of the fish baskets, we mayunderstand the power of thisspectacular waterfall. Dahl was sopleased with this picture that hesuggested himself that the Govern-ment should buy it and donate it tothe new palace in Christiania.
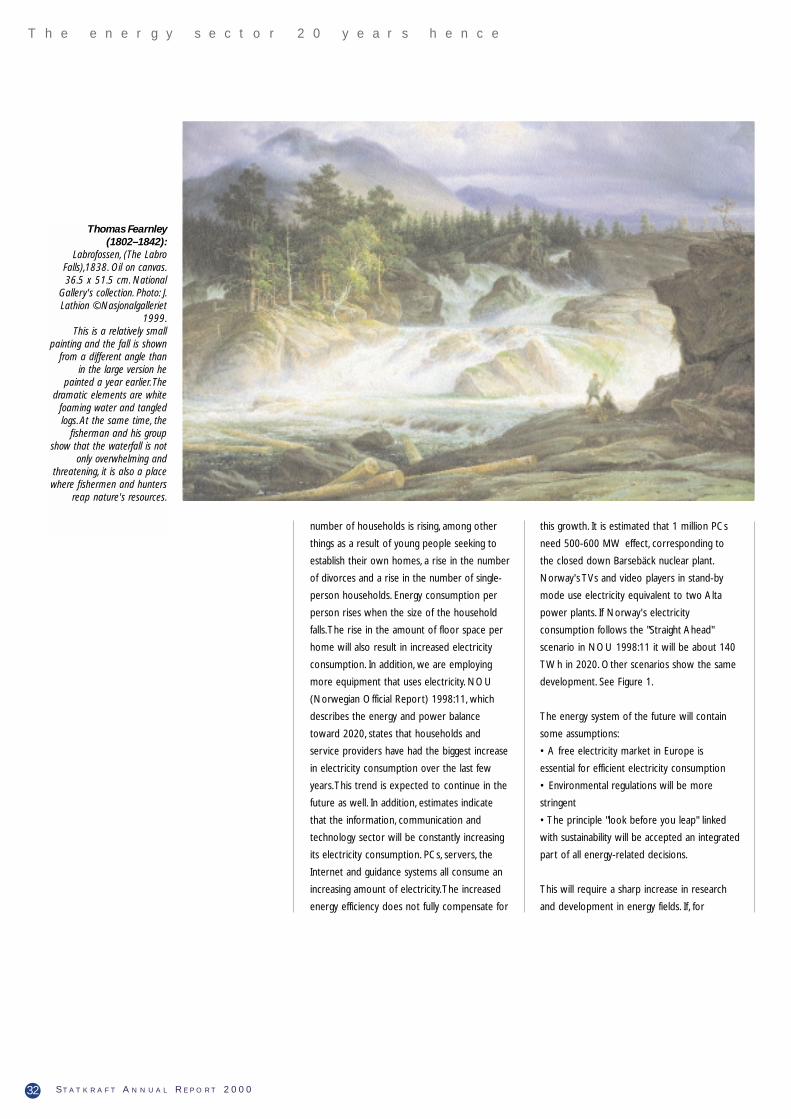
number of households is rising, among other
things as a result of young people seeking to
establish their own homes, a rise in the number
of divorces and a rise in the number of single-
person households. Energy consumption per
person rises when the size of the household
falls.The rise in the amount of floor space per
home will also result in increased electricity
consumption. In addition, we are employing
more equipment that uses electricity. NOU
(Norwegian Official Report) 1998:11, which
describes the energy and power balance
toward 2020, states that households and
service providers have had the biggest increase
in electricity consumption over the last few
years.This trend is expected to continue in the
future as well. In addition, estimates indicate
that the information, communication and
technology sector will be constantly increasing
its electricity consumption. PCs, servers, the
Internet and guidance systems all consume an
increasing amount of electricity.The increased
energy efficiency does not fully compensate for
this growth. It is estimated that 1 million PCs
need 500-600 MW effect, corresponding to
the closed down Barsebäck nuclear plant.
Norway's TVs and video players in stand-by
mode use electricity equivalent to two Alta
power plants. If Norway's electricity
consumption follows the "Straight Ahead"
scenario in NOU 1998:11 it will be about 140
TWh in 2020. Other scenarios show the same
development. See Figure 1.
The energy system of the future will contain
some assumptions:
• A free electricity market in Europe is
essential for efficient electricity consumption
• Environmental regulations will be more
stringent
• The principle "look before you leap" linked
with sustainability will be accepted an integrated
part of all energy-related decisions.
This will require a sharp increase in research
and development in energy fields. If, for
32 S T A T K R A F T A N N U A L R E P O R T 2 0 0 0
T h e e n e r g y s e c t o r 2 0 y e a r s h e n c e
Thomas Fearnley(1802–1842):
Labrofossen, (The LabroFalls),1838. Oil on canvas.36.5 x 51.5 cm. National
Gallery's collection. Photo: J.Lathion ©Nasjonalgalleriet
1999.This is a relatively small
painting and the fall is shownfrom a different angle than
in the large version hepainted a year earlier.The
dramatic elements are whitefoaming water and tangledlogs. At the same time, the
fisherman and his groupshow that the waterfall is not
only overwhelming andthreatening, it is also a placewhere fishermen and hunters
reap nature's resources.
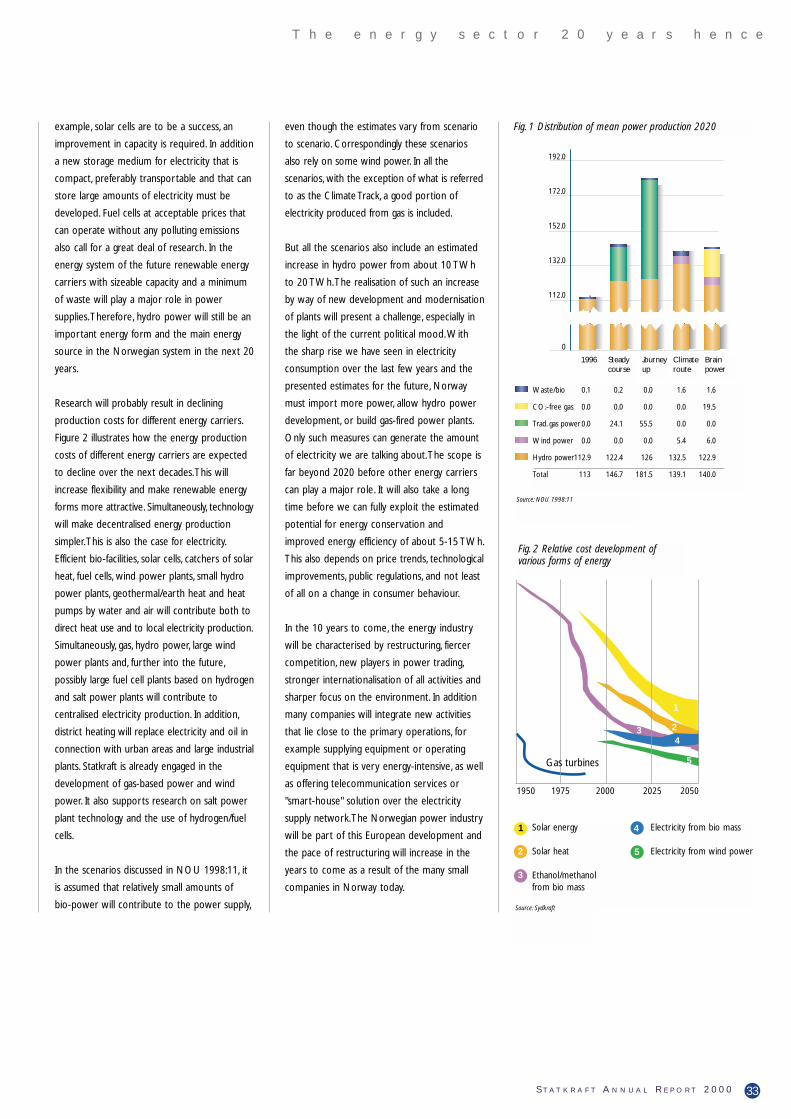
example, solar cells are to be a success, an
improvement in capacity is required. In addition
a new storage medium for electricity that is
compact, preferably transportable and that can
store large amounts of electricity must be
developed. Fuel cells at acceptable prices that
can operate without any polluting emissions
also call for a great deal of research. In the
energy system of the future renewable energy
carriers with sizeable capacity and a minimum
of waste will play a major role in power
supplies.Therefore, hydro power will still be an
important energy form and the main energy
source in the Norwegian system in the next 20
years.
Research will probably result in declining
production costs for different energy carriers.
Figure 2 illustrates how the energy production
costs of different energy carriers are expected
to decline over the next decades.This will
increase flexibility and make renewable energy
forms more attractive. Simultaneously, technology
will make decentralised energy production
simpler.This is also the case for electricity.
Efficient bio-facilities, solar cells, catchers of solar
heat, fuel cells, wind power plants, small hydro
power plants, geothermal/earth heat and heat
pumps by water and air will contribute both to
direct heat use and to local electricity production.
Simultaneously, gas, hydro power, large wind
power plants and, further into the future,
possibly large fuel cell plants based on hydrogen
and salt power plants will contribute to
centralised electricity production. In addition,
district heating will replace electricity and oil in
connection with urban areas and large industrial
plants. Statkraft is already engaged in the
development of gas-based power and wind
power. It also supports research on salt power
plant technology and the use of hydrogen/fuel
cells.
In the scenarios discussed in NOU 1998:11, it
is assumed that relatively small amounts of
bio-power will contribute to the power supply,
even though the estimates vary from scenario
to scenario. Correspondingly these scenarios
also rely on some wind power. In all the
scenarios, with the exception of what is referred
to as the Climate Track, a good portion of
electricity produced from gas is included.
But all the scenarios also include an estimated
increase in hydro power from about 10 TWh
to 20 TWh.The realisation of such an increase
by way of new development and modernisation
of plants will present a challenge, especially in
the light of the current political mood.With
the sharp rise we have seen in electricity
consumption over the last few years and the
presented estimates for the future, Norway
must import more power, allow hydro power
development, or build gas-fired power plants.
Only such measures can generate the amount
of electricity we are talking about.The scope is
far beyond 2020 before other energy carriers
can play a major role. It will also take a long
time before we can fully exploit the estimated
potential for energy conservation and
improved energy efficiency of about 5-15 TWh.
This also depends on price trends, technological
improvements, public regulations, and not least
of all on a change in consumer behaviour.
In the 10 years to come, the energy industry
will be characterised by restructuring, fiercer
competition, new players in power trading,
stronger internationalisation of all activities and
sharper focus on the environment. In addition
many companies will integrate new activities
that lie close to the primary operations, for
example supplying equipment or operating
equipment that is very energy-intensive, as well
as offering telecommunication services or
"smart-house" solution over the electricity
supply network.The Norwegian power industry
will be part of this European development and
the pace of restructuring will increase in the
years to come as a result of the many small
companies in Norway today.
33S T A T K R A F T A N N U A L R E P O R T 2 0 0 0
T h e e n e r g y s e c t o r 2 0 y e a r s h e n c e
1996 Steadycourse
Journeyup
Climateroute
Brainpower
192.0
172.0
152.0
132.0
112.0
0
Fig. 1 Distribution of mean power production 2020
Waste/bio 0.1 0.2 0.0 1.6 1.6
CO2-free gas 0.0 0.0 0.0 0.0 19.5
Trad. gas power 0.0 24.1 55.5 0.0 0.0
Wind power 0.0 0.0 0.0 5.4 6.0
Hydro power112.9 122.4 126 132.5 122.9
Total 113 146.7 181.5 139.1 140.0
Source: NOU 1998:11
Fig. 2 Relative cost development ofvarious forms of energy
1950 1975 2000 2025 2050
Solar energy
Solar heat
Ethanol/methanol from bio mass
Electricity from bio mass
Electricity from wind power
1
24
5
3
1
2
3
4
5
Gas turbines
Source: Sydkraft

Almost 10 years have passed since it was decid-
ed to establish Statkraft SF as a state owned
enterprise with hydro power production as its
core activity. It is natural to ask what type of
added value has been generated under the
auspices of Statkraft SF since the establishment.
One starting point for assessing value added is
often the accounting results the enterprise has
achieved.The return on capital employed
(equity and interest-bearing debt) rose the first
years after establishment (see figure). Since
1996 the return on capital employed has been
fairly stable at about six per cent.
However, the annual accounts do not give a
precise measurement of value added and
return on investment. Annual accounts are
based on history, while the value of a company
lies in its future earnings.The activity that takes
place in a given period of time lays the
foundation for values that can be reaped today
and in the future.Thus, value added in a
commercial context corresponds to the change
in the value of the company in addition to the
annual profit or the cash flow for the year.
Statkraft SF's activities have a time perspective
that exceeds what is normal in most other
industries.Value-based considerations are
therefore important in assessing the return that
Statkraft has achieved.This was also pointed out
in connection with the establishment of
Statkraft SF. In Proposition to the Storting
(Parliament) no. 100 (1990-91) on the estab-
lishment of Statkraft SF, the Ministry of
Petroleum and Energy stated that: "accounts in
accordance with the Accounting Act will not be an
adequate basis for gauging results".
Statkraft SF was established with total assets of
NOK 31 billion, of which NOK 12.4 billion was
equity (40 per cent) and NOK 9.3 billion (30
per cent) was a subordinated loan from the
Government. Interest on the loan was linked to
the enterprise's net income.
The value of the opening balance corresponded
to what was considered to be the fair value of
Statkraft's activities and was based on an
assessment of expected future cash flows (cf.
Proposition to the Storting no. 100).
In August 2000, at the request of the Ministry
of Petroleum and Energy, Ernst & Young
Corporate Finance carried out a valuation of
Statkraft SF, nine years after the opening
balance was fixed.The analysis brings to light
substantial deviations between different
valuation methods and investor assumptions.
This is not unnatural inasmuch as the European
power industry is in the middle of a
restructuring process.The analysis shows that
the value of Statkraft SF is considerably higher
seen from a strategic investor's vantage point
than what a financial investor (stock market
investor) would assume.This is consistent with a
general observation of considerable differences
between how energy companies in Europe are
valued on stock exchanges by financially
oriented investors and outside of stock
exchanges by strategic and industrial investors.
The valuation of Statkraft SF in 1991 was
based on a strategic and industrial approach.
The ownership structure today is the same as
in 1991 and Ernst & Young Corporate
Finance's valuation from 2000 also has a
strategic and industrial approach. Emphasis was
34 S T A T K R A F T A N N U A L R E P O R T 2 0 0 0
S t a t k r a f t S F a n d t h e c r e a t i o n o f v a l u e
Statkraft SF and thecreation of valueBy Arvid Gusland, Ernst & Young Corporate Finance

placed on the value of expected future cash
flows, real options and comparisons with
observed transaction values for power plants.
With this basis, the value of Statkraft SF's
equity was estimated at between NOK 45 and
NOK 50 billion.
In other words, the valuation by Ernst & Young
has much the same foundation as the valuation
on which Statkraft's opening balance was
based. One has, therefore, a value-based
starting point for calculating return and value
added in the enterprise in the period since it
was established.
Based on the opening balance sheet values and
the valuation from 2000, the enterprise's value-
adjusted return on equity from 1992 to the
present date can be calculated at an average of
between 13 and 14 per cent. However, it is cor-
rect to include the subordinated loan as equity
because interest on this loan was linked to net
income.The whole of the subordinated loan
has now been repaid or converted to owner's
capital.The average annual value-adjusted return
on equity and subordinated loan was between
10 and 11 per cent based on the opening
balance sheet and the valuation in 2000.
Much has changed since Statkraft SF's opening
balance was determined. For the value of
Statkraft, the most important element is that
power price expectations (contract prices)
have fallen considerably, and this points toward
a fall in the value during the period.
The fact that Statkraft SF's value has neverthe-
less risen is due to a number of factors. One
important factor is the Statkraft SF's contract
situation. A large part of Statkraft SF's power
supplies have been bound to long-term contracts
to the power-intensive industry, and this reduces
Statkraft SF's dependence on current market
prices. Furthermore, Statkraft SF has entered
into long-term power exchange agreements
with market players on the Continent.These
agreements were entered into during the first
half of the 1990s when the market situation
was different from what we have today and
the alternative cost linked to peak power
production on the Continent was assessed
differently to what it is today.The agreements
further reduced Statkraft SF's dependence on
current market prices. At the same time the
agreements provide an earnings potential that
exceeds the current contract markets in both
the Nordic region and on the Continent.
Another important factor is Statkraft's
distinctive characteristic with a production
structure that separates it from the other
major companies in the Nordic region and
Europe. Statkraft SF's hydro power production
has a high effect and manoeuvring capacity.This
gives added value in an effect situation where
the market in general tightens up.This is about
to happen in the Nordic region.
Other important elements in the valuation of
Statkraft SF are costs related to both
operations and development/reinvestment.
Today, Statkraft SF is operating at a lower cost
level than at the time it was established in
1992. Furthermore, Statkraft SF has not
implemented or started any major and costly
development with the exception of Svartisen
(which was resolved developed before
Statkraft SF was established as a state owned
enterprise).With the developments seen in the
power market during the last decade this has
proven to be sensible.
Statkraft SF has acquired ownership interests in
several regional energy companies over the last
couple of years.There is now a time window
for expansion through acquisition of power
companies owned by municipal and county
authorities because many owners are
considering selling. Statkraft SF is well
positioned to play a major role in this
consolidation, first and foremost in the fields of
power production and wholesale trading.
35S T A T K R A F T A N N U A L R E P O R T 2 0 0 0
S t a t k r a f t S F a n d t h e c r e a t i o n o f v a l u e
1992 1993 1994 1995 1996 1997 1998 1999 2000
12 %
10 %
8 %
6 %
4 %
2 %
0 %
Statkraft SF – creation of value.
Return on capital employed (operating income incl. shareof results of associated companies/capital employed)
Average value adjusted return(equity + subordinated loan)
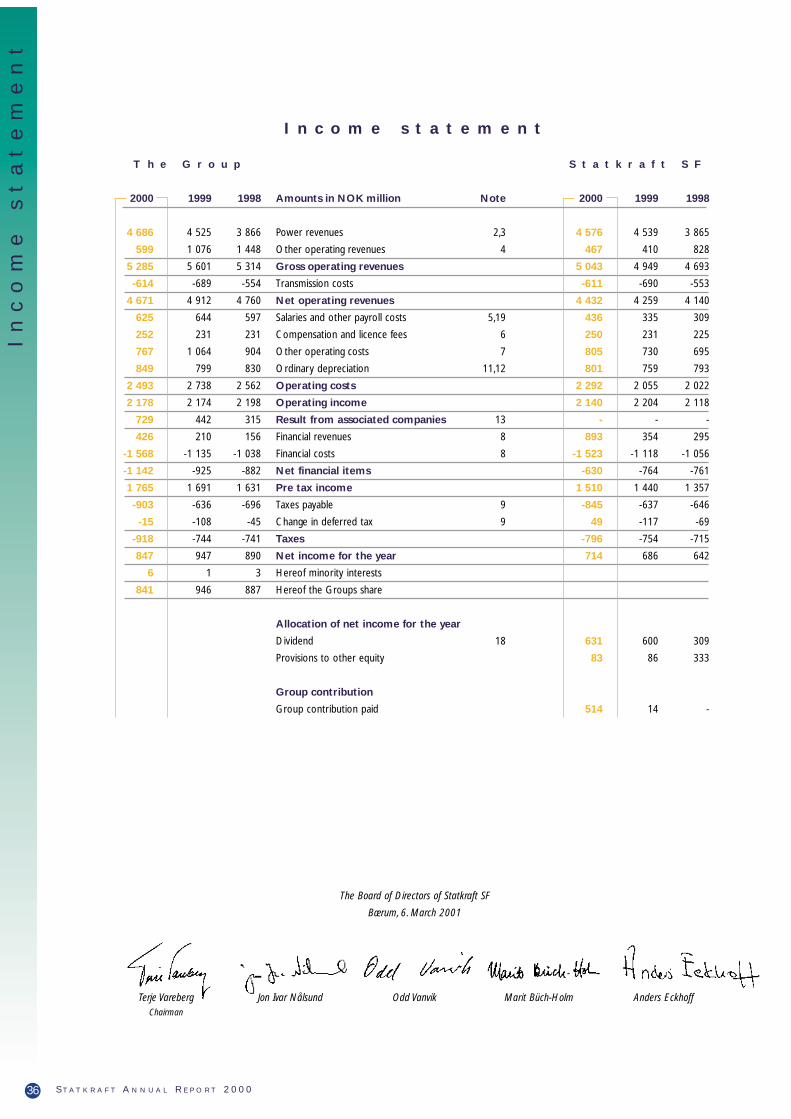
In
co
me
s
ta
te
me
nt
T h e G r o u p S t a t k r a f t S F
2000 1999 1998 Amounts in NOK million Note 2000 1999 1998
4 686 4 525 3 866 Power revenues 2,3 4 576 4 539 3 865
599 1 076 1 448 Other operating revenues 4 467 410 828
5 285 5 601 5 314 Gross operating revenues 5 043 4 949 4 693
-614 -689 -554 Transmission costs -611 -690 -553
4 671 4 912 4 760 Net operating revenues 4 432 4 259 4 140
625 644 597 Salaries and other payroll costs 5,19 436 335 309
252 231 231 Compensation and licence fees 6 250 231 225
767 1 064 904 Other operating costs 7 805 730 695
849 799 830 Ordinary depreciation 11,12 801 759 793
2 493 2 738 2 562 Operating costs 2 292 2 055 2 022
2 178 2 174 2 198 Operating income 2 140 2 204 2 118
729 442 315 Result from associated companies 13 - - -
426 210 156 Financial revenues 8 893 354 295
-1 568 -1 135 -1 038 Financial costs 8 -1 523 -1 118 -1 056
-1 142 -925 -882 Net financial items -630 -764 -761
1 765 1 691 1 631 Pre tax income 1 510 1 440 1 357
-903 -636 -696 Taxes payable 9 -845 -637 -646
-15 -108 -45 Change in deferred tax 9 49 -117 -69
-918 -744 -741 Taxes -796 -754 -715
847 947 890 Net income for the year 714 686 642
6 1 3 Hereof minority interests
841 946 887 Hereof the Groups share
Allocation of net income for the year
Dividend 18 631 600 309
Provisions to other equity 83 86 333
Group contribution
Group contribution paid 514 14 -
36 S T A T K R A F T A N N U A L R E P O R T 2 0 0 0 S T A T K R A F T
I n c o m e s t a t e m e n t
The Board of Directors of Statkraft SF
Bærum, 6. March 2001
Terje VarebergChairman
Jon Ivar Nålsund Odd Vanvik Marit Büch-Holm Anders Eckhoff

T h e G r o u p S t a t k r a f t S F
2000 1999 1998 Amounts in NOK million Note 2000 1999 1998
ASSETS
2 109 2 123 2 230 Intangible assets 11 2 235 2 026 2 143
25 596 26 095 26 520 Property, plant and equipment 12 23 975 24 600 25 214
22 214 14 348 7 616 Investments in subsidiaries and associated companies 13 8 627 8 262 5 752
1 959 1 717 1 391 Other financial assets 14 17 049 8 197 3 947
51 878 44 283 37 757 Fixed assets 51 886 43 085 37 056
34 31 31 Inventories 33 30 30
1 040 1 308 1 326 Receivables 15 1 099 1 114 1 195
150 146 1 520 Investments 16 - 6 1 405
2 514 1 299 1 796 Bank deposits, cash and cash equivalents 17 1 062 1 012 1 623
3 738 2 784 4 673 Current assets 2 194 2 162 4 253
55 616 47 067 42 430 Assets 54 080 45 247 41 309
EQUITY AND LIABILITIES
19 250 19 250 15 400 Owner’s capital 18 19 250 19 250 15 400
- - - Share premium fund - - -
19 250 19 250 15 400 Paid-in capital 19 250 19 250 15 400
80 83 87 Minority interests 18 - - -
- - - Reserve for valuation variances - - -
2 412 2 170 1 835 Other equity 18 1 528 1 444 1 359
2 412 2 170 1 835 Retained earnings 1 528 1 444 1 359
21 742 21 503 17 322 Total equity 20 778 20 694 16 759
394 146 31 Provisions 19 231 112 17
98 82 3 921 Subordinated loan - - 3 850
30 557 21 681 18 097 Other long-term liabilities 20 30 482 21 018 17 782
31 049 21 909 22 049 Long-term liabilities 30 713 21 130 21 649
89 1 348 500 Interest-bearing liabilities 21 88 1 348 500
692 573 611 Taxes payable 9 640 578 572
2 044 1 734 1 948 Other non interest-bearing liabilities 22 1 861 1 497 1 829
2 825 3 655 3 059 Current liabilities 2 589 3 423 2 901
55 616 47 067 42 430 Equity and liabilities 54 080 45 247 41 309
2 100 2 105 2 109 Mortgages 23 2 100 2 105 2 106
6 750 2 466 1 426 Guarantees 23 6 652 2 172 1 780
Ba
la
nc
e
sh
ee
t
37S T A T K R A F T A N N U A L R E P O R T 2 0 0 0
B a l a n c e s h e e t
Tom Andersen Jan Stenersen Toril Mølmshaug Ingvild Ragna Myhre Lars Uno ThulinPresident and C.E.O.
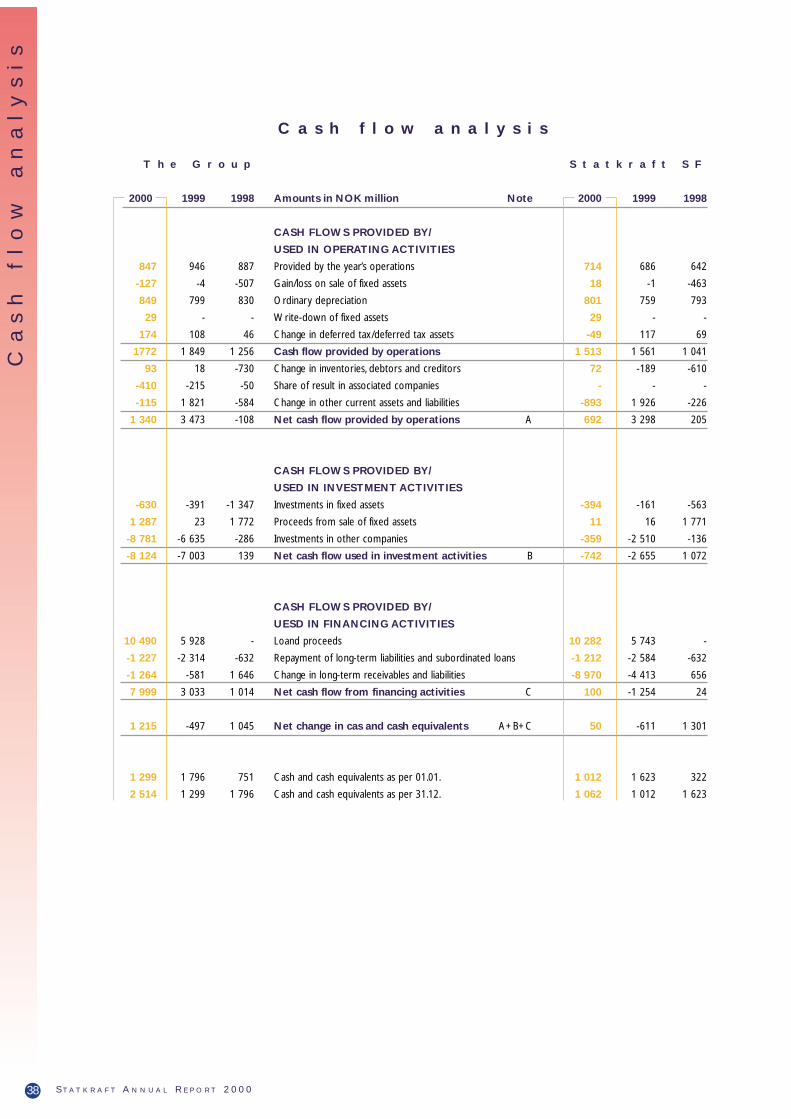
Ca
sh
f
lo
w
an
al
ys
is
T h e G r o u p S t a t k r a f t S F
2000 1999 1998 Amounts in NOK million Note 2000 1999 1998
CASH FLOWS PROVIDED BY/
USED IN OPERATING ACTIVITIES
847 946 887 Provided by the year’s operations 714 686 642
-127 -4 -507 Gain/loss on sale of fixed assets 18 -1 -463
849 799 830 Ordinary depreciation 801 759 793
29 - - Write-down of fixed assets 29 - -
174 108 46 Change in deferred tax/deferred tax assets -49 117 69
1772 1 849 1 256 Cash flow provided by operations 1 513 1 561 1 041
93 18 -730 Change in inventories, debtors and creditors 72 -189 -610
-410 -215 -50 Share of result in associated companies - - -
-115 1 821 -584 Change in other current assets and liabilities -893 1 926 -226
1 340 3 473 -108 Net cash flow provided by operations A 692 3 298 205
CASH FLOWS PROVIDED BY/
USED IN INVESTMENT ACTIVITIES
-630 -391 -1 347 Investments in fixed assets -394 -161 -563
1 287 23 1 772 Proceeds from sale of fixed assets 11 16 1 771
-8 781 -6 635 -286 Investments in other companies -359 -2 510 -136
-8 124 -7 003 139 Net cash flow used in investment activities B -742 -2 655 1 072
CASH FLOWS PROVIDED BY/
UESD IN FINANCING ACTIVITIES
10 490 5 928 - Loand proceeds 10 282 5 743 -
-1 227 -2 314 -632 Repayment of long-term liabilities and subordinated loans -1 212 -2 584 -632
-1 264 -581 1 646 Change in long-term receivables and liabilities -8 970 -4 413 656
7 999 3 033 1 014 Net cash flow from financing activities C 100 -1 254 24
1 215 -497 1 045 Net change in cas and cash equivalents A+B+C 50 -611 1 301
1 299 1 796 751 Cash and cash equivalents as per 01.01. 1 012 1 623 322
2 514 1 299 1 796 Cash and cash equivalents as per 31.12. 1 062 1 012 1 623
C a s h f l o w a n a l y s i s
38 S T A T K R A F T A N N U A L R E P O R T 2 0 0 0 S T A T K R A F T
Accounting principles
The accounts are prepared in accordance with the law and
Norwegian accounting standards. Statkraft SF is established as a
state-owned enterprise, and its activities are regulated by the Act
relating to State-owned Enterprises.
Consolidation and Group accounts
The Group accounts include those companies where Statkraft has
a controlling interest. If a subsidiary is considered immaterial to the
Group, this might result in it not being consolidated.
Subsidiaries that are acquired or established during the year are
included with effect from the date of acquisition/date of establish-
ment. Subsidiaries are included in the consolidated accounts in
accordance with the purchase method of accounting.The difference
between the price paid for the subsidiary’s shares and the book
value of the equity is, on the basis of a valuation, allocated to those
specific company assets and liabilities that have values that differ
from the book values. Insofar as differences cannot be assigned to
the values of assets and liabilities, they are recorded as
goodwill/negative goodwill.
In the Group accounts, inter-company sales and receivables are
eliminated, as are inter-company profits related to the Group’s
own investments.
The accounts of foreign subsidiaries are translated to Norwegian
kroner at current exchange rates. Possible conversion differences
are recorded directly against other equity.
Power plants with joint ownership, being power plants operated by
Statkraft but with other owners as well, and plants others operate,
but where Statkraft has an ownership interest, are carried on the
balance sheet at the value of Statkraft’s holding in accordance with
the gross method of accounting. Co-owners directly administer
electricity produced, with the exception of licensed power.
Statkraft’s share of the electricity is included in power revenues.
Other operating revenues and operating costs are recorded in
accordance with the gross method of accounting in accordance
with Statkraft’s pro rata shares.
Power drawn from partly owned companies organised as joint-stock
companies is included in power revenues. Statkraft’s share of other
operating revenues and operating costs is included in accordance
with the shareholder agreement.The shares are recorded at cost.
Power plants that are leased to others are recorded gross in the
accounts, the gross leasing charge being recorded as other opera-
ting revenues and operating costs etc. under their respective cost
caption.
Associated companies, defined as companies where Statkraft has a
considerable but not decisive influence, are treated in accordance
with the equity method of accounting in the consolidated accounts
if their size is significant.This means that the Group's share of the
associated company is recorded at cost as a fixed asset in the
balance sheet, adjusted for the part of the accumulated net result
after tax in the associated company, less dividend received, depre-
ciation of added value and possible currency adjustments. The
Group’s part of the associated company’s net income after tax less
added value depreciation is shown as a separate item in the
Group's income statement
Principles governing revenue and cost accounting
Revenues relating to goods and services are, as a general rule,
recognised when they are earned, while costs are recorded in
accordance with the accrual principle. Dividend from companies
where Statkraft has a decisive influence is recognised according to
the earnings principle, while dividend from other companies is
recognised in accordance with the cash principle. Contracts involving
substantial prepayments are recognised as delivery is made. Interest
revenue on the prepayment is classified as operating revenue.
Financial instruments
Financial instruments in power trading are financial bilateral con-
tracts, forwards/futures contracts, and options.The valuation of the
financial instruments is dependent on whether they are considered
to be hedging or trading contracts. The principles for valuation
appear from the paragraph on revenue from power trading below.
Option premium
Paid and received option premium for future power supplies on
fixed terms is recorded in the balance sheet and taken to income
in line with realised deliveries, or at the time that the option lapses
or at the date of a counter-trade or at the time it is realised that
the value of the contract is lower than the premium paid.
Recording of revenue from power trading
Power production Statkraft's power production is taken to
income as produced volume times sales price.
Hedging Statkraft hedges power production by entering into
physical or financial contracts.All physical and financial trading within
the company's production capacity is accounted for as hedging.
Production capacity is defined as the production capacity that the
company is 80 per cent certain to achieve. Both sales and purchase
positions are considered hedging. Loss/gains on hedging contracts,
calculated as the margin between contract price and spot price,
are recorded on realisation as a correction to power revenues.
No valuation is made in the intermediate period. If net sales
obligations exceed production capacity, the hedging contracts are
transferred to the trading portfolio based on the LIFO principle.
Trading Physical and financial sales and purchase contracts that
are not covered by production capacity, are recorded as trading.
Trading contracts are valued on the lower value principle on a
portfolio basis. Unrealised losses are recorded, but unrealised gains
are not recognised. Contracts originally entered into for trading are
not transferred to the hedging portfolio, even if they can be satis-
fied by production capacity.
Current production contracts
In the case of ongoing projects, revenues are recorded by the
Group’s companies in accordance with the percentage of comple-
tion method.This implies that income is recorded in line with the
Ac
co
un
ti
ng
p
ri
nc
ip
le
s
Accounting principles
39S T A T K R A F T A N N U A L R E P O R T 2 0 0 0

Ac
co
un
ti
ng
p
ri
nc
ip
le
s
progress of the individual project. A project’s income is defined as
revenue less assignable costs. Assignable costs are comprised of
materials, payroll costs, sub-contractors, machine leases and local
management.
Current appraisal of work in progress will, in many cases, entail
uncertainty and estimates.The final result of the individual project
may, therefore, deviate from what is reflected in the accounts for
the previous years. In the case of projects that are expected to
result in an overall loss, the total estimated loss is charged as per
31 December in its entirety.
Public grants
Public subsidies are assessed on an individual basis, and are recorded
in the accounts as a correction to the item for which the subsidy
is intended.
Compensation
The Group pays compensation to landowners for the right to use
waterfalls and ground. In addition, compensation is paid to others
for damage caused to forests, land, telecommunication lines etc.
These payments are in part lump sum, and in part recurring in the
form of cash payments or in kind by the supply of compensatory
power etc. Lump sum payments of compensation in relation to
new power plants are capitalised as part of the investment in the
plant, and depreciated over the life of the plant, while recurring
payments are charged as costs as they arise.
The present value of future compensation is calculated, and can be
seen from the Notes to the Accounts
Licence fees
Licence fees are paid annually to the Government and to local
authorities, for the increase in hydroelectric power that is obtained
from regulating water courses and catchment transfers.These fees
are therefore permanent and payable so long as the licensee uses
the watercourse regulations on which they are based.These licence
fees are expensed as incurred.The present value of future fees is
calculated and can be seen from the Notes to the accounts.
Research and development costs
Project development and project engineering costs are expensed
through to critical action. Critical action is in place when necessary
resolutions are passed and approval given. In the case of domestic
projects, this means a Board resolution and a licence is obtained, if
required, and for foreign projects a Board resolution and financial
closing.
Maintenance
Ongoing maintenance is recorded as an expense on a continuous
basis.
Taxes
With effect from 1997, new tax regulations for the power sector
were introduced. Both Statkraft SF and the subsidiary Finnmark
Energiverk AS are subject to these taxation rules. The other
subsidiaries in the Group are subject to ordinary income tax
pursuant to the Tax Act.The Group must therefore deal with four
different types of tax, namely property tax, natural resource tax,
resource rent tax, and income tax.
Property tax This tax is not related to income and is calculated
on the basis of the assessed value for taxation purposes. Property
tax amounts to up to 0.7 per cent of these values. New rules for
the calculation of property tax have been adopted with effect
from the year 2001.
Natural resource tax Natural resource tax is an income-inde-
pendent tax that is calculated on the basis of the individual power
plant's average production over the last seven years.The tax rate
is NOK 0.013 per kWh. Income tax can be offset against natural
resource tax paid. Any natural resource tax not offset can be car-
ried forward, together with interest, to later years, and is recorded
as prepaid tax.
Resource rent taxThe resource rent tax is to some extent inco-
me-related. It is calculated on the individual plant's production,
hour by hour, multiplied by the spot price in the corresponding
hour. In the case of supplies of licence power and power on long-
term contracts with a term of more than seven years, the actual
contract price is applied.The calculated revenue is thereafter redu-
ced by the actual operating costs, depreciation and tax-free reve-
nues, in order to arrive at the tax base; net resource rent revenue.
Tax-free revenues amount to 9.8 per cent of the value of the plant's
operating assets for taxation purposes. The resource rent tax
amounts to 27 per cent of net resource rent revenues at each
power plant. Negative net resource rent revenues per power plant
can be carried forward and offset against later positive resource rent
income, with interest, in the same power plant.This forms part of the
basis for calculating deferred tax assets in resource rent taxation,
together with deferred tax assets related to temporary difference in
operating assets in power production.Calculating deferred tax assets
in resource rent taxation takes into account the tax-free income, as
a correction to the nominal tax rate. The estimate for effective
resource rent tax is based on assessments made for all power plants
where it is probable that there will be positive resource rent
revenues within a 15-year horizon. The average tax rate over the
selected time horizon is 20 per cent and that has been used as the
effective rate for deferred tax assets in the resource rent taxation.
Income tax Income tax is calculated in accordance with ordinary
taxation rules.The tax charge in the income statement comprises
taxes payable and changes in deferred tax/deferred tax assets.
Taxes payable are calculated on the basis of the year's taxable
result.
Deferred tax/deferred tax assets are calculated on the basis of
temporary differences between values for accounting and taxation
purposes and the effect on taxes of carry forward losses. Deferred
tax assets in the balance sheet are only recorded to the extent
that it is probable that the asset will be realised in the future.Tax
related to equity transactions, for example group contributions, is
recorded against equity.
Classification of balance sheet items
Assets intended for retention by or long-term use in Group com-
panies are classified as fixed assets. Other assets are classified as
40 S T A T K R A F T A N N U A L R E P O R T 2 0 0 0 S T A T K R A F T

current assets. Receivables falling due within one year are never-
theless classified as current assets.The same criteria are applied to
current and long-term liabilities.
Fixed assets are recorded at acquisition cost and are written down
to market value when the decrease in value is not considered to
be of a temporary nature. Fixed assets with a limited useful eco-
nomic life are depreciated systematically. Long-term liabilities are
recorded in the balance sheet at the nominal amount received at
the time the liability was established. Long-term liabilities are not
appreciated to market value as a result of changes in interest rates.
Current assets are valued at the lower of cost and market value.
Current liabilities are recorded in the balance sheet at the nominal
amount received at the time the liability was established. Current
liabilities are not appreciated to market value as a result of changes
in interest rates.
Intangible assets
Costs relating to intangible assets, including costs of research and
development, are recorded in the balance sheet to the extent the
requirements for such recording have been fulfilled.
Property, plant and equipment
Investments in production facilities and other long-term assets are
capitalised and depreciated on a straight-line basis over the expected
useful economic life of the asset from the date the asset is put into
ordinary operations. Investments in power plants not operated by
Statkraft SF, are similarly depreciated using an average rate of
depreciation.
Accrued costs of inter-company construction work are recorded as
cost reductions. Interest on building loans for major investments is
calculated and capitalised. Rights associated with waterfalls, and the
rights to take over power plants that will revert to state ownership,
are capitalised at cost and are not depreciated. Reverted power
plants will be depreciated from the date they are taken over.
Shares and interests in subsidiaries and
associated companies
These are recorded in accordance with the cost method in the
enterprise’s accounts. Dividend received and other distributions of
income from the companies are recorded as financial income.
Shareholdings in associated companies of a significant size are dealt
with in accordance with the equity method in the consolidated
accounts, while shareholdings of an insignificant size are dealt with
according to the cost method.
Other shares and interests classified as fixed assets
These are recorded according to the cost method in the compa-
ny's accounts and the consolidated accounts. Dividend received is
recorded as financial income.
Inventories/spare parts
Standard inventories and spare parts that have been purchased for
the operations of the power plants are recorded as current assets
and evaluated on the lower value principle. Non-standard spare
parts that are related to specific long-term assets or groups of
capital assets are capitalised, and depreciated over the economic
life of the underlying asset.
Reservoir inventory
Water in the reservoirs is not recorded as an asset in the accounts.
Details of volumes are to be found in the Notes to the Accounts.
Receivables
Accounts receivable and other receivables are recorded at nomi-
nal value less provisions for bad debts. Provisions for bad debts are
made on the basis of an individual assessment of each receivable.
Shares, bonds, certificates etc.
Shares, bonds and certificates etc. that are classified as current
assets are, for each group of assets, valued on a portfolio basis on
the lower value principle.
Foreign currencies
Monetary items denominated in foreign currencies are translated
at the exchange rates on the balance sheet date. Liabilities in foreign
currencies that are taken up as part of the hedging of assets or
future income in the same foreign currency are, however, recorded
at the rate applicable on the date of the transaction. Liabilities in
the consolidated accounts that secure assets that are converted at
the current rate, are also converted at the current rate.
Conversion differences are recorded directly against equity.
Pension costs
In the accounts, pension costs and pension obligations are treated
in accordance with the Draft Norwegian Accounting Standard for
pension costs. The enterprise’s pension scheme is treated as a
benefit plan.
The net pension cost for the period is included in salaries and
other payroll costs and is made up of the period's pension ear-
nings, the interest expenses for the obligation that has occurred
and the expected yield on pension assets.
Prepaid pension is the difference between a fair value of the pen-
sion assets and the present value of the estimated pension obliga-
tions, and is entered as a long-term asset in the balance sheet.
Correspondingly, a long-term liability arises in the accounts when
the pension obligations exceed the pension assets.The effect of a
change in assumptions, estimate deviations when calculating pen-
sion obligations, and the difference between projected and actual
yield on pension assets, are recorded in the accounts in the year
they arise.
Principles for cash flow analysis
The cash flow analysis is prepared using the indirect method. This
implies that the analysis is based on the company's net income/loss
for the year in order to show cash flows generated by the operating
activities, investment activities, and financing activities respectively.
Ac
co
un
ti
ng
p
ri
nc
ip
le
s
41S T A T K R A F T A N N U A L R E P O R T 2 0 0 0

No
te
s
to
t
he
a
cc
ou
nt
s
42 S T A T K R A F T A N N U A L R E P O R T 2 0 0 0 S T A T K R A F T
Note 1LARGE SINGLE TRANSACTIONS
In the year 2000 Statkraft SF sold its subsidiary Statkraft Anlegg AS.This produced a gain, before tax, of NOK 64 million and NOK 6million in the Enterprise’s accounts and the consolidated accounts respectively. Statkraft Invest AB, a subsidiary of a subsidiary, sold ashareholding in Sydkraft in 2000 which resulted in a gain of NOK 145 million before tax in the consolidated accounts. During the yearStatkraft SF acquired shares in Hedmark Energi AS,Vestfold Kraft AS, Skiensfjordens kommunale kraftselskap AS and Sydkraft AB.Reference is made to note 13 for further details.
Note 2POWER SALES
Statkraft optimises its power production based on an assessment of the value of available water compared to the actual and expected futurespot price.This is done irrespective of contracts entered into. In the event that Statkraft has physical contractual obligations to supply powerthat deviate for actual production, the difference is either bought or sold in the open market. Necessary spot purchases are recorded as acorrection of power revenues. Physical and financial contracts are used to hedge the underlying production by way of entering into optionsto buy or sell. Sales positions are assumed to hedge the price of a specific fraction of planned future production. Purchase positions areentered into to adjust the hedging level if assumptions change and Statkraft realises that the hedged fraction is too high. All contracts arerecorded as an adjustment of the underlying revenue from production based on the margin between contract price and spot price.
Statkraft SF
amounts in NOK million 2000 1999 1998
Production at spot prices 4 142 3 654 3 773
Gain/loss on industrial contracts and free contracts:
Industrial contracts with prices determined by the Storting -45 -266 -452
Price hedging free contracts -124 387 459
Other net revenue power sales 1) 603 764 85
Total 4 576 4 539 3 865
1) Includes gain/loss on trading, margin on production optimising, international exchange contracts and licence power for power plants outside the Group
Statkraft has the following long-term physical sales contracts with the power-intensive and the wood processing industries at terms set bythe Storting (Parliament) together with delivery obligations at cost to licence power recipients:
figures in TWh 2001 2002 2003 2004 2005 2006 2007 2008 2009 2010 2011
Firm sales agreements 20.4 20.4 20.3 20.0 17.4 15.6 13.4 11.3 11.3 11.3 3.2
In addition, Statkraft has other physical contractual obligations of varying duration to both domestic and foreign customers. Statkraft hasno long-term physical purchase obligations of significance. Power trading was divided among the geographic markets as follows:
Statkraft SF
figures in TWh 2000 1999 1998
Home market (incl. Sweden and Finland) 38.8 31.0 31.5
Denmark 0.6 0.7 0.7
Germany 0.8 0.8 0.2
Total 40.2 32.5 32.4

No
te
s
to
t
he
a
cc
ou
nt
s
43S T A T K R A F T A N N U A L R E P O R T 2 0 0 0
Note 3WATER RESERVOIRS AND SALEABLE PRODUCTION
reservoirs saleable production
figures in maximum
TWh 31.12.2000 31.12.1999 31.12.1998 capacity 2000 1999 1998 Mean
28.2 28.5 25.3 33.9 40.2 32.5 32.4 33.2
In a normal year, the water in reservoirs varies around the average level by - 11 TWh at the minimum in April, and + 5 TWh at themaximum in October. Inflow in 2000 was extremely high, but correspondingly high production results in reservoir levels at the turn of the year being at about the same level as at the end of 1999.
Note 4OTHER OPERATING REVENUES
the Group Statkraft SF
2000 1999 1998 amounts in NOK million 2000 1999 1998
239 223 181 Revenues from leasing out power plants 239 223 197
94 121 77 Revenues from leasing out transmission lines 93 119 78
255 720 663 Other lease revenues and sale of services 66 60 62
11 10 507 Gain on sale of fixed assets 69 6 471
- 2 20 Tax refunds relating to years prior to 1992 - 2 20
599 1 076 1 448 Total 467 410 828
The decline in other lease revenues and sale of services is mainly a result of Statkraft Anlegg not being part of Statkraft Group with effectfrom 2000.
The tax refunds refer to refunds of tax by local authorities for the years prior to the establishment of state owned enterprise.
Pursuant to the regulations to the Energy Act, separate accounting information is presented for the profit centres for the central grid, theregional grid and distribution network (monopoly activities) for Statkraft SF, cf. revenues from leasing power transmission lines above.Thefigures for 2000 will be finally settled in 2001.The revenue ceiling for 2000 is NOK 100.9 million.
central grid regional grid distribution grid
amounts in NOK million 2000 1999 2000 1999 2000 1999
Operating revenues 1) 62.5 65.3 36.8 31.6 1.6 0.1
Operating costs 31.6 26.6 16.6 15.6 2.9 0.9
Result 30.9 38.7 20.2 16.0 -1.3 -0.8
Correction 1.2 3.8 12.8
Corrected result 30.9 37.5 20.2 12.2 -1.3 -13.6
Yield 17.6 % 15.9 % 15.7% 7.8% -9.8% -52.1%
1) Revenues from plants run by others are not included.
Corrections arise as a result of estimated operating costs made in connection with the closing of the accounts deviating from the exactfigure that is reported to the Norwegian Water Resources and Energy Directorate (NVE) in June.

44 S T A T K R A F T A N N U A L R E P O R T 2 0 0 0 S T A T K R A F T
No
te
s
to
t
he
a
cc
ou
nt
s
Note 5SALARIES AND OTHER PAYROLL COSTS
the Group Statkraft SF
2000 1999 1998 amounts in NOK million 2000 1999 1998
512 507 484 Salaries 371 268 257
27 72 61 National insurance contribution 51 35 30
17 51 31 Pension costs 13 31 21
69 14 21 Other benefits 1 1 1
625 644 597 Total 436 335 309
A provision of NOK 80 million has been made in 2000 in connection with the future workforce reduction in the production division.Theamount relates to early retirements and various severance packages.
Salary to the President and C.E.O. of Statkraft SF amounted to NOK 1,596,224 in 2000 and other remunerations amounted to NOK90,000. Remuneration to the Board of Directors totalled NOK 1,070,500, of which NOK 172,000 to the Chairman of the Board.ThePresident and C.E.O. will retire on 1.9.2001 and will then be entitled to a pension of 66.7 per cent of his annual salary.The year’s pensioncosts related to the President and C.E.O. amounts to NOK 1,316,234.Members of Group management have a pension age of 65 years with a right to 66 per cent of their salary, Bjørn Blaker and Finn Qualeirrespective of the pension rights earned at the time of retirement. In the case of retirement between the age of 60 and 65 years, mem-bers of Group management have agreements that imply a mutual decline in work assignments and remuneration for work carried out.Neither the President nor members of Group Management have severance arrangements in addition to what is mentioned above, norare there any bonus schemes, loans or guarantees given.The Board has no agreement other than remuneration and no loans have beengranted or guarantees issued in favour of board members.In 2000, the average number of employees in the Group was 1,400, while it was 892 in the parent company.
Note 6COMPENSATION AND LICENCE FEES
the Group Statkraft SF
2000 1999 1998 amounts in NOK million 2000 1999 1998
201 186 194 Licence fees 200 186 194
51 45 37 Compensation 50 45 31
252 231 231 Total 250 231 225
Licence fees are adjusted 5 years after the licence has been issued, and thereafter at intervals of 5 years, based on the Consumer PriceIndex. Annual and permanent fixed compensation payments for damage and inconvenience, which arise as a result of hydro powerdevelopment, are adjusted in accordance with the same rules that apply to licence fees.The present value of current and fixed licence feesand compensation obligations related to plants are estimated to be NOK 2.85 billion and NOK 0.35 billion, respectively, discounted at aninterest rate of 7 per cent in accordance with the regulations applicable to redemption.

45S T A T K R A F T A N N U A L R E P O R T 2 0 0 0
No
te
s
to
t
he
a
cc
ou
nt
s
Note 7OTHER OPERATING COSTS
the Group Statkraft SF
2000 1999 1998 amounts in NOK million 2000 1999 1998
29 309 252 Materials 29 30 50
309 245 252 External services 313 340 311
87 83 81 Costs, power plants leased out 87 83 81
72 64 50 Costs, power plants operated by others 72 64 50
17 - 17 Write-down of fixed assets 16 17 17
253 361 251 Other operating costs 288 196 186
767 1 064 904 Total 805 730 695
Other operating costs are reduced as a consequence of the sale of Statkraft Anlegg.
In 2000, Statkraft SF paid auditor’s fees of NOK 850,000 for external audit services, NOK 2,760,500 for internal audit services and NOK5,613,500 for consultancy services. Correspondingly, NOK 738,500 and NOK 972,000 were charged to the accounts of Norwegiansubsidiaries for external audit and consultancy services respectively.
In 2000 the Group spent NOK 40 million on research and development, which has been charged to the accounts in its entirety. Statkraftis engaged in research and development in the field of hydro power and other renewable energy such as wind power, hydrogen and saltgradients.
Note 8FINANCIAL REVENUES AND COSTS
Financial income:
the Group Statkraft SF
2000 1999 1998 amounts in NOK million 2000 1999 1998
- - - Interest income from group companies 637 180 161
206 185 154 Other interest revenues 229 153 136
220 25 2 Other financial revenues 27 21 -2
426 210 156 Total 893 354 295
Financial costs:
the Group Statkraft SF
2000 1999 1998 amounts in NOK million 2000 1999 1998
- - - Interest costs to group companies - - -22
-1 555 -1 112 -1 029 Other interest costs -1 515 -1 112 -1 028
-13 -23 -9 Other financial costs -8 -6 -6
-1 568 -1 135 -1 038 Total -1 523 -1 118 -1 056
Net financial items:
the Group Statkraft SF
2000 1999 1998 amounts in NOK million 2000 1999 1998
-1 142 -925 -882 Total -630 -764 -761
The increase in financial revenues for the Group is the result of the sale of shares in Sydkraft and higher dividends from associatedcompanies.

46 S T A T K R A F T A N N U A L R E P O R T 2 0 0 0 S T A T K R A F T
No
te
s
to
t
he
a
cc
ou
nt
s
Note 9TAXES
Taxes for 1998 have been restated in accordance with new principles for reasons of comparison. In 1998 carry forward natural resourcetax was included in deferred tax assets, which because of the upper-limit regulation was not recorded in the balance sheet. In theaccounts for 1999 and 2000 carry forward natural resource tax is included as a prepaid tax and this is also shown for 1998.
the Group Statkraft SF
2000 1999 1998 amounts in NOK million 2000 1999 1998
460 448 451 Natural resource tax 454 442 446
342 335 349 Property tax 338 331 344
-4 -5 -56 Refunded/reversed tax from previous years -4 -5 - 56
798 778 744 Income-independent taxes 788 768 734
387 190 263 Income tax 333 177 218
-339 -183 -223 Income tax offset 1) -333 -177 -218
-121 -265 -228 Prepaid tax 2) -121 -265 -228
175 116 126 Resource rent tax 175 116 126
3 - 14 Changes for previous years/restatements 3 18 14
105 -142 -48 Income-dependent taxes 57 -131 -88
903 636 696 Taxes payable 845 637 646
15 108 45 Change in deferred tax -49 117 69
918 744 741 Taxes 796 754 715
1) Income tax charged by the central authorities is offset against the natural resource tax.2) In the event that the natural resource tax cannot be fully co-ordinated with income tax, the excess amount of natural resource tax and interest can be
carried forward and offset against income tax in later years.
The following shows how one arrives at the tax base for calculating income tax on the basis of the accounts. Comparative figures fortemporary differences have been changed because of new estimates.
the Group Statkraft SF
2000 1999 1998 amounts in NOK million 2000 1999 1998
1 765 1 691 1 631 Pre-tax income 1 510 1 440 1 357
-819 -565 -294 Permanent differences -452 -332 -146
555 -435 -296 Changes in temporary differences 148 -467 -378
- - - Loss brought forward - - -
1 501 691 1 041 Tax basis for the year 1 206 641 833
28 % 28 % 28 % Tax rate 28% 28 % 28 %
420 194 292 Estimated income tax 337 180 233
-33 -4 - 29 Tax credit for deduction -4 -3 -15
-339 -183 -223 Natural resource tax offset -333 -177 -218
48 7 40 Income tax after offset - - -
52% 44% 45% Effective tax rate 1) 53% 52% 53%
1) Taxes/pre-tax income.

47S T A T K R A F T A N N U A L R E P O R T 2 0 0 0
No
te
s
to
t
he
a
cc
ou
nt
s
The following is a specification of the temporary differences and the taxable loss to be carried forward as well as the calculation ofdeferred tax/deferred tax assets on the balance sheet. Deferred tax assets are recorded in the balance sheet to the extent that it isprobable that they will be used.The deferred tax assets related to operating assets includes temporary differences in both incometaxation and resource rent taxation.The figures for 1998 have been restated to show recorded deferred tax assets disregarding the upper limit rule.With effect from 2000 deferred tax is calculated on results from foreign associated companies.The change in deferredtax 2000 as a result of this amounts to NOK 162 million.
the Group Statkraft SF
2000 1999 1998 amounts in NOK million 2000 1999 1998
-280 -327 -632 Current assets/current liabilities -396 -239 -596
-1 397 -2 051 -2 180 Fixed assets -1 821 -1 825 -1 939
-60 - - Loss brought forward - - -
Total temporary differences and
-1 737 -2 379 -2 812 loss brought forward -2 217 -2 064 -2 535
-486 -666 -787 Deferred tax/deferred tax assets -621 - 578 -710
-61 -395 -527 Temporary differences, resource rent taxation -60 - 395 -527
-198 - 126 -86 Resource rent tax brought forward -198 - 126 - 86
-211 -205 -191 Deferred tax assets resource rent taxation -210 - 205 -191
-697 -871 -979 Total deferred tax/deferred tax assets -831 -783 -901
28/20% 28/20% 28/20% Tax rate 28/20% 28/20% 28/20%
Note 10TREATMENT OF REVENUES AND COSTS IN POWER PLANTSOPERATED BY OTHERS
In companies where Statkraft SF has an ownership interest without operating responsibility, cf. note 12, the enterprise takes out for ownsale a part of that company’s electricity production that corresponds to the ownership share.This is part of ordinary power revenues, inline with the power produced by the power plants the company operates itself. Exception is made for contractual sales of licence powerarranged by the power company in question, where the revenue on sales is distributed among the owners.For such joint ventures, the power company’s operating costs and revenues related to the sale of licence power etc. are distributedamong the owners by means of current settlement accounts.The following is a review of Statkraft’s share of the income statement itemsin these power plant companies. Calculated revenues are Statkraft’s actual take-out of power multiplied by the average hourly-weighted spot price, and Statkraft’s share of licence power revenue.
Statkraft SF
amounts in NOK million 2000 1999 1998
Calculated revenues 544 440 373
Other operating revenues 10 9 13
Transmission costs -52 -39 -33
Net operating revenues 502 410 353
Compensation and licence fees 23 22 19
Other operating costs 82 61 59
Ordinary depreciation 80 60 60
Operating costs 185 143 138
Net financial items 2 2 8
Calculated income before taxes 315 265 207

No
te
s
to
t
he
a
cc
ou
nt
s
Note 11INTANGIBLE ASSETS
the Group Statkraft SF
2000 1999 1998 amounts in NOK million 2000 1999 1998
1 409 1 249 1 248 Licences, fall rights etc. 1 404 1 243 1 242
697 871 979 Deferred tax assets 831 783 901
3 3 3 Goodwill - - -
2 109 2 123 2 230 Total 2 235 2 026 2 143
Statkraft SF
amounts in NOK million rights goodwill total
Acquisition cost 01.01.00 1 243 - 1 243
Additions 2000 180 - 180
Disposals 2000 - - -
Accumulated depreciation 31.12.00 19 - 19
Book value 31.12.00 1 404 - 1 404
Current year’s ordinary depreciation 19 - 19
The Group
amounts in NOK million rights goodwill total
Acquisition cost 01.01.00 1 248 13 1 261
Additions 2000 180 1 181
Disposals 2000 - - -
Accumulated depreciation 31.12.00 19 11 30
Book value 31.12.00 1 409 3 1 412
Current year’s ordinary depreciation 19 1 20
Estimated useful economic life 7 years to perpetuity 5 years -
Depreciation of rights is linked to the acquisition of shares in Tyssefaldene.Through this acquisition Statkraft SF obtained a right to takeout part of the production of 3 power plants at cost.These power plants revert to Statkraft SF in 2007 and 2010.The book value ofthese rights was NOK 132 million at 31.12.2000.
Deferred tax assets are referred to in detail in note 9.
48 S T A T K R A F T A N N U A L R E P O R T 2 0 0 0 S T A T K R A F T

Note 12PROPERTY, PLANT AND EQUIPMENT
shares in buildings,
power roads, plant
turbines, plants bridges under
regulating genera- operated and construc-
amount in NOK million plants tors etc. by others kaianlegg tion other total
Statkraft SF
Acquisition cost 01.01.00 15 742 6 378 2 704 4 648 214 869 30 555
Additions 2000 135 88 13 29 87 81 433
Disposals 2000 1 17 - 11 153 - 182
Write-down 2000 - - - - 29 - 29
Acc. depreciation 31.12.00 2 526 2 372 547 830 - 527 6 802
Book value 31.12.00 13 350 4 077 2 170 3 836 119 423 23 975
Current year’s ordinary depreciation 307 240 61 93 - 81 782
The Group
Acquisition cost 01.01.00 16 174 7 558 2 704 4 881 217 906 32 440
Additions 2000 135 312 13 29 87 90 666
Disposals 2000 1 17 - 11 154 1 184
Write-down 2000 - - - - 29 - 29
Acc. depreciation 31.12.00 2 745 2 507 547 942 - 556 7 297
Book value 31.12.00 13 563 5 346 2 170 3 957 121 439 25 596
Current year’s ordinary depreciation 315 266 61 97 - 90 829
Estimated useful economic life 30-60 years 15-30 years 5-50 years 50-60 years - 3-40 years -
Power plants etc. where ownership is shared between Statkraft and others, or where county local authorities etc. have a right to take outand administer part of the power produced in return for financing part of the costs involved, are recorded after deducting the value ofothers’ take-out rights, calculated as their relative share of the take-out.County local authorities and publicly owned power companies have the following rights to take out power from power plants owned byStatkraft:
power plant others’ shares
Kobbelv 17.50 %
Grytten 12.00 %
Svorka 50.00 %
Leirdøla 35.00 %
Vikfalli 12.00 %
Ulla-Førre 28.00 %
Folgefonn 14.94 %
Eidfjord 35.00 %
Statkraft has the following ownership interests in power plants operated by others:
amounts in NOK million ownership share of fixed assets
Aurlandsverkene 7.00 % 401
Kraftverkene i Øvre Namsen 50.00 % 267
Mørkfoss-Solbergfoss 33.33 % 84
Røldal-Suldal Kraft AS 8.74 % -
I/S Sira-Kvina kraftselskap 32.10 % 1 418
Tyssefaldene 20.29 % 132
Total 2 302
No
te
s
to
t
he
a
cc
ou
nt
s
49S T A T K R A F T A N N U A L R E P O R T 2 0 0 0
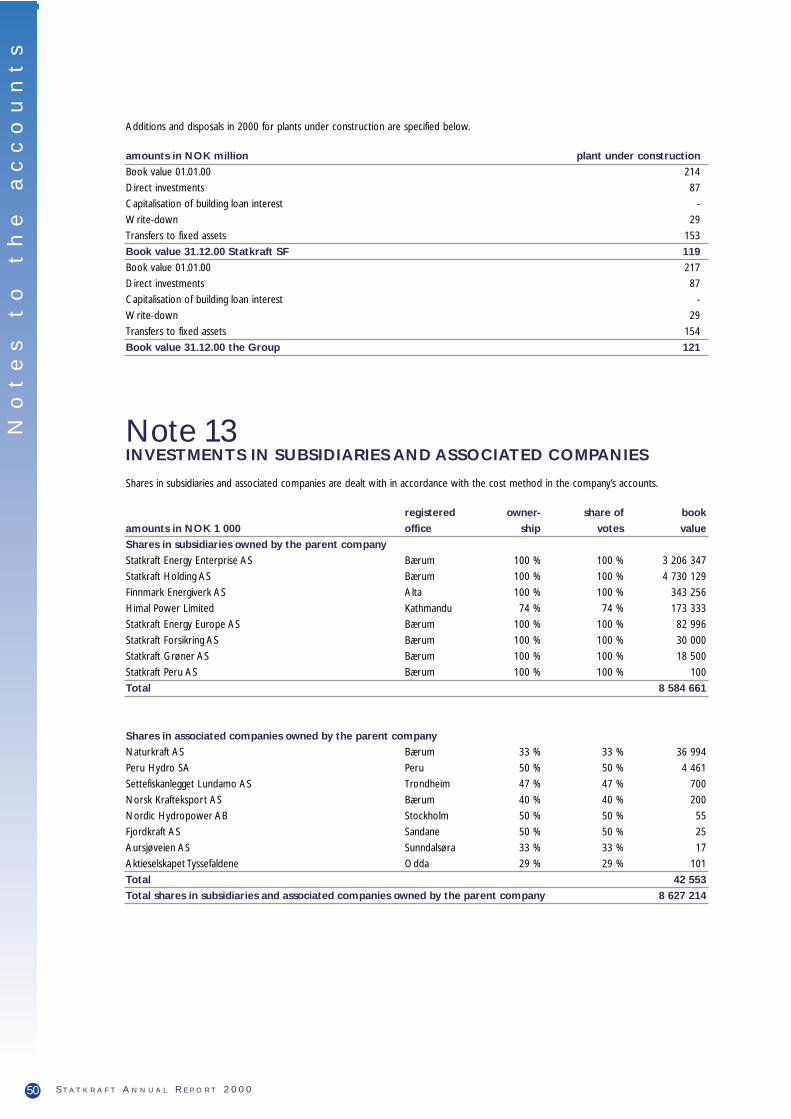
No
te
s
to
t
he
a
cc
ou
nt
s
Additions and disposals in 2000 for plants under construction are specified below.
amounts in NOK million plant under construction
Book value 01.01.00 214
Direct investments 87
Capitalisation of building loan interest -
Write-down 29
Transfers to fixed assets 153
Book value 31.12.00 Statkraft SF 119
Book value 01.01.00 217
Direct investments 87
Capitalisation of building loan interest -
Write-down 29
Transfers to fixed assets 154
Book value 31.12.00 the Group 121
Note 13INVESTMENTS IN SUBSIDIARIES AND ASSOCIATED COMPANIES
Shares in subsidiaries and associated companies are dealt with in accordance with the cost method in the company’s accounts.
registered owner- share of book
amounts in NOK 1 000 office ship votes value
Shares in subsidiaries owned by the parent company
Statkraft Energy Enterprise AS Bærum 100 % 100 % 3 206 347
Statkraft Holding AS Bærum 100 % 100 % 4 730 129
Finnmark Energiverk AS Alta 100 % 100 % 343 256
Himal Power Limited Kathmandu 74 % 74 % 173 333
Statkraft Energy Europe AS Bærum 100 % 100 % 82 996
Statkraft Forsikring AS Bærum 100 % 100 % 30 000
Statkraft Grøner AS Bærum 100 % 100 % 18 500
Statkraft Peru AS Bærum 100 % 100 % 100
Total 8 584 661
Shares in associated companies owned by the parent company
Naturkraft AS Bærum 33 % 33 % 36 994
Peru Hydro SA Peru 50 % 50 % 4 461
Settefiskanlegget Lundamo AS Trondheim 47 % 47 % 700
Norsk Krafteksport AS Bærum 40 % 40 % 200
Nordic Hydropower AB Stockholm 50 % 50 % 55
Fjordkraft AS Sandane 50 % 50 % 25
Aursjøveien AS Sunndalsøra 33 % 33 % 17
Aktieselskapet Tyssefaldene Odda 29 % 29 % 101
Total 42 553
Total shares in subsidiaries and associated companies owned by the parent company 8 627 214
50 S T A T K R A F T A N N U A L R E P O R T 2 0 0 0 S T A T K R A F T
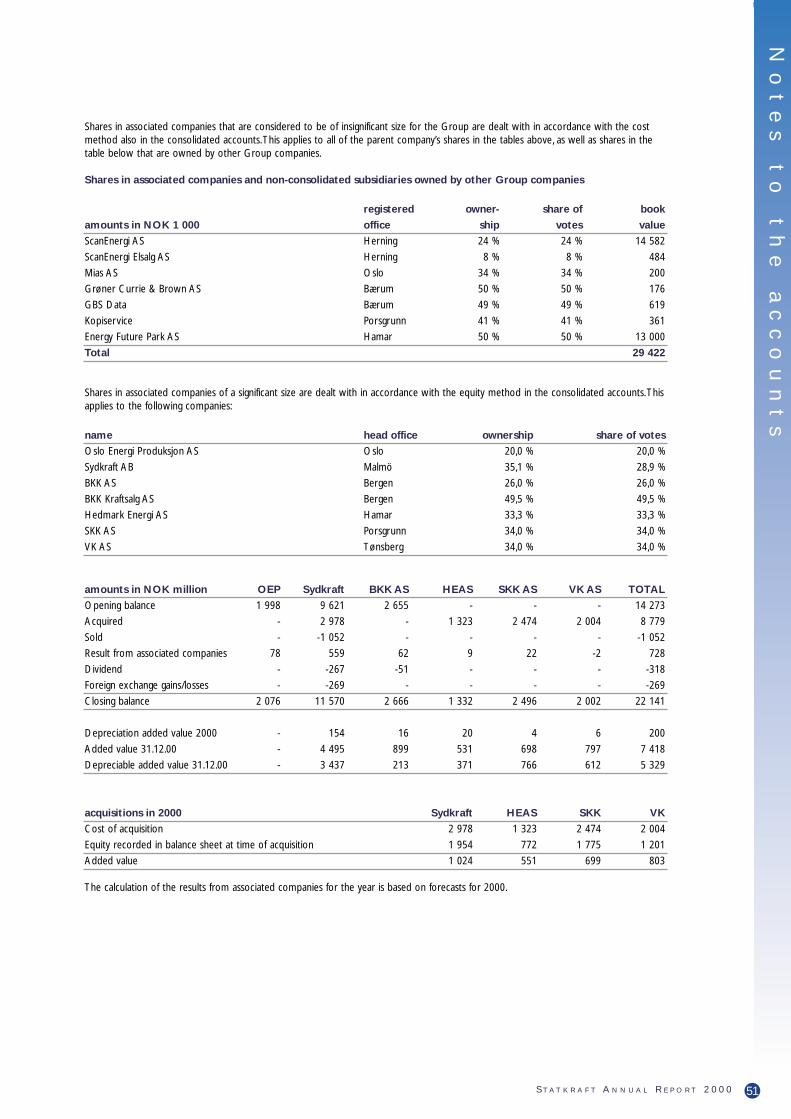
Shares in associated companies that are considered to be of insignificant size for the Group are dealt with in accordance with the costmethod also in the consolidated accounts.This applies to all of the parent company’s shares in the tables above, as well as shares in thetable below that are owned by other Group companies.
Shares in associated companies and non-consolidated subsidiaries owned by other Group companies
registered owner- share of book
amounts in NOK 1 000 office ship votes value
ScanEnergi AS Herning 24 % 24 % 14 582
ScanEnergi Elsalg AS Herning 8 % 8 % 484
Mias AS Oslo 34 % 34 % 200
Grøner Currie & Brown AS Bærum 50 % 50 % 176
GBS Data Bærum 49 % 49 % 619
Kopiservice Porsgrunn 41 % 41 % 361
Energy Future Park AS Hamar 50 % 50 % 13 000
Total 29 422
Shares in associated companies of a significant size are dealt with in accordance with the equity method in the consolidated accounts.Thisapplies to the following companies:
name head office ownership share of votes
Oslo Energi Produksjon AS Oslo 20,0 % 20,0 %
Sydkraft AB Malmö 35,1 % 28,9 %
BKK AS Bergen 26,0 % 26,0 %
BKK Kraftsalg AS Bergen 49,5 % 49,5 %
Hedmark Energi AS Hamar 33,3 % 33,3 %
SKK AS Porsgrunn 34,0 % 34,0 %
VK AS Tønsberg 34,0 % 34,0 %
amounts in NOK million OEP Sydkraft BKK AS HEAS SKK AS VK AS TOTAL
Opening balance 1 998 9 621 2 655 - - - 14 273
Acquired - 2 978 - 1 323 2 474 2 004 8 779
Sold - -1 052 - - - - -1 052
Result from associated companies 78 559 62 9 22 -2 728
Dividend - -267 -51 - - - -318
Foreign exchange gains/losses - -269 - - - - -269
Closing balance 2 076 11 570 2 666 1 332 2 496 2 002 22 141
Depreciation added value 2000 - 154 16 20 4 6 200
Added value 31.12.00 - 4 495 899 531 698 797 7 418
Depreciable added value 31.12.00 - 3 437 213 371 766 612 5 329
acquisitions in 2000 Sydkraft HEAS SKK VK
Cost of acquisition 2 978 1 323 2 474 2 004
Equity recorded in balance sheet at time of acquisition 1 954 772 1 775 1 201
Added value 1 024 551 699 803
The calculation of the results from associated companies for the year is based on forecasts for 2000.
No
te
s
to
t
he
a
cc
ou
nt
s
51S T A T K R A F T A N N U A L R E P O R T 2 0 0 0

No
te
s
to
t
he
a
cc
ou
nt
s
Note 14OTHER FINANCIAL FIXED ASSETS
the Group Statkraft SF
2000 1999 1998 amounts in NOK million 2000 1999 1998
732 779 803 Loans to associated companies 729 779 803
- - - Loans to group companies 15 127 6 534 2 594
1 220 940 581 Bonds and other long-term receivables 1 186 877 543
7 8 7 Other shares and interests 7 7 7
1 959 1 717 1 391 Total 17 049 8 197 3 947
Specification of the other shares and interests
amounts in NOK 1 000 ownership book value
Other shares and interests owned by the parent company
Røldal-Suldal Kraft AS 1) 9% 958
Settefisk AL 19 % 566
EXPO 2000 11 % 250
Sauda Industriutvikling AS 9 % 40
Labroskolen AS 12 % 53
Vefsenlaksen AS 10 % 10
Capital contribution Statkraft Pension Fund 5 000
Interest in housing co-operative 160
Total 7 037
Other shares owned by Finnmark Energiverk AS
NEFO AS 1 % 420
Kvænangen Kraftverk AS 5 % 25
Total 445
Grand total for the Group 7 482
1) Statkraft owns 8.74 per cent of the shares in Røldal-Suldal Kraft AS, which in turn owns 54.79 per cent of the power plant IS Røldal-Suldal Kraft.Thus,Statkraft’s indirect stake in that partnership is 4.79 per cent.
Note 15RECEIVABLES
The Group Statkraft SF
2000 1999 1998 amounts in NOK million 2000 1999 1998
578 457 206 Accounts receivable 501 340 100
345 226 273 Accrued revenues etc 283 185 277
29 77 273 Prepaid costs 26 65 42
88 548 574 Other receivables 273 135 559
- - - Current receivables from group companies 16 389 217
1 040 1 308 1 326 Total 1 099 1 114 1 195
Accounts receivable are recorded after provision of NOK 18 million for bad debts in 2000 compared to NOK 10 million at 31.12.99 and31.12.98.
52 S T A T K R A F T A N N U A L R E P O R T 2 0 0 0 S T A T K R A F T

Note 16INVESTMENTS
the Group Statkraft SF
2000 1999 1998 amounts in NOK million 2000 1999 1998
38 24 2 Shares - financial placements - - -
112 122 1 518 Bonds - 6 1 405
150 146 1 520 Total - 6 1 405
Bonds by debtor category
the Group Statkraft SF
2000 1999 1998 amounts in NOK million 2000 1999 1998
26 41 23 Commercial/savings banks - 6 -
9 5 70 Mortgage companies - - 65
5 10 10 Industry - - -
72 66 75 Public sector - - -
112 122 178 Total - 6 65
All bonds are in NOK.
Note 17BANK DEPOSITS, CASH AND CASH EQUIVALENTS
The Group Statkraft SF
2000 1999 1998 amounts in NOK million 2000 1999 1998
650 - - Certificates and promissory notes 300 - -
1 864 1 299 1 796 Cash and bank deposits 762 1 012 1 623
2 514 1 299 1 796 Total 1 062 1 012 1 623
Restricted bank accounts for withholding taxes at source totalled NOK 26.4 million for the Group and NOK 18.8 million for Statkraft SF.In addition, NOK 392.7 million is security for organised energy trading. Statkraft SF has a long-term committed credit line of USD 300million (NOK 2,655 million) that is undrawn and an overdraft facility of NOK 100 million.This was not drawn on at 31.12.00.
Note 18EQUITY
amounts in NOK million the Group Statkraft SF
Equity as at 31.12.99 21 503 20 695
Net income for the year 847 714
Dividend -631 -631
Minority differences -3 -
Conversion differences 26 -
Equity as at 31.12.00 21 742 20 778
No
te
s
to
t
he
a
cc
ou
nt
s
53S T A T K R A F T A N N U A L R E P O R T 2 0 0 0
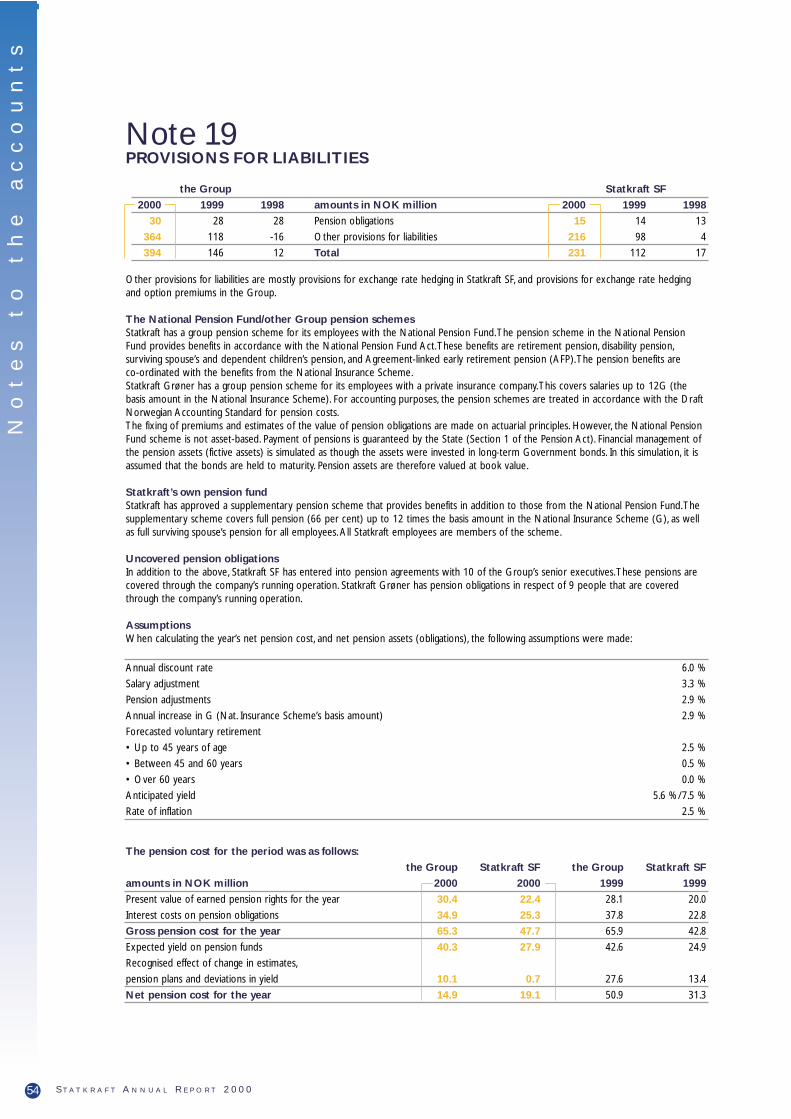
No
te
s
to
t
he
a
cc
ou
nt
s
Note 19PROVISIONS FOR LIABILITIES
the Group Statkraft SF
2000 1999 1998 amounts in NOK million 2000 1999 1998
30 28 28 Pension obligations 15 14 13
364 118 -16 Other provisions for liabilities 216 98 4
394 146 12 Total 231 112 17
Other provisions for liabilities are mostly provisions for exchange rate hedging in Statkraft SF, and provisions for exchange rate hedgingand option premiums in the Group.
The National Pension Fund/other Group pension schemesStatkraft has a group pension scheme for its employees with the National Pension Fund.The pension scheme in the National PensionFund provides benefits in accordance with the National Pension Fund Act.These benefits are retirement pension, disability pension,surviving spouse’s and dependent children’s pension, and Agreement-linked early retirement pension (AFP).The pension benefits are co-ordinated with the benefits from the National Insurance Scheme.Statkraft Grøner has a group pension scheme for its employees with a private insurance company.This covers salaries up to 12G (thebasis amount in the National Insurance Scheme). For accounting purposes, the pension schemes are treated in accordance with the DraftNorwegian Accounting Standard for pension costs.The fixing of premiums and estimates of the value of pension obligations are made on actuarial principles. However, the National PensionFund scheme is not asset-based. Payment of pensions is guaranteed by the State (Section 1 of the Pension Act). Financial management ofthe pension assets (fictive assets) is simulated as though the assets were invested in long-term Government bonds. In this simulation, it isassumed that the bonds are held to maturity. Pension assets are therefore valued at book value.
Statkraft’s own pension fund Statkraft has approved a supplementary pension scheme that provides benefits in addition to those from the National Pension Fund.Thesupplementary scheme covers full pension (66 per cent) up to 12 times the basis amount in the National Insurance Scheme (G), as wellas full surviving spouse’s pension for all employees. All Statkraft employees are members of the scheme.
Uncovered pension obligations In addition to the above, Statkraft SF has entered into pension agreements with 10 of the Group’s senior executives.These pensions arecovered through the company’s running operation. Statkraft Grøner has pension obligations in respect of 9 people that are coveredthrough the company’s running operation.
Assumptions When calculating the year’s net pension cost, and net pension assets (obligations), the following assumptions were made:
Annual discount rate 6.0 %
Salary adjustment 3.3 %
Pension adjustments 2.9 %
Annual increase in G (Nat. Insurance Scheme’s basis amount) 2.9 %
Forecasted voluntary retirement
• Up to 45 years of age 2.5 %
• Between 45 and 60 years 0.5 %
• Over 60 years 0.0 %
Anticipated yield 5.6 % /7.5 %
Rate of inflation 2.5 %
The pension cost for the period was as follows:
the Group Statkraft SF the Group Statkraft SF
amounts in NOK million 2000 2000 1999 1999
Present value of earned pension rights for the year 30.4 22.4 28.1 20.0
Interest costs on pension obligations 34.9 25.3 37.8 22.8
Gross pension cost for the year 65.3 47.7 65.9 42.8
Expected yield on pension funds 40.3 27.9 42.6 24.9
Recognised effect of change in estimates,
pension plans and deviations in yield 10.1 0.7 27.6 13.4
Net pension cost for the year 14.9 19.1 50.9 31.3
54 S T A T K R A F T A N N U A L R E P O R T 2 0 0 0 S T A T K R A F T

Reconciliation of pension obligations and pension fund assets
the Group Statkraft SF the Group Statkraft SF
amounts in NOK million 31.12.00 31.12.00 31.12.99 31.12.99
Gross pension obligations 610.6 443.8 645.3 398.2
Pension fund assets 645.6 461.0 655.0 398.7
Net pension fund assets (obligations) 35.0 17.2 9.7 0.5
Obligations over operations – uncovered schemes 27.7 13.2 26.6 12.7
Pension assets – covered schemes 62.7 30.4 36.3 13.2
Nat. insurance contribution – uncovered schemes 1.8 1.8 1.8 1.7
Note 20OTHER LONG-TERM DEBT
the Group Statkraft SF
2000 1999 1998 amounts in NOK million 2000 1999 1998
23 706 15 706 12 251 Bond loan 23 706 15 706 12 251
1 618 1 107 1 306 Liabilities to credit institutions 1 972 476 818
5 233 4 868 4 540 Other long-term liabilities 4 804 4 836 4 713
30 557 21 681 18 097 Total 30 482 21 018 17 782
Detailed specification of the above table:
amounts in NOK million 2000 1999 1998
Government loan 2 550 2 975 3 400
Other long-term loans in NOK 12 545 8 036 5 893
Loans in SEK 10 176 6 419 4 266
Loans in EURO 2 921 1 686 2 095
Share of loan in Sira-Kvina Kraftselskap 36 41 49
Prepayments/accrued power sales 1 741 1 847 1 804
Loans from subsidiaries 513 14 275
Total Statkraft SF 30 482 21 018 17 782
The foreign exchange distribution in the above table takes into account the underlying currency and interest rate swaps with the exceptionof NOK 340 million in Government loans that has an underlying currency and interest rate swap contract from NOK to SEK.The increase in other long-term liabilities is mainly due to the financing of further shares in Sydkraft, and the acquisition of shares inHedmark Energi AS,Vestfold Energi AS and Skiensfjordens kommunale kraftselskap AS. Other long-term liabilities in Norwegian kronercomprise 15 Norwegian bond issues amounting to NOK 7,858 million net, and loans in foreign currency for the countervalue of NOK4,687 million net, where Statkraft has an exposure in NOK as a result of currency and interest rate swaps.The loan denominated inEURO was taken up to hedge future contractual revenues in EURO and is therefore booked at a rate that is equivalent to the rate at thetime the loan was disbursed.The weighted average EUR/NOK exchange rate is 8.2656.The loans denominated in SEK were raised inconnection with Statkraft’s investment in Sydkraft AB and are recorded at the exchange rate on the date the loans were disbursed.Theweighted average SEK/NOK rate is 96.79. In the consolidated accounts the SEK loans and the ownership interest in Sydkraft are valued atthe rate on the balance sheet date.The average current interest rate on Statkraft SF’s loans in NOK was 6.60 per cent at the end of theyear.The corresponding figures for SEK and EURO were 4.91 per cent and 4.77 per cent respectively.
No
te
s
to
t
he
a
cc
ou
nt
s
55S T A T K R A F T A N N U A L R E P O R T 2 0 0 0
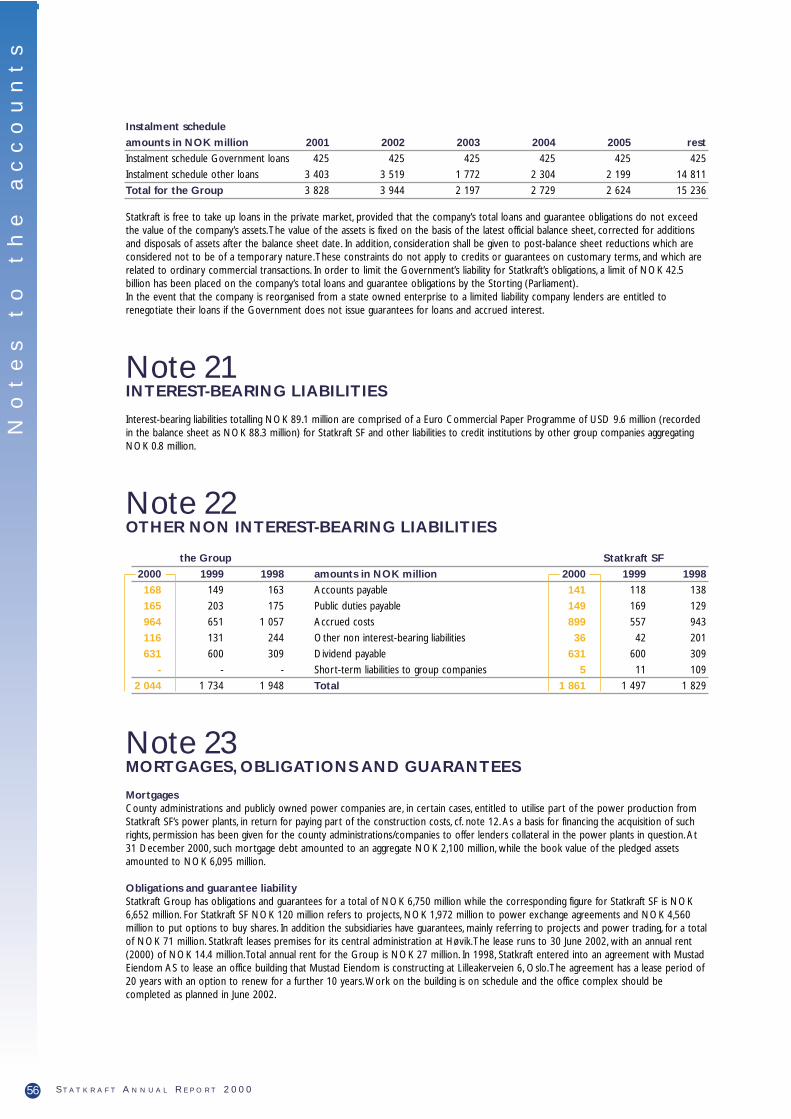
No
te
s
to
t
he
a
cc
ou
nt
s
Instalment schedule
amounts in NOK million 2001 2002 2003 2004 2005 rest
Instalment schedule Government loans 425 425 425 425 425 425
Instalment schedule other loans 3 403 3 519 1 772 2 304 2 199 14 811
Total for the Group 3 828 3 944 2 197 2 729 2 624 15 236
Statkraft is free to take up loans in the private market, provided that the company’s total loans and guarantee obligations do not exceedthe value of the company’s assets.The value of the assets is fixed on the basis of the latest official balance sheet, corrected for additionsand disposals of assets after the balance sheet date. In addition, consideration shall be given to post-balance sheet reductions which areconsidered not to be of a temporary nature.These constraints do not apply to credits or guarantees on customary terms, and which arerelated to ordinary commercial transactions. In order to limit the Government’s liability for Statkraft’s obligations, a limit of NOK 42.5billion has been placed on the company’s total loans and guarantee obligations by the Storting (Parliament).In the event that the company is reorganised from a state owned enterprise to a limited liability company lenders are entitled torenegotiate their loans if the Government does not issue guarantees for loans and accrued interest.
Note 21INTEREST-BEARING LIABILITIES
Interest-bearing liabilities totalling NOK 89.1 million are comprised of a Euro Commercial Paper Programme of USD 9.6 million (recordedin the balance sheet as NOK 88.3 million) for Statkraft SF and other liabilities to credit institutions by other group companies aggregatingNOK 0.8 million.
Note 22OTHER NON INTEREST-BEARING LIABILITIES
the Group Statkraft SF
2000 1999 1998 amounts in NOK million 2000 1999 1998
168 149 163 Accounts payable 141 118 138
165 203 175 Public duties payable 149 169 129
964 651 1 057 Accrued costs 899 557 943
116 131 244 Other non interest-bearing liabilities 36 42 201
631 600 309 Dividend payable 631 600 309
- - - Short-term liabilities to group companies 5 11 109
2 044 1 734 1 948 Total 1 861 1 497 1 829
Note 23MORTGAGES, OBLIGATIONS AND GUARANTEES
Mortgages County administrations and publicly owned power companies are, in certain cases, entitled to utilise part of the power production fromStatkraft SF’s power plants, in return for paying part of the construction costs, cf. note 12. As a basis for financing the acquisition of suchrights, permission has been given for the county administrations/companies to offer lenders collateral in the power plants in question. At31 December 2000, such mortgage debt amounted to an aggregate NOK 2,100 million, while the book value of the pledged assetsamounted to NOK 6,095 million.
Obligations and guarantee liabilityStatkraft Group has obligations and guarantees for a total of NOK 6,750 million while the corresponding figure for Statkraft SF is NOK6,652 million. For Statkraft SF NOK 120 million refers to projects, NOK 1,972 million to power exchange agreements and NOK 4,560million to put options to buy shares. In addition the subsidiaries have guarantees, mainly referring to projects and power trading, for a totalof NOK 71 million. Statkraft leases premises for its central administration at Høvik.The lease runs to 30 June 2002, with an annual rent(2000) of NOK 14.4 million.Total annual rent for the Group is NOK 27 million. In 1998, Statkraft entered into an agreement with MustadEiendom AS to lease an office building that Mustad Eiendom is constructing at Lilleakerveien 6, Oslo.The agreement has a lease period of20 years with an option to renew for a further 10 years.Work on the building is on schedule and the office complex should becompleted as planned in June 2002.
56 S T A T K R A F T A N N U A L R E P O R T 2 0 0 0 S T A T K R A F T

Note 24OFF-BALANCE SHEET ITEMS
Forward contracts, foreign exchange
currency bought sold market value
amount in million in NOK
SEK - 251 0.5
EUR - 196 59.7
DKK - 13 -0.4
USD 10 - -3.4
Total 56.4
The forward contracts mature between 2001 and 2002.These transactions are linked to agreed sales revenues in the respective currencies,or loans taken up to hedge such revenue.The forward contracts are therefore classified as hedging transactions, and according to theprinciples for recording such hedging transactions, are not recorded at market value in the accounts.This is countered by the salesrevenues that are hedged being recorded at the agreed forward exchange rate for hedging transactions. Forward contracts are recordedgross. At 31 December 2000, the market value of the contracts was NOK 56 million. Realised, unrecorded gains on hedging contracts inforeign currencies totalled NOK 137 million at 31 December 2000.
Foreign exchange optionsAt year-end Statkraft had entered into options to sell a total of EUR 4 million as part of the foreign exchange hedging strategy.Themarket value of the contracts at 31 December 2000 was NOK 0.5 million.
Interest swaps
currency principal amount in currency market value in NOK
amounts in million
NOK 15 247 -13
SEK 8 850 -68
EUR 640 49
Total -32
Interest swaps are used to adjust the interest sensitivity of the company’s loans to what the company regards as adequate hedging. Inaddition, interest swaps are used to extend existing forward contracts. As per 31 December 2000 the market value of the agreementswas NOK -32 million.
Interest and foreign exchange swaps
currency principal amount in currency market value in NOK
amounts in million
From currency to NOK 4 966 108
From currency to SEK 10 400 1 001
From currency to EUR 151 -6
From currency to DKK 237 13
From currency to USD 197 -248
Total 868
Interest and foreign exchange swaps are used to achieve favourable financing in the desired currency when a combination of financing inanother currency and a customised interest and foreign exchange swap gives lower interest costs than financing in the desired currency.Statkraft has underlying financing in CHF, FRF, DKK and JPY.The market value of the agreements as per 31 December 2000 was NOK 868million.
Options on loans and interest swapsAt year-end, Statkraft had entered into options to extend a loan for a total underlying amount of NOK 1,736 million. In addition optionshave been sold for interest swaps that match interest and term for the possible extension of the underlying loans.The total market valueof the agreements as at 31 December 2000 offset each other.
Interest optionsInterest options are entered into to adjust the interest rate sensitivity on the company’s floating rate loans to what the company at anytime considers adequate hedging. At year-end Statkraft had entered into interest options in SEK for a total underlying amount of SEK 200million.The market value of the agreement as per 31 December 2000, including the option premium, was NOK 0.7 million.
No
te
s
to
t
he
a
cc
ou
nt
s
57S T A T K R A F T A N N U A L R E P O R T 2 0 0 0

No
te
s
to
t
he
a
cc
ou
nt
s
Interest rate exposure for Statkraft SFRe-pricing table (NOK million)
Re-pricing period
duration 0-3 mths 3-6 mths 6-12 mths 1-3 years >3 years
Bank deposits 762 - - - -
Funding, investments and derivatives -2 210 -6 657 -2 549 -9 183 -8 096
(positive figures = investments, negative figures = funding)
The table shows which parts of Statkraft’s investments and funding portfolios are exposed to interest rate adjustments in the variousduration intervals.
Exposure by currency as at 31.12.00
currency NOK SEK EUR
Modified duration 1) 2.01 2.13 2.82
1) Statkraft uses modified duration to measure interest rate sensitivity in the funding portfolio.The figures show the percentage change in market value ifmarket rates change by one percentage point.
Note 25MARKET AND FINANCIAL RISK
In its business, Statkraft is exposed to various types of risk.The most important naturally enough relates to production of and trading inenergy, but the company is also exposed to other financial and operational risks.
Market riskStatkraft’s main activities are the production of and trading in electric power. In a market with a great deal of hydro power, where accessto water varies a great deal from year to year, price and production capacity will also vary considerably.This may have a marked impacton Statkraft’s results. Since production and price are often negatively correlated, i.e. a great deal of water and high production bringsabout lower prices, and vice versa, this means that the outcome of the revenue is naturally dampened. In addition, Statkraft is active in riskmanagement to adjust to the actual market situation.This way, Statkraft endeavours in the long term to achieve maximum earnings fromproduction, taking into account the company’s risk criteria.
Risk management To a considerable extent, Statkraft makes use of forward contracts and other financial instruments in its hedging ofrevenue. Contract trading helps stabilise Statkraft’s revenues from year to year.This is desirable because of the great uncertainty surround-ing the total revenue from power sales.This depends on a volatile spot price and uncertain production capacity. In this connection there isno difference between physical and financial contracts that are traded bilaterally and via brokers or financial markets in the forwardmarket (Nord Pool). Price is the prime criterion when selecting the trading form. Hence, the most important factor is that contracts aregood seen in relation to existing power contracts and the scope of the outcome on both own production and spot prices.The companyis constantly adjusting the contract portfolio so that expected earnings are maximised without the downside risk increasing.
Use of derivatives for hedging purposes Statkraft deals in various instruments, physical and financial, in order to hedge revenues.Thishedging, which also takes into consideration the company’s present and future production capacity, is intended to ensure an optimal con-tract position in relation to risk criteria. Statkraft is exposed to both price and volume risk because future prices and water inflow areunknown. At the end of 2000, the company had hedged more than 58 per cent of mean production through to and including the year2011.The total market risk can be quantified as the scope of net power revenue, after transmission, in relation to expectations.With aprobability of 80 per cent, it is estimated that net power revenue will be within +/- NOK 700 million in 2001 and +/- NOK 1,100 millionin 2002 and +/- NOK 900 million in 2003.Taxation of power plants will dampen the impact on the company’s net income after taxes.
Use of derivatives for trading purposes In addition to hedging activities, Statkraft also uses financial derivatives to take limited short-term positions in the market. Here,Value at Risk is an important risk management tool.The volume traded is significant, but the financialexposure at any one time is extremely limited compared to hedging activities. Internal guidelines have been established for marketexposure, both for hedging and trading purposes.
Foreign exchange riskStatkraft’s goal for its foreign exchange risk management is to limit fluctuations in the present value of foreign exchange revenues andassets in foreign currencies, and to maximise the present value of these within given limits. To achieve the desired risk level the companyuses loans in the currencies in question, interest and currency swaps to the desired currency and forward foreign exchange contracts.Statkraft’s long-term investments in assets denominated in foreign currencies refer primarily to the ownership stake in Sydkraft. 70-100per cent is to be hedged. At year-end Statkraft had hedged about 100 per cent of the company’s foreign currency assets. A change in thevalue of Statkraft’s assets in foreign currency because of fluctuations in an exchange rate would therefore be offset by a correspondingchange in the value of Statkraft’s liabilities in the same currency. 40-70 per cent of the present value of the foreign exchange revenue thatStatkraft expects to receive in 3 or more years hence, is to be hedged. At year-end slightly more than 50 per cent was hedged. In the caseof revenues that will be realised earlier, the degree of hedging is set higher. For foreign exchange revenue in the next three years that isnot hedged, the change in value would be NOK 1.3 and 5 million respectively should exchange rates change 5 per cent.
58 S T A T K R A F T A N N U A L R E P O R T 2 0 0 0 S T A T K R A F T

Interest rate riskStatkraft’s goal for interest rate management is to minimise interest costs, reduce fluctuations in these, and limit changes in the value ofthe company’s net liabilities. Modified duration is used to measure interest rate sensitivity.This indicates changes in market values as aresult of a one percentage point change in market interest rates. Based on Statkraft’s foreign exchange exposure the funding portfolio isdivided into three currencies: NOK (about 50 per cent), SEK (about 40 per cent) and EURO (about 10 per cent).The portfolio shall havea modified duration between 1 and 3, both on the whole and for each currency. Statkraft uses mainly interest rate swaps to achieve therisk goal. At the end of 2000 the modified duration in NOK and SEK portfolios was approximately 2.This implies that the market valueof these portfolios would be changed about 2 per cent in the event of a one percentage point change in the market interest for thesecurrencies.The modified duration of the EURO portfolio was approximately 2.8. Reference is also made to the re-pricing table in note 24.
Liquidity riskStatkraft assumes a liquidity risk because the term of the financial obligations are not matched to the cash flow generated by the assets.The company’s credit worthiness is very high, which is confirmed by the long-term credit ratings, Aaa and AA+ from the rating agenciesMoody’s Investor Service and Standard & Poor’s respectively.These good ratings are rooted to a great extent in the provision in the Actrelating to State-owned Enterprises, which stipulates that winding up proceedings cannot be filed against state enterprises. In the eventthat the company is bankrupt, the state is responsible for the creditors receiving full cover. Based on the state enterprise corporate form,the good ratings and standardised loan programmes, the company will normally be able to finance, at fairly short notice, the paymentobligations that might arise. As an extra security against possible unrest on the financial markets, Statkraft has established a long-termcommitted credit line for the countervalue of USD 300 million.The company’s policy is to limit short-term borrowing to the sum of cashand cash equivalents and committed credit lines.
Credit riskStatkraft enters into financial contracts on Nord Pool and bilaterally with individual companies.The latter results in Statkraft assuming acounterpart risk for the contract’s counterpart.The reasons for entering into such bilateral contracts are that some types of contract arenot traded on Nord Pool (applies to some options contracts with lengthy terms), for financial reasons (i.e. better contractual terms andconditions) and for strategic considerations pertaining to our market positions.To deal with this risk Statkraft’s Market Division hasestablished its own Counterpart Committee which sets ceilings for exposure to individual companies. A special procedure has beenintroduced that regulates the process around bilateral transactions and this procedure regulates the term and scope of the contracts thatcan be entered into with different companies. During the last few years Nord Pool has been the counterpart for the vast majority of thecontract volume. Statkraft also assumes a credit risk primarily by placing excess liquidity with issuers of securities and from the use ofhedging instruments such as interest rate swaps, currency and interest rate swaps, and forward contracts.The limits for each debtor areset on the basis of assumed creditworthiness and possible formal credit ratings. Quantification of the risk in placements is based on theprincipal amount of Statkraft’s receivables, but in the case of financial instruments a loss potential is calculated in the event the counter-part should fail to fulfil his obligations. At year-end Statkraft’s exposure related to placements and financial instruments was slightly morethan NOK 4 billion.The exposure was for the most part divided between foreign financial institutions with A ratings or better and themajor Norwegian banks.
Insurance riskStatkraft has a considerable risk exposure in its operations related to damage/loss of assets (primarily power plants), production lossesand damage to third-party lives and property, e.g. from fire, floods or inundation following damage to or fractures in dams. Statkraft hasdirectly, and through its captive insurance company Statkraft Forsikring AS, bought coverage in the insurance market under a comprehen-sive insurance programme.The maximum loss arising from individual damage to assets is NOK 8 million and the maximum loss per year is NOK 12 million. In thecase of production losses the maximum loss is NOK 6 million per insurance event and NOK 8 million per year.In order to reduce the risk of losses arising from a failure on the part of the insurance company to pay compensation, Statkraft hasrequired that both the direct insurance company and reinsurance companies shall have a rating of BBB or better. Furthermore, Statkraft’srisk is limited by the Norwegian authorities having established a guarantee scheme that ensures that policyholders receive claim paymentseven though the insurance cover is with a Norwegian insurance company that goes into liquidation.
Note 26OTHER ISSUES
In January 2001, the Corporate Meeting instructed Statkraft to stop all work on the Beiarn, Bjellåga and Melfjord development projects. Asa result of this, provisions have been made for liquidation costs.The Board assumes that Statkraft will receive compensation in connectionwith these projects being stopped. None of this was taken to income in 2000.
In 2001 the German energy company E.ON increased its stake in Sydkraft AB to more than 40%. Under Swedish law this triggers off amandatory offer to all shareholders. In a press release, E.ON says that the prices offered will be SEK 240 and SEK 200 for A-shares andC-shares respectively.The EU competition authorities are now considering the case and it is expected that they will decide whether theacquisition is in line with the EU’s competition regulations by 15 March.The final prospectus is expected to be issued on 16 March andStatkraft will then have 3 weeks to evaluate the offer.
No
te
s
to
t
he
a
cc
ou
nt
s
59S T A T K R A F T A N N U A L R E P O R T 2 0 0 0

Au
di
to
r’
s
re
po
rt
Auditor’s report for 2000To the Corporate Meeting of Statkraft SF
We have audited the annual financial statements of Statkraft SF as of 31 December 2000, showing a
profit of NOK 714 million for the Enterprise and a profit of NOK 847 million for the Group.We have
also audited the information in the director’s report concerning the financial statements, the going
concern assumption, and the proposal for the appropriation of the profit.The financial statements
comprise the balance sheet, statements of income and cash flows, the accompanying notes and the
consolidated accounts.These financial statements are the responsibility of the Board of Directors and
Chief Executive Officer. Our responsibility is to express an opinion on these financial statements and
on other information according to the requirements of the Norwegian Act on Auditing and Auditors.
We conducted our audit in accordance with the Norwegian Act on Auditing and Auditors and auditing
standards and practices generally accepted in Norway.Those standards and practices require that we
plan and perform the audit to obtain reasonable assurance about whether the financial statements are
free of material misstatement. An audit includes examining, on a test basis, evidence supporting the
amounts and disclosures in the financial statements. An audit also includes assessing the accounting
principles used and significant estimates made by management, as well as evaluating the overall
financial statement presentation.To the extent required by law and auditing standards an audit also
comprises a review of the management of the Enterprise’s financial affairs and its accounting and
internal control systems.We believe that our audit provides a reasonable basis for our opinion.
In our opinion
• the financial statements have been prepared in accordance with law and regulations and present
the financial position of the Enterprise and of the Group as of 31 December 2000, and the results
of its operations and its cash flows for the year then ended, in accordance with accounting
standards, principles and practices generally accepted in Norway.
• the Enterprise’s management has fulfilled its obligation in respect of registration and documentation
of accounting information as required by law and accounting standards, principles and practices
generally accepted in Norway
• the information in the directors’ report concerning the financial statements, the going concern
assumption, and the proposal for the appropriation of the profit is consistent with the financial
statements and comply with law and regulations.
Oslo, 6 March 2001
ARTHUR ANDERSEN & CO.
Finn Berg Jacobsen (sig)
State Authorised Public Accountant (Norway)
60 S T A T K R A F T A N N U A L R E P O R T 2 0 0 0 S T A T K R A F T

Key figuresThe Group
Unit 2000 1999 1998 1997 1996
Financial result:
Gross operating revenues NOK mill. 5 285 5 601 5 314 5 353 5 562
Net operating revenues NOK mill. 4 671 4 912 4 760 4 702 4 698
Operating income NOK mill. 2 178 2 174 2 198 1 998 2 354
Pre-tax income NOK mill. 1 765 1 691 1 631 1 277 1 686
Net income for the year 1) NOK mill. 847 947 890 1 238 455
Investments
Investments NOK mill. 9 411 7 026 944 1 085 6 772
Balance sheet 31.12.
Cash and cash equivalents NOK mill. 2 514 1 299 1 796 1 153 1 314
Equity NOK mill. 21 742 21 503 17 322 16 669 14 480
Total assets NOK mill. 55 616 47 067 42 430 40 075 39 089
Key ratios:
Return on total assets before tax 2) % 6.5 6.3 6.5 6.2 7.2
Return on total assets after tax 3) % 4.7 4.7 4.7 6.1 3.8
Return on equity before tax 4) % 8.2 8.7 9.6 8.2 13.2
Return on equity after tax 5) % 3.9 4.9 5.2 7.9 3.6
Gross profit margin 6) % 33.4 30.2 30.7 23.9 30.3
Net profit margin 7) % 16.0 16.9 16.7 23.1 8.2
Equity ratio 8) % 39.1 45.7 40.8 41.6 37.0
Current ratio 9) 1.3 0.8 1.5 1.1 0.8
Interest coverage 10) 1.5 1.9 1.8 2.0 1.5
Net cash flow provided by operations NOK mill. 1 772 1 849 1 256 1 427 1 814
Staff
Employees 31.12. Number 1 187 1 430 1 535 1 400 1 037
Production and turnover:
Production (after pumping and loss) TWh 40.2 32.5 32.4 27.5 32.2
Purchases TWh 1.1 2.5 2.7 3.4 4.4
Sales, contract market TWh 22.4 25.6 27.0 25.2 28.5
Sales, spot market TWh 17.5 7.9 7.2 2.9 3.8
Firm export contracts TWh 1.4 1.5 3.5 2.8 4.2
Installed generator capacity (Statkraft’s share) MW 8 815 8 800 8 700 8 700 8 700
Wholly and partly owned plants Number 93 91 91 86 86
Ke
y
fi
gu
re
s
61S T A T K R A F T A N N U A L R E P O R T 2 0 0 0
1997 and 1998 have been restated inaccordance with the new Accounting Act.
1) Net income + financial expensesAverage total assets
x 1003)Net income + financial expenses
Average total assetsx 100
2)
Pre-tax incomeAverage equity
x 1004) Net income
Average equityx 100
5) Income before taxesGross operating revenues
x 1006)
Net incomeGross operating revenues
x 1007) Equity
Assetsx 100
8) Current assetsCurrent liabilities
9)
Net income + financial expensesFinancial expenses
10)

So
ci
al
a
ud
it
The Social Audit (Value Added Statement) shows the value
added that has taken place through labour input, capital input,
knowledge and technology input, and how this is distributed
among the various stakeholders who have contributed.The
employees get their share of value added in the form of wages
and social benefits.The owners get their share in the form of
dividends and retained earnings, while lenders receive their part
of the value added in the form of interest payments. Central and
local authorities receive their share in the form of taxation levied
on the company and duties/levies paid by the company.
In 2000 the value added was higher than ever before, namely
NOK 4.2 billion.The value added was maintained despite a
difficult energy market, and was distributed as follows: 13 per
cent to the employees, 38 per cent to lenders, 29 per cent to
central and local authorities and 20 per cent to the owner. Of
the owner’s share an amount of NOK 631 million was
distributed as dividend while the company retained NOK 210
million.Thus the company retained only 5 per cent of value
added.
62 S T A T K R A F T A N N U A L R E P O R T 2 0 0 0 S T A T K R A F T
Value added in NOK million 2000 1999 1998 1997 1996
Gross operating revenues 5 285 5 601 5 314 5 353 5 562
- Consumption of goods and services purchased 1 419 1 798 1 495 1 458 1 469
Gross value added 3 866 3 803 3 819 3 895 4 093
- Ordinary depreciation 849 799 830 824 827
Net value added 3 017 3 004 2 989 3 071 3 266
+ Financial income 426 210 156 217 235
+ Result from associated companies 729 443 315 255 -
- Minority interests 6 1 3 10 -
Value added for distribution 4 166 3 655 3 457 3 533 3 501
Distribution of value added in NOK million 2000 1999 1998 1997 1996
Employees
Gross wages and social benefits 554 575 530 396 276
Lenders/owners
Interest 1 568 1 135 1 038 1 193 903
Dividend 631 600 309 - -
Taxes and levies 1 202 999 1 002 716 1 867
The company
Change in equity 210 346 578 1228 455
Total distributed 4 166 3 655 3 457 3 533 3 501
Gross operating revenue: Power revenues + Other operating revenues
Consumption of goods and services purchased: Transmission costs + compensation + other operating costs
Gross wages: Labour costs - Nat. insurance contribution
Taxes and levies: Taxes + production levies + licences fees + Nat. insurance contribution
Social audit - Value added statement
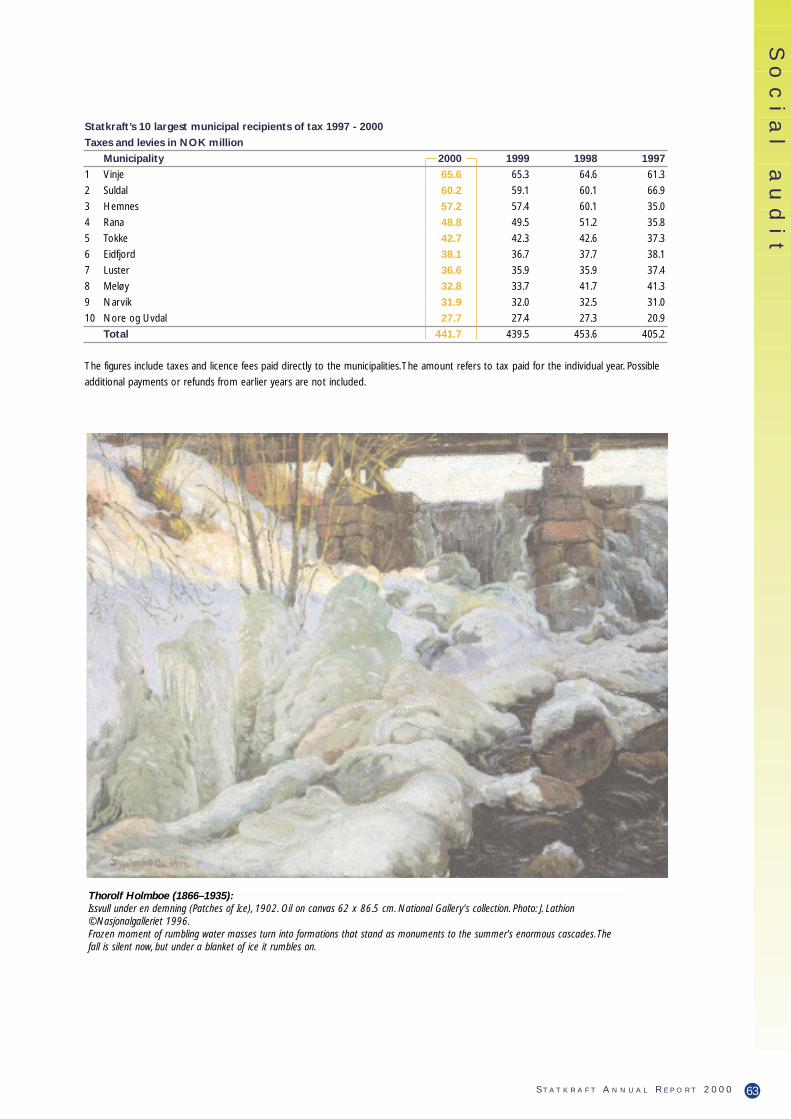
Statkraft’s 10 largest municipal recipients of tax 1997 - 2000
Taxes and levies in NOK million
Municipality 2000 1999 1998 1997
1 Vinje 65.6 65.3 64.6 61.3
2 Suldal 60.2 59.1 60.1 66.9
3 Hemnes 57.2 57.4 60.1 35.0
4 Rana 48.8 49.5 51.2 35.8
5 Tokke 42.7 42.3 42.6 37.3
6 Eidfjord 38.1 36.7 37.7 38.1
7 Luster 36.6 35.9 35.9 37.4
8 Meløy 32.8 33.7 41.7 41.3
9 Narvik 31.9 32.0 32.5 31.0
10 Nore og Uvdal 27.7 27.4 27.3 20.9
Total 441.7 439.5 453.6 405.2
The figures include taxes and licence fees paid directly to the municipalities.The amount refers to tax paid for the individual year. Possible
additional payments or refunds from earlier years are not included.
So
ci
al
a
ud
it
63S T A T K R A F T A N N U A L R E P O R T 2 0 0 0
Thorolf Holmboe (1866–1935):Issvull under en demning (Patches of Ice), 1902. Oil on canvas 62 x 86.5 cm. National Gallery's collection. Photo: J. Lathion©Nasjonalgalleriet 1996.Frozen moment of rumbling water masses turn into formations that stand as monuments to the summer's enormous cascades.Thefall is silent now, but under a blanket of ice it rumbles on.

The river course is affected
64 S T A T K R A F T A N N U A L R E P O R T 2 0 0 0 S T A T K R A F T
Dam and surroundings
Transfer from other watercourses
Buildings along the riverFor agricultural and built-up areas,watercourse regulation can reducesuch problems as floods, drifting ice and erosion.
Water course below the power plant
Heritage sites
Environment: from dam to fjordChallenges and opportunities
OpportunitiesReservoir exploitation that accommodates the environmentInlet brook undertakingsSpawning gravel in brooks and shorelineMeasures to hinder erosionLaying grounds for natural reproductionReleasing smolt and fry
ChallengesRegulation zoneLess fishErosion Aesthetics
ChallengesThe quality of watertransferred from otherwatercourses may bebetter, equal or inferior.
OpportunitiesMeasures against poor water quality,such as adding lime. Better waterquality is considered positive.
ChallengesChange in water flowReduction in splendourand richness of natureInferior conditions for fish
ChallengesChange in conditions forsalmon and sea trout andfishing between the powerplant and the fjordErosionDrifting iceEffect of water temperatureLocal changes in climate, e.g.frost smoke
OpportunitiesAdjust water flow for fish and fishingArtificial freshetThresholds, deep pools etc.Spawning gravelMinimum water flowMeasures to affect watertemperaturePower plant operations adjustedto the environment
Impact on the landscapeChallengesScenic beauty ofwaterfalls, runsand riverbank isdiminished
OpportunitiesEnvironmentally adaptedwater flow, thresholds etc.
ChallengesCultural heritagesites taken out of their naturalenvironment
OpportunitiesPositive action forheritage sites
Power plants
E n v i r o n m e n t a l - c h a l l e n g e s
Environmentally friendly power plantoperations
OpportunitiesPhysical intervention in rivercourse to improveappearance of river and toimprove conditions for fish Environmentally-adaptedwater flow

65S T A T K R A F T A N N U A L R E P O R T 2 0 0 0
E n v i r o n m e n t a l - c h a l l e n g e s
Environment: challenges facinghydro power productionGLOBAL ENVIRONMENTAL IMPACT: HYDRO POWER AND \ KYOTOProduction for the year (Statkraft) 40.2 TWh 0 tonnes CO2
Corresponding volume "coal-power" 26.9 million tonnes CO2 (NOU 1998:11, tab 24.2)
Norways Kyoto quota 55 million tonnes CO2
Local environmental impact: Better understanding and co-operation gives better solutionsKnowledge of environmental Life cycle analyses Mapping of all input to the building and operation of hydro power impact (LCI, LCA) plant (LCI study) was carried out for 5 plants in 1999.The environ-
mental impacts were then analysed through in an LCA study.This was further developed in 2000 through participation in the work on envi-ronmental product descriptions and pricing of environmental costs
Pricing of environmental The first attempt by the energy industry to calculate costs environmental costs in kroner per kWh. Carried out in
association with EBL, BKK and SFE.
Studies, surveys and R&D • Fish biology surveys in i.a.Alta River, Suldalslågen,projects Eidsfjord watercourse, Eira,Vikja, Osa, Sima and
Gluggvass rivers and participation in county surveys in Troms, Nordland and Telemark.
• Pre-studies and impact assessments related to hydro power projects.
• Studies of rapid changes in water levels in rivers.• Contribution to and use of a watercourse simulator
Communication, openness and Open planning processes Early involvement of local community, municipal authorities participation and other affected parties when planning energy projects.
Environmental product Statkraft participates in the development of new standard for description certified environmental product descriptions (ISO 14025).
Statkraft also participates in the work of establishing a market for green certificates.
Environmental accounting First draft prepared in 2000.
Environmental management Environmental certification Start-up of certification to NS ISO 14001
Environmental follow-oup New internal requirements for environmental plans and to of construction projects following up external environment in construction projects
ENVIRONMENTAL ACTION IN 2000Biological diversity • Operating fish hatchery
• Release of fish• Strengthening of natural reproduction through use of thresholds, digging pools, spawning gravel etc.• Operating living gene banks• Environmentally adjusted operation of power plants• Operation and maintenance of fish ladders• Video surveillance of salmon migration • Surveillance of vulnerable nature
Outdoor life • Aesthetic landscape measures linked to tips, roads, mass pits• Measures in watercourses to maintain water surface and reduce impact of regulation• Plan and prepare for better access to regulated watercourses, e.g. by establishing
bathing spots, new walking tracks• Contribute to sustainable fish stocks• Parts of Statkraft’s road network is kept open to the general public
Heritage sites and cultural environments • Heritage sites and the like shall be mapped in connection with impact assessments
Health and environmentally • Comprehensive registration and surveillance of old waste tipshazardous chemicals, top • Surveillance of erosion and particle transportation from regulating reservoirsdressing and oil pollution • Phasing out of halogen gas (fire extinguishers) completed
• Phasing out of oils containing PCB underway• Ascertaining pollution risk of development and operating activities• Registration of materials in Statkraft’s plant that are hazardous to health and the environment• Recipient evaluations included in earlier planning stage
Waste and recovery • Established systems and routines for handling special waste• Registering and tidying up of old plants• Better procedures developed for handling waste from construction works
Climatic changes, air pollution and noise • Statkraft produced 40.2 TWh CO2-free energy in the year 2000
66 S T A T K R A F T A N N U A L R E P O R T 2 0 0 0 S T A T K R A F T
Wind power Smøla Following comprehensive preparatory work, Statkraft was granted a licence Hitra in December 2000 to build windmill parks at Smøla (144 MW),Stadlandet Hitra (56 MW) and Stadlandet (70 MW).Total output is 276 MW and the
estimate production is 768 GWh.New projects Wind gauging has started at seven new sites along the cost, from Finnmark
in the north to Rogaland in the south.The results of these measurements will decide the further work at these locations.
Salt power SINTEF/ Second phase of assessment of salt gradients exploited for energy production,Norwegian Research in association with SINTEF (Foundation for Scientific and Industrial Research) Council/Eureka was completed.
The preliminary conclusions from this project indicates a development costs of down to NOK 0.25/kWh assuming adequate economies of scale and a further development of the membrane technology.The unexploited potential for salt power in Norway is very large, about 25 TWh p.a.
The challenge ahead is to develop a technological base for profitable power production. Further development will be linked to leading membrane development circles. No commercial solutions can be expected before 2010.
Hydrogen/ Pre-project Own activities for building up competence and following technological Fuel cells and market-related developments for hydrogen as an energy carrier.
IEA projects Statkraft participates in international projects that are expected to provide EU projects considerable insight into systems, market niches and technology challenges.
Dr. Eng. candidates Among other things, Statkraft is supporting 3 Dr. Eng. candidates,thus developing essential long-term competence.
Demo projects A demo plant will provide a better understanding of how technology for hydrogen production and application can be exploited in a later commercial phase. Statkraft will consider this. No commercial solution can be expected before 2010.
Environment:New renewable energyNew solutions
E n v i r o n m e n t a l - c h a l l e n g e s
A more detailed presentation of environmental challenges and Statkraft’s environmental measure will appear in Statkraft’s Environmental Reportfor 2000.
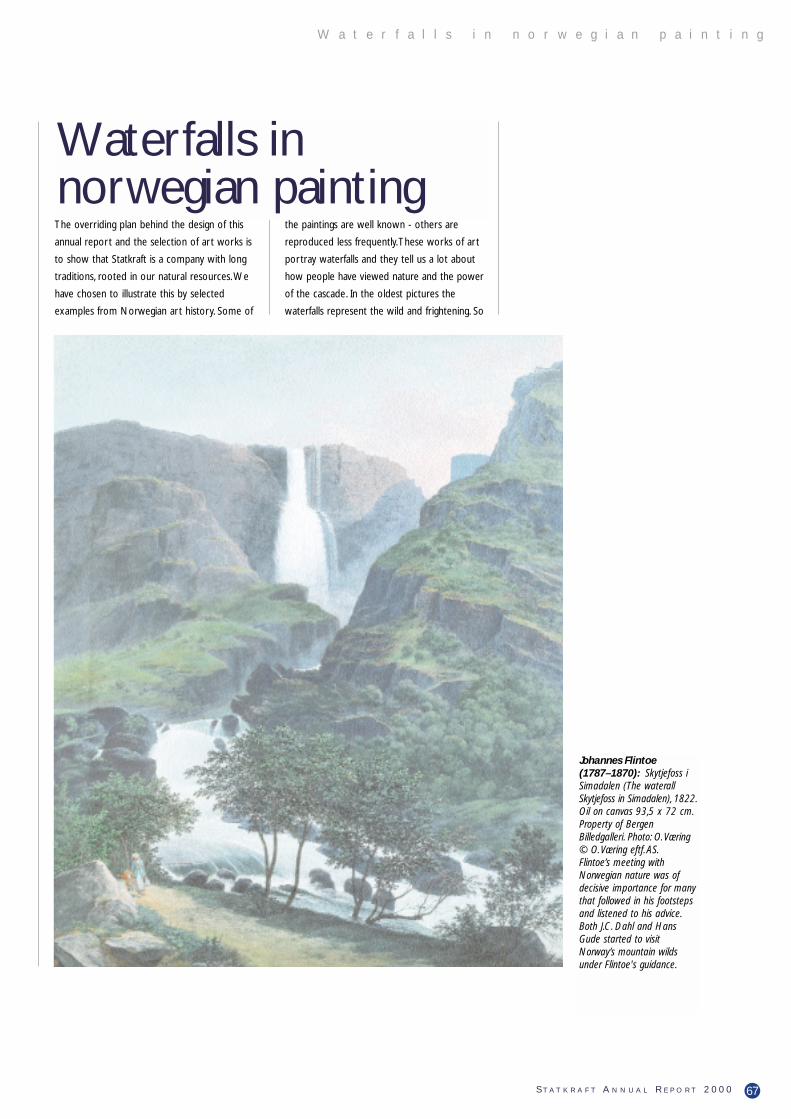
The overriding plan behind the design of this
annual report and the selection of art works is
to show that Statkraft is a company with long
traditions, rooted in our natural resources.We
have chosen to illustrate this by selected
examples from Norwegian art history. Some of
the paintings are well known - others are
reproduced less frequently.These works of art
portray waterfalls and they tell us a lot about
how people have viewed nature and the power
of the cascade. In the oldest pictures the
waterfalls represent the wild and frightening. So
W a t e r f a l l s i n n o r w e g i a n p a i n t i n g
67S T A T K R A F T A N N U A L R E P O R T 2 0 0 0
Waterfalls in norwegian painting
Johannes Flintoe(1787–1870): Skytjefoss iSimadalen (The waterallSkytjefoss in Simadalen), 1822.Oil on canvas 93,5 x 72 cm.Property of BergenBilledgalleri. Photo: O. Væring© O. Væring eftf. AS.Flintoe’s meeting withNorwegian nature was ofdecisive importance for manythat followed in his footstepsand listened to his advice.Both J.C. Dahl and HansGude started to visitNorway’s mountain wildsunder Flintoe's guidance.

68 S T A T K R A F T A N N U A L R E P O R T 2 0 0 0 S T A T K R A F T
the enormous powers of nature are portrayed
with respect.We soon see that the ferocity of
the falls attracts the first tourists who refrain
from doing anything but viewing the foaming
cascades of water at a safe distance.The size of
people in these paintings also provides an
indication of proportions.They were probably
included to show us just how powerful nature
is. In the third phase, people have tamed the
forces of the waterfall and put them to work.
In many of the paintings we see examples of
sagacious devices that serve mankind's interests.
Every type of waterfall has been used, be it the
gushing cascades or the quiet streams. Creative
engineering ensured that many needs were
satisfied and people spared of hard labour.The
waterfalls were the first things we learned to
tame here in Norway, maybe because they are
among the most fascinating.
When the first artists started to seek out
Norwegian nature, they often produced pictur-
esque "travelogues".They had very definite
opinions as to what was "picturesque" and this
was often described as the sublime that should
be sought out and reached for. At the end of
the 1700s, when Englishmen started to print
the first collections of graphic works with travel
motifs , a series was published with pictures
from Norway, Switzerland and India, because
these counties were considered to be equally
exotic.The Norwegian painters, whom for the
most part were educated abroad, sought out
Norwegian motifs in summer. Based on sketches
made "on the spot" they could spend the rest
of the winter in Germany or France complet-
ing large paintings of Norwegian waterfalls. Falls
have been a favourite motif since the mid-
1800s, but their popularity fell quickly toward
the end of the century.Times changed, and so
did motifs. It is therefore interesting to look at
examples by Gerhard Munthe and Nikolai
Astrup.They belong to the last generation of
waterfall painters.
Paintings are our collective memory and
cultural history.Today, hardly any children build
waterwheels in brooks, and neither water-
powered saws nor millstones are part of our
everyday lives.We live comfortably and
protected, so we use these illustrations as a
reminder that behind much of our electricity
based day-to-day material comfort, lies the
forces of waterfalls.
Dorthea Hysing
W a t e r f a l l s i n n o r w e g i a n p a i n t i n g