Embed Size (px)
Citation preview
Natural Warning Signs of Tsunamis:Human Sensory Experience and Responseto the 2004 Great Sumatra Earthquakeand Tsunami in Thailand
Chris E. Gregg,a… Bruce F. Houghton,b… Douglas Paton,c… Roy Lachman,d…
Janet Lachman,d… David M. Johnston,e… and Supin Wongbusarakumf…
Natural warning signs of tsunamis include ground shaking from earth-quakes and unusual sea-level fluctuations, wave forms, and sounds. Thesesigns can alert people to impending tsunamis, but no research has explored therecognizability of these signs or the social-cognitive factors that affect humanbehavioral response to them. Of 663 interviewees, 24% felt ground shakingduring the earthquake; 69% saw something unusual about the ocean before thefirst wave reached land, mostly a receded shoreline; and 55% heard somethingunusual. Despite these levels of observation, most people did not evacuate. Infact, 65% saw other people in the danger zone at the time of the tsunamiimpact. Most respondents had to run for their lives but could not identify a safeplace. There are major differences in experience among north, central, andsouthern coastal Thailand, reflecting social, topographical, and hydrologicalfactors. �DOI: 10.1193/1.2206791�
INTRODUCTION
The arrival of tsunamis in coastal areas is often preceded by natural phenomena thatcan be used as an alert �Darienzo et al. 2005, Dudley and Lee 1998, Gonzalez 1999,Gregg 2005, Gregg et al. 2006, Shuto 1997�. For example, the arrival of a negative waveor trough causes a shoreline to recede �Lander and Lockridge 1989�, exposing portionsof the ocean floor that are not normally visible, even during low tides. Unusual waveforms can also precede the arrival of the real tsunami onshore. Such forms have beendescribed as a wall of water, a rising tide-like flood, or a large breaking wave �Gonzalez1999�. These and other natural phenomena constitute natural signs of tsunamis and haveserved as effective alerts to impending danger in historic events �Gregg 2005�.
Natural signs can complement and help fill in a missing link in mechanical tsunamiwarning systems that are designed to provide an early alert to vulnerable communities
a� Department of Physics, Astronomy and Geology, East Tennessee State University, Box 70652, Johnson City,TN 37614; E-mail: [email protected]
b� Department of Geology and Geophysics, SOEST, University of Hawaii, Honolulu, HIc� Department of Psychology, University of Tasmania, Launceston, Australiad� Department of Psychology, University of Houston, Houston, TXe� Institute of Geological and Nuclear Sciences, Lower Hutt, New Zealandf�
United Nations Development Program, Chiang Mai, Thailand, and Honolulu, HIS671Earthquake Spectra, Volume 22, No. S3, pages S671–S691, June 2006; © 2006, Earthquake Engineering Research Institute
S672 C. E. GREGG ET AL.
through the use of sirens, loudspeakers, and so on. In the case of locally generated tsu-namis, mechanical warning systems, which rely on information collected by seismom-eters, tide gauges, tsunami pressure sensors, and eyewitness observations, cannot alwaysprovide alerts to official agencies—and thus to the public at large—before damagingwaves arrive onshore. For example, after the events of 26 December 2004, officials inthe United States indicated that tsunamis could not be reported in less than about 15–20minutes from the time the waves are generated. Natural warnings may be the first andonly alert before the first wave arrives onshore.
Local tsunami warnings have been issued within several minutes of earthquakes butoften leave little chance for an effective response. The Japan Meteorological Agency an-nounced the 1993 Hokkaido earthquake in Japan within about 3 minutes of the earth-quake, which generated local tsunamis that destroyed Okushiri Island, Japan; however,the official warning was not received by some members of the public for a variety ofreasons, including difficulties with faxes and phones and the fact that fiber optic com-munications lines were severed by ground shaking from the earthquake �Dudley and Lee1998�. Some residents, in fact, used ground shaking from the earthquake as an alert ofan imminent tsunami and reacted by evacuating to safe ground. People living in coastalinundation zones near the source of tsunamis must therefore be familiar with and possesa capacity to recognize the natural signs of tsunamis and immediately respond by evacu-ating to safe areas, if the loss of life is to be minimized in future tsunamis. Similar ef-fective responses to natural signs �e.g., a receded or frothy ocean� were made by peoplein Thailand in 2004, namely, the indigenous Moken people and a 10-year-old Englishvisitor.
A concern about using natural warning signs as an alert of impending tsunamis is thelack of a systematic study to identify and explain the ways in which humans observe andrespond to the phenomena. Available data, which are often anecdotal in nature, suggestthat responding is often problematic and that people do not link the precursors to thedamaging hazards that will probably follow—or, if people do link the precursors withthe hazards, they ignore the precursors. In many events, people have intentionally goneto the shoreline and either have become fatalities or have survived only because no dam-aging waves were generated. Thousands of people gathered at the Indian Ocean shore-line when the sea receded during the December 2004 tsunami.
We know more about how people respond to official warnings of hazard events�Lachman et al. 1961, Mileti and O’Brien 1992� and less about why they do and whatfactors influence whether they attend to natural warning signs or official warnings. Fortsunamis specifically, we simply know little about the causes of people’s behavior andtheir response to the signs of tsunamis, especially how people recognize and interpret thesigns and how their response changes as danger escalates. What we know about humanobservation and response before and during tsunamis comes from a few observations inhistoric events �e.g., in Hawaii, Japan, and Chile�. We need insight into the reasoningprocesses that explain observations and behaviors. In the absence of a systematic analy-sis of the perception and interpretation of natural warning signs and how such percep-tion and interpretation influence response actions, it will be impossible to develop effec-tive risk reduction strategies to enhance this capacity in populations that are susceptible
NATURAL WARNING SIGNS OF TSUNAMIS: HUMAN SENSORY EXPERIENCE AND RESPONSE IN THAILAND S673
to locally generated tsunamis. The physical sciences have made great inroads into iden-tifying precursors and the mechanisms that govern tsunamis. To fully utilize this knowl-edge, it is important to understand how communities interpret and use it. In this way, wecan ensure better knowledge transfer and more-informed and better-prepared communi-ties.
Here we describe preliminary data collected in the disaster zone of Thailand after thedevastating M=9.3 Great Sumatra earthquake �Lay et al. 2005� and tsunami events of 26December 2004. We report observations from field reconnaissance and frequency countsof responses to closed-ended questions �yes-or-no questions�. The data were collectedduring a large and unprecedented social science interview survey conducted in all six ofThailand’s affected provinces. Specifically, we report on �1� the extent to which ground-shaking was felt; �2� observations of unusual sea-level changes, wave forms, and soundslinked to the tsunami; and �3� evacuation experience. We close with a discussion of thefindings to support the use of natural warning signs of tsunamis in official tsunami warn-ing systems. We begin by providing additional background on the natural warning signs.An important component and complement to this study is an investigation of experiencewith the magnitude M=8.7 Nias earthquake and subsequent tsunami warning andevacuation on the night of 28 March 2005. Much of the open-ended data collected aboutthe December and March events is still being translated and will provide an importantcomplement to the data presented here.
NATURAL WARNING SIGNS OF TSUNAMIS
Research on the relationship between natural warning signs of tsunamis and humanbehavior is scarce. There are, however, numerous ad hoc references to individual phe-nomena in historic events and their ability to serve as warning signs of impending tsu-namis. Darienzo et al. �2005� summarized some aspects of local and official warnings inthe state of Washington. However, Gregg et al. �2006� described how literature on natu-ral warnings of tsunamis is ambiguous and seldom specific enough to be useful. Whilethis latter study was not an exhaustive literature search, it highlighted a need for moreconsistent messages about natural signs of tsunamis and how people should respond tothem. It also highlighted the idea that the inconsistency of messages may be explained,at least in part, by a limited understanding of the physical behavior of tsunamis in shal-low water. Gregg et al. �2006� also described public expectations of future warnings �i.e.,warnings from natural versus official sources� among the residents of Hilo, Hawaii, whohave been impacted by tsunamis more than any other community in the United States.However, no systematic studies have addressed the human perception of, and responseto, natural warning signs in any specific historic event.
The lack of research on human response to natural signs of tsunamis elevates theimportance of physical and social scientists working together on matters relating physi-cal characteristics of tsunamis to attitudinal and behavioral characteristics of peoplelikely to be affected by tsunamis. Information that is ambiguous or is perceived as beingnot specific enough will not be used by people and will undermine trust in the sources ofthat information �Paton et al. 2006�. Identifying warning signs that people perceive asrelevant is important not just as a trigger to action that can protect life, or as a way for
S674 C. E. GREGG ET AL.
people to confirm a previous warning �e.g., an official warning, as described in Miletiand O’Brien 1992�, it is also important from the perspective of maintaining good work-ing relationships among scientific and civic agencies and community members. Achiev-ing the former requires that we understand how people interpret natural signs and thesocial and psychological mechanisms that link those signs to protective action. This pa-per provides a systematic overview of the community members’ perceptions of, and re-sponses to, natural warning signs of tsunamis using the earthquake and tsunami eventsof 26 December 2004 as a case study.
PRECURSORS TO THE 26 DECEMBER TSUNAMI
After the catastrophic events in the Indian Ocean occurred on December 26, it wassoon recognized that, in the absence of mechanical warning systems, people in the dan-ger zone required an alternative warning mechanism to survive the waves. In otherwords, the people needed to use observations of natural warning signs of tsunamis. Thisapplied to people both near and far from the wave source, from Indonesia to Kenya toThailand. Natural warnings existed in many places, and the fact that thousands of peoplewere reported to have flocked to the shore when the ocean receded �e.g., in Thailand andSri Lanka� is a testament to the cross-cultural salience of this phenomenon.
The waves were preceded by naturally occurring signs of tsunamis, such as groundshaking from the earthquake, sea-level withdrawal, and unusual waves and sounds.Ground shaking from the earthquake provided about 2 hours of forewarning in Thailand,while other natural signs provided considerably less forewarning �tens of seconds to afew minutes�.
Some people were alerted to the waves by cell phone and land line calls from friendsand family members who had already learned of the disaster, but many of these mes-sages arrived too late to be useful. The messages did not provide sufficient time to alertothers to the danger and convince them to seek higher ground. Furthermore, the mes-sages sometimes had the opposite effect of what was intended—they prompted the re-cipient to go to the beach to see the big wave rather than evacuate.
People across the Thai-Malay peninsula felt slight ground shaking from the earth-quake, but the salience of the shaking was less than in the areas closer to the earthquakeepicenter. Shaking in Thailand was weak to moderate �MM I–V �USGS 2005��, and re-connaissance work in the affected coastal regions of Thailand indicated that the cause ofthe shaking was not attributed to an earthquake, but to other phenomena, such as wind,a passing truck, or a neighbor shaking the house �many people were home at the time,and the houses—especially of many fishing people—are small and structurally weak, soa neighbor can easily shake a house�. This provides an important clue as to why it isdifficult for ground shaking and other natural signs to serve as an effective alert abouttsunamis. When faced with environmental data, people interpret it in ways consistentwith their normal frames of reference. These may not be appropriate for the atypical re-sponse required for tsunami hazards. This view suggests a need for closer relationshipsbetween scientific agencies and communities, to help the latter understand the hazardsthey could face and the relevance of those hazards for their well-being and economic
NATURAL WARNING SIGNS OF TSUNAMIS: HUMAN SENSORY EXPERIENCE AND RESPONSE IN THAILAND S675
resilience. Using a process of community engagement to build a better understanding ofthe relationship among hazards, warning signs, and behaviors that are specific to thevarious hazards will increase the likelihood of effective response to warnings.
Prior to the arrival of destructive tsunami crests in Thailand, the shoreline retreatedhundreds of meters as a tsunami trough arrived in shallow waters. Our review of videosand of conversations with eyewitnesses show, not surprisingly, that many people ob-served the receded shoreline and unusual walls of frothing water forming and travelinglandward at least 3.5 minutes before the first positive wave arrived onshore. The peopleeagerly went out onto the exposed seafloor to explore what had been hidden by the hightidal waters minutes before. Unaware that the receded ocean meant tsunami crests werebuilding up above sea level further offshore, many people were later overcome whenthose waves arrived onshore. By the time some people realized the danger posed by thewaves, it was too late to have a high degree of success in escaping the waves. However,before these people were overcome, other signs �alerts� of the approaching tsunami werealso provided by nature and seen or heard by many people. These alerts included thetossing and/or sinking of boats, as well as sounds that were linked to the tsunami.
Some people made the link between signs of a tsunami and imminent danger. Amongthe knowledgeable people were the indigenous Moken people of the Andaman Sea areaand a 10-year-old English girl, Tilly Smith, who was on vacation in Phuket during thetsunami. The Moken recognized the receded sea as a sign of an imminent tsunami andsuccessfully evacuated to safe areas on higher ground �Marx 2005�. However, TillySmith recognized that the sea was bubbling on the horizon during drawdown, similar towhat she had recently seen in a film of the 1946 tsunami that struck Hawaii �BBC News2005�. The significance of these two examples is how the people involved learned of thenatural signs of tsunamis before the December 26 event. The Moken learned about theconnection of a receded sea and tsunamis through traditional knowledge handed downthrough informal education, whereas Tilly Smith learned of the connection between areceded shoreline or bubbly sea and tsunami through formal education in a geographyclass. An unknown number of people around her evacuated because she recognized thereceded shoreline as a tsunami warning sign and informed her parents of the impendingdanger. This example, combined with the observations of the Moken people, highlightthe ability of a receding shore and unusual wave forms to provide effective early alertsthat allow people minutes of valuable time to evacuate to safe areas. The difference inthe channels �informal versus formal� through which the Moken and Tilly Smith learnedof the natural signs of tsunami, and how to respond, highlights the need to combine com-munity members’ traditional knowledge with formal scientific education and training.
We know from reconnaissance work that, where shorelines were irregular, local resi-dents heard sounds linked to the tsunami before the crests approached from aroundheadlands and into bays. These sounds have been previously described as being likethunder, a train, a booming sound, a helicopter, or a jet �Shuto 1997�. However, at thistime we cannot confirm the relative timing of the visual detection of tsunami phenomenaand of their aural detection where the shoreline was several kilometers long. The timingof the detection of these sounds meant that people in the danger zone probably had lesstime to take protective action than those who earlier had recognized a receded shoreline
S676 C. E. GREGG ET AL.
or a wall of water 1–2 km offshore. For example, one report from a tsunami survivorvisiting Thailand from the United States indicated that he saw people running from thebeach and then heard an “explosion” that sounded like “cannon fire,” which was fol-lowed by the sight of “a black mass of water” �Oberle 2005�. The report indicated thatthere were mixed interpretations of the cause of the water, including a sewer line break-ing, a dam failure, and a terrorist attack. The author reported that the explosion-likesounds were due to the tsunami slapping the fronts of hotels as the wave successivelyreached different points up the beach. This suggests a need to build knowledge of soundsinto peoples’ models of tsunamis and people’s response to these sounds. This is neces-sary to reduce the tendency to explore novel environmental stimuli out of curiosity, be-cause response times are short once tsunami sounds are detected.
TSUNAMI DAMAGE AND THE THAILAND ECONOMY
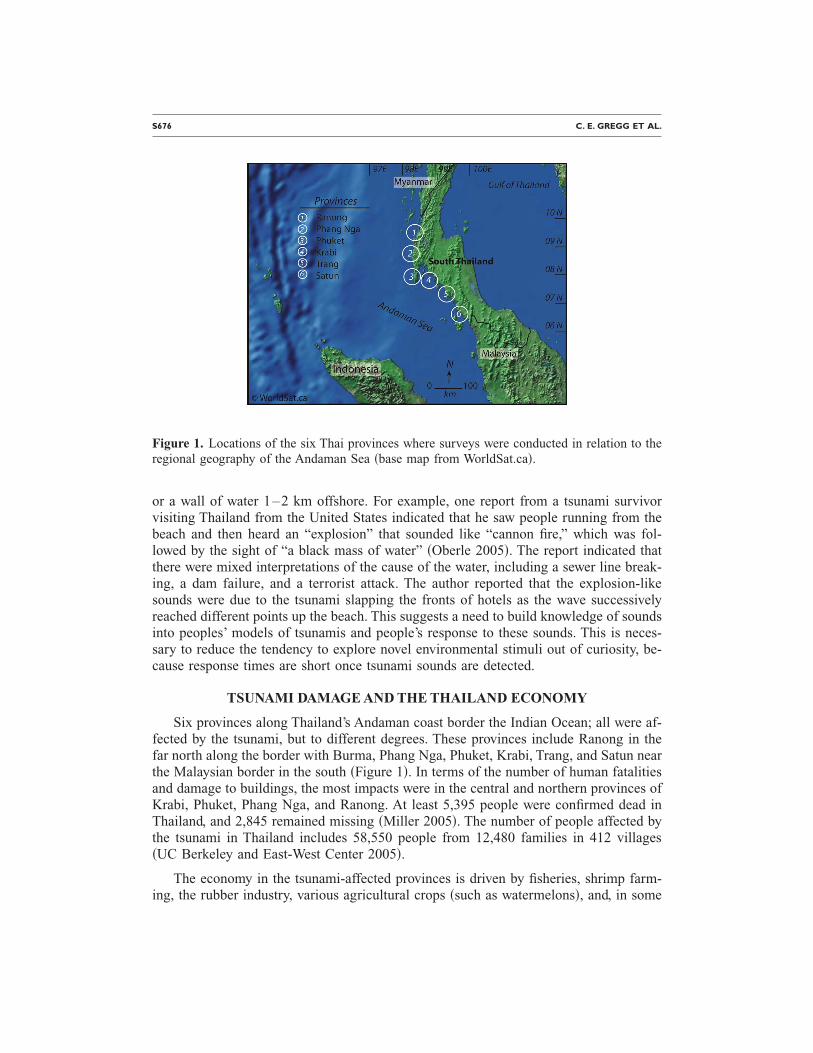
Six provinces along Thailand’s Andaman coast border the Indian Ocean; all were af-fected by the tsunami, but to different degrees. These provinces include Ranong in thefar north along the border with Burma, Phang Nga, Phuket, Krabi, Trang, and Satun nearthe Malaysian border in the south �Figure 1�. In terms of the number of human fatalitiesand damage to buildings, the most impacts were in the central and northern provinces ofKrabi, Phuket, Phang Nga, and Ranong. At least 5,395 people were confirmed dead inThailand, and 2,845 remained missing �Miller 2005�. The number of people affected bythe tsunami in Thailand includes 58,550 people from 12,480 families in 412 villages�UC Berkeley and East-West Center 2005�.
The economy in the tsunami-affected provinces is driven by fisheries, shrimp farm-ing, the rubber industry, various agricultural crops �such as watermelons�, and, in some
Figure 1. Locations of the six Thai provinces where surveys were conducted in relation to theregional geography of the Andaman Sea �base map from WorldSat.ca�.
NATURAL WARNING SIGNS OF TSUNAMIS: HUMAN SENSORY EXPERIENCE AND RESPONSE IN THAILAND S677
places, tourism. The tourist sector is mostly limited to Phuket and isolated areas ofPhang Nga �e.g., Khao Lak� and Krabi �e.g., Phi Phi Don Island�, although relativelysmall tourism developments can be found throughout the coastal areas. Tourism was hithardest in the provinces of Phuket, Phang Nga, and Krabi. In Phuket, wide west-facingbays on the west side of Phuket Island �one of Thailand’s premier tourist areas� suffereddamage, but the damage was mostly limited to the areas very near the shore. In anothermajor tourist area, Khao Lak, extreme damage was experienced along a 0.7–1.5-kmswath of low-lying coastal land where development was concentrated. A few islands inKrabi also suffered heavy damage, such as Phi Phi Don Island, but also including LantaYai Island. Phi Phi Don Island was particularly hard hit, suffering severe damage tostructures and heavy loss of life, all in a low-lying isthmus several hundred meters wideand 1 km long that connects two elongated ridges that rise steeply out of the AndamanSea. The tsunami waves entered bays on opposite sides of the isthmus, completely wash-ing over the densely developed area.
Communities built around small-scale fisheries suffered heavily because they were inthe coastal zone, where the tsunami was most damaging. Hat Thap Tawan and Ban NamKhem in Phang Nga were hard hit, as well as Hat Prapat, Ban Thale Nok, and Ban HatSai Khao in Ranong. Much of the Thai-Andaman coastline is very rural and undevel-oped. Thailand’s wealthy social class does not generally reside in or seek recreation inthe coastal zone; instead, this class lives in higher-elevation areas above tsunami inun-dation zones. Had the wealthy class occupied the danger zone, the economic impactswould have been exacerbated.
THE SURVEY
SURVEY DESIGN AND DATA COLLECTION
An oral questionnaire was prepared by a multinational and multidisciplinary re-search team from Thailand, Australia, New Zealand, and the United States. The research-ers initially prepared the survey instrument in English and then had it translated intoThai in preparation for a pretest of the questionnaire beginning on 29 March 2005. How-ever, the magnitude 8.7 earthquake that occurred late in the night of 28 March providedthe opportunity to include new survey questions that measured human sensory aware-ness of, and response to, the ground shaking of this event, in addition to eliciting ac-counts of the respondents’ experience in the December event. Because the 28 Marchearthquake prompted a tsunami warning and evacuation for coastal Thailand, additionalquestions were included to measure how people received the warnings and how they re-sponded to them. Six researchers were then recruited from universities in Thailand. Theethnic origin of one of these researchers was Urak Lawoi; the Urak Lawoi are a formerlysemi-sea nomadic people of Thailand. After the researchers were trained in the method-ology to be used in the survey, a modified version of the original questionnaire was pre-tested in two villages in Satun province on 29–30 March 2005.
Two of the authors, an American geologist �C. Gregg� and a Thai social scientist �S.Wongbusarakum�, then spent 12 days in the field conducting reconnaissance work toidentify potential communities to survey. The two-member team was aided by a third
S678 C. E. GREGG ET AL.
member �Somyos Tolang� who worked for the Federation of Small-Scale Fisheries inTrang, Thailand. S. Tolang acted as a facilitator, because his network of community con-nections gleaned from intimate knowledge of the Thai culture and links to numeroussmall-scale fishing people provided easy access to community leaders and administra-tors of local nongovernment organizations �NGOs�, government organizations, and non-profit agencies. In each community visited, we spoke with people such as village leaders,prominent business leaders, boat repair leaders, disaster response and recovery organi-zation workers, fishermen, and residents at large. The aim of this reconnaissance workwas to identify survey locations, inform community leaders of our project, and obtaintheir input concerning the project and the 26 December and 28 March events. Surveylocations were selected on the basis of factors including the relative extent of damageand loss of life, tsunami runup and inundation, and coastal topographic and geomorpho-logic features �e.g., steep headlands, bays, linear beaches, and islands�.
After the reconnaissance, in communities spanning the six affected provinces, thequestionnaire was again modified to reflect changes in research focus as a result of theconsultation with affected community members. The six Thai graduate field researchers,recruited because of their ability to speak southern Thai and their experience with surveyresearch, were then further trained in data collection methods.
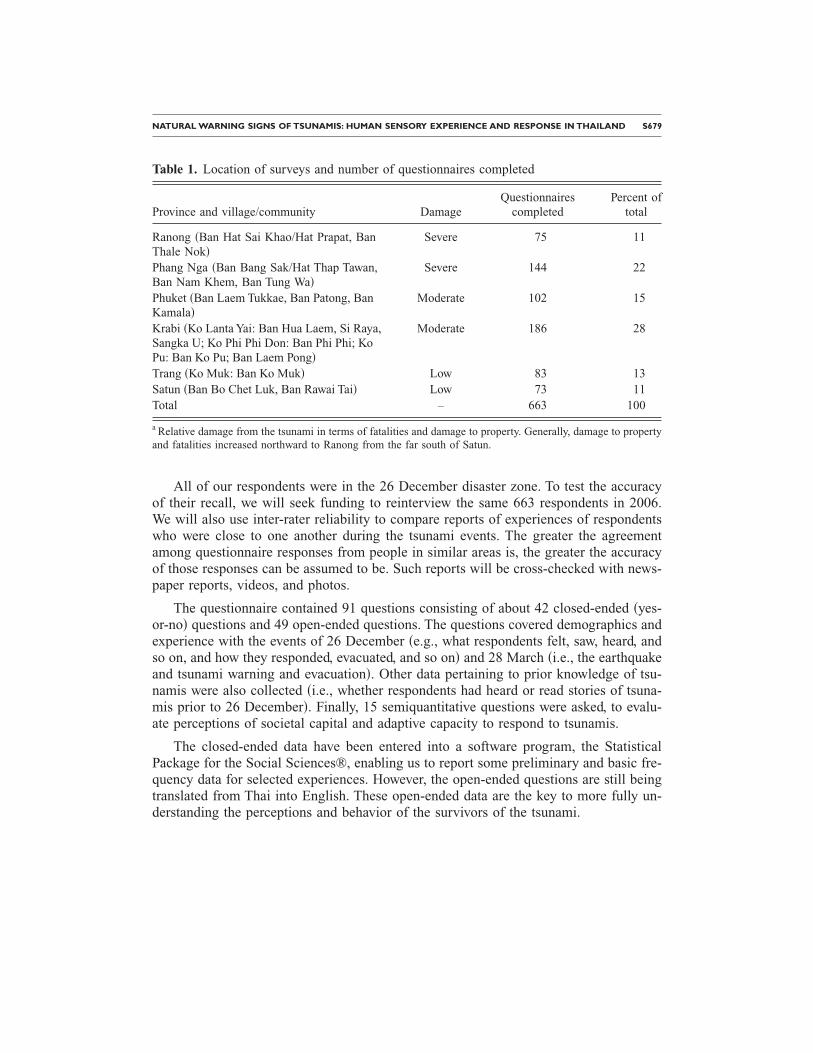
Next, 663 questionnaires were completed during the survey period from 10 April to6 May 2005. Questionnaire responses were obtained via two sampling schemes, a snow-ball approach and convenience sampling. In the former scheme, a community residentwas selected and interviewed and then asked for the names and locations of other resi-dents who were in the disaster zone and who might be able to participate in the study. Inthe latter scheme, people were approached randomly in the survey communities andasked whether they had been in the disaster zone and would like to participate in thestudy. The number of questionnaires completed ranged from 73 in Satun to 186 in Krabi�Table 1�. Only 38 residents refused to participate in the survey or were unable to com-plete the interview.
In order to assess the behavior of people in the danger zone, we asked survivors howmany people they saw in the danger zone and what those people were doing just beforethe waves impacted the shore. We also collected and observed various media for thissame purpose. Such media included photos, video �downloaded from the Internet�, localnewspapers, and other print media.
One question linked to the integrity of the data collected involves the accuracy of therespondents’ memories in April and May, which was several months after their experi-ence in 26 December 2004. While the effects of disaster trauma on human memory areundetermined; it is known that memory accuracy declines with time and after interven-ing events �Neisser and Hyman 1999�. However, a study examining people’s memory asa result of direct experience in the 1989 Loma Prieta, California earthquake, versus in-direct experience via the news media, found that persons with direct experience had vir-tually perfect recall 1.5 years later, as compared with much poorer recall by persons whohad learned of the event via the news in a distant community in the state of Georgia�Neisser et al. 1996�.
NATURAL WARNING SIGNS OF TSUNAMIS: HUMAN SENSORY EXPERIENCE AND RESPONSE IN THAILAND S679
All of our respondents were in the 26 December disaster zone. To test the accuracyof their recall, we will seek funding to reinterview the same 663 respondents in 2006.We will also use inter-rater reliability to compare reports of experiences of respondentswho were close to one another during the tsunami events. The greater the agreementamong questionnaire responses from people in similar areas is, the greater the accuracyof those responses can be assumed to be. Such reports will be cross-checked with news-paper reports, videos, and photos.
The questionnaire contained 91 questions consisting of about 42 closed-ended �yes-or-no� questions and 49 open-ended questions. The questions covered demographics andexperience with the events of 26 December �e.g., what respondents felt, saw, heard, andso on, and how they responded, evacuated, and so on� and 28 March �i.e., the earthquakeand tsunami warning and evacuation�. Other data pertaining to prior knowledge of tsu-namis were also collected �i.e., whether respondents had heard or read stories of tsuna-mis prior to 26 December�. Finally, 15 semiquantitative questions were asked, to evalu-ate perceptions of societal capital and adaptive capacity to respond to tsunamis.
The closed-ended data have been entered into a software program, the StatisticalPackage for the Social Sciences®, enabling us to report some preliminary and basic fre-quency data for selected experiences. However, the open-ended questions are still beingtranslated from Thai into English. These open-ended data are the key to more fully un-derstanding the perceptions and behavior of the survivors of the tsunami.
Table 1. Location of surveys and number of questionnaires completed
Province and village/community DamageQuestionnaires
completedPercent of
total
Ranong �Ban Hat Sai Khao/Hat Prapat, BanThale Nok�
Severe 75 11
Phang Nga �Ban Bang Sak/Hat Thap Tawan,Ban Nam Khem, Ban Tung Wa�
Severe 144 22
Phuket �Ban Laem Tukkae, Ban Patong, BanKamala�
Moderate 102 15
Krabi �Ko Lanta Yai: Ban Hua Laem, Si Raya,Sangka U; Ko Phi Phi Don: Ban Phi Phi; KoPu: Ban Ko Pu; Ban Laem Pong�
Moderate 186 28
Trang �Ko Muk: Ban Ko Muk� Low 83 13Satun �Ban Bo Chet Luk, Ban Rawai Tai� Low 73 11Total – 663 100
a Relative damage from the tsunami in terms of fatalities and damage to property. Generally, damage to propertyand fatalities increased northward to Ranong from the far south of Satun.
S680 C. E. GREGG ET AL.
RESULTS
Demographics
The number of male respondents was slightly higher than the number of female re-spondents �54% male versus 46% female�. The ethnicity of respondents was Thai �86%�,Chao Lay �14%; chao means “people” and lay means “sea”�, and other ��1% �. Themean age of respondents was 42 years �sd=13.6�. Some 51% of respondents were Mus-lims, and 49% were Buddhists. Some 86% of respondents were married, 10% weresingle, and 4% were widowed or divorced. The respondents’ number of children rangedfrom 0 to 12, with a mean of 2.6 �sd=2.1�. Some 16% of respondents had no children,15% had one child, 25% had two children, 19% had three children, and 25% had 4–12children. On the average, respondents had received 5.5 years of schooling �sd=3.7�.
Experience with the 26 December Earthquake
Ground shaking from the 26 December earthquake preceded the arrival of the tsu-nami along Thailand’s Andaman coast by about 2 hours. While the intensity of, and dam-age from, the ground shaking was minor, the earthquake was felt across much of Thai-land. The shaking could have served as a natural warning sign of a tsunami if people hadrecognized it as such, but media reports and our field reconnaissance suggests that theearthquake-tsunami link was not established among the Thai people. The time frame andaccess to warning signs were adequate for all those on the coast to evacuate safely.
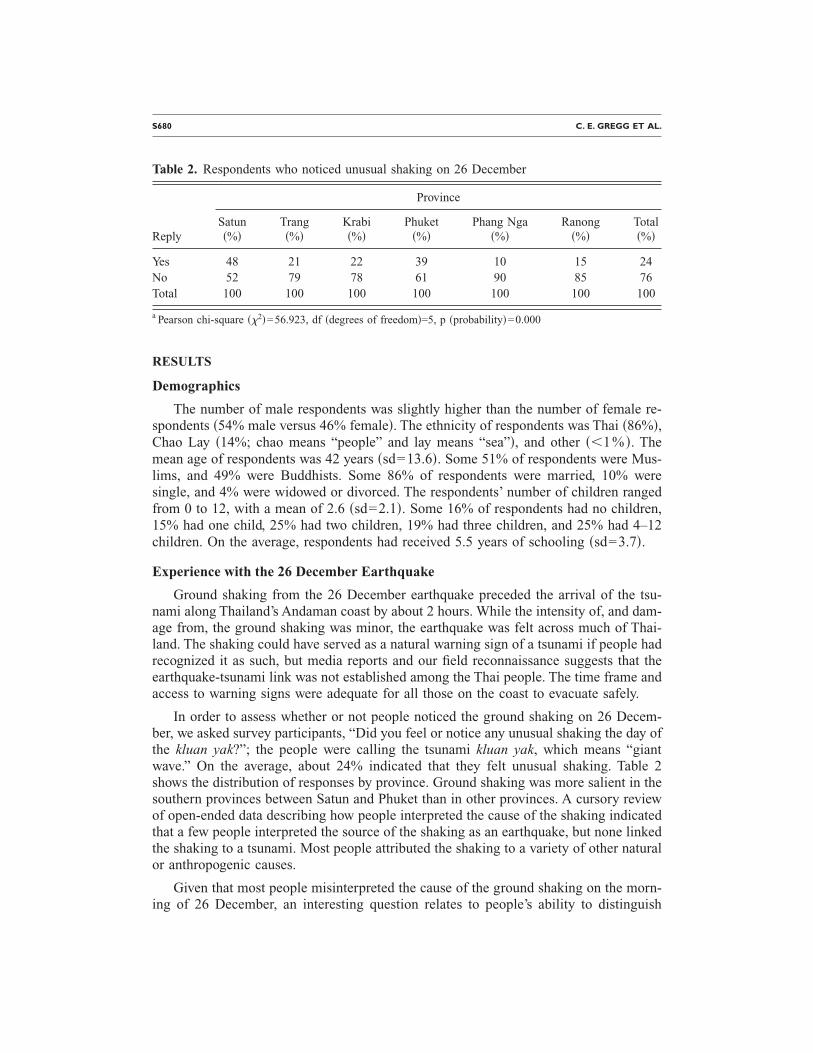
In order to assess whether or not people noticed the ground shaking on 26 Decem-ber, we asked survey participants, “Did you feel or notice any unusual shaking the day ofthe kluan yak?”; the people were calling the tsunami kluan yak, which means “giantwave.” On the average, about 24% indicated that they felt unusual shaking. Table 2shows the distribution of responses by province. Ground shaking was more salient in thesouthern provinces between Satun and Phuket than in other provinces. A cursory reviewof open-ended data describing how people interpreted the cause of the shaking indicatedthat a few people interpreted the source of the shaking as an earthquake, but none linkedthe shaking to a tsunami. Most people attributed the shaking to a variety of other naturalor anthropogenic causes.
Given that most people misinterpreted the cause of the ground shaking on the morn-ing of 26 December, an interesting question relates to people’s ability to distinguish
Table 2. Respondents who noticed unusual shaking on 26 December
Province
ReplySatun�%�
Trang�%�
Krabi�%�
Phuket�%�
Phang Nga�%�
Ranong�%�
Total�%�
Yes 48 21 22 39 10 15 24No 52 79 78 61 90 85 76Total 100 100 100 100 100 100 100
a Pearson chi-square ��2�=56.923, df �degrees of freedom�=5, p �probability�=0.000
NATURAL WARNING SIGNS OF TSUNAMIS: HUMAN SENSORY EXPERIENCE AND RESPONSE IN THAILAND S681
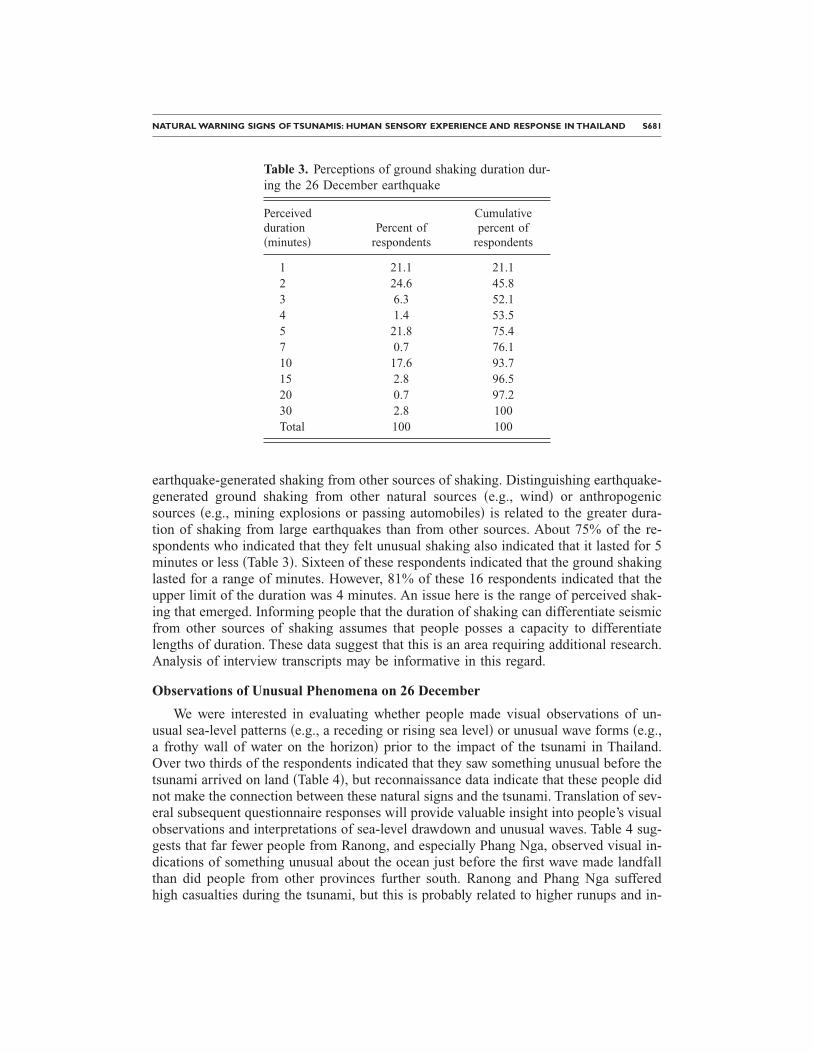
earthquake-generated shaking from other sources of shaking. Distinguishing earthquake-generated ground shaking from other natural sources �e.g., wind� or anthropogenicsources �e.g., mining explosions or passing automobiles� is related to the greater dura-tion of shaking from large earthquakes than from other sources. About 75% of the re-spondents who indicated that they felt unusual shaking also indicated that it lasted for 5minutes or less �Table 3�. Sixteen of these respondents indicated that the ground shakinglasted for a range of minutes. However, 81% of these 16 respondents indicated that theupper limit of the duration was 4 minutes. An issue here is the range of perceived shak-ing that emerged. Informing people that the duration of shaking can differentiate seismicfrom other sources of shaking assumes that people posses a capacity to differentiatelengths of duration. These data suggest that this is an area requiring additional research.Analysis of interview transcripts may be informative in this regard.
Observations of Unusual Phenomena on 26 December
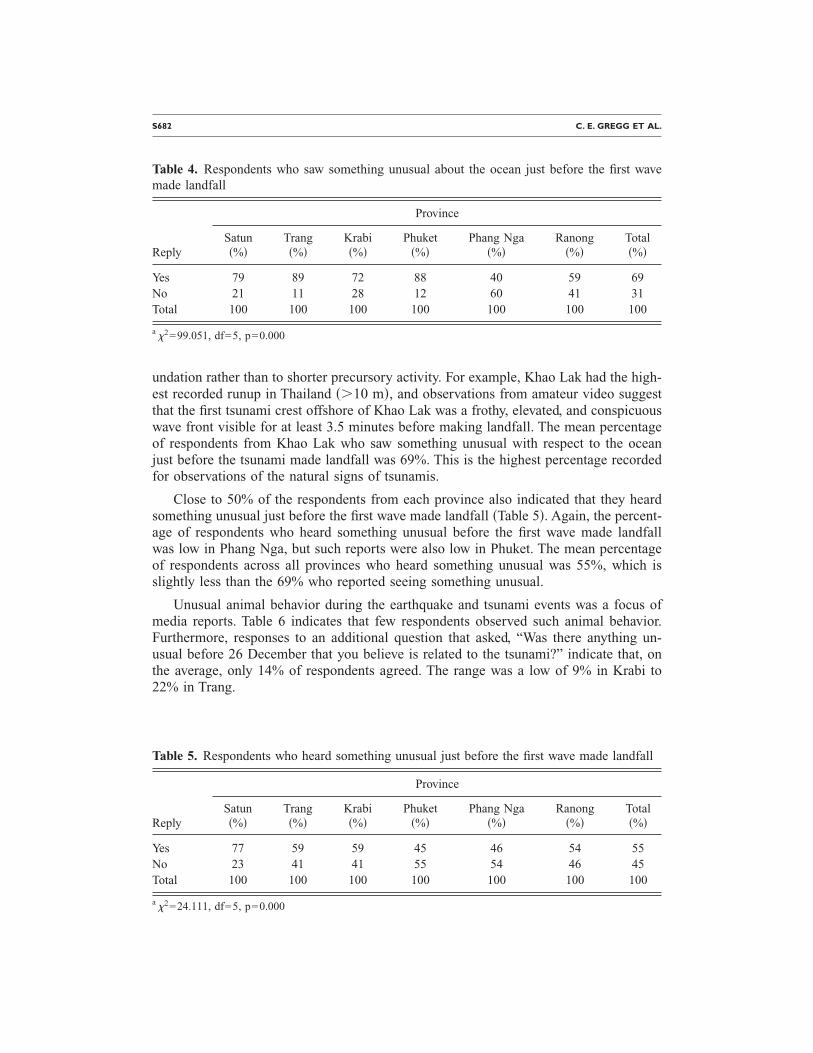
We were interested in evaluating whether people made visual observations of un-usual sea-level patterns �e.g., a receding or rising sea level� or unusual wave forms �e.g.,a frothy wall of water on the horizon� prior to the impact of the tsunami in Thailand.Over two thirds of the respondents indicated that they saw something unusual before thetsunami arrived on land �Table 4�, but reconnaissance data indicate that these people didnot make the connection between these natural signs and the tsunami. Translation of sev-eral subsequent questionnaire responses will provide valuable insight into people’s visualobservations and interpretations of sea-level drawdown and unusual waves. Table 4 sug-gests that far fewer people from Ranong, and especially Phang Nga, observed visual in-dications of something unusual about the ocean just before the first wave made landfallthan did people from other provinces further south. Ranong and Phang Nga sufferedhigh casualties during the tsunami, but this is probably related to higher runups and in-
Table 3. Perceptions of ground shaking duration dur-ing the 26 December earthquake
Perceivedduration�minutes�
Percent ofrespondents
Cumulativepercent of
respondents
1 21.1 21.12 24.6 45.83 6.3 52.14 1.4 53.55 21.8 75.47 0.7 76.110 17.6 93.715 2.8 96.520 0.7 97.230 2.8 100Total 100 100
S682 C. E. GREGG ET AL.
undation rather than to shorter precursory activity. For example, Khao Lak had the high-est recorded runup in Thailand ��10 m�, and observations from amateur video suggestthat the first tsunami crest offshore of Khao Lak was a frothy, elevated, and conspicuouswave front visible for at least 3.5 minutes before making landfall. The mean percentageof respondents from Khao Lak who saw something unusual with respect to the oceanjust before the tsunami made landfall was 69%. This is the highest percentage recordedfor observations of the natural signs of tsunamis.
Close to 50% of the respondents from each province also indicated that they heardsomething unusual just before the first wave made landfall �Table 5�. Again, the percent-age of respondents who heard something unusual before the first wave made landfallwas low in Phang Nga, but such reports were also low in Phuket. The mean percentageof respondents across all provinces who heard something unusual was 55%, which isslightly less than the 69% who reported seeing something unusual.
Unusual animal behavior during the earthquake and tsunami events was a focus ofmedia reports. Table 6 indicates that few respondents observed such animal behavior.Furthermore, responses to an additional question that asked, “Was there anything un-usual before 26 December that you believe is related to the tsunami?” indicate that, onthe average, only 14% of respondents agreed. The range was a low of 9% in Krabi to22% in Trang.
Table 4. Respondents who saw something unusual about the ocean just before the first wavemade landfall
Province
ReplySatun�%�
Trang�%�
Krabi�%�
Phuket�%�
Phang Nga�%�
Ranong�%�
Total�%�
Yes 79 89 72 88 40 59 69No 21 11 28 12 60 41 31Total 100 100 100 100 100 100 100
a �2=99.051, df=5, p=0.000
Table 5. Respondents who heard something unusual just before the first wave made landfall
Province
ReplySatun�%�
Trang�%�
Krabi�%�
Phuket�%�
Phang Nga�%�
Ranong�%�
Total�%�
Yes 77 59 59 45 46 54 55No 23 41 41 55 54 46 45Total 100 100 100 100 100 100 100
a 2
� =24.111, df=5, p=0.000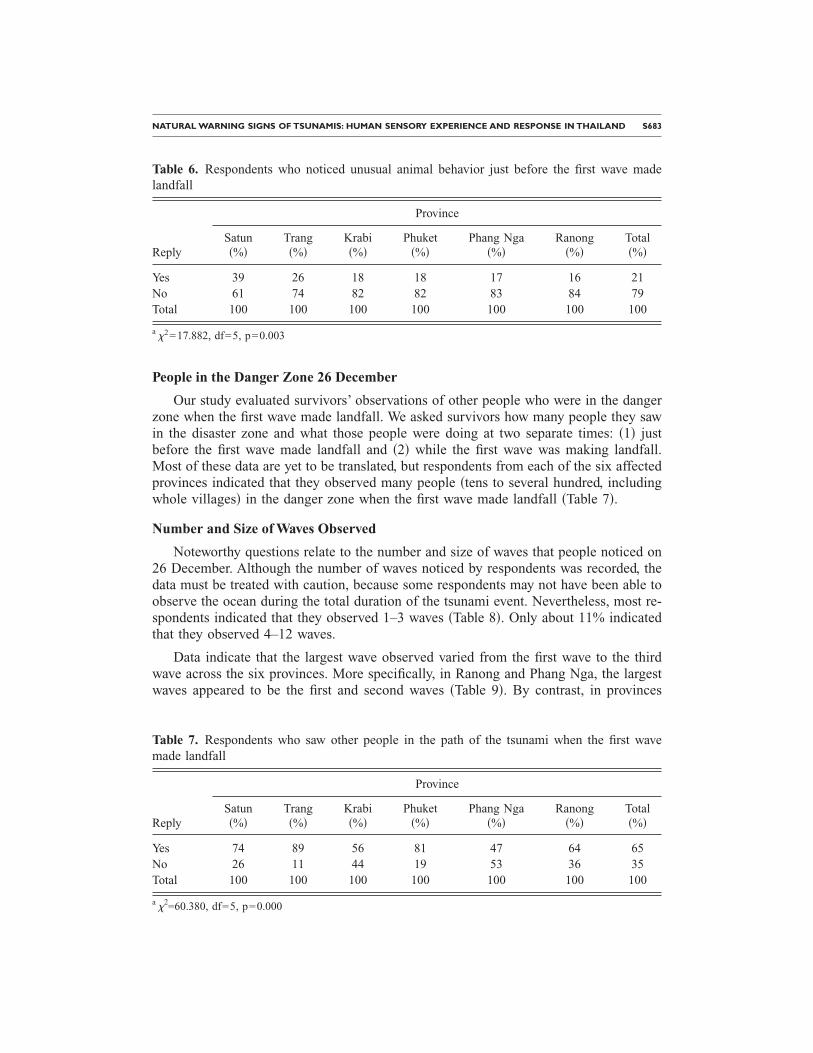
NATURAL WARNING SIGNS OF TSUNAMIS: HUMAN SENSORY EXPERIENCE AND RESPONSE IN THAILAND S683
People in the Danger Zone 26 December
Our study evaluated survivors’ observations of other people who were in the dangerzone when the first wave made landfall. We asked survivors how many people they sawin the disaster zone and what those people were doing at two separate times: �1� justbefore the first wave made landfall and �2� while the first wave was making landfall.Most of these data are yet to be translated, but respondents from each of the six affectedprovinces indicated that they observed many people �tens to several hundred, includingwhole villages� in the danger zone when the first wave made landfall �Table 7�.
Number and Size of Waves Observed
Noteworthy questions relate to the number and size of waves that people noticed on26 December. Although the number of waves noticed by respondents was recorded, thedata must be treated with caution, because some respondents may not have been able toobserve the ocean during the total duration of the tsunami event. Nevertheless, most re-spondents indicated that they observed 1–3 waves �Table 8�. Only about 11% indicatedthat they observed 4–12 waves.
Data indicate that the largest wave observed varied from the first wave to the thirdwave across the six provinces. More specifically, in Ranong and Phang Nga, the largestwaves appeared to be the first and second waves �Table 9�. By contrast, in provinces
Table 6. Respondents who noticed unusual animal behavior just before the first wave madelandfall
Province
ReplySatun�%�
Trang�%�
Krabi�%�
Phuket�%�
Phang Nga�%�
Ranong�%�
Total�%�
Yes 39 26 18 18 17 16 21No 61 74 82 82 83 84 79Total 100 100 100 100 100 100 100
a �2=17.882, df=5, p=0.003
Table 7. Respondents who saw other people in the path of the tsunami when the first wavemade landfall
Province
ReplySatun�%�
Trang�%�
Krabi�%�
Phuket�%�
Phang Nga�%�
Ranong�%�
Total�%�
Yes 74 89 56 81 47 64 65No 26 11 44 19 53 36 35Total 100 100 100 100 100 100 100
a 2
� =60.380, df=5, p=0.000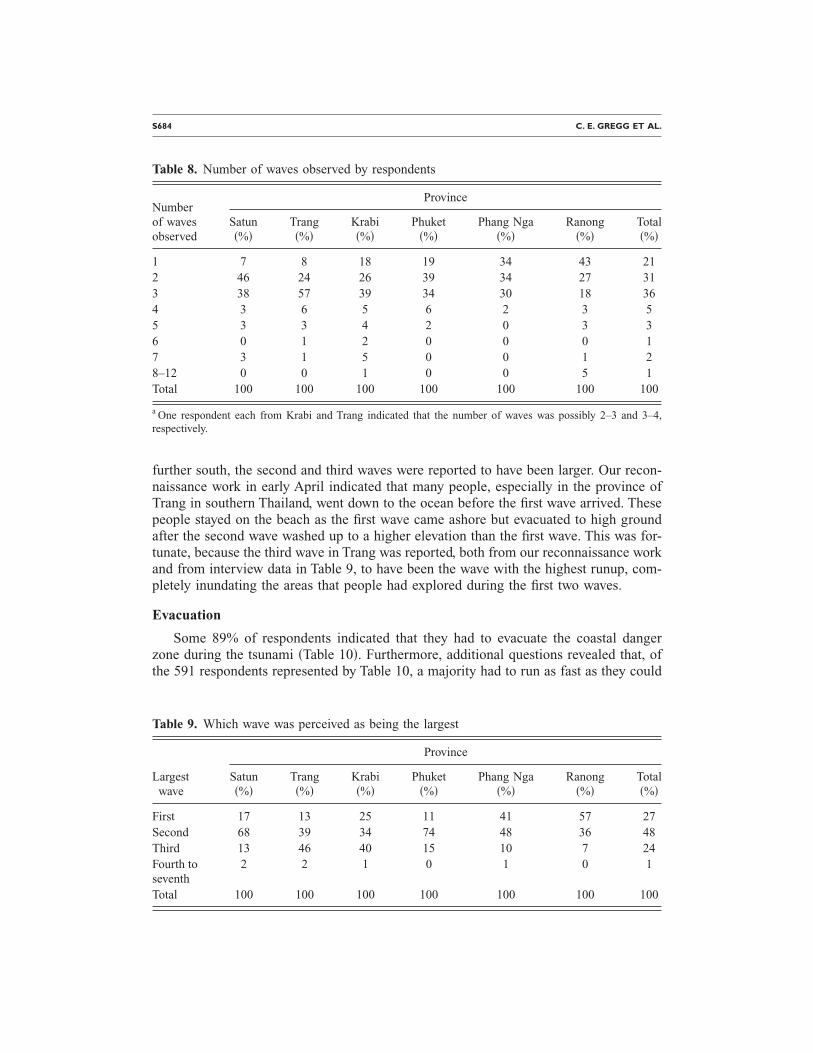
S684 C. E. GREGG ET AL.
further south, the second and third waves were reported to have been larger. Our recon-naissance work in early April indicated that many people, especially in the province ofTrang in southern Thailand, went down to the ocean before the first wave arrived. Thesepeople stayed on the beach as the first wave came ashore but evacuated to high groundafter the second wave washed up to a higher elevation than the first wave. This was for-tunate, because the third wave in Trang was reported, both from our reconnaissance workand from interview data in Table 9, to have been the wave with the highest runup, com-pletely inundating the areas that people had explored during the first two waves.
Evacuation
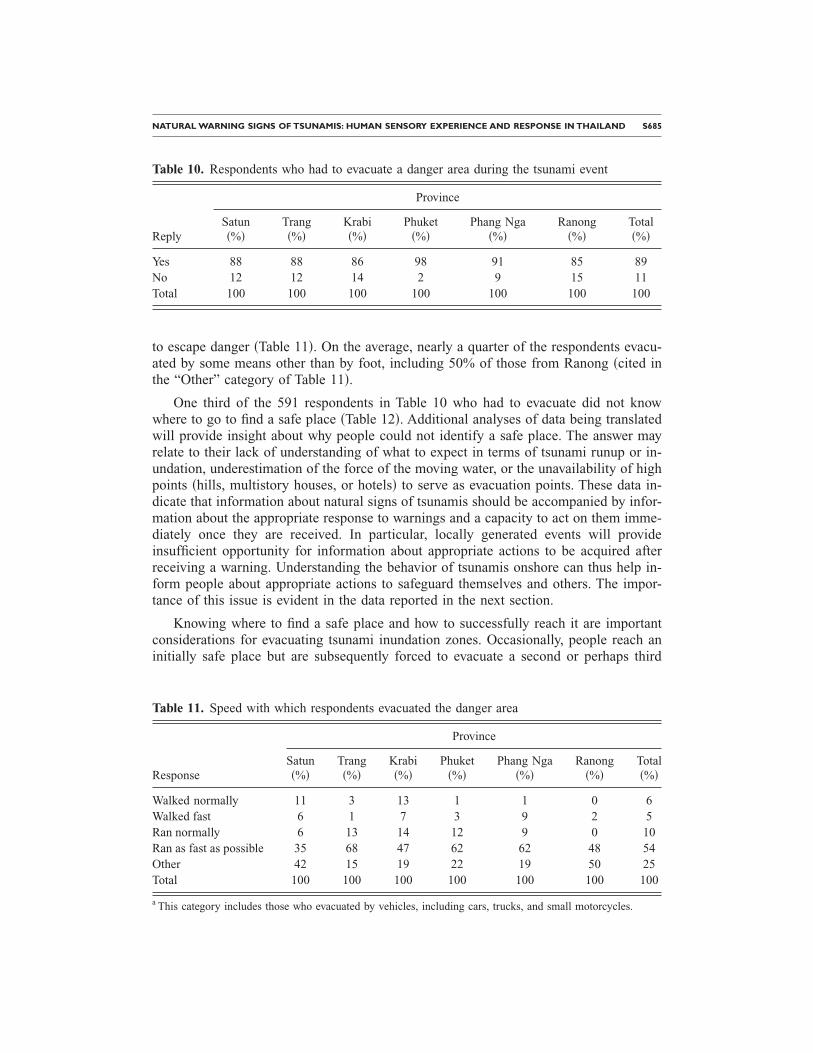
Some 89% of respondents indicated that they had to evacuate the coastal dangerzone during the tsunami �Table 10�. Furthermore, additional questions revealed that, ofthe 591 respondents represented by Table 10, a majority had to run as fast as they could
Table 8. Number of waves observed by respondents
Numberof wavesobserved
Province
Satun�%�
Trang�%�
Krabi�%�
Phuket�%�
Phang Nga�%�
Ranong�%�
Total�%�
1 7 8 18 19 34 43 212 46 24 26 39 34 27 313 38 57 39 34 30 18 364 3 6 5 6 2 3 55 3 3 4 2 0 3 36 0 1 2 0 0 0 17 3 1 5 0 0 1 28–12 0 0 1 0 0 5 1Total 100 100 100 100 100 100 100
a One respondent each from Krabi and Trang indicated that the number of waves was possibly 2–3 and 3–4,respectively.
Table 9. Which wave was perceived as being the largest
Province
Largestwave
Satun�%�
Trang�%�
Krabi�%�
Phuket�%�
Phang Nga�%�
Ranong�%�
Total�%�
First 17 13 25 11 41 57 27Second 68 39 34 74 48 36 48Third 13 46 40 15 10 7 24Fourth toseventh
2 2 1 0 1 0 1
Total 100 100 100 100 100 100 100
NATURAL WARNING SIGNS OF TSUNAMIS: HUMAN SENSORY EXPERIENCE AND RESPONSE IN THAILAND S685
to escape danger �Table 11�. On the average, nearly a quarter of the respondents evacu-ated by some means other than by foot, including 50% of those from Ranong �cited inthe “Other” category of Table 11�.
One third of the 591 respondents in Table 10 who had to evacuate did not knowwhere to go to find a safe place �Table 12�. Additional analyses of data being translatedwill provide insight about why people could not identify a safe place. The answer mayrelate to their lack of understanding of what to expect in terms of tsunami runup or in-undation, underestimation of the force of the moving water, or the unavailability of highpoints �hills, multistory houses, or hotels� to serve as evacuation points. These data in-dicate that information about natural signs of tsunamis should be accompanied by infor-mation about the appropriate response to warnings and a capacity to act on them imme-diately once they are received. In particular, locally generated events will provideinsufficient opportunity for information about appropriate actions to be acquired afterreceiving a warning. Understanding the behavior of tsunamis onshore can thus help in-form people about appropriate actions to safeguard themselves and others. The impor-tance of this issue is evident in the data reported in the next section.
Knowing where to find a safe place and how to successfully reach it are importantconsiderations for evacuating tsunami inundation zones. Occasionally, people reach aninitially safe place but are subsequently forced to evacuate a second or perhaps third
Table 10. Respondents who had to evacuate a danger area during the tsunami event
Province
ReplySatun�%�
Trang�%�
Krabi�%�
Phuket�%�
Phang Nga�%�
Ranong�%�
Total�%�
Yes 88 88 86 98 91 85 89No 12 12 14 2 9 15 11Total 100 100 100 100 100 100 100
Table 11. Speed with which respondents evacuated the danger area
Province
ResponseSatun�%�
Trang�%�
Krabi�%�
Phuket�%�
Phang Nga�%�
Ranong�%�
Total�%�
Walked normally 11 3 13 1 1 0 6Walked fast 6 1 7 3 9 2 5Ran normally 6 13 14 12 9 0 10Ran as fast as possible 35 68 47 62 62 48 54Other 42 15 19 22 19 50 25Total 100 100 100 100 100 100 100
a
This category includes those who evacuated by vehicles, including cars, trucks, and small motorcycles.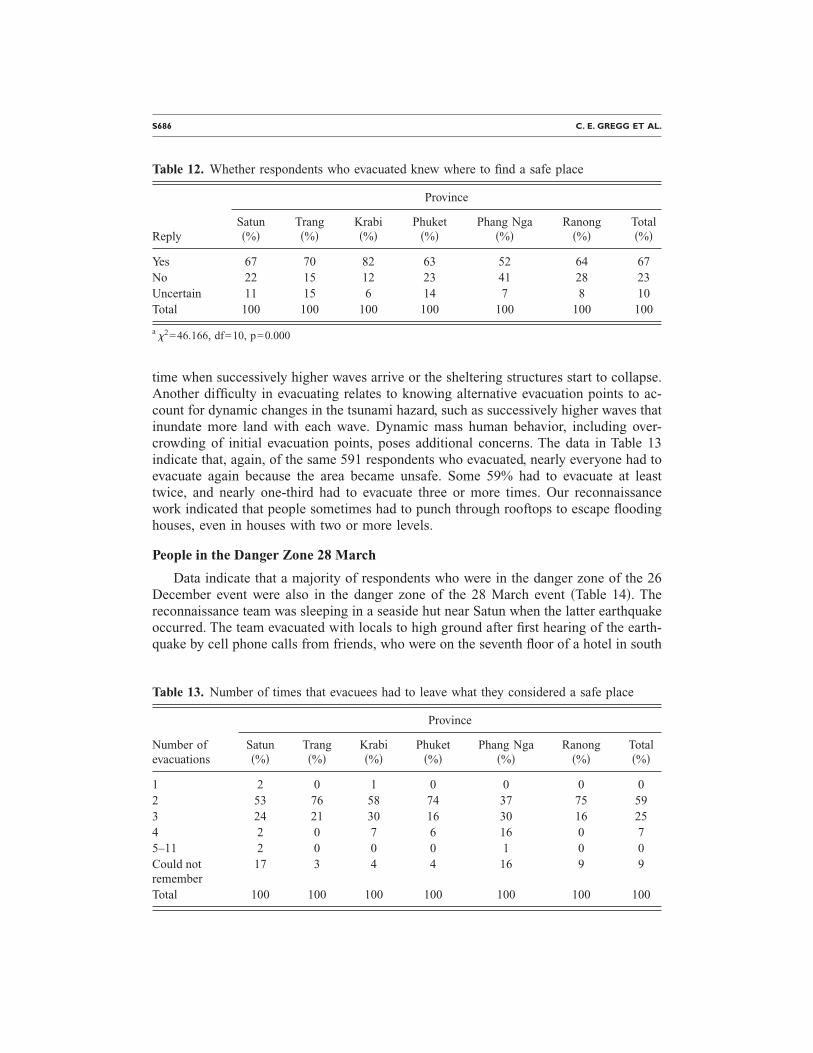
S686 C. E. GREGG ET AL.
time when successively higher waves arrive or the sheltering structures start to collapse.Another difficulty in evacuating relates to knowing alternative evacuation points to ac-count for dynamic changes in the tsunami hazard, such as successively higher waves thatinundate more land with each wave. Dynamic mass human behavior, including over-crowding of initial evacuation points, poses additional concerns. The data in Table 13indicate that, again, of the same 591 respondents who evacuated, nearly everyone had toevacuate again because the area became unsafe. Some 59% had to evacuate at leasttwice, and nearly one-third had to evacuate three or more times. Our reconnaissancework indicated that people sometimes had to punch through rooftops to escape floodinghouses, even in houses with two or more levels.
People in the Danger Zone 28 March
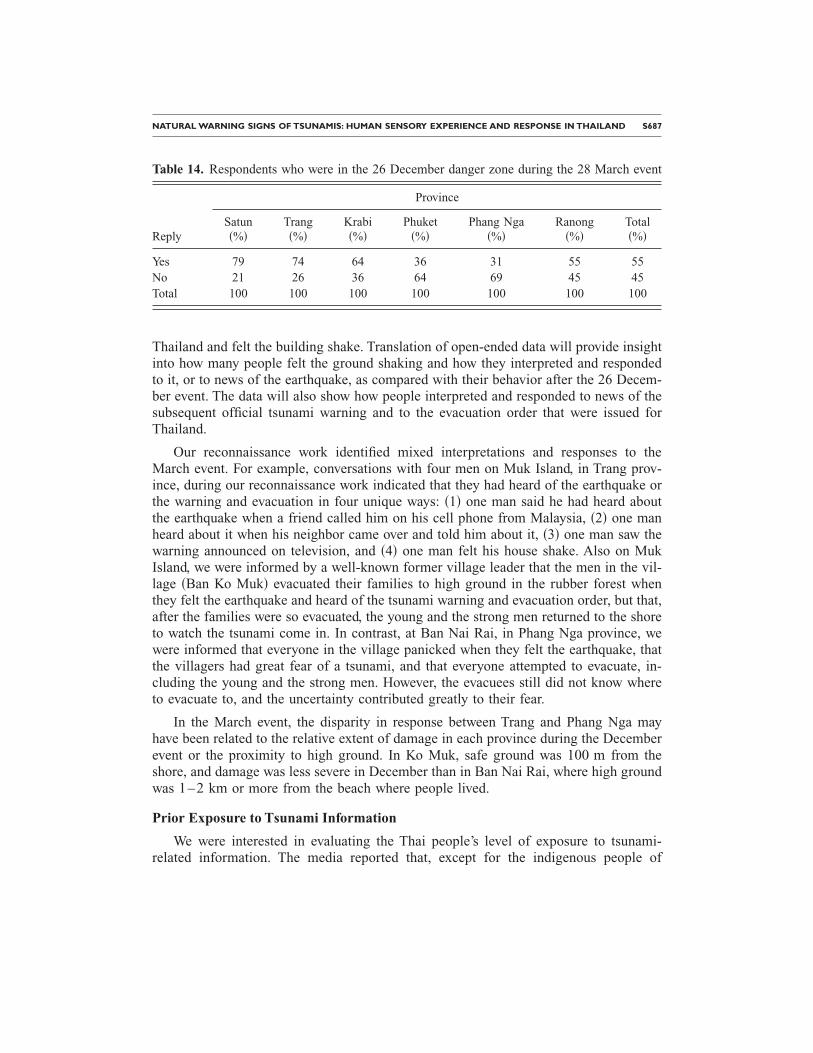
Data indicate that a majority of respondents who were in the danger zone of the 26December event were also in the danger zone of the 28 March event �Table 14�. Thereconnaissance team was sleeping in a seaside hut near Satun when the latter earthquakeoccurred. The team evacuated with locals to high ground after first hearing of the earth-quake by cell phone calls from friends, who were on the seventh floor of a hotel in south
Table 12. Whether respondents who evacuated knew where to find a safe place
Province
ReplySatun�%�
Trang�%�
Krabi�%�
Phuket�%�
Phang Nga�%�
Ranong�%�
Total�%�
Yes 67 70 82 63 52 64 67No 22 15 12 23 41 28 23Uncertain 11 15 6 14 7 8 10Total 100 100 100 100 100 100 100
a �2=46.166, df=10, p=0.000
Table 13. Number of times that evacuees had to leave what they considered a safe place
Province
Number ofevacuations
Satun�%�
Trang�%�
Krabi�%�
Phuket�%�
Phang Nga�%�
Ranong�%�
Total�%�
1 2 0 1 0 0 0 02 53 76 58 74 37 75 593 24 21 30 16 30 16 254 2 0 7 6 16 0 75–11 2 0 0 0 1 0 0Could notremember
17 3 4 4 16 9 9
Total 100 100 100 100 100 100 100
NATURAL WARNING SIGNS OF TSUNAMIS: HUMAN SENSORY EXPERIENCE AND RESPONSE IN THAILAND S687
Thailand and felt the building shake. Translation of open-ended data will provide insightinto how many people felt the ground shaking and how they interpreted and respondedto it, or to news of the earthquake, as compared with their behavior after the 26 Decem-ber event. The data will also show how people interpreted and responded to news of thesubsequent official tsunami warning and to the evacuation order that were issued forThailand.
Our reconnaissance work identified mixed interpretations and responses to theMarch event. For example, conversations with four men on Muk Island, in Trang prov-ince, during our reconnaissance work indicated that they had heard of the earthquake orthe warning and evacuation in four unique ways: �1� one man said he had heard aboutthe earthquake when a friend called him on his cell phone from Malaysia, �2� one manheard about it when his neighbor came over and told him about it, �3� one man saw thewarning announced on television, and �4� one man felt his house shake. Also on MukIsland, we were informed by a well-known former village leader that the men in the vil-lage �Ban Ko Muk� evacuated their families to high ground in the rubber forest whenthey felt the earthquake and heard of the tsunami warning and evacuation order, but that,after the families were so evacuated, the young and the strong men returned to the shoreto watch the tsunami come in. In contrast, at Ban Nai Rai, in Phang Nga province, wewere informed that everyone in the village panicked when they felt the earthquake, thatthe villagers had great fear of a tsunami, and that everyone attempted to evacuate, in-cluding the young and the strong men. However, the evacuees still did not know whereto evacuate to, and the uncertainty contributed greatly to their fear.
In the March event, the disparity in response between Trang and Phang Nga mayhave been related to the relative extent of damage in each province during the Decemberevent or the proximity to high ground. In Ko Muk, safe ground was 100 m from theshore, and damage was less severe in December than in Ban Nai Rai, where high groundwas 1–2 km or more from the beach where people lived.
Prior Exposure to Tsunami Information
We were interested in evaluating the Thai people’s level of exposure to tsunami-related information. The media reported that, except for the indigenous people of
Table 14. Respondents who were in the 26 December danger zone during the 28 March event
Province
ReplySatun�%�
Trang�%�
Krabi�%�
Phuket�%�
Phang Nga�%�
Ranong�%�
Total�%�
Yes 79 74 64 36 31 55 55No 21 26 36 64 69 45 45Total 100 100 100 100 100 100 100
S688 C. E. GREGG ET AL.
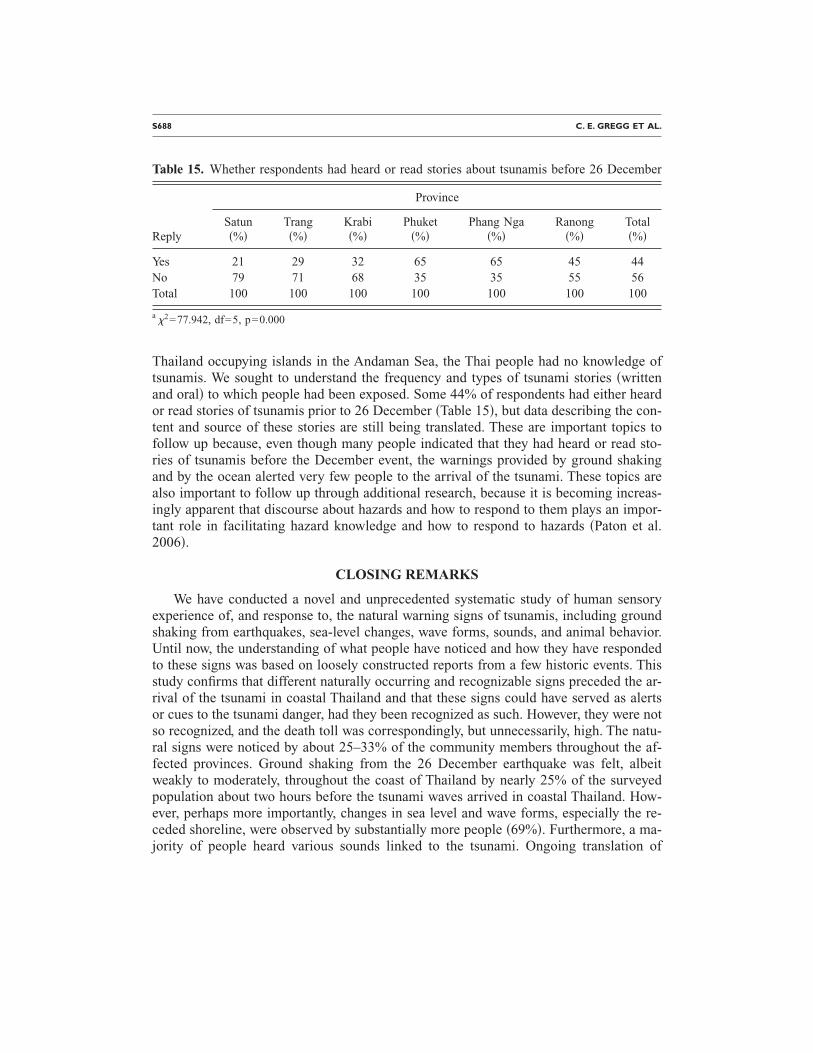
Thailand occupying islands in the Andaman Sea, the Thai people had no knowledge oftsunamis. We sought to understand the frequency and types of tsunami stories �writtenand oral� to which people had been exposed. Some 44% of respondents had either heardor read stories of tsunamis prior to 26 December �Table 15�, but data describing the con-tent and source of these stories are still being translated. These are important topics tofollow up because, even though many people indicated that they had heard or read sto-ries of tsunamis before the December event, the warnings provided by ground shakingand by the ocean alerted very few people to the arrival of the tsunami. These topics arealso important to follow up through additional research, because it is becoming increas-ingly apparent that discourse about hazards and how to respond to them plays an impor-tant role in facilitating hazard knowledge and how to respond to hazards �Paton et al.2006�.
CLOSING REMARKS
We have conducted a novel and unprecedented systematic study of human sensoryexperience of, and response to, the natural warning signs of tsunamis, including groundshaking from earthquakes, sea-level changes, wave forms, sounds, and animal behavior.Until now, the understanding of what people have noticed and how they have respondedto these signs was based on loosely constructed reports from a few historic events. Thisstudy confirms that different naturally occurring and recognizable signs preceded the ar-rival of the tsunami in coastal Thailand and that these signs could have served as alertsor cues to the tsunami danger, had they been recognized as such. However, they were notso recognized, and the death toll was correspondingly, but unnecessarily, high. The natu-ral signs were noticed by about 25–33% of the community members throughout the af-fected provinces. Ground shaking from the 26 December earthquake was felt, albeitweakly to moderately, throughout the coast of Thailand by nearly 25% of the surveyedpopulation about two hours before the tsunami waves arrived in coastal Thailand. How-ever, perhaps more importantly, changes in sea level and wave forms, especially the re-ceded shoreline, were observed by substantially more people �69%�. Furthermore, a ma-jority of people heard various sounds linked to the tsunami. Ongoing translation of
Table 15. Whether respondents had heard or read stories about tsunamis before 26 December
Province
ReplySatun�%�
Trang�%�
Krabi�%�
Phuket�%�
Phang Nga�%�
Ranong�%�
Total�%�
Yes 21 29 32 65 65 45 44No 79 71 68 35 35 55 56Total 100 100 100 100 100 100 100
a �2=77.942, df=5, p=0.000
NATURAL WARNING SIGNS OF TSUNAMIS: HUMAN SENSORY EXPERIENCE AND RESPONSE IN THAILAND S689
open-ended data will shed more light on how people interpreted and responded to thesephenomena.
Many people did not recognize a safe area that they could evacuate to and thereforewere at increased risk from the tsunami when they were forced to leave inundated areas.The reasons for their inability to locate a safe place are not clear but may include a lackof understanding of the force of tsunamis in coastal areas, a lack of awareness of thelikely runup and inundation waves, or the absence of nearby areas of high ground. Peo-ple’s difficulty in initially identifying a safe place to evacuate is underscored by the find-ing that some 79% of the total population surveyed had to evacuate multiple times toreach a safe area, which perhaps hints at poor initial judgment about safe areas, or sim-ply the fact that tsunamis are complex and dynamic and that the first wave to arrive maynot be the biggest wave. Indeed, the second and third waves were reported to be the larg-est waves in many areas. These findings underscore a need for development of scrupu-lous tsunami evacuation plans and should be echoed in educational outreach about howto select evacuation points for oneself.
These data, surprisingly, suggest that tsunamis were more widely known throughoutthe Andaman coast than what has been assumed by the media and by officials, albeitthrough stories of tsunamis rather than personal experience with real events. People mayhave been aware of tsunamis through exposure to information prior to 26 December, butthere was a distinct disconnect between this reported awareness and their actions as aresult of exposure to natural warning signs of the 26 December tsunami. Understandingthe history of how tsunami information has been translated from generation to genera-tion in Thailand and elsewhere �i.e., traditional knowledge� may be an important con-sideration for the formation of effective risk communication messages.
These data highlight the important role that information about hazard characteristicsshould play in risk reduction strategies, including, but not limited to, settlement of areaswithin tsunami inundation zones and evacuation plans. However, such strategies must bedeveloped in ways that integrate them within the contexts of the communities at risk.Knowledge of how people perceive, interpret, respond to, and use physical science datais important to ensure that such data can be used in the manner intended within a sus-tainable warning and response process. Consequently, it will be necessary for physicalscientists, social scientists, and emergency management agencies to work together inways that include their active engagement with the communities that are susceptible tohazard impacts.
These data will be refined, pending their use in analyses involving the open-endeddata that are currently being translated. This task involves nearly 7,000 pages of inter-view data. We appreciate any correspondence about how the data may be of use in mod-els of land use planning and evacuation, hazard, and risk maps. The data will eventuallybe publicly available through the San Diego Supercomputer Center as part of a projectfunded by the National Science Foundation �NSF� to provide a long-term repository ofdata collected about this unprecedented human catastrophe.
S690 C. E. GREGG ET AL.
ACKNOWLEDGMENTS
Funding for this project was provided by the NSF Human and Social Dynamics Pro-gram #0522301. We extend a special thanks to Somyos Tolang for his support as a com-munity facilitator during our reconnaissance in Thailand and the six field researchers�Winid Chum-nurak, Kittikom Songaiet, Sutheeda Pangdeega, Ratchada Boonkaew,Ganha Sriyong, and Saengsom Harntalee� for their assistance with data collection. Fi-nally, we thank the many village leaders who supported our research in their villages.
REFERENCES
BBC News, 2005. Award for tsunami warning pupil. http://news.bbc.co.uk/1/hi/uk/4229392.stm
Darienzo, M., Aya, A., Crawford, G., Gibbs, D., Whitmore, P., Wilde, T., and Yanagi, B., 2005.Local tsunami warning in the Pacific coastal United States, Natural Hazards 35 �1�, 111–119.
Dudley, W. C., and Lee, M., 1998. Tsunami! University of Hawaii Press, Honolulu, HI, 362 pp.
Gonzalez, F., 1999. Tsunami! Scientific American. http://www.sciam.com/print_version.cfm?articleID=000B6F41-8BC1-1C71-9EB7809EC588F2D7
Gregg, C. E., 2005. Natural Hazards in Hawaii: Some Studies of Awareness, Risk Perceptionand Preparedness, Ph.D. thesis, University of Hawaii, Honolulu, HI, 267 pp.
Gregg, C. E., Houghton, B. F., Paton, D., Johnston, D. M., Swanson, D. A., and Yanagi, B.,2006. Tsunami warnings: Understanding in Hawaii, Natural Hazards �in press�.
Lachman, R., Tatsuoka, M., and Bonk, W. J., 1961. Human behavior during the tsunami of May23, 1960, Science 133 �3462�, 1405–1409.
Lander, J. F., and Lockridge, P. A., 1989. United States Tsunamis �Including United States Pos-sessions� 1690–1988. U.S. Department of Commerce, NOAA, National Environmental Sat-ellite, Data and Information Service, Boulder, CO, 265 pp.
Lay, T., Kanamori, H., Ammon, C. J., Nettles, M., Ward, N. S., Aster, R. C., Beck, S. L., Bilek,S. L., Brudzinski, M. R., Butler, R., DeShon, H. R., Ekstrom, G., Satake, K., and Sipkin, S.,2005. The Great Sumatra-Andaman earthquake of 26 December 2004, Science 308, 1127–1133.
Marx, J., 2005. Tracking myth to geological reality, Science 310 �5749�, 762–765.
Mileti, D. S., and O’Brien, P. W., 1992. Warnings during disaster: Normalizing communicatedrisk, Soc. Probl. 39 �1�, 40–57.
Miller, G., 2005. The tsunami’s psychological aftermath, Science 309 �5737�, 1030–1033.
Neisser, U., and Hyman, I. �eds.�, 1999. Memory Observed: Remembering in Natural Contexts,2nd edition, W. H. Freeman and Co., New York, NY.
Neisser, U., Winograd, E., and Bergman, E. T., 1996. Remembering the earthquake: Direct ex-perience vs. hearing the news, Memory 4 �4�, 337–357.
Oberle, M., 2005. Tsunami, December 26, 2004 at Patong Beach, Phuket, Thailand: Personalnotes from Mark Oberle. http://faculty.washington.edu/moberle/Tsunami/Tsunami.htm
Paton, D., McClure, J., and Bürgelt, P. T., 2006. Natural hazard resilience: The role of individualand household preparedness, in Johnston, D.P.D., �ed.�, Disaster Resilience: An IntegratedApproach, Charles C. Thomas, Springfield, IL.
NATURAL WARNING SIGNS OF TSUNAMIS: HUMAN SENSORY EXPERIENCE AND RESPONSE IN THAILAND S691
Shuto, N., 1997. A natural warning of tsunami arrival, in Hebenstreit, G., �ed.�, Perspectives onTsunami Hazard Reduction, Kluwer Academic Publishers, Dordrecht, The Netherlands, pp.157–173.
UC Berkeley and East-West Center, 2005. After the Tsunami: Human Rights of VulnerablePopulations, UC Berkeley Human Rights Center, Berkeley, CA, p. 109.
U.S. Geological Survey �USGS�, 2005. 154 miles S. of Banda Aceh, Sumatra, Indonesia. Com-munity Internet Intensity Map. http://pasadena.wr.usgs.gov/shake/ous/STORE/Xslav_04/ciim_display.html
�Received 10 October 2005; accepted 24 April 2006�