Embed Size (px)
Citation preview
NATURAL VENTILATION ANALYSES OF AN OFFICE BUILDING WITH OPEN ATRIUM
1 2 3 4 5 6 7 8 9
10 11
Mohit Mehta
Arizona State University Elements / BNIM Architects 106 W 14th Street, Suite 200
Kansas City, MO 64105 E-mail: [email protected]
ABSTRACT
This paper is part of a larger research to ‘theoretically’ review the application of natural ventilation to commercial buildings, the potential advantages these systems offer, and some pitfalls that must be considered. Physical design strategies and the analytical methods developed to support them have been reviewed, and then a modeling study of a representative naturally ventilated building recently constructed in the Netherlands is presented.
A multizone coupled thermal (EnergyPlus)/airflow (COMIS 3.0) simulation tool is tested while being used to investigate the performance of this building in a North American climate. This paper describes the process I have followed to explore the practicality/effectiveness of the tool as well as the building and my related findings. In the hope that this tool be used more often for whole-building analysis, with greater ease and quickness than the more complicated, expensive and difficult to master CFD tools. Such a study is a step that would enable designers and clients to select the passive ventilation strategy in suitable North American climates.
INTRODUCTION History
COMIS 3.0 is a network-based multi-zone airflow model developed by a multinational team in the framework of International Energy Agency’s Annex 23 for simulating airflows through the building fabric due to infiltration or natural ventilation, and from zone to zone, as well as the interactions of the HVAC system, ducts, and exhaust hoods and fans. EnergyPlus (Crawley et al., 2001) is a new whole-building energy simulation program being developed for the United States Department of Energy that combines the best features of the DOE-2 and IBLAST programs. The EnergyPlus program is modular in structure, and uses the heat balance technique to simulate building thermal loads. The EnergyPlus program calls COMIS from the Air Heat Balance Manager module and passes to COMIS the ambient weather conditions and zone air
temperatures from the previous time step. COMIS uses these as boundary conditions to calculate the airflows, which are used by EnergyPlus in the subsequent heat balance simulation (Huang et al., 1999). The inputs needed for COMIS are the flow coefficients (Cs) and exponents for cracks and closed windows and doors, the height and width of opened windows and doors, the physical dimensions of the building zones and their linkages to each other and the outside, the pressure coefficients (Cp) on the exterior facades, and the ambient air temperature, wind speed and direction, humidity, and barometric pressure.
Scope
This study will be limited to a certain selected segment of the Tax Office Building (Fig. 1) at Enschede (Perera et al., 1998) completed recently in the Netherlands, which was chosen because of its ‘typicality’ to buildings that incorporate the natural or hybrid ventilation schemes. A state-of-the-art low-energy commercial building, even though European, is similar in plan to many mid-sized U.S. commercial buildings.
Methodology
Owing to unavailability of real time measured data the building has been modeled and compared using data published in the BRE, NatVent CD-Rom (1999, Building Research Establishment) and an earlier published NIST report (Application of Natural Ventilation for US Commercial Buildings) by James Axley, 2001. This is intended to be part of a calibration study that attempts to validate the application of the air-flow model within EnergyPlus through the comparison of measured and predicted response results.
Building Description
The plan of the Enschede Tax Office is organized around an elongated east-west slot atrium, Fig. 1. Offices and meeting rooms are distributed along the southern and northern sides of the building along corridors. In section, five levels of offices are placed above ground level parking on the south side of the building and above utility rooms on the north, Fig. 2.
1
Ninth International IBPSA Conference Montréal, Canada
August 15-18, 2005
- 741 -

One can clearly see the natural ventilation strategy in this section. Driven by the combined effects of buoyancy forces and wind, air enters the offices through self-regulating inlet vents, mixes within the space and flows out of them into the central atrium. This air then flows up through the atrium space to ventilation stacks and out.
Such atria schemes are one of a number of common schemes used in office buildings in both Europe and North America as they offer obvious daylighting and ventilating advantages and through their open section create a workspace that encourages communication and participation of individuals in the larger office society.
Fig. 1: Plan of Enschede Tax Office Building. 5-
story, 4300 m2 (Source: NIST Report, James Axley, 2001)
MODELING ASSUMPTIONS The simulation has been done in stages starting with the simplest model using as few variables as possible. As the findings from the first stage were studied and understood, I have proceeded to the next level of detailing of the model and so forth. Only the simplified single-zone model is used in this paper. I have analyzed passive natural ventilation for COOLING only. These runs are spread over a four-day heat wave period in Boston - August 14-17. Boston has a similar, but slightly more extreme, outdoor temperature history than at Enschede, NL. The spatial variation of wind pressure coefficients over the height of the building are based on published wind pressure coefficient data for a 5-story building of simple rectangular geometry, Table 1. Natural ventilation system included two components – inlet vents and the ventilation stack. The logical control of these components is essential. Two of these vents, each with a free area of 0.03 m2 are installed just under ceiling locations on each floor. The self-regulating vents in the Enschede Tax Office were designed to provide a constant flow rate of 50 m3/h for driving pressure differences between 1 Pa and 25 Pa at their lowest setting and 100 m3/h at their highest setting. By setting both of these vents at the
lowest ventilating position and airflow rate of 100 m3/h (2 ACH) can be achieved. This is the design airflow rate specified for air quality control in the building. By setting both vents to the highest setting an airflow rate of 200 m3/h (4 ACH) can be achieved (if driving forces are sufficient). This is the design airflow rate specified for night cooling ventilation outside office hours, which are 8am -5pm.
Fig. 2: Plan and section of the simplified single-zone model of a representative segment of the Enschede Tax Office building corresponding to the envelope models commonly used for preliminary analysis of
natural ventilation systems that ignore internal resistance to air flow. (Source: NIST Report, James
Axley, 2001) Due to the central importance of the ventilation stack in natural ventilation system design it is important to select stacks that are relatively insensitive to wind direction and provide relatively large suction pressures. As indicated in Table 1, the stack pressure coefficient was assumed to be (-0.60) for all modeling studies.
Table 1: Spatial variation of wind pressure coefficients cp used in the model, after Orme and
Welsh
Cp (0º) Cp (90º)
Cp (180º)
Cp (270º)
Stack Terminal -0.60 -0.60 -0.60 -0.60
Level 6 0.70 -0.58 -0.36 -0.58 Level 5 0.70 -0.58 -0.36 -0.58 Level 4 0.72 -0.55 -0.35 -0.55 Level 3 0.58 -0.48 -0.34 -0.48
2- 742 -
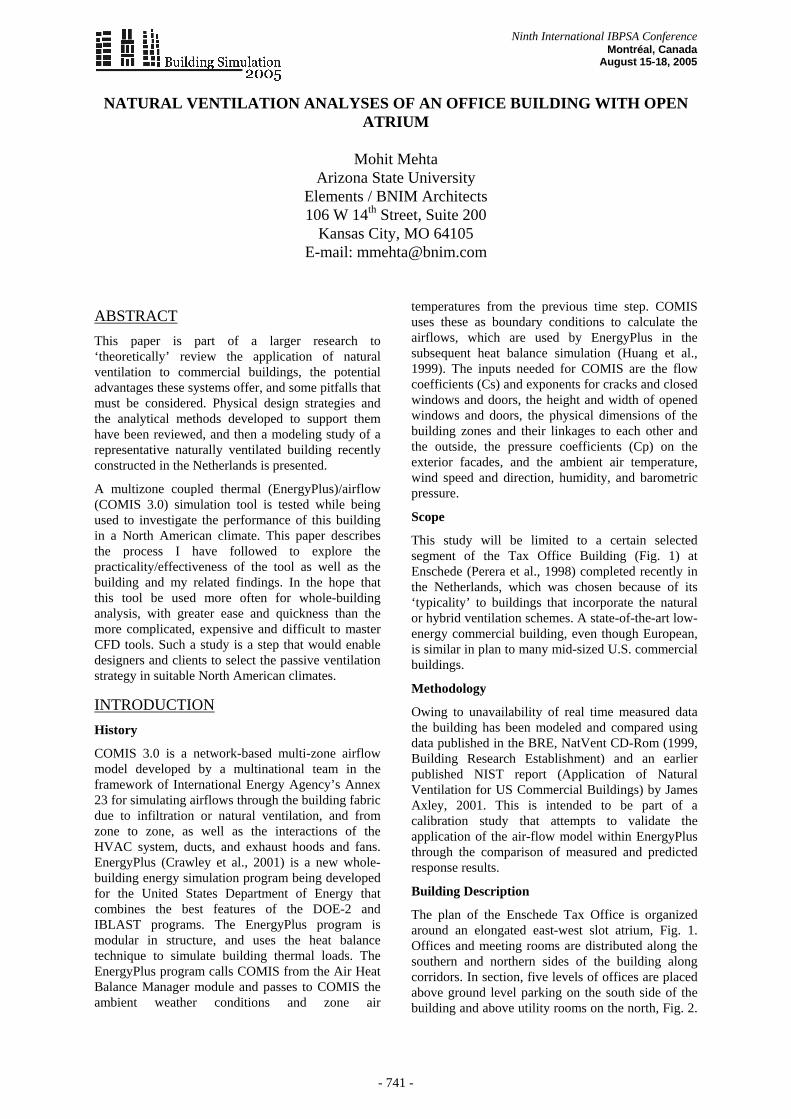
Level 2 0.41 -0.38 -0.29 -0.38 Level 1 0.44 -0.17 -0.28 -0.17
For any space in a building, the sum of the inflows must equal the sum of the outflows and the sum of pressure losses in the inlet and stack terminal must be equal to the driving stack and wind pressures. The stack terminal free area is assumed to be 1.0 m2 to insure that the inlet vents maintained authority over ventilation flows (Axley, 2001).
Natural ventilation cooling strategies must be complimented by effective and comprehensive control of solar and internal gains. This building is assumed to have a high resistance envelope construction and automatic control of external shades to minimize solar gains, and automatic control of artificial lighting coupled with optimally designed day lighting systems. To simplify inputs the results were computed for three assumed combined solar and internal gains in offices of 20.0 W/m2, 27.5 W/m2 and 35.0 W/m2.
The Tax Office is constructed to allow the massive floor construction used to be exposed on both upper and lower surfaces to space air. The effect of this high thermal mass has been modeled using an estimated surface area of 1032 m2.
SIMULATION RESULTS Mean Air Temperatures
The building was allowed to run in 15 minute time steps passively over the four day period. Using the zone air temperatures and the wind pressure distribution at the beginning of the time step, COMIS calculates air flows between outside and inside and from zone to zone. These are then used by the EnergyPlus thermal calculation to determine surface temperatures and zone air temperatures for that time step, which are then used in the next time step to calculate new air flow values and so on. Results are reported hourly. EnergyPlus results are compared to the measured data as well as the results from in the NIST report by J. Axley.
Fig. 4: Measured indoor and outdoor temperatures for August 1997 four-day heat wave. (Source: BRE
NatVent CD-Rom, 1999)
Fig 5: EnergyPlus (COMIS) computed indoor and outdoor temperatures using the single-zone model
for the four-day heat wave taken from Boston-City.WSO_TMY.epw weather data for office heat
gains of 20.0 W/m2, 27.5 W/m2 and 35 W/m2
These indoor temperatures (fig. 5) are a result of the building running in passive mode and air flowing in through inlet vents that are set at their lowest setting during the work day (highlighted regions in the graph) and highest setting outside office hours. In EnergyPlus this has been done by allowing one vent to remain open all the time (with the specified openness factor) and the other vent to remain closed during 8am – 5pm. This is because EnergyPlus does not allow the vent areas to be controlled by a fraction schedule. They can either be open or closed. The argument here is that if the area through which air is allowed into the zone is reduced by half, it should have a similar effect to the two vents being set at their lowest setting.
At no time during the 4 days does the infiltration – air change rate fall below 2 ACH. An average rate of 4.3 ACH is maintained through the space.
As is evident from the two graphs (fig. 4 & fig. 5), the measured and modeled indoor temperature swings are attenuated by the high thermal mass. However the computed attenuation is slightly lower. EnergyPlus seems to be underestimating the effect of thermal mass. In both cases the impact on heat gains during office hours is depicted by the rapid rise in indoor air temperatures during these periods. In the computed results one can also see the higher heat gains resulting in proportionately greater indoor air temperature increases. On the other hand, the impact of night cooling is revealed by a very slight decrease in slope of the temperature time histories as outdoor air temperatures fall below indoor values.
An argument can be made at this point that one is not sure if the building would react in a similar manner if the infiltration rates are strictly controlled as they
3- 743 -

were designed to be - 1000 m3/h (100 m3/h X 10 offices; 5 offices on each side of the atrium) during the day and 2000 m3/h (100 m3/h X 10 offices) for night ventilation. To corroborate the above results this would be an appropriate check. The airflow module within EnergyPlus has a ‘Simple Ventilation’ command, which can be used to specify the purposeful flow of air from outdoor environment directly into a thermal zone in order to provide some amount of non-mechanical cooling. The basic equation used to calculate ventilation in EnergyPlus is:
Ventilation = (Vdesign) (Fschedule) [A + B (Tzone-Todb) + C (WindSpeed) + D (WindSpeed2)]
A – Constant Term Coefficient
B – Temperature Term Coefficient
C – Velocity Term Coefficient
D – Velocity Squared Term Coefficient
Using this equation one can control the amount of ventilation to be constant irrespective of minimum indoor temperature and the temperature difference between indoor and outdoor. It can then be controlled using a fractional time of day schedule. However ‘Simple Ventilation’ assumes that an equal amount of air leaves the zone via an unspecified path and one cannot mix COMIS and ‘Simple Ventilation’ in the same run.
Fig. 6: EnergyPlus (Simple Ventilation) computed indoor and outdoor temperatures using the single-zone model for the four-day heat wave taken from
Boston-City.WSO_TMY.epw weather data for office heat gains of 20.0 W/m2, 27.5 W/m2 and 35 W/m2.
From Fig. 6 one can see that the indoor temperature time histories show a very similar trend to the COMIS run temperatures. Fig. 7 shows the two graphs overlaid to get a more detailed look. Note:
Simple Ventilation does not take in to account the stack effect that COMIS does.
Fig. 7: Graphs from fig. 5 and fig. 6 compared.
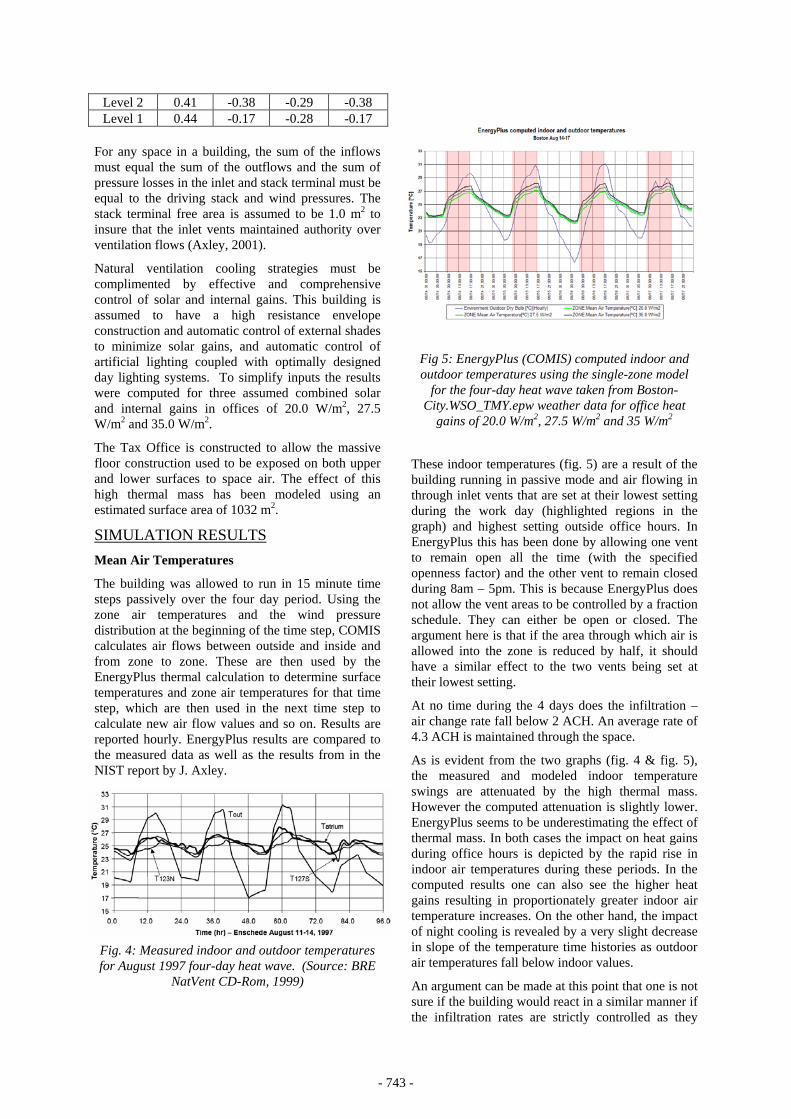
The next step was to see how EnergyPlus results compared to modeling studies using an unreleased version of the CONTAM family of programs, CONTAM97R (Walton et al., 1998). This multizone dynamic analysis program supports modeling of coupled thermal/airflow interactions and ventilation control logic, both central to the behavior of natural ventilation systems.
Owing to the availability of the report and not the output files from the CONTAM97R runs, the graph in Fig. 8 has been generated by matching the scale and then superimposing it onto computed results from the EnergyPlus runs.
We can see that there is a similarity in the trends, however the magnitude of indoor mean air temperature time histories are NOT a match until the fourth day of the run (circled). In the CONTAM run – for similar outdoor air temperatures, indoor air temperatures can be seen climbing gradually over the four-day period, staying marginally within an extended comfort zone of 28 ºC. But on the fourth day, indoor temperatures climbed to equal and also exceed outdoor air temperatures for the high internal gain case as well as in the measured case (Fig. 4).
In the EnergyPlus run – we see steady amplitude for mean indoor air temperatures irrespective of outdoor temperature swings for all the days and even on the fourth day the indoor temperature does not go much higher than 28.2 ºC. The reason why the indoor temperatures are different starting out could be because EnergyPlus simulates the first day of each simulation period until it reaches ‘convergence’. That is EnergyPlus does have a warm-up period during which the program will iterate on the same day until it reaches ‘steady periodic’ conditions. For a weather environment (like I have used), EnergyPlus uses the first day of the weather file for the warm-up period. Once ‘convergence’ is reached, it then starts the simulation time clock.
4- 744 -
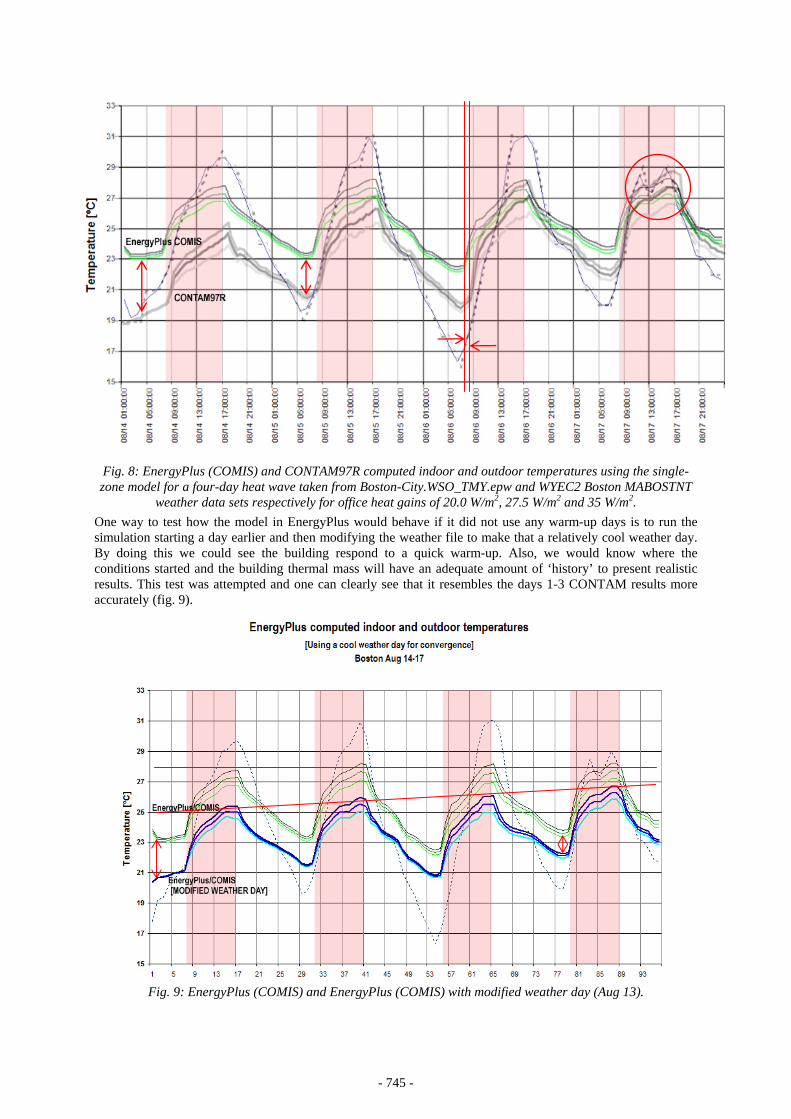
Fig. 8: EnergyPlus (COMIS) and CONTAM97R computed indoor and outdoor temperatures using the single-zone model for a four-day heat wave taken from Boston-City.WSO_TMY.epw and WYEC2 Boston MABOSTNT
weather data sets respectively for office heat gains of 20.0 W/m2, 27.5 W/m2 and 35 W/m2. One way to test how the model in EnergyPlus would behave if it did not use any warm-up days is to run the simulation starting a day earlier and then modifying the weather file to make that a relatively cool weather day. By doing this we could see the building respond to a quick warm-up. Also, we would know where the conditions started and the building thermal mass will have an adequate amount of ‘history’ to present realistic results. This test was attempted and one can clearly see that it resembles the days 1-3 CONTAM results more accurately (fig. 9).
Fig. 9: EnergyPlus (COMIS) and EnergyPlus (COMIS) with modified weather day (Aug 13).
5- 745 -
What we can interpret so far with the above studies - the high mean air indoor temperatures could possibly be alleviated by delaying the night ventilation schedule, which is initiated at 5pm when outdoor air temperatures haven’t fallen below indoor air temperatures. Addition of thermal mass and superior management of heat gains will help too.
Zone Air Flows
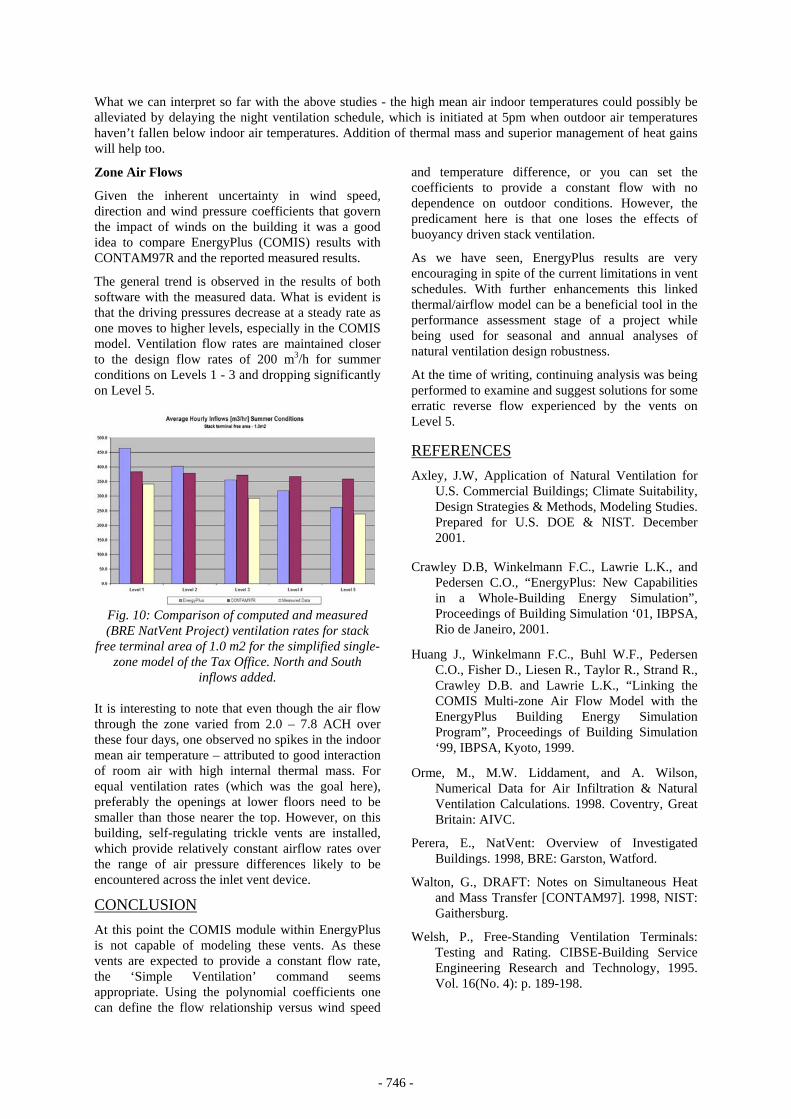
Given the inherent uncertainty in wind speed, direction and wind pressure coefficients that govern the impact of winds on the building it was a good idea to compare EnergyPlus (COMIS) results with CONTAM97R and the reported measured results.
The general trend is observed in the results of both software with the measured data. What is evident is that the driving pressures decrease at a steady rate as one moves to higher levels, especially in the COMIS model. Ventilation flow rates are maintained closer to the design flow rates of 200 m3/h for summer conditions on Levels 1 - 3 and dropping significantly on Level 5.
Fig. 10: Comparison of computed and measured (BRE NatVent Project) ventilation rates for stack
free terminal area of 1.0 m2 for the simplified single-zone model of the Tax Office. North and South
inflows added. It is interesting to note that even though the air flow through the zone varied from 2.0 – 7.8 ACH over these four days, one observed no spikes in the indoor mean air temperature – attributed to good interaction of room air with high internal thermal mass. For equal ventilation rates (which was the goal here), preferably the openings at lower floors need to be smaller than those nearer the top. However, on this building, self-regulating trickle vents are installed, which provide relatively constant airflow rates over the range of air pressure differences likely to be encountered across the inlet vent device.
CONCLUSION At this point the COMIS module within EnergyPlus is not capable of modeling these vents. As these vents are expected to provide a constant flow rate, the ‘Simple Ventilation’ command seems appropriate. Using the polynomial coefficients one can define the flow relationship versus wind speed
and temperature difference, or you can set the coefficients to provide a constant flow with no dependence on outdoor conditions. However, the predicament here is that one loses the effects of buoyancy driven stack ventilation.
As we have seen, EnergyPlus results are very encouraging in spite of the current limitations in vent schedules. With further enhancements this linked thermal/airflow model can be a beneficial tool in the performance assessment stage of a project while being used for seasonal and annual analyses of natural ventilation design robustness.
At the time of writing, continuing analysis was being performed to examine and suggest solutions for some erratic reverse flow experienced by the vents on Level 5.
REFERENCES Axley, J.W, Application of Natural Ventilation for
U.S. Commercial Buildings; Climate Suitability, Design Strategies & Methods, Modeling Studies. Prepared for U.S. DOE & NIST. December 2001.
Crawley D.B, Winkelmann F.C., Lawrie L.K., and Pedersen C.O., “EnergyPlus: New Capabilities in a Whole-Building Energy Simulation”, Proceedings of Building Simulation ‘01, IBPSA, Rio de Janeiro, 2001.
Huang J., Winkelmann F.C., Buhl W.F., Pedersen C.O., Fisher D., Liesen R., Taylor R., Strand R., Crawley D.B. and Lawrie L.K., “Linking the COMIS Multi-zone Air Flow Model with the EnergyPlus Building Energy Simulation Program”, Proceedings of Building Simulation ‘99, IBPSA, Kyoto, 1999.
Orme, M., M.W. Liddament, and A. Wilson, Numerical Data for Air Infiltration & Natural Ventilation Calculations. 1998. Coventry, Great Britain: AIVC.
Perera, E., NatVent: Overview of Investigated Buildings. 1998, BRE: Garston, Watford.
Walton, G., DRAFT: Notes on Simultaneous Heat and Mass Transfer [CONTAM97]. 1998, NIST: Gaithersburg.
Welsh, P., Free-Standing Ventilation Terminals: Testing and Rating. CIBSE-Building Service Engineering Research and Technology, 1995. Vol. 16(No. 4): p. 189-198.
6- 746 -