Embed Size (px)
Citation preview
Chen Li1,+, Ying Liu2,+, Jiayu Zhang2, Siyi Liu2,Wei Cai3, Jianqiu Lu2 1 Thermo Fisher Scientific, Shanghai, China 2 Center of Scientific Experiment, Beijing University of Chinese Medicine, Beijing, China 3 Hunan University of Medicine, Huaihua, China +: The first two authors contributed equally to this work
Results
Fig. 3. Transformation Editor in Compound Discoverer software.
Natural product metabolites discovery and characterization workflow using
Compound Discoverer software.
Figure 1. Workflow for natural product
metabolites discovery and characterization. Figure 2. Custom-built workflow for natural product
metabolites discovery and characterization in
Compound Discoverer software.
Fig.4. Calculation results of asrainin metabolites in Compound Discoverer software.
Abstract
Purpose: Demonstrate an effective workflow for natural product metabolites discovery
and identification, and its application in profiling and elucidation of asarinin metabolites.
Methods: Biological samples were profiled by using UHPLC coupled with a Thermo
Scientific™ quadrupole-Orbitrap™ mass spectrometer. Acquired data were processed
using novel node-based Thermo Scientific™ Compound Discoverer™ software.
Results: 38 asarinin metabolites were detected in the biological samples, among
which 31 metabolites were discovered for the first time.
Introduction
Traditional Chinese medicine has attracted attention as a natural alternative to treat
diseases. However, the obscure transformations of its components in vivo hinder the
sufficient interpretation of its therapeutic mechanism. Metabolite profiling and
identification of its constituent is a crucial step to improve the understanding. But it’s
always challenging on how to detect trace metabolites in complex biological matrices
and maximize the amount of metabolite information without a time-consuming data-
mining process.
A novel strategy integrating the Thermo Scientific™ Q Exactive™ Plus high-resolution
mass spectrometer and Compound Discoverer software was constructed and then
employed to discover and characterize the metabolites of asarinin, a lignan possessing
bioactivities such as antihypertensive and hypolipidemic, with only 7 metabolites
identified previously.
Materials and Methods
Drug administration and sample preparation
Asarinin was orally administered to rats at a dose of 200 mg/kg body weight. Biological
samples were prepared by solid phase extraction method.
Liquid Chromatography
A Thermo Scientific™ UltiMate™ 3000 Binary RSLC system performed separations
using 0.1% formic acid and acetonitrile as mobile phase.
Mass Spectrometry
High resolution accurate mass data was acquired in positive ion mode using a Q
Exactive Plus Orbitrap mass spectrometer.
MS parameters:
Heat temperature: 350 ˚C; capillary temperature: 300 ˚C; spray voltage: 3 kV (positive
mode); sheath gas: 40 arb; auxiliary gas: 10 arb; MS Resolution: 70,000 (FWHM at
m/z 200); MS2 Resolution: 17,500 (FWHM at m/z 200); HCD fragmentation energy:
40%.
Data Analysis
A node-based processing workflow was custom-built in Compound Discoverer
software to search and identify the asarinin metabolites.
Conclusions
• Effective and confident natural product metabolites discovery and identification were
achieved using the Q Exactive Plus high resolution mass spectrometer and
Compound Discoverer software.
• In total, 38 asarinin metabolites, with mass accuracy less than 1 ppm, were
identified, of which 31 metabolites were discovered for the first time.
• Consolidating various complimentary metabolite detection strategies, Compound
Discoverer software provides significant speed and organizational benefits to
accelerate the natural product MetID process in one customizable platform.
References
1.Yasuda K, Ikushiro S, Kamakura M, et al. Sequential metabolism of sesamin by
cytochrome P450 and UDP-glucuronosyltransferase in human liver[J]. Drug
Metabolism and Disposition, 2011, 39(9): 1538-1545.
2.Yasuda K, Ikushiro S, Kamakura M, et al. Metabolism of sesamin by cytochrome
P450 in human liver microsomes[J]. Drug Metabolism and Disposition, 2010, 38(12):
2117-2123.
Trademarks/Licensing
© 2016 Thermo Fisher Scientific Inc. All rights reserved. All trademarks are the
property of Thermo Fisher Scientific and its subsidiaries. This information is not
intended to encourage use of these products in any manner that might infringe the
intellectual property rights of others.
A Strategy for the Discovery and Identification of New Natural Product Metabolites by Orbitrap Mass Spectrometry and Multiple Data-Mining Approaches
The workflow for natural product metabolites discovery and characterization is
demonstrated in Figure 1. MS and MS/MS high resolution mass spectrometry data were
acquired on the UHPLC-Q-Orbitrap platform using a data dependent scan. The data were
then processed with a customized workflow in a drag-and-drop user interface in
Compound Discoverer software (Fig. 2). The workflow assembled various data-processing
techniques such as mass defect filter and fragment ion search (FISh). The mass defect
filter could filter out the vast majority of background ions, while the FISh function could
further search out the parent drug structure-related compounds. The structures of the
discovered metabolites were further confirmed by fragment ion matching between
experimental data and theoretical predictions from Thermo Scientific™ Mass Frontier™
fragmentation libraries.
Discovery of asarinin metabolites.
Common phase I and phase II bio-transformations were preset in Compound Discoverer
software, while uncommon ones could be defined through the Transformation Editor
(Fig.3). The transformations were automatically combined in the software on the basis of
the number of maximum occurrences for each transformation and the maximum number
of combinatorial steps, leading to the revelation of metabolites which occurred several
transformation steps.
As illustrated in Figure 4, the calculated metabolites were listed in tabular form. Isotopes
and adducts were automatically matched and grouped for each compound, reducing false
positives from compound hits.
Identification of asarinin metabolites.
By employing Result Filters, metabolites of interest could be filtered out by selecting
multiple criteria and options (Fig.5). Metabolites with Best FISh Coverage greater than 10
were chosen for identification.
Fig.5. Result Filters in Compound Discoverer software.
FISh Scoring searched the fragmentation spectra, and annotated matching fragment
structures directly on the spectra. As seen in the Figure 6, 8 fragment structures matching
with those of the parent compound (color-coded in green) and 24 biotransformation shifted
fragments (color-coded in blue) were labeled in the MS/MS spectrum, providing a quick
visual indication of the modification location.
Fig.7. FISh re-annotated MS/MS spectrum based on proposed putative structure for M18.
Fig.6. Asarinin metabolite with FISh fragment annotations.
In the custom explanation table, the MS/MS spectrum was automatically interpreted
according to the proposed putative structure, giving greater confidence for the metabolite
structure assignment. 23 exact match fragments were found in the FISh annotation based
on the proposed structure of M18 (Fig.7).
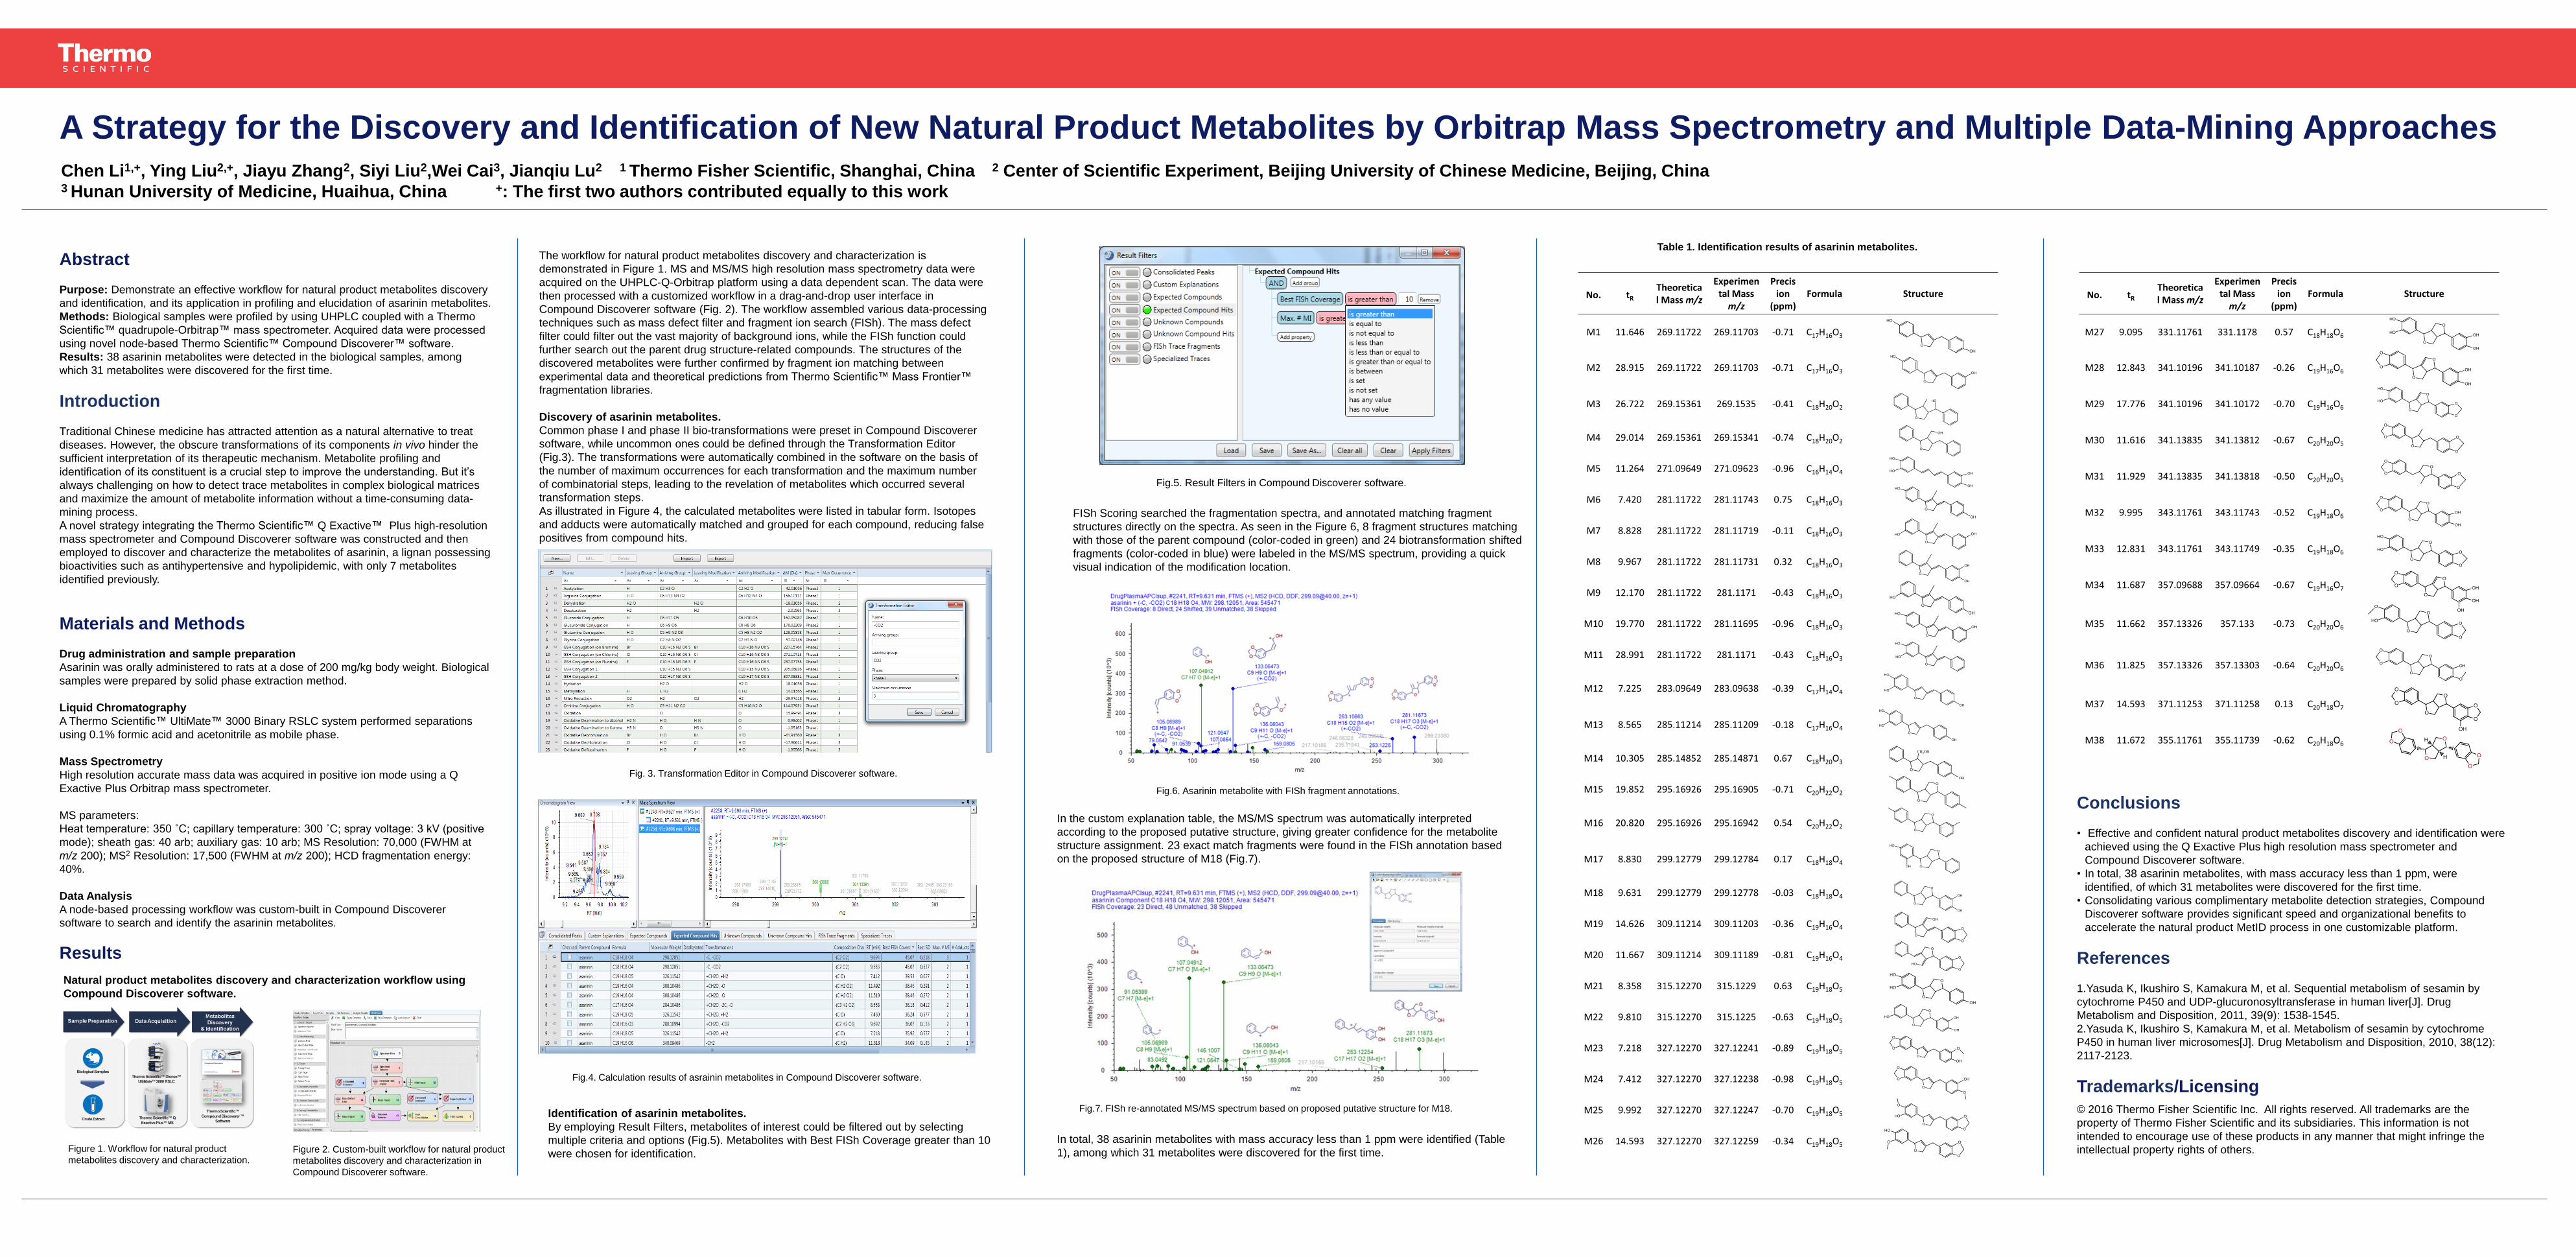
In total, 38 asarinin metabolites with mass accuracy less than 1 ppm were identified (Table
1), among which 31 metabolites were discovered for the first time.
Table 1. Identification results of asarinin metabolites.
No. tR Theoretical Mass m/z
Experimental Mass
m/z
Precision
(ppm) Formula Structure
M1 11.646 269.11722 269.11703 -0.71 C17H16O3
M2 28.915 269.11722 269.11703 -0.71 C17H16O3
M3 26.722 269.15361 269.1535 -0.41 C18H20O2
M4 29.014 269.15361 269.15341 -0.74 C18H20O2
M5 11.264 271.09649 271.09623 -0.96 C16H14O4
M6 7.420 281.11722 281.11743 0.75 C18H16O3
M7 8.828 281.11722 281.11719 -0.11 C18H16O3
M8 9.967 281.11722 281.11731 0.32 C18H16O3
M9 12.170 281.11722 281.1171 -0.43 C18H16O3
M10 19.770 281.11722 281.11695 -0.96 C18H16O3
M11 28.991 281.11722 281.1171 -0.43 C18H16O3
M12 7.225 283.09649 283.09638 -0.39 C17H14O4
M13 8.565 285.11214 285.11209 -0.18 C17H16O4
M14 10.305 285.14852 285.14871 0.67 C18H20O3
M15 19.852 295.16926 295.16905 -0.71 C20H22O2
M16 20.820 295.16926 295.16942 0.54 C20H22O2
M17 8.830 299.12779 299.12784 0.17 C18H18O4
M18 9.631 299.12779 299.12778 -0.03 C18H18O4
M19 14.626 309.11214 309.11203 -0.36 C19H16O4
M20 11.667 309.11214 309.11189 -0.81 C19H16O4
M21 8.358 315.12270 315.1229 0.63 C19H18O5
M22 9.810 315.12270 315.1225 -0.63 C19H18O5
M23 7.218 327.12270 327.12241 -0.89 C19H18O5
M24 7.412 327.12270 327.12238 -0.98 C19H18O5
M25 9.992 327.12270 327.12247 -0.70 C19H18O5
M26 14.593 327.12270 327.12259 -0.34 C19H18O5
No. tR Theoretical Mass m/z
Experimental Mass
m/z
Precision
(ppm) Formula Structure
M27 9.095 331.11761 331.1178 0.57 C18H18O6
M28 12.843 341.10196 341.10187 -0.26 C19H16O6
M29 17.776 341.10196 341.10172 -0.70 C19H16O6
M30 11.616 341.13835 341.13812 -0.67 C20H20O5
M31 11.929 341.13835 341.13818 -0.50 C20H20O5
M32 9.995 343.11761 343.11743 -0.52 C19H18O6
M33 12.831 343.11761 343.11749 -0.35 C19H18O6
M34 11.687 357.09688 357.09664 -0.67 C19H16O7
M35 11.662 357.13326 357.133 -0.73 C20H20O6
M36 11.825 357.13326 357.13303 -0.64 C20H20O6
M37 14.593 371.11253 371.11258 0.13 C20H18O7
M38 11.672 355.11761 355.11739 -0.62 C20H18O6