Embed Size (px)
Citation preview

Natural gas supply and demand report
New Brunswick and Nova Scotia
2015-2025
Prepared for: Atlantica Centre for Energy
Prepared by: Jupia Consultants Inc.
Spring 2015

NB & NS NATURAL GAS SUPPLY AND DEMAND REPORT 2015-2025 P A G E |1
Table of Contents Page
Executive Summary ...................................................................................................................................... 2
1. Introduction .............................................................................................................................................. 5
2. Natural gas demand in New Brunswick and Nova Scotia ......................................................................... 6
2.1 Natural gas demand in New Brunswick and Nova Scotia (2005-2013)............................................... 6
2.2 Natural gas supply and demand in New Brunswick and Nova Scotia (2015-2025) ............................ 9
2.3 Potential big drivers of natural gas demand through 2025 .............................................................. 12
3. Sources of natural gas supply to the region ........................................................................................... 14
3.1 Offshore Nova Scotia – Sable Island, Deep Panuke and new fields .................................................. 14
3.2 Frederick Brook Shale/Hiram Brook Sands ....................................................................................... 15
3.3 LNG imports ...................................................................................................................................... 16
3.4 Imported U.S. natural gas ................................................................................................................. 17
3.5 Importing natural gas from western Canada .................................................................................... 17
3.5 Additional onshore shale gas development in New Brunswick ........................................................ 18
3.6 Additional onshore shale gas development in Nova Scotia .............................................................. 18
4. Potential implications for the regional economy ................................................................................... 19
4.1 Are we facing a big natural gas price spike? ..................................................................................... 19
4.2 Economic impact from new onshore gas development ................................................................... 20
4.3 Mitigating price swings: Natural gas storage .................................................................................... 21
4.4 Natural Gas and New Investment in the Region ............................................................................... 22
5. Conclusion ............................................................................................................................................... 22

NB & NS NATURAL GAS SUPPLY AND DEMAND REPORT 2015-2025 P A G E |2
Executive Summary
Finding #1: Natural gas has become a vital source of energy and economic development in the region.
Over the past 15 years, natural gas has become an important new source of energy in the Maritimes.
Measured in energy use equivalent units (terajoules), natural gas use increased by more than two
hundred percent in New Brunswick between 2005 and 2013 and more than 300 percent in Nova Scotia.
It is having the largest impact on heavy fuel oil usage of which has declined by 73 percent in New
Brunswick and 72 percent in Nova Scotia over the same period. Every other major source of energy in
the region is in decline except natural gas. Thousands of institutions, small businesses and households
around the region are now using natural gas as a principal source of energy (Section 2.1).
At the same time the local production of natural gas has provided a significant boost to the regional
economy. The exploration and production of natural gas along with the construction of pipeline
infrastructure has generated billions of dollars worth of economic activity in Nova Scotia and New
Brunswick. Nova Scotia in particular has benefitted from royalty revenues. Between 1997 and 2007
alone, the province received $1.5 billion1 worth of royalty-related revenues (Section 4.2).
Finding #2: Local production of natural gas in the Maritimes is in steep decline.
According to Statistics Canada, natural gas production from Nova Scotia and New Brunswick fields
declined from 167,000 terajoules in 2004 to 78,000 in 2013. A 2013 report prepared for the Nova Scotia
government concluded local demand in the Maritimes would outstrip local supply by 2017. Based on
the current trend, i.e. without further drilling, it is likely the region’s gas production will drop to nearly
zero before 2020 even as demand continues to expand. There are times during the year now when
demand is greater than supply particularly during winter high use months (Section 2.2).
Finding #3: Local demand for natural gas in the Maritimes is expect to rise.
Demand for natural gas is expected to rise significantly over the next 10-20 years assuming the price for
the fuel remains competitive. A report prepared for the Nova Scotia government in 2013 forecasted a
mid-level demand growth scenario under which domestic demand in the Maritimes will increase from
189 MMcfd (million cubic feet per day) in 2010 to 500 MMcfd in 2025. Coupling this demand growth
with a steep decline in local production would result in local demand being five times greater than
domestic production by 20252 (Section 2.3). The drivers of future natural gas demand in the region will
be:
Electricity production.
Other industrial uses.
Expansion of commercial, small business and residential markets.
The possible export of natural gas via several liquefied natural gas (LNG) export facilities.
1 Throughout this document, dollar figures are shown in Canadian dollars unless otherwise indicated.
2 The report was developed before Deep Panuke’s reserves estimate was cut by 50 percent.

NB & NS NATURAL GAS SUPPLY AND DEMAND REPORT 2015-2025 P A G E |3
Executive Summary (cont.)
Finding #4: Future local production of natural gas is in jeopardy due to bans put in place on hydraulic
fracturing by provincial governments.
Due to the relatively low cost development of shale gas across North America, there is limited appetite
for generally more expensive exploration and production of offshore natural gas. Because of this and
the bans on hydraulic fracturing in both New Brunswick and Nova Scotia, it is unclear if or when there
will be any new local sources of natural gas production (Section 3). The potential sources of local supply
are:
Offshore Nova Scotia – offshore exploration and production for oil and gas continues but the
economic viability of natural gas development and production has been negatively impacted by the
development of the shale gas industry in the United States and western Canada (Section 3.1).
Onshore natural gas – there are producing fields in the Sussex region in New Brunswick and there is
considerable potential for shale gas development in both New Brunswick and Nova Scotia using
horizontal drilling and hydraulic fracturing. However, both provinces now have bans in place and it
is unclear if and when this situation will change (Section 3.2). Coalbed methane is being developed
in Nova Scotia but the scope of this development is unclear.
LNG imports through Canaport in Saint John – however, the price point would be substantially
higher than in the past particularly during times of peak demand. In January 2015, the landed LNG
price at Canaport was $16.74/MMBtu3 ($US) compared to a price of less than $4.00/MMBtu ($US) in
the Gulf of Mexico (Section 3.3).
Imported U.S. natural gas - this is the most likely source of large volume natural gas to serve
markets in the Maritimes. Based on current estimates, natural gas could be flowing northward from
U.S. shale plays by sometime in 2017 (Section 3.4). However, this could lead to a significant increase
in the transportation costs associated with natural gas.
Finding #5: The future supply options for natural gas could lead to substantial increases in the landed
price of natural gas for this region.
The current approved toll for the gas flowing from offshore Nova Scotia is $0.67/MMBtu plus fuel
retainage of 0.3 percent (note this is the toll before the gas enters local distribution systems). This rate
applies to both forward haul and backhaul service. If the pipeline is reversed and gas flows north into
New Brunswick, a recent report found the transportation costs will rise to $3.67/MMBtu – from U.S.
shale plays – not including local distribution charges or the price of the commodity (Section 4.1).
3 MMBtu = One Million British Thermal Units, a standard unit used for the price of natural gas.

NB & NS NATURAL GAS SUPPLY AND DEMAND REPORT 2015-2025 P A G E |4
Executive Summary (cont.)
Finding #6: A higher price for natural gas in the region could harm the economy.
Most of the region’s energy intensive industries have shifted from heavy oil and other sources to natural
gas as a primary source of energy. Even those firms not in close proximity to the natural gas pipeline
infrastructure are being served using compressed natural gas (CNG) delivered by truck. A significant
spike in the delivered cost of natural gas will hurt their overall competitiveness. In addition, a higher
price for natural gas could also restrict future investment (Section 4.4).
Finding #7: Shifting from local production of natural gas to its importation eliminates potentially
substantial economic benefits to the region.
The exploration and production of natural gas is a major source of economic activity in other areas and
could be in New Brunswick and Nova Scotia. A study looking at the economic impact of the Marcellus
shale gas industry in Pennsylvania found that its development in the state boosted gross state product
(GSP) by more than $11 billion ($US) in 2010 while generating nearly $1.1 billion ($US) worth of state
and local taxes. A 2014 study attempting to quantify the potential of shale gas exploration and
production in New Brunswick estimated the industry could generate $2.2 billion worth of new
investment over five years, boost provincial gross domestic product (GDP) by $1.6 billion and generate
over $425 million worth tax and royalty revenue to all three levels of government (Section 4.2).
Finding #8: The natural gas supply/demand challenge is one of the major public policy challenges in
the Maritime Provinces.
The economy in the Maritime Provinces has been among the worst performing regional economies
across North America since 2007. Access to a stable supply of competitively priced natural gas is one
way to ensure manufacturing and other energy-intensive industries will continue to invest in the region.
Finding and exploiting new sources of local natural gas production would not only ensure a more
competitive natural gas price environment but also generate substantial economic benefits from its
exploration and production.

NB & NS NATURAL GAS SUPPLY AND DEMAND REPORT 2015-2025 P A G E |5
1. Introduction
Since the introduction of natural gas as an energy source in the Maritimes in 1999 it has become an
important part of the energy mix in the region. For example, in New Brunswick the demand for natural
gas rose from just under 6,400 terajoules in 2005 to over 19,000 terajoules in 2013. The demand for
natural gas liquids (NGLs) (e.g. propane, butane, etc.) also rose by more than 300 percent in the same
time frame. Industries have been shifting out of heavy and light fuel oil as well as diesel to the cleaner-
burning natural gas. The use of heavy fuel oil, once a principal source of industrial energy in the
province, has declined by 73 percent between 2005 and 2013. Nova Scotia has also seen rapid
expansion in the demand for natural gas in recent years as its use has risen by more than 300 percent
between 2005 and 2013. Similar to New Brunswick, heavy fuel oil use as an energy source has dropped
dramatically – down 72 percent.
Even on Prince Edward Island, several of the large manufacturing firms are bringing in natural gas in a
compressed natural gas (CNG) format to take advantage of the better price and cleaner burning fuel.
The future demand for natural gas in the region is likely to rise significantly again over the coming
decade. In New Brunswick, less than ten percent of households and small businesses in the ten
communities where natural gas infrastructure exists use the fuel compared to between 50 and 90
percent in provinces with mature natural gas distribution industries. There are potential new industrial
markets for natural gas, such as for use in power generation, as well as a proposed new potash mine and
fertilizer facilities. Indeed, use of natural gas in Nova Scotia and New Brunswick by small and medium
businesses is in its infancy.
Even as demand for natural gas rises in the region, its future supply is coming into serious question. The
offshore Sable Island and Deep Panuke fields are winding down. The import of liquefied natural gas
(LNG) has become cost prohibitive and is now merely a seasonal supplier, as are the existing on-shore
New Brunswick and Deep Panuke off-shore sources. The potential development of onshore natural gas
sources (shale gas) have been put on hold in both New Brunswick and Nova Scotia either through a
moratorium (New Brunswick) or an outright ban on hydraulic fracturing (Nova Scotia).
This report provides a high level look at the demand for natural gas in the region over the next decade
as well as the potential sources of supply to address the demand. In addition, the report assesses how
the natural gas market in New Brunswick and Nova Scotia over the next decade could impact the
regional economy and its development.
This report highlights the situation in the Maritime Provinces where demand for natural gas is rising, yet
domestic supply is dwindling. The primary supply, offshore Nova Scotia, will be economically depleted
within the 2020 timeframe. Existing legislation by the Nova Scotia and New Brunswick governments has
halted development of onshore resources, leaving importation from outside the region as the only short
term option.

NB & NS NATURAL GAS SUPPLY AND DEMAND REPORT 2015-2025 P A G E |6
2. Natural gas demand in New Brunswick and Nova Scotia
2.1 Natural gas demand in New Brunswick and Nova Scotia (2005-2013)
The development of the offshore Sable Island natural gas field in the mid-1990s was primarily meant to
service natural gas markets in the northeastern United States. However, demand for the gas within the
Maritimes has steadily increased. In 2015 less than half of the natural gas crossed the border to the
United States, whereas in 2001, nearly 100 percent of Sable Island gas was sent to U.S. markets. In 2012,
before Deep Panuke gas started to flow, only 18 percent of all offshore Nova Scotia natural gas
production ended up servicing U.S. markets – the rest served the domestic market.
Figure 1: Natural gas exports from Nova Scotia (2000-2014), million cubic metres
Source: Statistics Canada. Table 131-0001.
The region’s large energy consuming industries have become major users of natural gas. Initially in New
Brunswick, a handful of the largest customers for natural gas were given a ‘by-pass’, meaning they were
not required to become customers of the natural gas distribution company in the province and only had
to pay the Maritimes & Northeast Pipeline (M&NP) transmission fee. This was done to ensure there was
enough base load demand to build the large lateral pipes required to bring gas to local communities in
southern New Brunswick. Now most of the large energy consuming industries including the oil refinery,
forest products mills and other manufacturers are using natural gas. Even those not close to the
pipeline infrastructure are now natural gas users through the truck-based compressed natural gas (CNG)
distribution system. The potash mine near Sussex is one of the largest industrial users of natural gas in
the region.
In Nova Scotia there is not as much large industrial demand for natural gas but there has still been wide
take-up of the gas in areas where it is available and also through the use of CNG.
0
100
200
300
400
500
600
De
c-0
0
Jun
-01
De
c-0
1
Jun
-02
De
c-0
2
Jun
-03
De
c-0
3
Jun
-04
De
c-0
4
Jun
-05
De
c-0
5
Jun
-06
De
c-0
6
Jun
-07
De
c-0
7
Jun
-08
De
c-0
8
Jun
-09
De
c-0
9
Jun
-10
De
c-1
0
Jun
-11
De
c-1
1
Jun
-12
De
c-1
2
Jun
-13
De
c-1
3
Jun
-14
De
c-1
4

NB & NS NATURAL GAS SUPPLY AND DEMAND REPORT 2015-2025 P A G E |7
Electricity production has also absorbed a considerable amount of the region’s natural gas. The largest
single user in the Maritimes is the Tufts Point electrical generation plant near Dartmouth. In fact,
between 2009 and 2013 utilities in New Brunswick and Nova Scotia generated more than 10 percent of
the national total of utility-generated electricity from natural gas even though the two provinces
represent less than five percent of national energy demand.
At the residential level, natural gas is a new fuel to the Maritimes. Households are not overly familiar
with its use relative to the rest of Canada. There is strong upside potential as the environmental
benefits and heating efficiencies become more main-stream.
Natural gas is also taking a larger share of the household and commercial energy markets in the
Maritimes. In New Brunswick, Enbridge Gas NB now has more than 12,000 residential and small
business customers or just under 10 percent of the market in the 10 communities in which it has
distribution infrastructure (Figure 2). In Nova Scotia, the uptake has been slower but Heritage Gas is
now building new local markets in multiple communities.
Figure 2: Percentage of households using natural gas as principal heating fuel*
*there is no residential use of natural gas on Prince Edward Island. Sources: All except New Brunswick and Nova Scotia - Statistics Canada CANSIM table 203-0019. Most recent figures are for 2009. New Brunswick and Nova Scotia – Enbridge NB and Heritage Gas customer figures (2014) as a percentage of total households only in currently serviced areas.
As noted in the chart above, between 90 and 97 percent of Eastern Canadian households are not using
natural gas versus 50 to 93 percent using natural gas for the rest of Canada. If there was a consistent
supply of natural gas at a consistent price, its use at the residential level would increase in the
Maritimes.
The development of industrial, electricity, household and commercial markets has led to a substantial
increase in the amount of natural gas used in New Brunswick and Nova Scotia over the past decade. As
shown in Figure 3, natural gas and natural gas liquids (NGL) use in New Brunswick has risen from 10,430
terajoules in 2004 to 30,748 terajoules in 2013, a nearly 300 percent increase.
2.8%
3.6%
9.9%
49.2%
53.4%
56.0%
71.9%
86.5%
92.9%
Nova Scotia
Quebec
New Brunswick
Canada
Manitoba
British Columbia
Ontario
Saskatchewan
Alberta

NB & NS NATURAL GAS SUPPLY AND DEMAND REPORT 2015-2025 P A G E |8
Natural gas and NGLs now make up more than 20 percent of total energy use in New Brunswick. They
provide more energy to the province than diesel fuel, heavy fuel oil and aviation fuel combined.
In Nova Scotia, natural gas is the fastest growing source of energy. Natural gas use (not including NGLs)
increased by 400 percent between 2004 and 2013. Even with NGLs overall natural gas demand in Nova
Scotia is up by nearly 200 percent over the decade.
Figure 3: Natural gas and NGLs energy use in New Brunswick and Nova Scotia, final demand (terajoules)
Source: Statistics Canada CANSIM Table 128-0016.
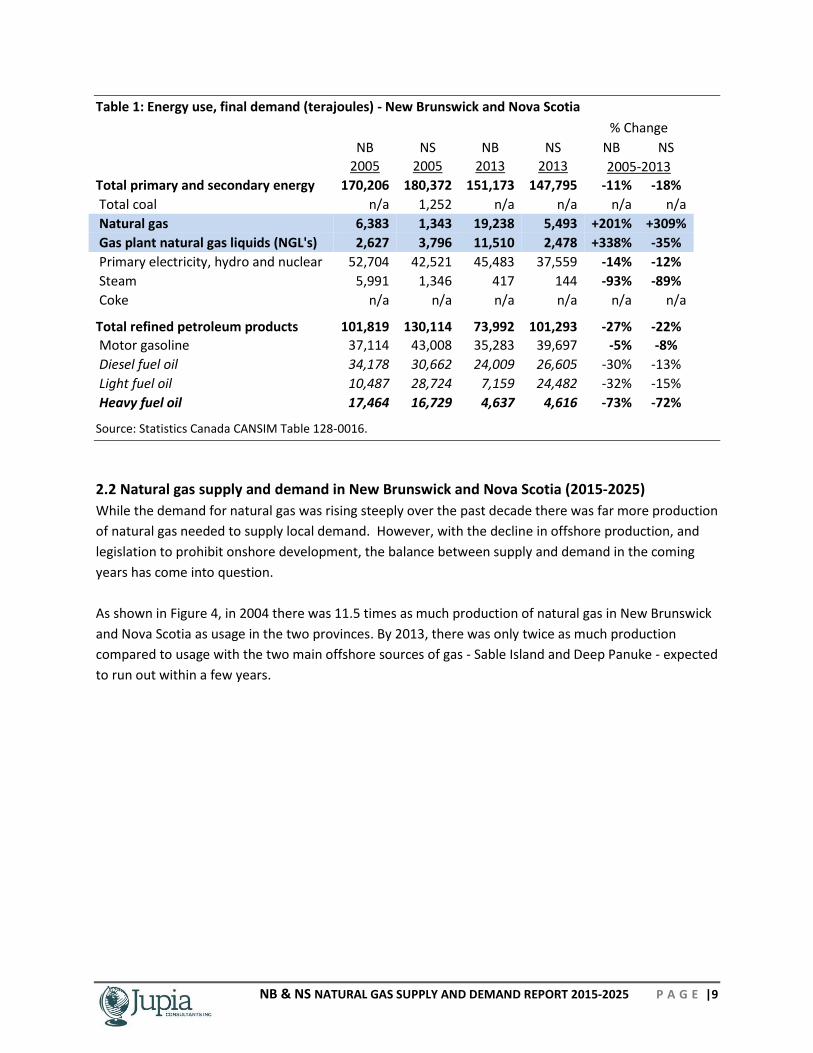
Table 1 shows the change in energy use in New Brunswick between 2005 and 2013. The energy sources
are standardized in terajoules rather than natural units to allow for comparison. Energy use in New
Brunswick has declined in New Brunswick in recent years mainly as a result of the loss of some industrial
activity and the stagnant population. As mentioned above, natural gas use is rising quickly but refined
petroleum product use is in fairly large decline – particularly fuel oil. The table shows the same data for
Nova Scotia where overall energy use has declined even more steeply than in New Brunswick for similar
reasons. Natural gas use – although from a smaller base than in New Brunswick – is also rising quickly
and fuel oil use is declining rapidly.
-
5,000
10,000
15,000
20,000
25,000
30,000
35,000
2004 2005 2006 2007 2008 2009 2010 2011 2012 2013
New Brunswick Nova Scotia
NB & NS NATURAL GAS SUPPLY AND DEMAND REPORT 2015-2025 P A G E |9
Table 1: Energy use, final demand (terajoules) - New Brunswick and Nova Scotia
% Change
NB NS NB NS NB NS
2005 2005 2013 2013 2005-2013
Total primary and secondary energy 170,206 180,372 151,173 147,795 -11% -18%
Total coal n/a 1,252 n/a n/a n/a n/a
Natural gas 6,383 1,343 19,238 5,493 +201% +309%
Gas plant natural gas liquids (NGL's) 2,627 3,796 11,510 2,478 +338% -35%
Primary electricity, hydro and nuclear 52,704 42,521 45,483 37,559 -14% -12%
Steam 5,991 1,346 417 144 -93% -89%
Coke n/a n/a n/a n/a n/a n/a
Total refined petroleum products 101,819 130,114 73,992 101,293 -27% -22%
Motor gasoline 37,114 43,008 35,283 39,697 -5% -8%
Diesel fuel oil 34,178 30,662 24,009 26,605 -30% -13%
Light fuel oil 10,487 28,724 7,159 24,482 -32% -15%
Heavy fuel oil 17,464 16,729 4,637 4,616 -73% -72%
Source: Statistics Canada CANSIM Table 128-0016.
2.2 Natural gas supply and demand in New Brunswick and Nova Scotia (2015-2025)
While the demand for natural gas was rising steeply over the past decade there was far more production
of natural gas needed to supply local demand. However, with the decline in offshore production, and
legislation to prohibit onshore development, the balance between supply and demand in the coming
years has come into question.
As shown in Figure 4, in 2004 there was 11.5 times as much production of natural gas in New Brunswick
and Nova Scotia as usage in the two provinces. By 2013, there was only twice as much production
compared to usage with the two main offshore sources of gas - Sable Island and Deep Panuke - expected
to run out within a few years.

NB & NS NATURAL GAS SUPPLY AND DEMAND REPORT 2015-2025 P A G E |10
Figure 4: Natural gas and NGLs energy use in New Brunswick and Nova Scotia compared to production in the region (terajoules)*
*At times during the winter, natural gas demand in the Maritimes already outstrips natural gas production.
Source: Statistics Canada CANSIM Table 128-0016.
There has been a lot of speculation in recent months about the supply of natural gas within New
Brunswick and Nova Scotia. The most recent formal assessment of the issue was prepared by the
Toronto-based consulting firm, ICF Consulting Canada, Inc., in 2013. The firm’s report, The Future of
Natural Gas Supply for Nova Scotia, developed several scenarios for supply and demand and developed
the potential implications. Their report was based on input from the Nova Scotia Department of Energy
and other sources.
The firm looked at three demand scenarios: 1) low demand growth, 2) mid-level demand growth, and 3)
high demand growth. In the mid-level demand growth scenario, the use of natural gas rises at a
consistent rate doubling within a decade and tripling by the end of the forecast period, and is
considered the scenario that has developed in the two years since the report was released.
In the mid-level demand growth scenario, the firm predicts more use of natural gas in electricity
generation in Nova Scotia as well as increased industrial usage. It is based on the actual observed rate
of growth in the Maritimes over the five years before the forecast period.
Figure 5 shows the mid-level demand and supply dynamic in the Maritimes through 2028. The in-year
deviations are related to peak and trough demand swings.
14,556
38,719
167,046
78,214
2004 2013
Natural gas and NGL use (NB & NS) Natural gas production (NB & NS)
Natural gas use
Natural gas use
Natural gas
production
Natural gas
production

NB & NS NATURAL GAS SUPPLY AND DEMAND REPORT 2015-2025 P A G E |11
Figure 5: Mid-level natural gas demand and steep decline in production scenario, MMcfd Maritime Provinces
*The ICT report was prepared before Encana cut its Deep Panuke reserves estimate by 50 percent. It is likely that natural gas production from sources in the Maritimes is already below total demand for natural gas in the region.
Source: The Future of Natural Gas Supply for Nova Scotia (2013). ICF Consulting Canada, Inc.
The ICF report also looked at various different domestic natural gas production projections from steep
decline to significant expansion. Given the fact that provincial governments in New Brunswick and Nova
Scotia have outlawed hydraulic fracturing and the uncertain investment climate for offshore gas
development it is likely the steep decline in production scenario is the most realistic.
The steep decline in production scenario is based on the actual trend in New Brunswick and Nova Scotia.
In the ICF report, domestic gas from McCully, Sable and Deep Panuke drops to 185 MMcfd in 2020 and
less than 50 MMcfd by 2035. It is important to point out this report was published before Encana Corp.,
announced it was cutting the Deep Panuke’s reserve estimate by 50 percent to 200 billion cubic feet
(See Section 3.1). This could mean that offshore Nova Scotia gas could drop to near zero by 2020. In
addition, the well owners may shut in prior to full depletion when production drops to an uneconomic
level.
In addition, the ICF report was prepared prior to legislation enacting a moratorium on hydraulic
fracturing in New Brunswick. ICF had assumed the McCully field would expand its production
moderately during the forecast period. That is now in jeopardy due to the moratorium.
Section 3 discusses the various supply options in more detail.
-
100
200
300
400
500
600
700
Jan
-10
Oct
-10
Jul-
11
Ap
r-1
2
Jan
-13
Oct
-13
Jul-
14
Ap
r-1
5
Jan
-16
Oct
-16
Jul-
17
Ap
r-1
8
Jan
-19
Oct
-19
Jul-
20
Ap
r-2
1
Jan
-22
Oct
-22
Jul-
23
Ap
r-2
4
Jan
-25
Oct
-25
Jul-
26
Ap
r-2
7
Jan
-28
Oct
-28
Demand for natural gas Supply from sources in the Maritimes*
Actual Projected

NB & NS NATURAL GAS SUPPLY AND DEMAND REPORT 2015-2025 P A G E |12
Figure 6 shows the supply/demand dynamic for the mid-level demand growth and steep decline in
production scenario. Mid demand growth with steep decline in production (the current path) shows
domestic demand would be five times domestic production by 2025 (again this was before the 50
percent cut in Deep Panuke reserves).
In the ICF report there is no scenario in which domestic production continues to decline and demand in
the Maritimes is covered. Even under the scenario with slower production decline the mid and high
demand growth scenarios would require substantial natural gas imports. Section 4 discusses how the
impact of large scale natural gas imports would impact the competitiveness of natural gas as a fuel
source in the region.
Figure 6: Shortfall in natural gas production relative to natural gas demand in the Maritimes by 2025 MMcfd - Using the ICF mid-level demand growth and steep decline in production forecast*
*This projection was developed before the announcement that Deep Panuke gas reserves were 50 percent less than expected. Source: The Future of Natural Gas Supply for Nova Scotia (2013). ICF Consulting Canada, Inc.
2.3 Potential big drivers of natural gas demand through 2025
The base case in the ICF report assumes no real demand growth. This is unrealistic particularly if natural
gas as a fuel source remains competitive. As shown in Figure 2 on page 7, Enbridge Gas NB and Heritage
Gas have only begun to tap the residential and commercial markets in the communities in which they
have pipeline infrastructure. In addition, there could be continued demand growth among large
industrial users.
500 MMcfd
189 MMcfd
103 MMcfd
340 MMcfd
2025 forecast*
2010 actual
Natural gas production (Maritimes) Natural gas demand (Maritimes)
Natural gas demand
Natural gas production
Natural gas demand
Natural gas production

NB & NS NATURAL GAS SUPPLY AND DEMAND REPORT 2015-2025 P A G E |13
Electricity generation
In its mid-level demand growth scenario, the ICF report assumes some of Nova Scotia’s coal-fired
electricity generation will convert to natural gas, as Tufts Cove has done in Nova Scotia. There is a limit
to this potential in Nova Scotia given Emera’s investment in Labrador hydroelectricity. New Brunswick
also has the potential for conversion to natural gas-fired generation particularly with the Coleson Cove
generating station in Saint John.
In October 2014, NB Power CEO Gaëtan Thomas stated that “a local source of natural gas would be 20
to 25 per cent cheaper for utilities” compared to oil4. Natural-gas fired electricity generation is a low
cost source of power and it significantly reduces greenhouse gas emissions compared to both coal and
oil-fired electricity generation.
LNG Export Facilities
The largest potential source of demand in the Maritimes is the proposed export of natural gas via LNG
terminals. There are at least four projects with some level of traction including the conversion of the
Canaport facility in Saint John to an export facility, the Goldboro LNG project, the proposed H-Energy
LNG export terminal in Melford Point, and Bear Head which has its permitting process underway.
Repsol has filed for an environmental permit related to the potential conversion of the Saint John
facility.
If one or more of the LNG export terminals is constructed it will drive substantial new demand for
natural gas in the region.
Other industrial uses There are other large industrial users that could convert to natural gas in the near future assuming it
remains a lower cost fuel choice. In Nova Scotia there are a number of large firms that have not
converted to natural gas and even in New Brunswick, where many of the largest industrial firms have
converted, there are more with potential such as the Brunswick Smelter (lead and silver) in Belledune.
Firms not directly on the pipeline infrastructure have been able to access natural gas using the CNG
services that are now available in the region.
There has also been speculation related to petrochemical, fertilizer and other large scale projects
requiring natural gas. These industries are highly sensitive to the price of energy and would require low
cost natural gas to be viable.
4 Canadian Press. October 7, 2014.

NB & NS NATURAL GAS SUPPLY AND DEMAND REPORT 2015-2025 P A G E |14
3. Sources of natural gas supply to the region
It is clear from Section 2 that New Brunswick and Nova Scotia should generate significant demand for
additional natural gas over the next decade including new industrial uses for the gas. However, there
will be significant shortfalls in regional production of natural gas necessitating new sources to meet
demand. This is already the case. Regional demand is in the range of 250 MMcfd. Both Deep Panuke
and McCully are shut-in during the summer (to sell the limited supply of gas during peak demand) and
therefore total supply is only in the range of 150 MMcfd (from Sable).
This section looks at the potential supply options for natural gas and Section 4 considers the implications
of the various options.
3.1 Offshore Nova Scotia – Sable Island, Deep Panuke and new fields
Offshore Nova Scotia – Sable Island
Sable Island, the field off Nova Scotia that provided the initial source of natural gas for the region, is
nearing the end of its production. While ExxonMobil Canada has not publicly indicated when the field
will wind down, it has been on a decline for several years. In 2009, the field produced 3,300 million
cubic metres (according to Statistics Canada) and by 2013 it was down to 1,700 million cubic metres. In
a 2014 regulatory filing, Nova Scotia Power Inc. forecasted that natural gas would stop flowing from the
Sable Offshore Energy Project by October 2016 or about nine years before the expected end of life for
the field.
It remains the case that ExxonMobil and its partners - Shell Canada Ltd., Imperial Oil Resources Ltd.,
Pengrowth Energy Corp. and Mosbacher Operating Ltd. – decided in 2010 that it was uneconomical to
proceed with plans to expand Sable production5.
Offshore Nova Scotia – Deep Panuke
The Deep Panuke field came on-stream in August 2013 with an expected reserve of 400 billion cubic
feet, but in February 2015 Encana Corp., the gas field’s owner, said it was cutting the field’s reserve
estimate by 50 percent to 200 billion cubic feet. Since the announcement, Encana has stated it will
produce just 80 billion cubic feet of natural gas from the field. Seasonal production will serve the
winters of 2015 and 2016. To put that into context, Deep Panuke produced 69 billion cubic feet of gas
between August 2013 and December 2014. Encana will not say specifically when production will cease
because there are a number of factors that will impact the timing. For example, the firm announced that
Deep Panuke would primarily service seasonal demand to meet winter heating needs allowing them to
charge higher prices.
5 Source: Cited in Halifax Chronicle Herald. August 21, 2014.

NB & NS NATURAL GAS SUPPLY AND DEMAND REPORT 2015-2025 P A G E |15
Offshore Nova Scotia – New production
There remains considerable natural gas in place under the waters offshore Nova Scotia. In March 2014,
the Nova Scotia Energy Minister stated the government estimates there are “about 120 trillion cubic
feet of natural gas and eight billion barrels of oil in the offshore.” While this may be true, there are
serious questions about the economic viability of developing offshore given the lower cost of onshore
natural gas supply in North America as a result of shale gas development which the provincial
government has chosen to prohibit.
However, there is still some limited interest in exploration particularly where there could be gas and oil
opportunities. In December 2014, Australia-based Woodside Petroleum announced it would be joining
the BP consortium looking to explore offshore Nova Scotia. Woodside Petroleum is a particularly
interesting partner as it has 25 years of LNG export experience. BP remains the main operator with a 40
percent interest while Hess has 40 percent and Woodside the remaining 20 percent. According to
media reports, BP is not planning to drill its first exploratory well until the second half of 2017 and it is
looking for oil. Any associated gas that is found is unlikely to be economical compared to onshore gas
coming from areas such as Marcellus Shale.
3.2 Frederick Brook Shale/Hiram Brook Sands
The amount of gas being produced from the Hiram Brook sands at the McCully Field in the Sussex region
has been slowly declining since the field was connected to the Maritime and Northeast Pipeline in 2007
(based on Statistics Canada published production figures). The declines are to be expected due to a
combination of ongoing production and few new wells drilled since 2007. However, the amount of
production from McCully is limited relative to the demand for gas in New Brunswick and Nova Scotia. By
way of comparison, McCully produced 78 million cubic metres of natural gas in 2014 compared to 3,315
million cubic metres in Nova Scotia’s offshore (Figure 7).
Figure 7: Monthly natural gas production in New Brunswick, million cubic metres
Source: Statistics Canada CANSIM Table 131-0001.
0
5
10
15
20
25
30
De
c-0
7
Ap
r-0
8
Au
g-0
8
De
c-0
8
Ap
r-0
9
Au
g-0
9
De
c-0
9
Ap
r-1
0
Au
g-1
0
De
c-1
0
Ap
r-1
1
Au
g-1
1
De
c-1
1
Ap
r-1
2
Au
g-1
2
De
c-1
2
Ap
r-1
3
Au
g-1
3
De
c-1
3
Ap
r-1
4
Au
g-1
4
De
c-1
4

NB & NS NATURAL GAS SUPPLY AND DEMAND REPORT 2015-2025 P A G E |16
The Frederick Brook shale is the source rock for the Hiram Brook sands and extends northeast from the
Sussex region. The New Brunswick Department of Energy and Mines suggests there could be 80 Tcf
(trillion cubic feet) of gas in place. Further exploration expenditures would be required to determine the
amount of gas that is actually recoverable from the shale. If successful, based upon the development of
other North American shales, if five to 10 percent of the gas is recoverable, it could provide decades’
worth of natural gas to the region.
However, the time frame for onshore development is uncertain. It would take several years of drilling to reach this level of production, and there is currently a moratorium on hydraulic fracturing in New Brunswick.
3.3 LNG imports
New Brunswick is already a significant importer of LNG through the Canaport terminal in Saint John. In
2010, more natural gas was supplied via LNG than from Sable Island (388 MMcfd from Canaport
compared to 340 MMcfd from Sable in an average winter month in 2010). The supply of natural gas via
LNG is not the problem. It is the price. Figure 8 shows the estimated landed price for natural gas at
various LNG import terminals around the world in January 2015. Canaport received the highest price for
its gas per unit of any location in the world as it was used to supply peak New England demand. Even in
off peak times, imported LNG can be considerably more expensive than domestic gas, depending on
world market pricing.
Figure 8: World LNG estimated January 2015 landed prices (US dollars)*
*The highest landed price for LNG in the world was at Saint John, New Brunswick. Source: Waterborne Energy, Inc. Figures expressed in $US dollars.

NB & NS NATURAL GAS SUPPLY AND DEMAND REPORT 2015-2025 P A G E |17
3.4 Imported U.S. natural gas
The shortfall in natural gas supply in the Maritimes in the coming years will be filled, at least initially, by
natural gas imported from the United States – specifically natural gas sourced from hydraulically
fractured Marcellus shale. There is considerable interest in bringing this natural gas to service the New
England market and by extension the gas could also be used for demand in Maine and the Maritimes.
Already, several billion dollars’ worth of
pipeline infrastructure is being built or is
in the permitting phase to fix the
bottlenecks that are holding back this
option.
Spectra Energy, majority owner of the
existing Maritimes & Northeast Pipeline,
has stated its interest in bringing this gas
northward by 2017.
Their Atlantic Bridge Project which is a
proposed expansion of the Algonquin Gas
Transmission and Maritimes & Northeast
Pipeline systems to connect North
American natural gas supplies with
markets in the New England states and
the Maritime Provinces.
According to Spectra Energy, “Algonquin
and Maritimes are strategically positioned to answer the region’s need for additional pipeline
infrastructure as well as much needed reliable, clean-burning natural gas supplies by November 2017.”
Assuming the project develops as planned and achieves environmental permitting, Marcellus shale gas
could be flowing into New Brunswick as early as November 2017. However, there are implications of
this option which are discussed in Section 4.
There are other pipeline expansion projects at various stages of development.
3.5 Importing natural gas from western Canada
The final option is to import natural gas from western Canada. Some commentators have suggested the
Trans Canada Energy East Pipeline corridor be twinned to include a natural gas line, but there is no
mention this is part of its plans. The earliest in-service date for the oil pipeline as per its current NEB
filing would be 2020.
Figure 9: Spectra Energy’s Atlantic Bridge Project
Source: Spectra Energy.

NB & NS NATURAL GAS SUPPLY AND DEMAND REPORT 2015-2025 P A G E |18
Western Canadian gas could be imported into the Maritimes via the United States using the
Portland Natural Gas Transmission System which currently supplies industrial and electric-power
generation markets in Maine, New Hampshire, Vermont and Massachusetts.
The PNGTS is 474 km in length connecting from the Trans-Québec and Maritimes pipeline at the
Québec-New Hampshire border and continuing through New Hampshire, Maine and into Massachusetts
near Boston. At Westbrook, Maine it connects to the M&NP.
3.5 Additional onshore shale gas development in New Brunswick
Section 3.2 looked at the potential of producing natural gas in the McCully field near Sussex, New
Brunswick. The potential for shale gas development extends well beyond McCully. In 2010, Texas-based
SWN began an exploration program covering more than 2.5 million net acres in order to test new
hydrocarbon basins. Since 2010, the firm has conducted airborne gravity and magnetic surveys, surface
geochemistry surveys and completed a broad-based seismic program.
SWN was planning to drill two test wells in 2015 but has postponed this due to the moratorium on
hydraulic fracturing in New Brunswick.
The timeframe for future onshore development is uncertain. As there is a moratorium on hydraulic
fracturing in New Brunswick, it is unclear if or when this resource will be developed to supply the need
in this region.
3.6 Additional onshore shale gas development in Nova Scotia
Nova Scotia’s shale gas and coalbed methane plays are smaller but still could be a significant source of
natural gas to supply domestic and export markets. A 2009 study indicated there is 69 Tcf worth of gas
in place on the Windsor land block in Nova Scotia6.
Nova Scotia also has significant reserves of coalbed methane (CBM). According to figures published by
the Canadian Gas Potential Committee, Nova Scotia has “probable economically recoverable CBM
reserves” of 50 Tcf.
The Nova Scotia Department of Energy reports the province currently has seven conventional oil and gas
exploration agreements, one exploration agreement for coal gas, and one production agreement for
coal gas.
However, there is currently an outright ban on hydraulic fracturing in Nova Scotia which makes it
virtually impossible to develop the province’s shale gas resources.
6 A Primer for Understanding Canadian Shale Gas. National Energy Board. 2009.
NB & NS NATURAL GAS SUPPLY AND DEMAND REPORT 2015-2025 P A G E |19
4. Potential implications for the regional economy
4.1 Are we facing a big natural gas price spike?
The biggest risk to the economy in New Brunswick and Nova Scotia from the reduction in local natural
gas production is the impact on the end price for industrial, commercial and residential users. Natural
gas is a commodity and the commodity price is set in open markets. The cost of transportation and
distribution of the gas is added to the commodity price from is supply point, reflecting the distance
between the commodity and the end user markets.
As discussed earlier, global LNG prices are on average well above the domestic price in North America.
Any big shift to LNG as the primary source of natural gas in the Maritimes could drive up the price
significantly.
As for the importation of U.S. or western Canadian gas, experts have differing opinions whether the
price will rise or fall and in what timeframe. Once Sable and Deep Panuke gas is shut in importing
becomes the only option. Even in the short term, the Maritimes will be a captive market by October
2016 going into the winter months, as it will be unable to fulfill its own domestic demand.
The ICF report for the Nova Scotia government provided an estimate of how the importing of natural gas
from the United States could impact the final price of natural gas. The current approved toll for M&NP-
CA is $0.67/MMBtu plus fuel retainage of 0.3 percent. This rate applies to both forward haul and
backhaul service. If the pipeline is reversed and gas flows north into New Brunswick, ICF projects that
transportation costs will rise to $3.67/MMBtu, plus the local distribution costs and the market rate for
the commodity itself (see Table 3).
In addition, customers on the Enbridge and Heritage Gas local distribution systems will add those tolls to
their local distribution fees. Compared to other areas in North America with mature natural gas
distribution markets, the Maritimes will have the highest costs of any mainland area.
Many years in the future, beyond the timeframe of this report, a glut of natural gas may occur and
stabilize prices in the region. In the meantime, as soon as Spring 2017, domestic natural gas will be
unavailable resulting in higher natural gas prices here relative to other parts of North America.

NB & NS NATURAL GAS SUPPLY AND DEMAND REPORT 2015-2025 P A G E |20
Table 3: Estimated Pipeline Costs from Marcellus to New Brunswick and Nova Scotia ($CDN)* $/MMBtu at 80 percent load factor (excluding local distribution charge charges) Reservation Fuel Total Marcellus to Dracut via TGP Bullet and Constitution $1.81 $0.10 $1.91
Dracut to Baileyville via M&NP-US $0.69 $0.05 $0.74
Baileyville to Maritimes Canada via M&NP-CA $1.00 $0.02 $1.02
Transportation costs per MMBtu** $3.67
*Note: Fuel assumes $5.00 gas price in Marcellus. ** The rate is a postage stamp rate, so that the rate does not vary based upon the distance of haul, and applies to deliveries anywhere along the pipeline, including off the laterals. Source: The Future of Natural Gas Supply for Nova Scotia (2013). ICF Consulting Canada, Inc.
4.2 Economic impact from new onshore gas development
In addition to supporting competitive natural gas prices, exploration and production is also a major
source of economic activity. A report prepared for the Nova Scotia government in 2010 by Stantec
found that between 1996 and 2007, offshore exploration and production supported an average of 3,200
full time equivalent jobs per year in the province and $1.5 billion worth of royalty-related revenues7.
These direct economic benefits disappear as local production is curtailed and eventually ended.
The same economics apply to potential new onshore natural gas development. Indeed, one of the main
economic benefits from developing onshore shale gas is the new, high value economic activity that
occurs from its exploration and production. A study looking at the economic impact of the Marcellus
shale gas industry in Pennsylvania found that its development in the state boosted gross state product
(GSP) by more than $11 billion ($US) in 2010 while generating nearly $1.1 billion ($US) worth of state
and local taxes. This represents an amount equivalent to 1.7 percent of GSP in Pennsylvania. The report
also forecasted the industry would be generating $20 billion ($US) worth of GSP and over $2 billion
($US) per year in state and local taxes by 20208.
It is difficult to estimate the potential economic impact from the development of shale gas in New
Brunswick because of the limited track record of the industry in the province.
7 12-Year Retrospective of Natural Gas Production in Nova Scotia. Stantec. April 2010.
8 Source: The Pennsylvania Marcellus Natural Gas Industry. Pennsylvania State University College of Earth and
Mineral Sciences. July 2011.

NB & NS NATURAL GAS SUPPLY AND DEMAND REPORT 2015-2025 P A G E |21
A 2014 study9 attempted to quantify the potential
based on existing oil and gas exploration and
production in New Brunswick and by using studies on
shale gas development in Quebec and British
Columbia (Figure 10). In addition, the report used the
“per well development cost estimates” developed in a
2013 Deloitte LLP study entitled, Shale Gas Supply
Chain Opportunities in New Brunswick.
The report is based on a fairly robust estimate of new
shale gas wells starting with 15 new wells drilled in
Year 1 increasing to 75 new wells by Year 5. Based on
these estimates and the economic benefits arising
from the construction of a natural gas processing
facility, the report estimates the industry could
generate $2.2 billion worth of new investment over
the five years, boost provincial gross domestic
product (GDP) by $1.6 billion and support over 1,600 full time equivalent jobs by Year 5. In addition,
average employment income would be double the current level for the average worker in New
Brunswick.
Further, based on these estimates, the industry was expected to generate over $425 million worth tax
and royalty revenue to all three levels of government.
4.3 Mitigating price swings: Natural gas storage
One of the ways to mitigate large swings in price between peak and off peak seasons is to develop
natural gas storage. Salt caverns are the North American standard and the U.S. government reserves
are stored in salt caverns. Other than storage tanks at the Canaport LNG import facility, there is no such
capability in the Maritimes. One project is proposed for Nova Scotia.
Alton Natural Gas Storage LP is developing an underground natural gas storage facility and associated
pipelines near Alton, Nova Scotia. The Alton Natural Gas Storage facility will initially consist of three salt
caverns to store natural gas until it is needed to meet peak demand. According to the firm the 1,000
metres’ deep caverns will take two to three years to complete.
A hold on the project was recently lifted and the $14 million project is now proceeding.
9 Source: Potential New Brunswick Energy Infrastructure and Natural Resource Investment Review (2015-2020).
Jupia Consultants Inc. June 2014.
Figure 10: Estimated five-year cumulative economic impact from the growth of the shale gas industry in New Brunswick ($M)
Source: Potential New Brunswick Energy Infrastructure and Natural Resource Investment Review (2015-2020).
$425.5
$427.4
$1,622.5
$2,200.0
Total taxes androyalties
Total labour income
Total GDP in NewBrunswick
Total industry output

NB & NS NATURAL GAS SUPPLY AND DEMAND REPORT 2015-2025 P A G E |22
4.4 Natural Gas and new investment in the region
The development of shale gas in North America has significantly reduced the cost of natural gas and that
has triggered substantial new investment in manufacturing and other sectors. According to the
American Chemical Council, lower cost natural gas has enabled $138 billion ($US) worth of new
investment in the United States alone10.
The natural gas supply and demand dynamic in the Maritimes could lead to the region missing out on its
share of this large scale investment. As outlined in this document, the development of onshore and
offshore natural gas itself drives substantial investment, jobs and tax revenues. At the same time, a
stable and competitive price for natural gas would support investment in other sectors of the economy.
5. Conclusion
Natural gas has become an important part of the energy mix in the Maritime Provinces. It is the fastest
growing fuel in the region (by usage) and there are considerable opportunities for continued expansion
in the years ahead. It is also the cleanest burning fossil fuel, and has the highest BTU efficiency, both
leading to lower greenhouse gas (GHG) emissions relative to other fossil fuels.
The domestic supply of natural gas from Sable, Deep Panuke and McCully combined is declining and is
expected to fall well below regional demand in a few short years. It already does during parts of the
year. This will force new sources of supply that are currently not available via existing infrastructure.
The most likely source will be the importation of natural gas from the shale plays in the United States
through a reversal of the Maritimes and Northeast Pipeline. This expanded capacity will not be available
prior to November 2017 at its earliest.
There is debate as to what the price of imported natural gas will be, however, the tolls associated with
the various pipelines to reach the Maritimes will add over $3.50/MMBtu, plus the local distribution
charges, to the cost of the gas itself.
For large industry, institutional users, small businesses and residential users, this will put our region at a
competitive disadvantage for the landed price of natural gas, the cleanest burning fossil fuel.
From a demand perspective, adoption has been significant since its inception in 1999. Future use of
natural gas for residential use could be considerable as currently less than 10 percent of households and
businesses use natural gas versus up to 90+ percent in other parts of Canada. Increased use by small
and medium businesses as well as large industry looks promising if a stable, competitive supply source(s)
can be secured.
10
Shale Gas and New U.S. Chemical Industry Investment. American Chemistry Council. April 2015.

© Copyright 2015