Embed Size (px)
Citation preview

Natural Gas: Fuel of Choice Indefinitely?
By:John Harpole
Presentation to:
CREA Energy Innovations Summit
October 28, 2013
2
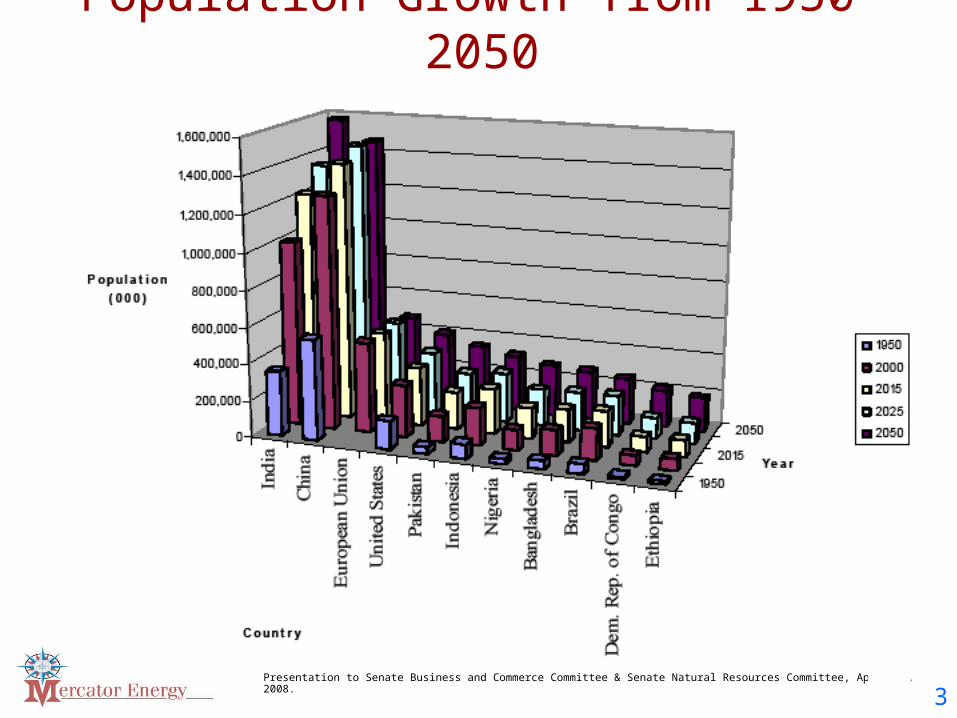
Presentation to Senate Business and Commerce Committee & Senate Natural Resources Committee, April 15, 2008.
Population Growth from 1950-2050
3
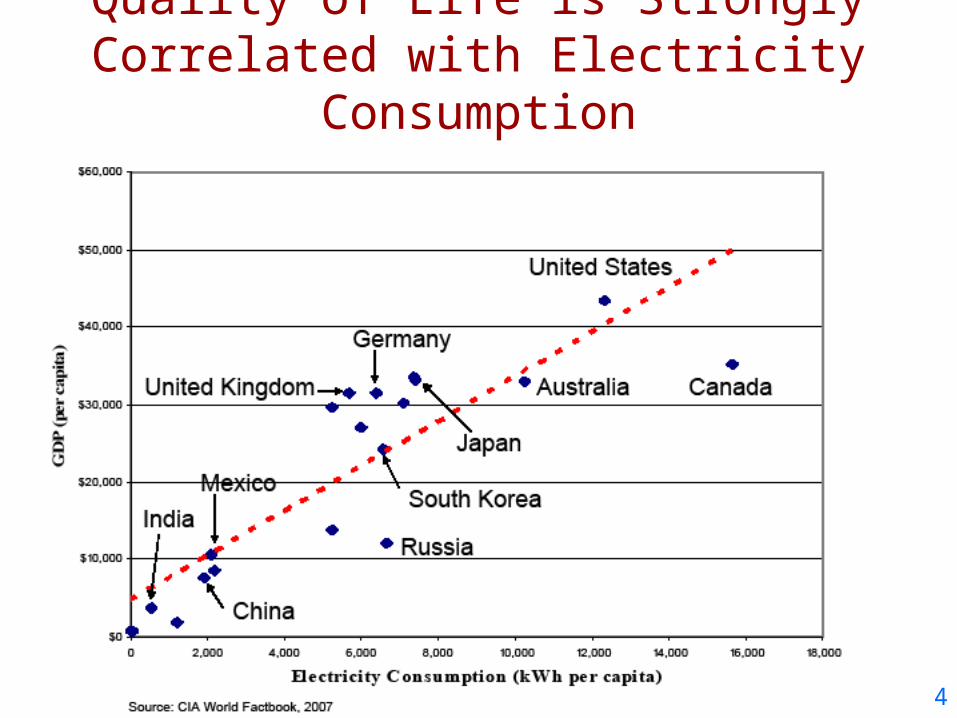
Quality of Life is Strongly Correlated with Electricity Consumption
4
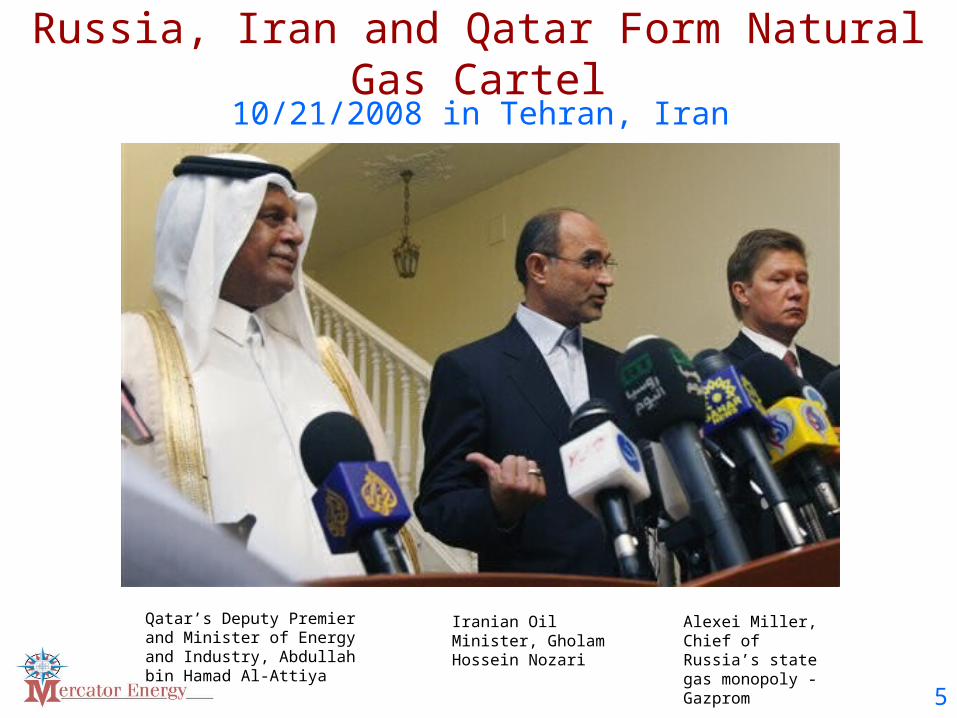
Russia, Iran and Qatar Form Natural Gas Cartel
Iranian Oil Minister, Gholam Hossein Nozari
Alexei Miller, Chief of Russia’s state gas monopoly - Gazprom
Qatar’s Deputy Premier and Minister of Energy and Industry, Abdullah bin Hamad Al-Attiya
5
10/21/2008 in Tehran, Iran
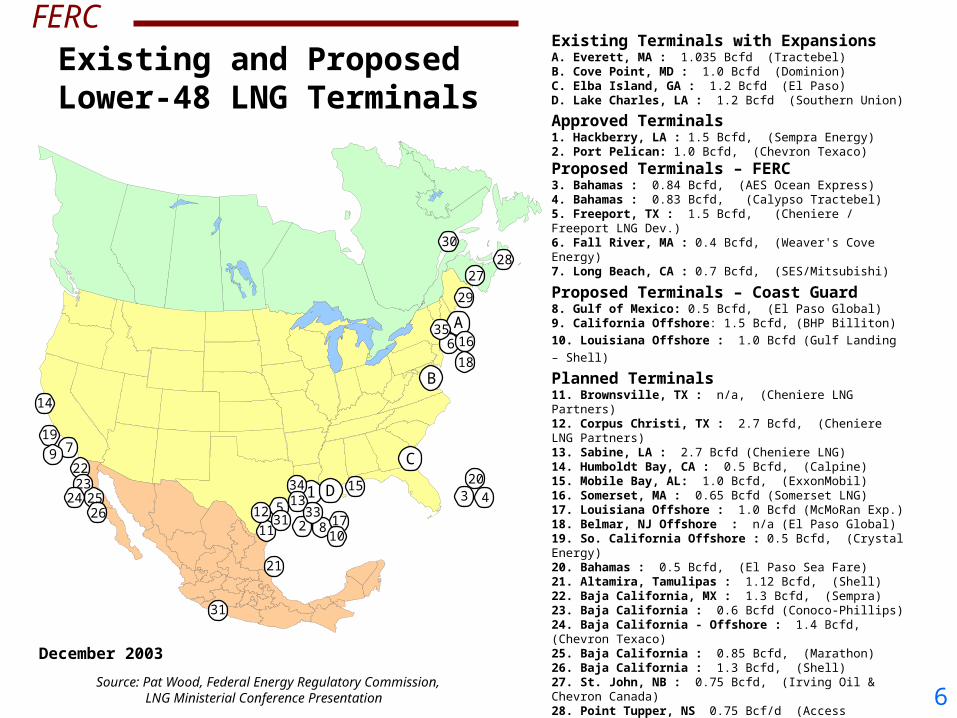
Existing Terminals with ExpansionsA. Everett, MA : 1.035 Bcfd (Tractebel)B. Cove Point, MD : 1.0 Bcfd (Dominion)C. Elba Island, GA : 1.2 Bcfd (El Paso)D. Lake Charles, LA : 1.2 Bcfd (Southern Union)
Approved Terminals1. Hackberry, LA : 1.5 Bcfd, (Sempra Energy)2. Port Pelican: 1.0 Bcfd, (Chevron Texaco)
Proposed Terminals – FERC3. Bahamas : 0.84 Bcfd, (AES Ocean Express)4. Bahamas : 0.83 Bcfd, (Calypso Tractebel)5. Freeport, TX : 1.5 Bcfd, (Cheniere / Freeport LNG Dev.)6. Fall River, MA : 0.4 Bcfd, (Weaver's Cove Energy)7. Long Beach, CA : 0.7 Bcfd, (SES/Mitsubishi)
Proposed Terminals – Coast Guard8. Gulf of Mexico: 0.5 Bcfd, (El Paso Global)9. California Offshore: 1.5 Bcfd, (BHP Billiton)10. Louisiana Offshore : 1.0 Bcfd (Gulf Landing – Shell)
Planned Terminals11. Brownsville, TX : n/a, (Cheniere LNG Partners)12. Corpus Christi, TX : 2.7 Bcfd, (Cheniere LNG Partners)13. Sabine, LA : 2.7 Bcfd (Cheniere LNG)14. Humboldt Bay, CA : 0.5 Bcfd, (Calpine)15. Mobile Bay, AL: 1.0 Bcfd, (ExxonMobil)16. Somerset, MA : 0.65 Bcfd (Somerset LNG)17. Louisiana Offshore : 1.0 Bcfd (McMoRan Exp.)18. Belmar, NJ Offshore : n/a (El Paso Global)19. So. California Offshore : 0.5 Bcfd, (Crystal Energy)20. Bahamas : 0.5 Bcfd, (El Paso Sea Fare)21. Altamira, Tamulipas : 1.12 Bcfd, (Shell)22. Baja California, MX : 1.3 Bcfd, (Sempra) 23. Baja California : 0.6 Bcfd (Conoco-Phillips)24. Baja California - Offshore : 1.4 Bcfd, (Chevron Texaco)25. Baja California : 0.85 Bcfd, (Marathon)26. Baja California : 1.3 Bcfd, (Shell)27. St. John, NB : 0.75 Bcfd, (Irving Oil & Chevron Canada)28. Point Tupper, NS 0.75 Bcf/d (Access Northeast Energy)29. Harpswell, ME : 0.5 Bcf/d (Fairwinds LNG – CP & TCPL)30. St. Lawrence, QC : n/a (TCPL and/or Gaz Met)31. Lázaro Cárdenas, MX : 0.5 Bcfd (Tractebel)32. Corpus Christi, TX : 1.0 Bcfd (ExxonMobil)33. Gulf of Mexico : 1.0 Bcfd (ExxonMobil)34. Sabine, LA : 1.0 Bcfd (ExxonMobil)35. Providence, RI ; 0.5 Bcfd (Keyspan & BG LNG)
Existing and Proposed Lower-48 LNG Terminals
December 2003
FERC
A
C
1 3 4
2 8
27
618
20
5
11
21
12
197
14
B
D
16
17
9
2830
29
31
10
152223
24 2526 31
33
3413
35
Source: Pat Wood, Federal Energy Regulatory Commission, LNG Ministerial Conference Presentation 6
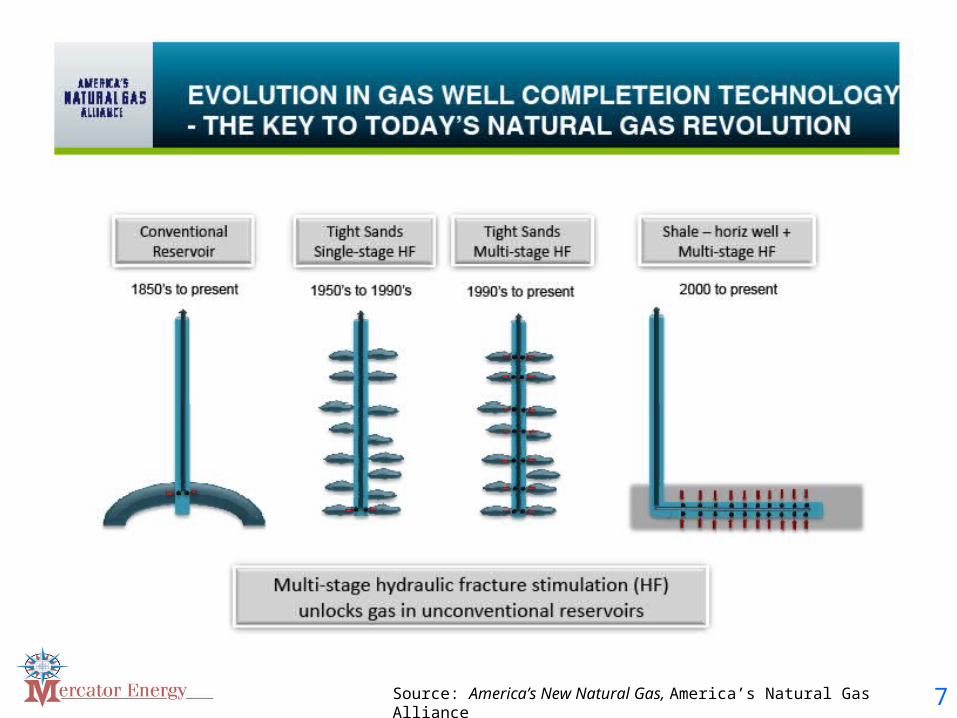
4Source: America’s New Natural Gas, America’s Natural Gas Alliance 7
8
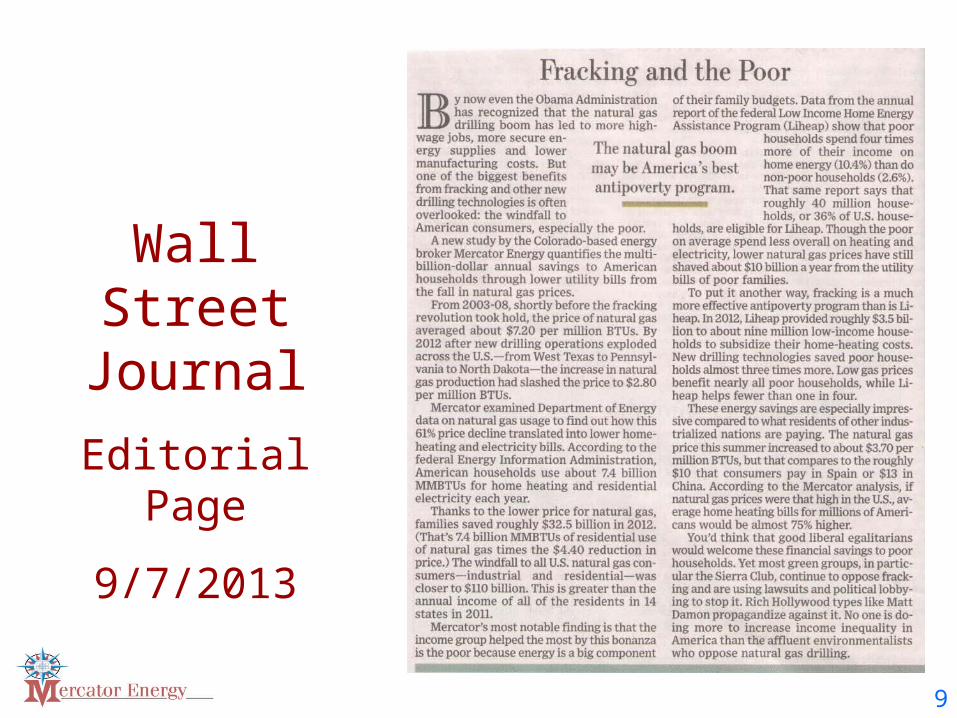
Wall Street Journal
Editorial Page
9/7/2013
9

Fox News Coverage One Month Ago
10
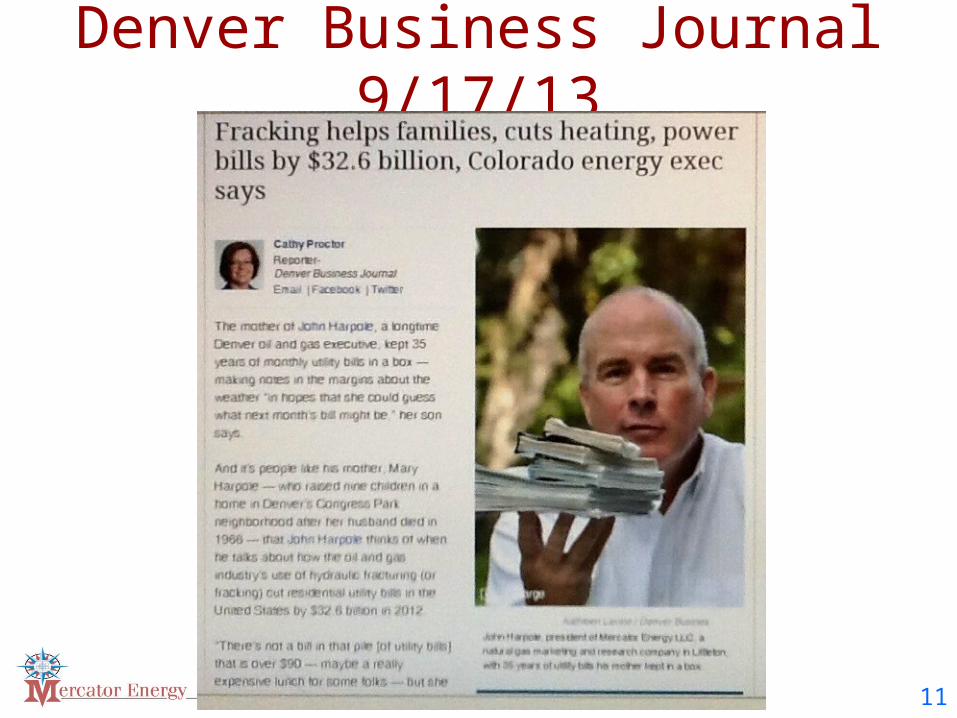
Denver Business Journal 9/17/13
11
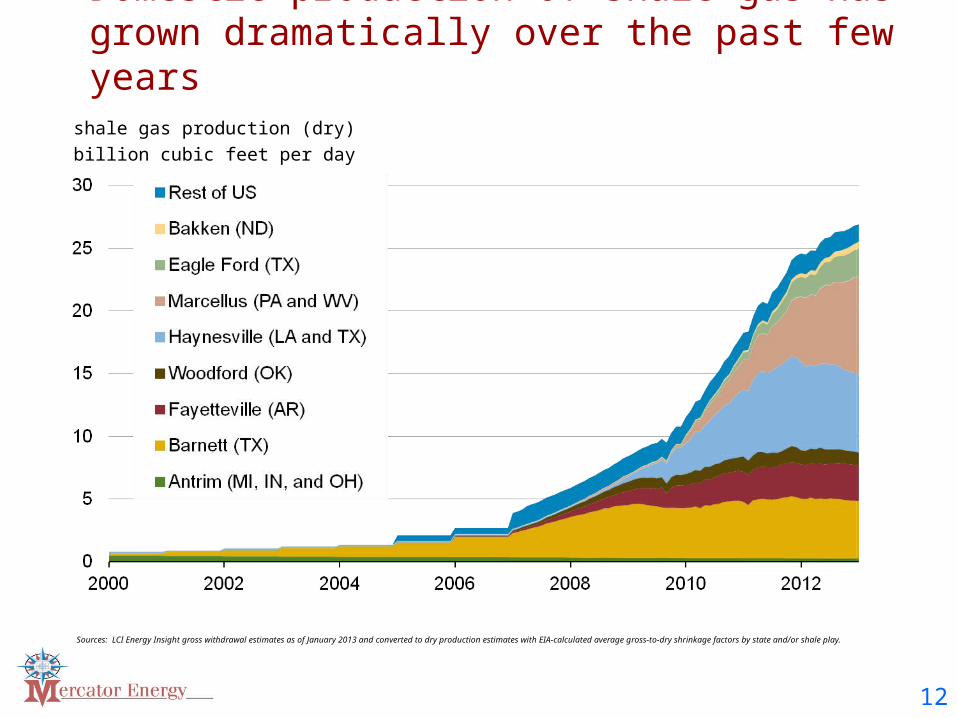
Domestic production of shale gas has grown dramatically over the past few years
12
shale gas production (dry)
billion cubic feet per day
Sources: LCI Energy Insight gross withdrawal estimates as of January 2013 and converted to dry production estimates with EIA-calculated average gross-to-dry shrinkage factors by state and/or shale play.
Adam Sieminski , FLAME March 13, 2013
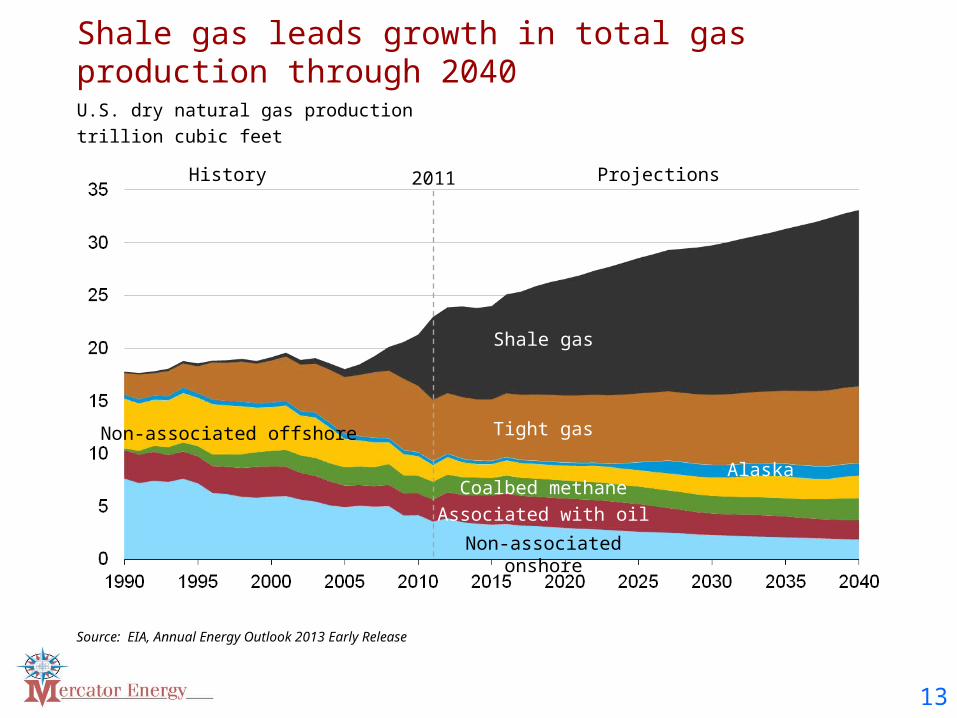
Shale gas leads growth in total gas production through 2040
13
U.S. dry natural gas production
trillion cubic feet
Source: EIA, Annual Energy Outlook 2013 Early Release
Associated with oil
Coalbed methane
Tight gas
Shale gas
Alaska
Non-associated onshore
Non-associated offshore
ProjectionsHistory 2011
Adam Sieminski , FLAME March 13, 2013
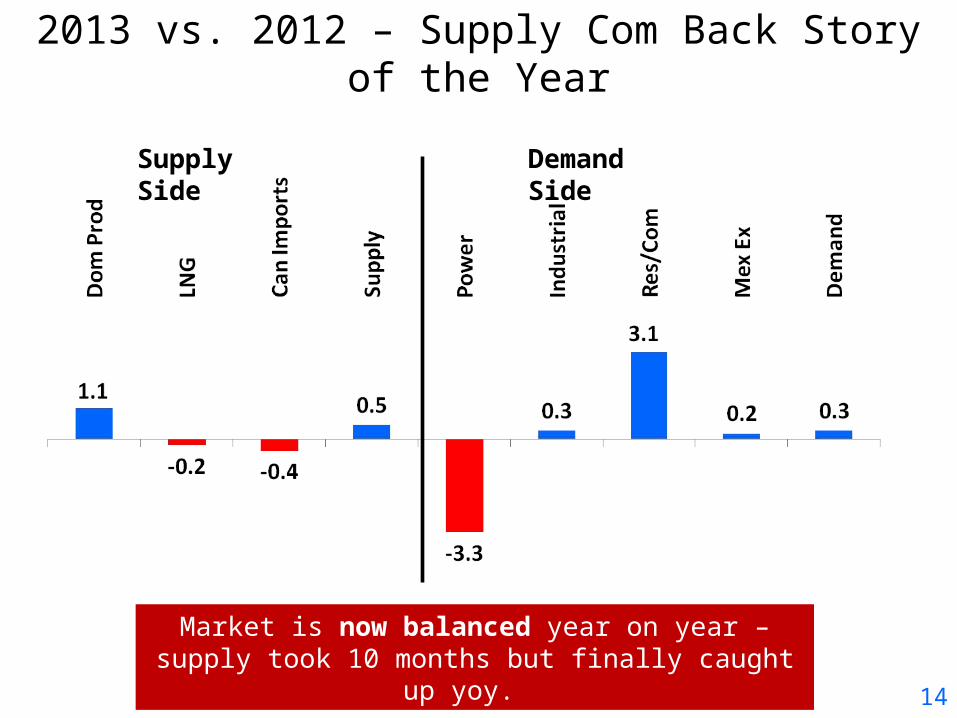
2013 vs. 2012 – Supply Com Back Story of the Year
Supply Side Demand Side
Source: BENTEK Supply & Demand Report
Market is now balanced year on year – supply took 10 months but finally caught up yoy.
14
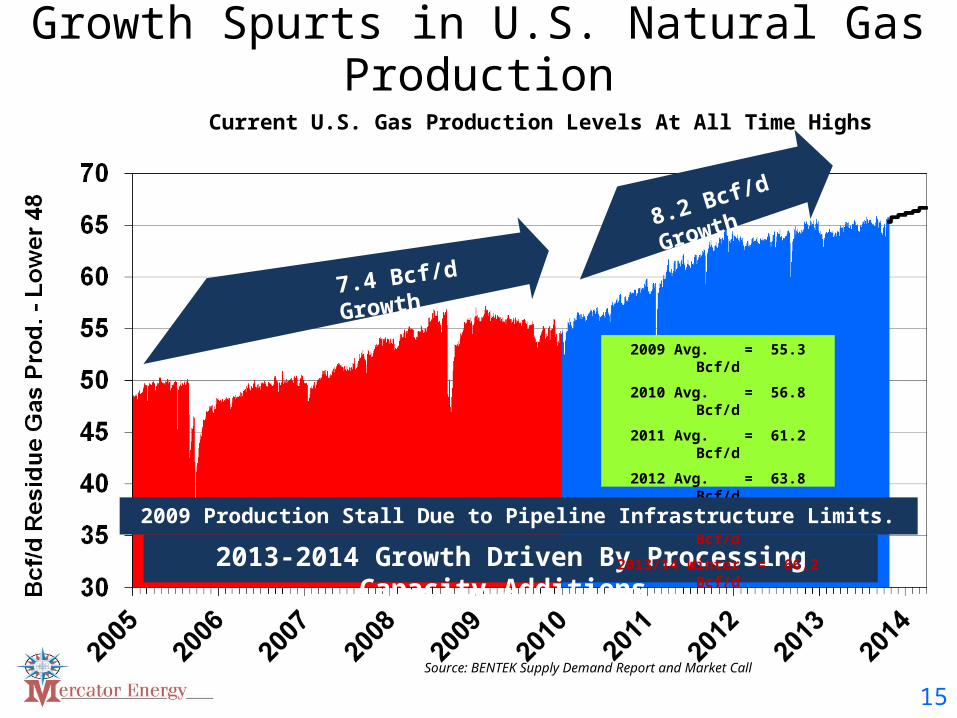
Growth Spurts in U.S. Natural Gas Production
Current U.S. Gas Production Levels At All Time Highs
7.4 Bcf/d Growth
8.2 Bcf/d Growth
2013-2014 Growth Driven By Processing Capacity Additions.
Source: BENTEK Supply Demand Report and Market Call
2009 Avg. = 55.3 Bcf/d
2010 Avg. = 56.8 Bcf/d
2011 Avg. = 61.2 Bcf/d
2012 Avg. = 63.8 Bcf/d
2013 Est. = 65.0 Bcf/d
2013/14 Winter = 66.2 Bcf/d
2009 Production Stall Due to Pipeline Infrastructure Limits.
15
8/+1
173/+12
39/-2
53/+4
13/-2
7/+0
33/+2
22/+5
35/+9
118/+21
5/+2
3/-2
188/-28
33/+7
6/+1
51/+15
16/-4
8/+4
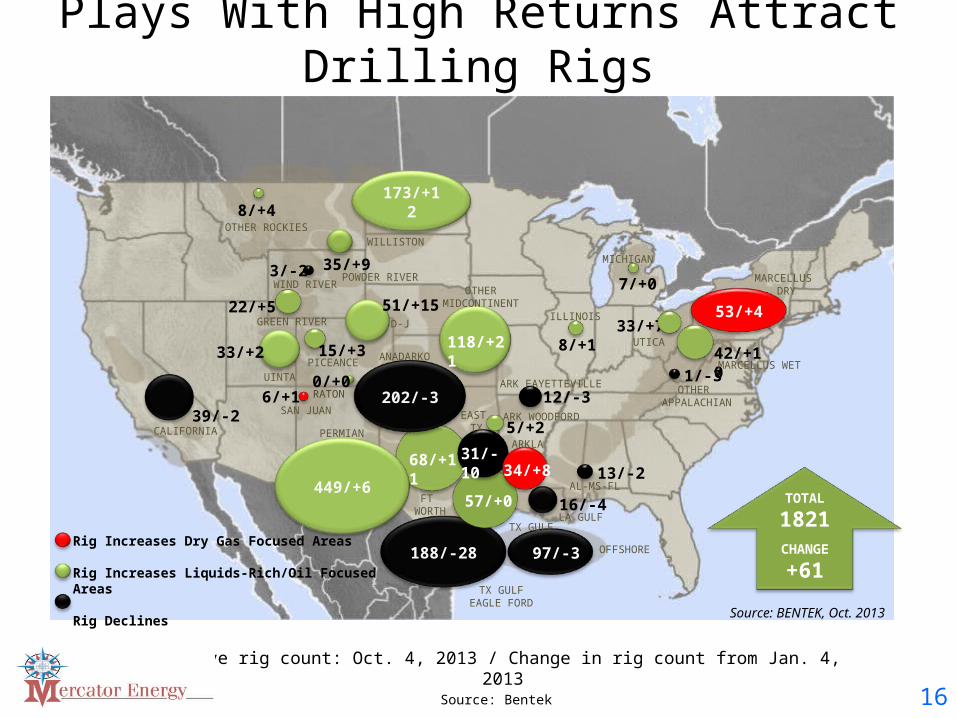
Active rig count: Oct. 4, 2013 / Change in rig count from Jan. 4, 2013
Rig Increases Dry Gas Focused Areas
Rig Increases Liquids-Rich/Oil Focused Areas
Rig Declines Source: BENTEK, Oct. 2013
1/-3
97/-3
57/+0
42/+10
68/+11
12/-3202/-3
449/+6
31/-10
15/+3PICEANCE
CALIFORNIA
MICHIGAN
POWDER RIVER
GREEN RIVER
WIND RIVER
OTHER ROCKIESWILLISTON
SAN JUAN
UINTAOTHER
APPALACHIAN
D-J
MARCELLUS WET
MARCELLUS DRY
UTICA
ILLINOIS
ARK FAYETTEVILLE
ARK WOODFORD
OFFSHORE
TX GULFEAGLE FORD
PERMIAN
ANADARKO
FT WORTH
AL-MS-FL
LA GULF
EAST TX
ARKLA
OTHER MIDCONTINENT
TX GULF
34/+8
RATON0/+0
Plays With High Returns Attract Drilling Rigs
TOTAL
1821CHANGE
+61
16Source: Bentek
8/+0
173/+96
39/+11
53/-23
13/+9
7/+1
33/+8
22/-8
35/+26
118/+81
5/-24
3/+0
188/+128
33/+29
6/-2
51/+33
16/+1
8/+5
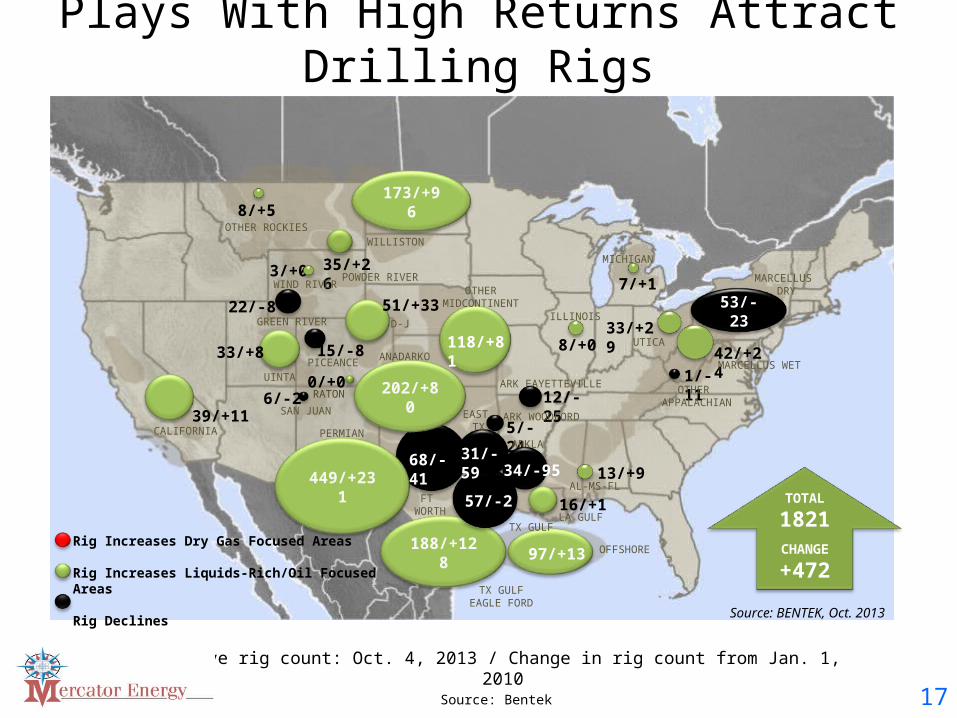
Active rig count: Oct. 4, 2013 / Change in rig count from Jan. 1, 2010
Rig Increases Dry Gas Focused Areas
Rig Increases Liquids-Rich/Oil Focused Areas
Rig Declines Source: BENTEK, Oct. 2013
1/-11
97/+13
57/-2
42/+24
68/-41
12/-25202/+80
449/+231
31/-59
15/-8PICEANCE
CALIFORNIA
MICHIGAN
POWDER RIVER
GREEN RIVER
WIND RIVER
OTHER ROCKIESWILLISTON
SAN JUAN
UINTAOTHER
APPALACHIAN
D-J
MARCELLUS WET
MARCELLUS DRY
UTICA
ILLINOIS
ARK FAYETTEVILLE
ARK WOODFORD
OFFSHORE
TX GULFEAGLE FORD
PERMIAN
ANADARKO
FT WORTH
AL-MS-FL
LA GULF
EAST TX
ARKLA
OTHER MIDCONTINENT
TX GULF
34/-95
RATON0/+0
Plays With High Returns Attract Drilling Rigs
TOTAL
1821CHANGE
+472
17Source: Bentek
18
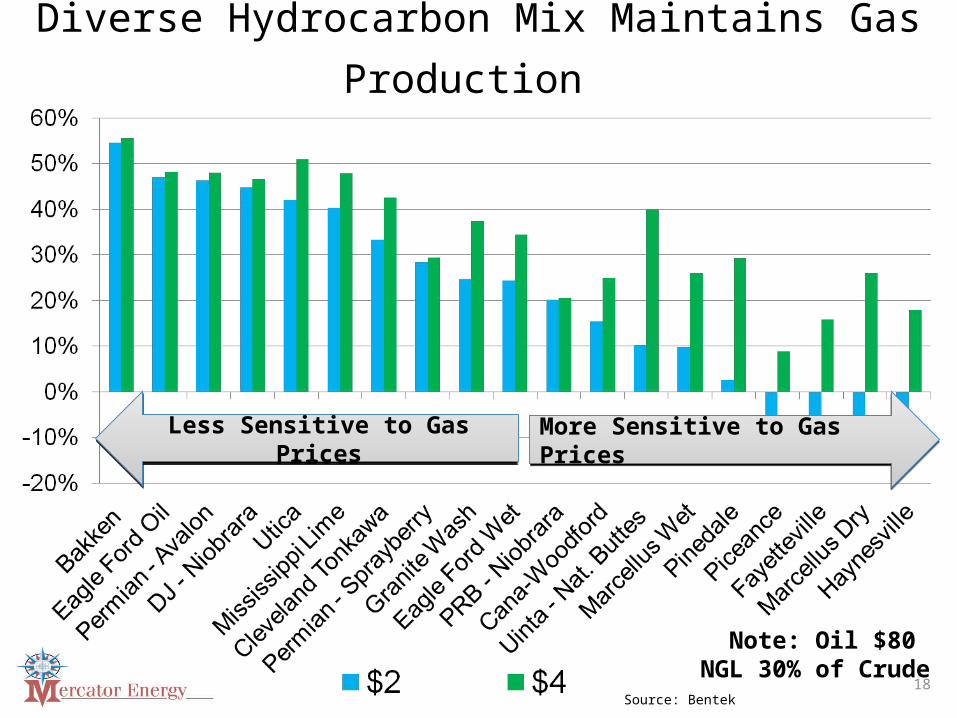
Diverse Hydrocarbon Mix Maintains Gas Production
Note: Oil $80 NGL 30% of Crude
Less Sensitive to Gas PricesLess Sensitive to Gas Prices More Sensitive to Gas PricesMore Sensitive to Gas Prices
Source: Bentek
19
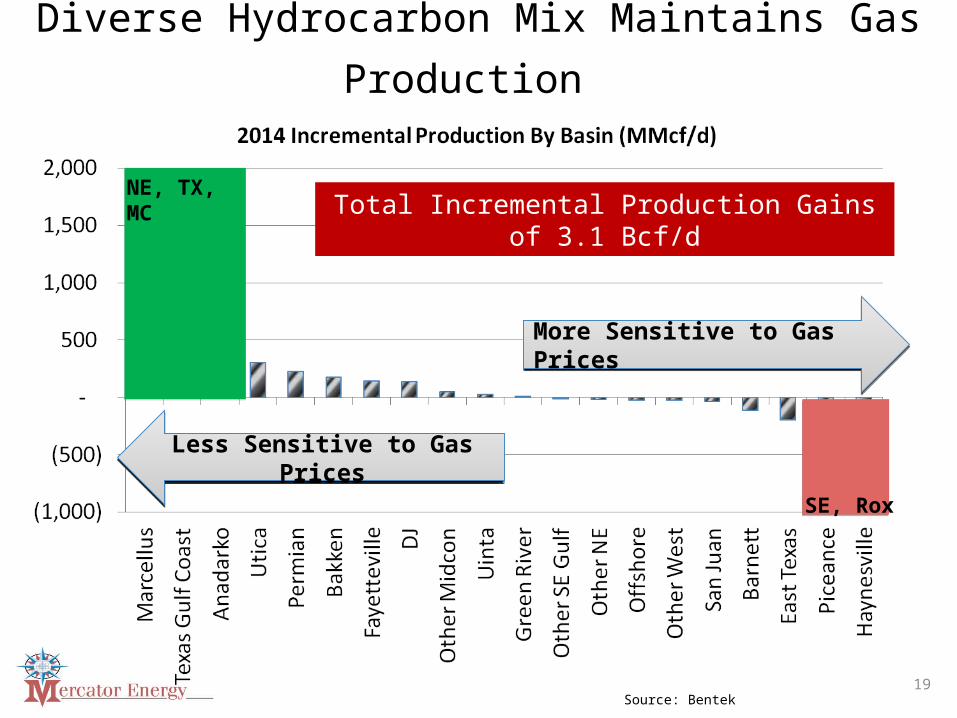
Diverse Hydrocarbon Mix Maintains Gas Production
Less Sensitive to Gas PricesLess Sensitive to Gas Prices
More Sensitive to Gas PricesMore Sensitive to Gas Prices
Total Incremental Production Gains of 3.1 Bcf/dNE, TX, MC
SE, Rox
Source: Bentek
20
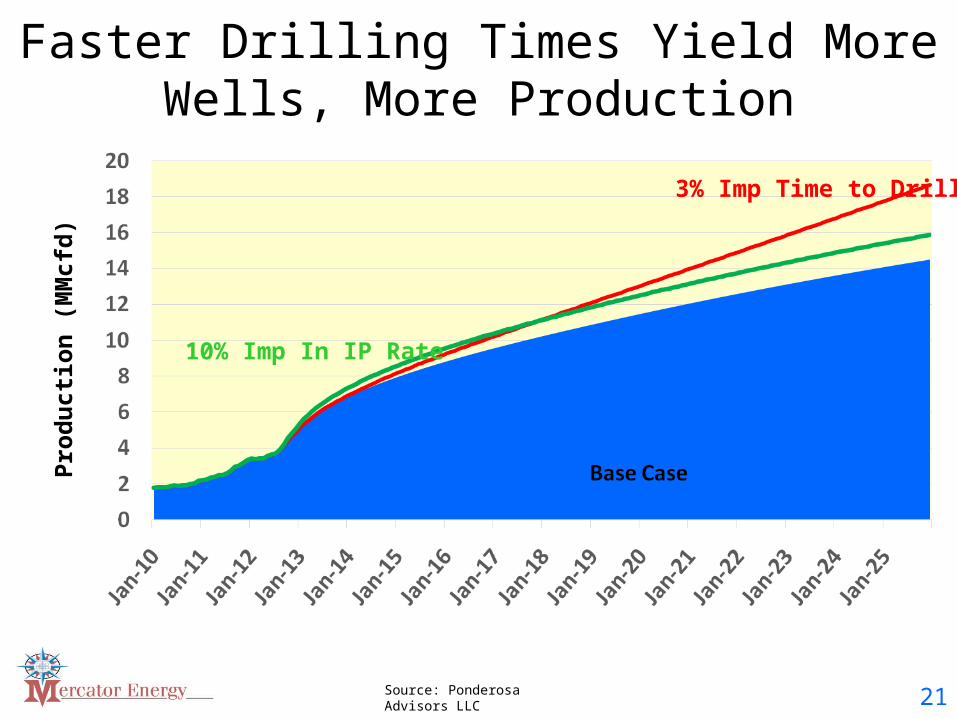
Faster Drilling Times Yield More Wells, More Production
3% Imp Time to Drill
10% Imp In IP Rate
Prod
uctio
n (M
Mcf
d)
Source: Ponderosa Advisors LLC 21
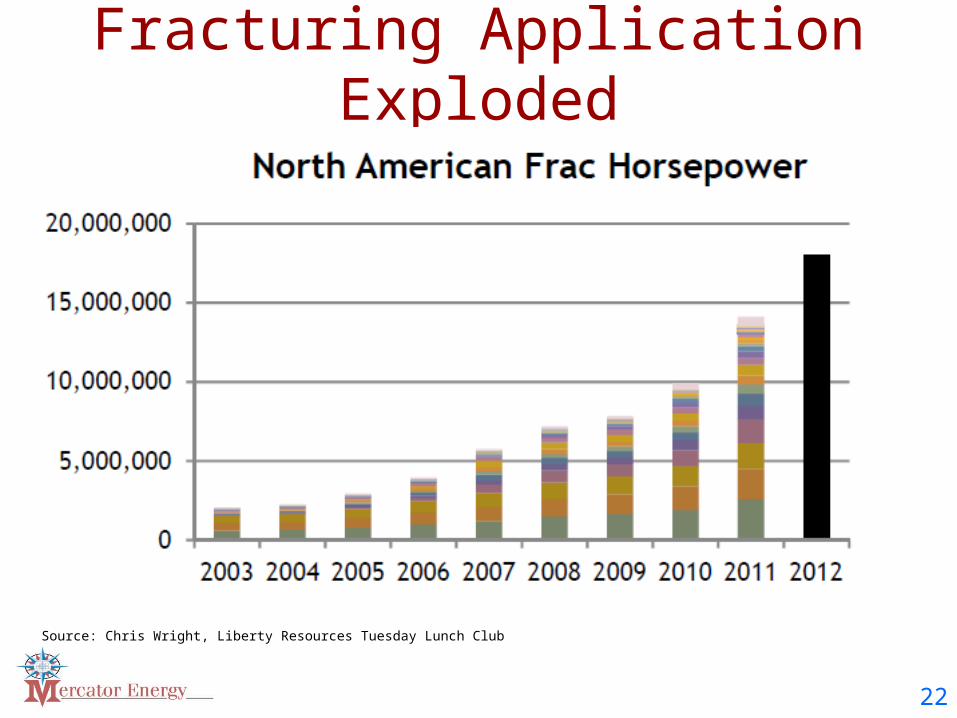
Fracturing Application Exploded
Source: Chris Wright, Liberty Resources Tuesday Lunch Club Presentation, 3/5/13
22
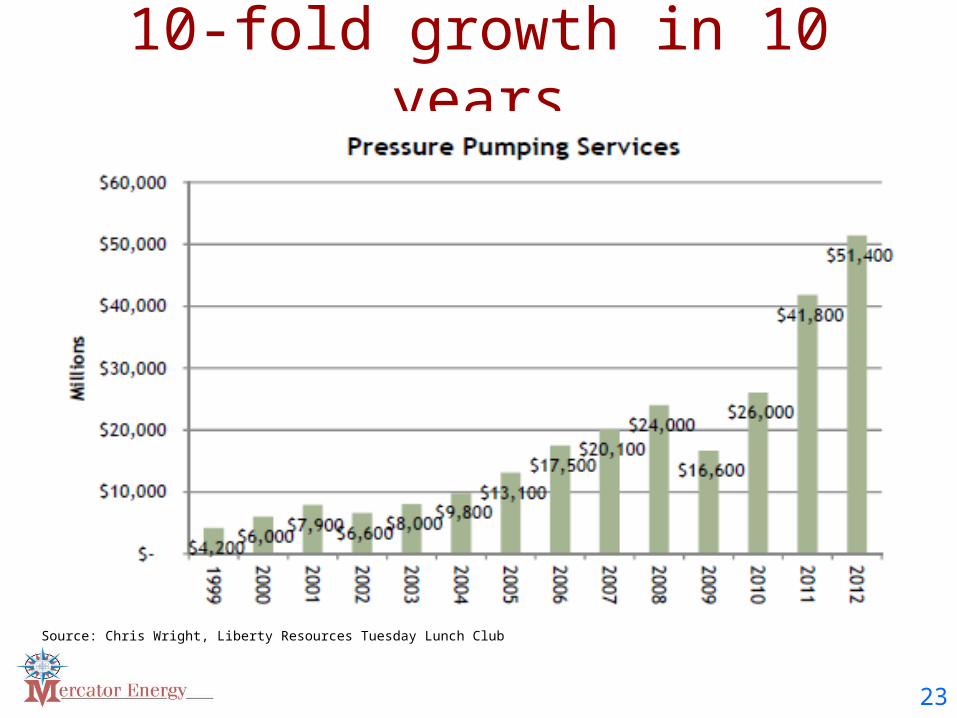
10-fold growth in 10 years
Source: Chris Wright, Liberty Resources Tuesday Lunch Club Presentation, 3/5/13
23
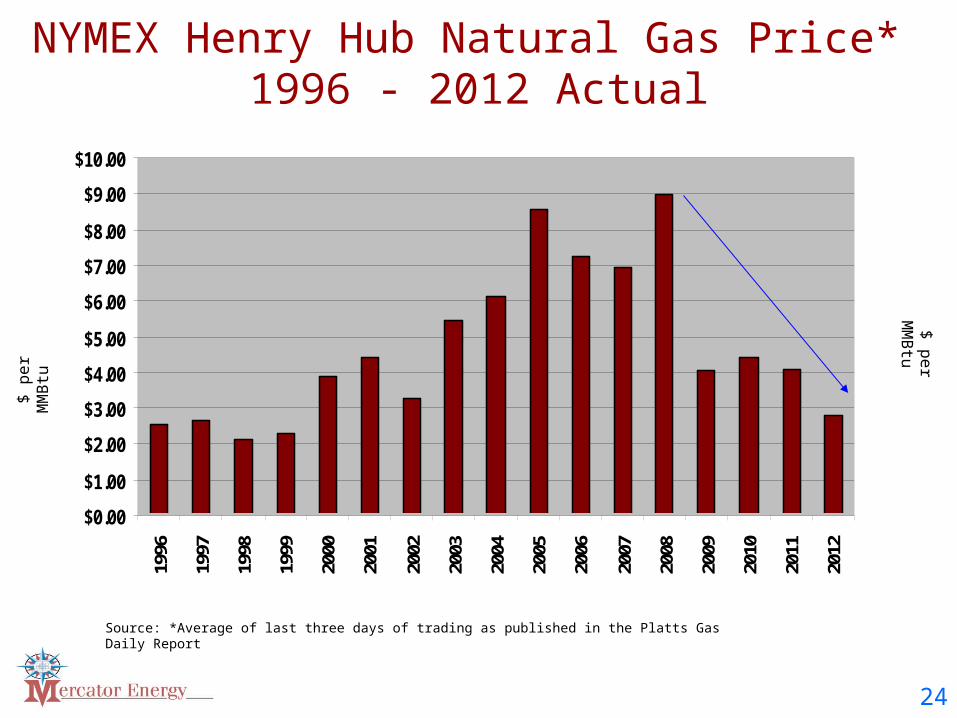
NYMEX Henry Hub Natural Gas Price* 1996 - 2012 Actual
Source: *Average of last three days of trading as published in the Platts Gas Daily Report
$ p
er
MM
Btu
$ p
er M
MB
tu
$0.00
$1.00
$2.00
$3.00
$4.00
$5.00
$6.00
$7.00
$8.00
$9.00
$10.0019
96
1997
1998
1999
2000
2001
2002
2003
2004
2005
2006
2007
2008
2009
2010
2011
2012
24
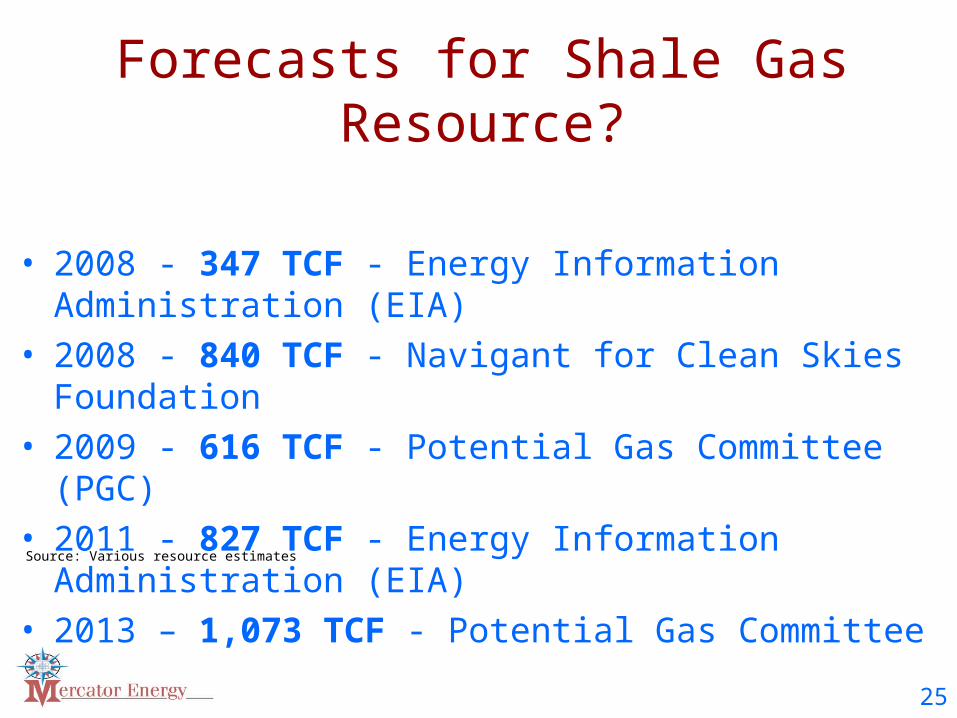
Forecasts for Shale Gas Resource?
• 2008 - 347 TCF - Energy Information Administration (EIA)
• 2008 - 840 TCF - Navigant for Clean Skies Foundation
• 2009 - 616 TCF - Potential Gas Committee (PGC)
• 2011 - 827 TCF - Energy Information Administration (EIA)
• 2013 – 1,073 TCF - Potential Gas Committee (PGC)
Source: Various resource estimates
25
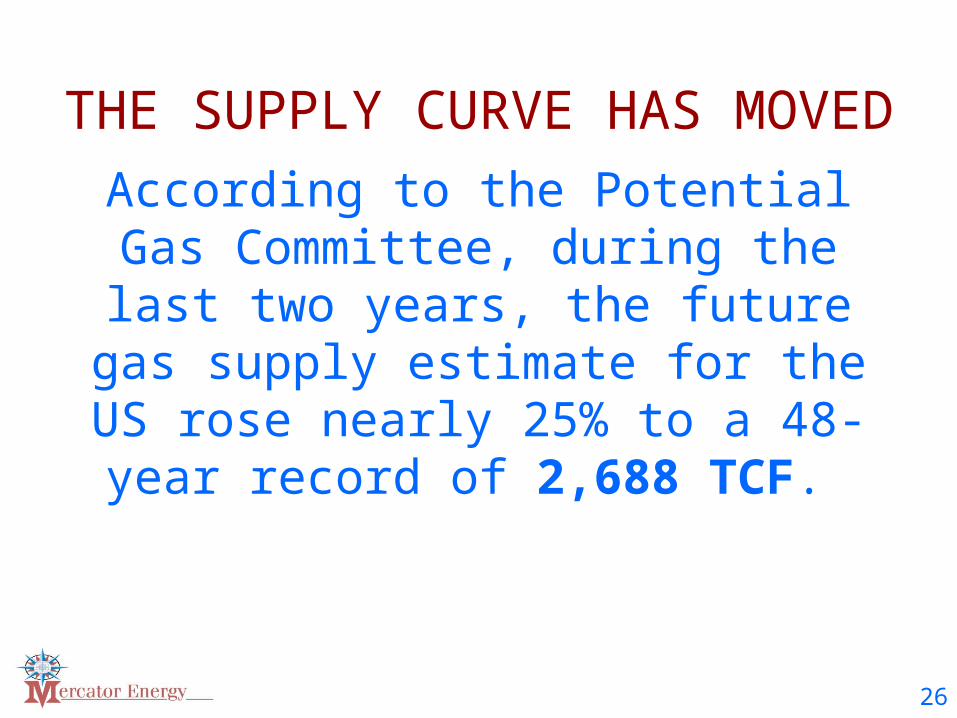
THE SUPPLY CURVE HAS MOVED
According to the Potential Gas Committee, during the last two years, the future gas supply estimate for the
US rose nearly 25% to a 48-year record of 2,688 TCF.
26
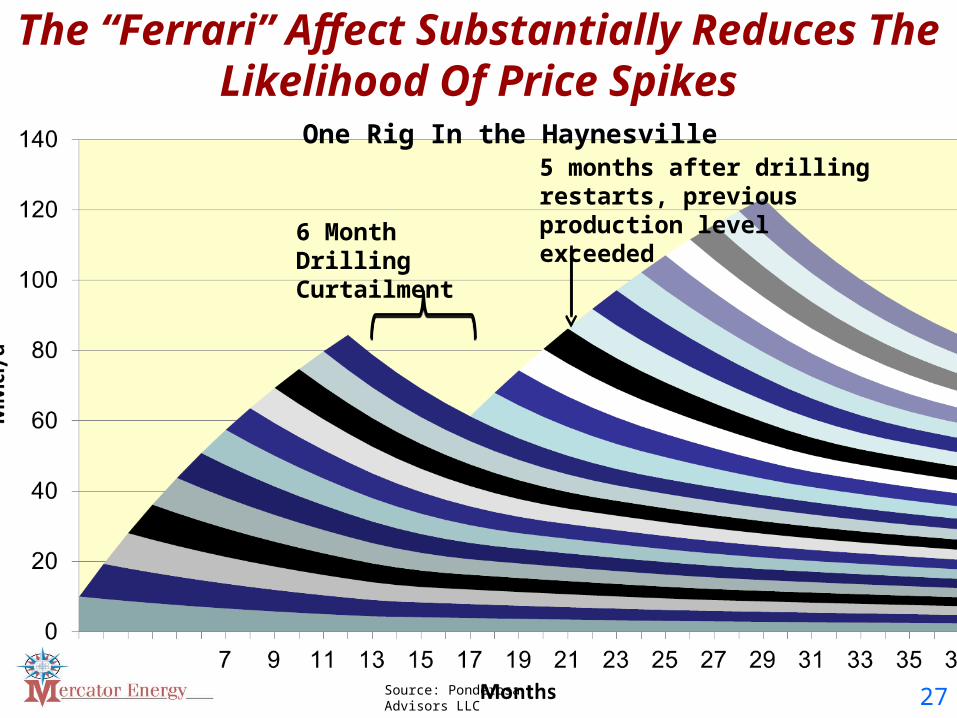
The “Ferrari” Affect Substantially Reduces The Likelihood Of Price Spikes
6 Month Drilling Curtailment
5 months after drilling restarts, previous production level exceeded
One Rig In the Haynesville
Source: Ponderosa Advisors, LLCSource: Ponderosa Advisors LLC 27
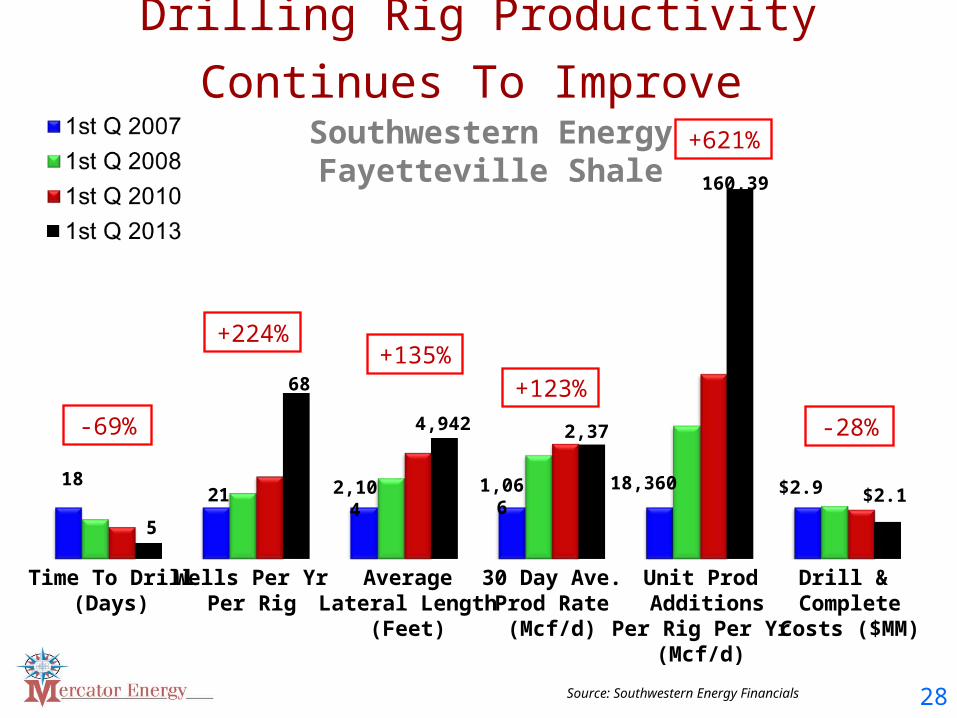
Drilling Rig Productivity Continues To Improve Southwestern Energy
Fayetteville Shale
2,104
4,942
+135%
18
5
-69%
1,066
2,373
+123%
$2.1$2.9
-28%
21
68
+224%
160,397
18,360
+621%
Source: Southwestern Energy Financials
Time To Drill(Days)
Wells Per YrPer Rig
AverageLateral Length
(Feet)
30 Day Ave.Prod Rate
(Mcf/d)
Unit Prod Additions
Per Rig Per Yr(Mcf/d)
Drill & Complete
Costs ($MM)
28
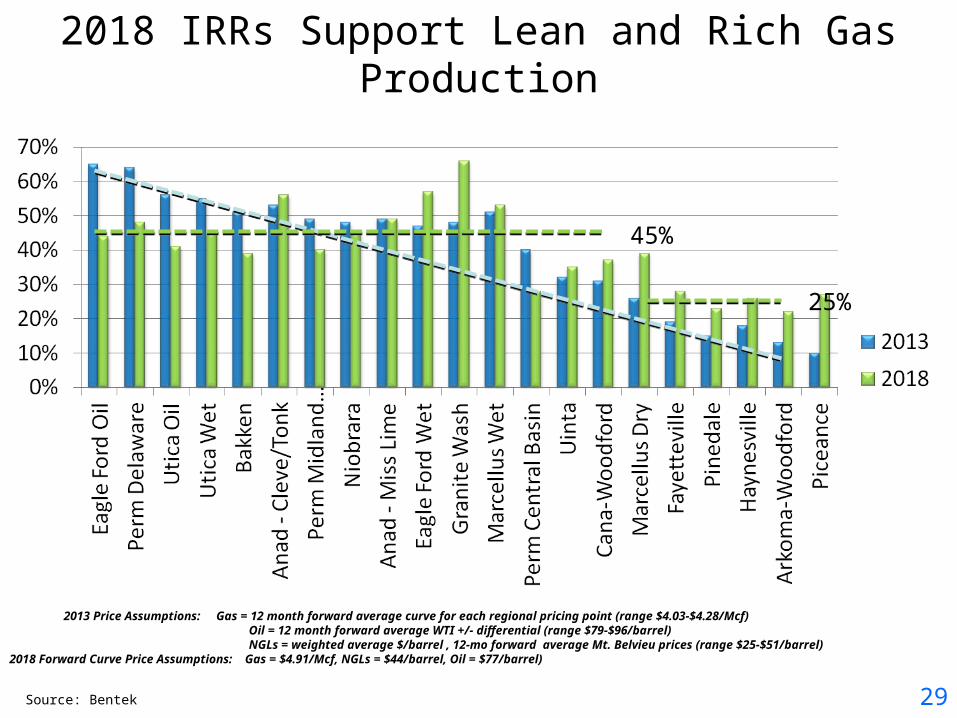
2018 IRRs Support Lean and Rich Gas Production
2013 Price Assumptions: Gas = 12 month forward average curve for each regional pricing point (range $4.03-$4.28/Mcf) Oil = 12 month forward average WTI +/- differential (range $79-$96/barrel) NGLs = weighted average $/barrel , 12-mo forward average Mt. Belvieu prices (range $25-$51/barrel)
2018 Forward Curve Price Assumptions: Gas = $4.91/Mcf, NGLs = $44/barrel, Oil = $77/barrel)
45%
25%
29Source: Bentek
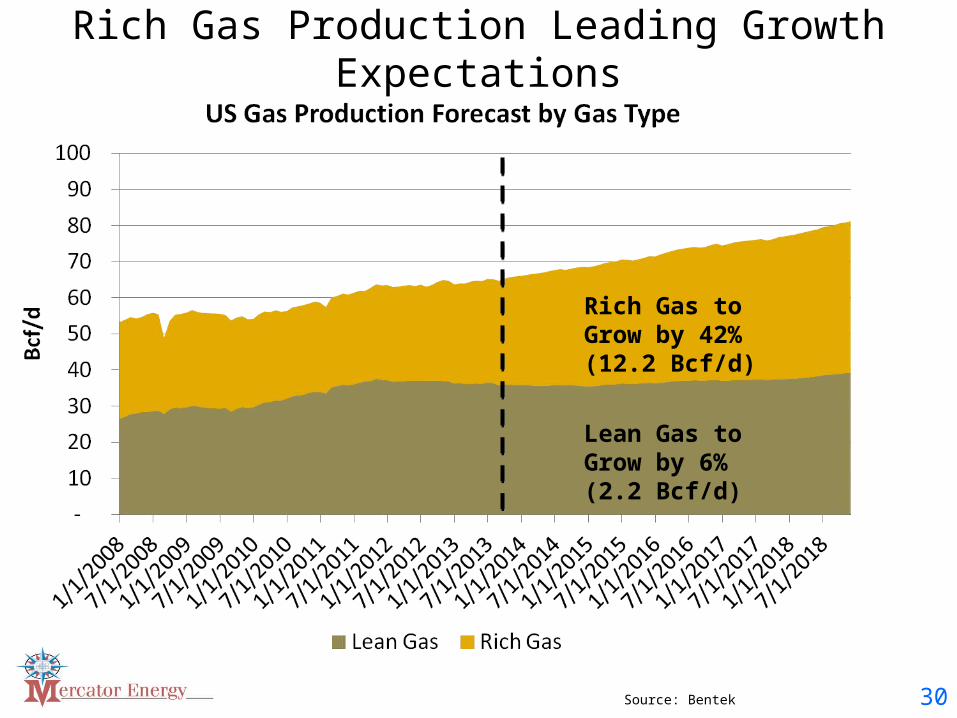
Rich Gas Production Leading Growth Expectations
Lean Gas to Grow by 6% (2.2 Bcf/d)
Rich Gas to Grow by 42% (12.2 Bcf/d)
30Source: Bentek
31
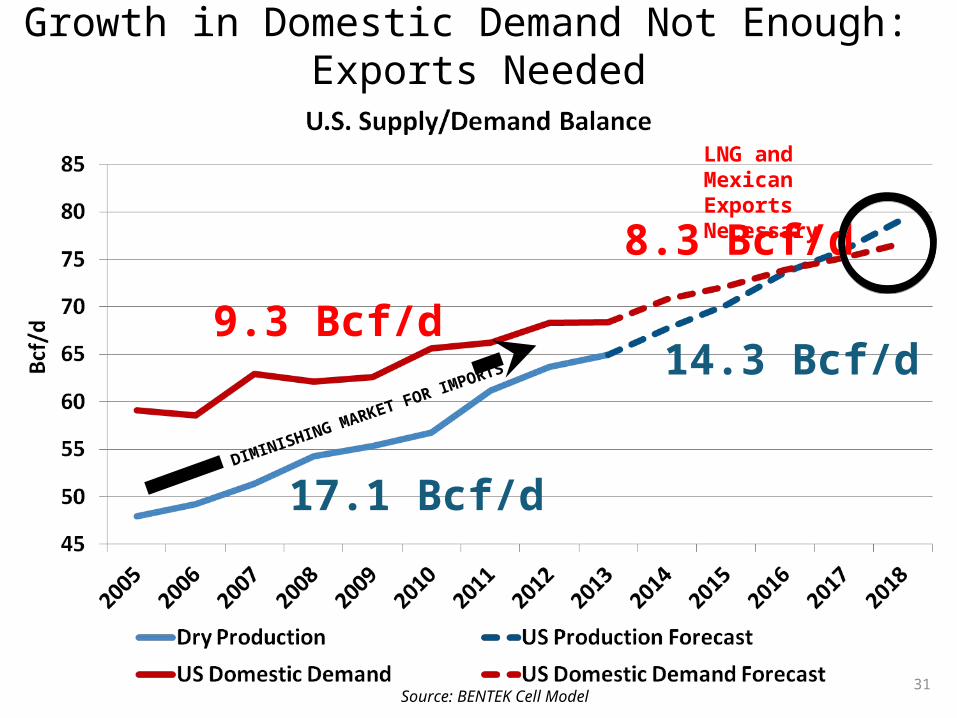
Growth in Domestic Demand Not Enough: Exports Needed
DIMINISHING MARKET FOR IMPORTS
9.3 Bcf/d
8.3 Bcf/d
14.3 Bcf/d
17.1 Bcf/d
Source: BENTEK Cell Model
LNG and Mexican Exports Necessary
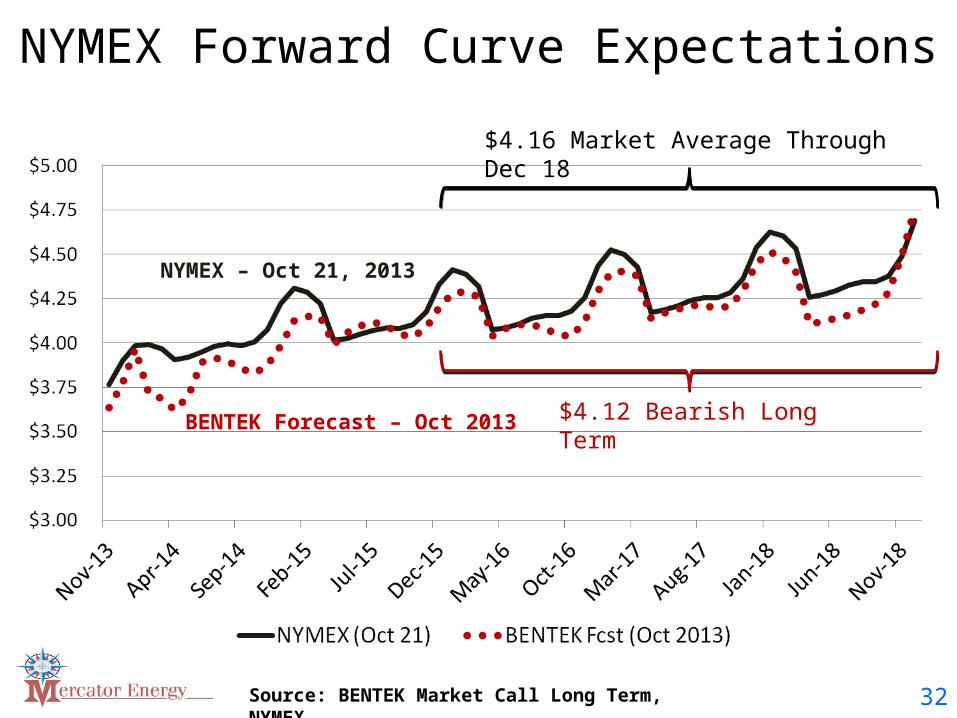
NYMEX Forward Curve Expectations
NYMEX – Oct 21, 2013
BENTEK Forecast – Oct 2013
Source: BENTEK Market Call Long Term, NYMEX
$4.12 Bearish Long Term
$4.16 Market Average Through Dec 18
32
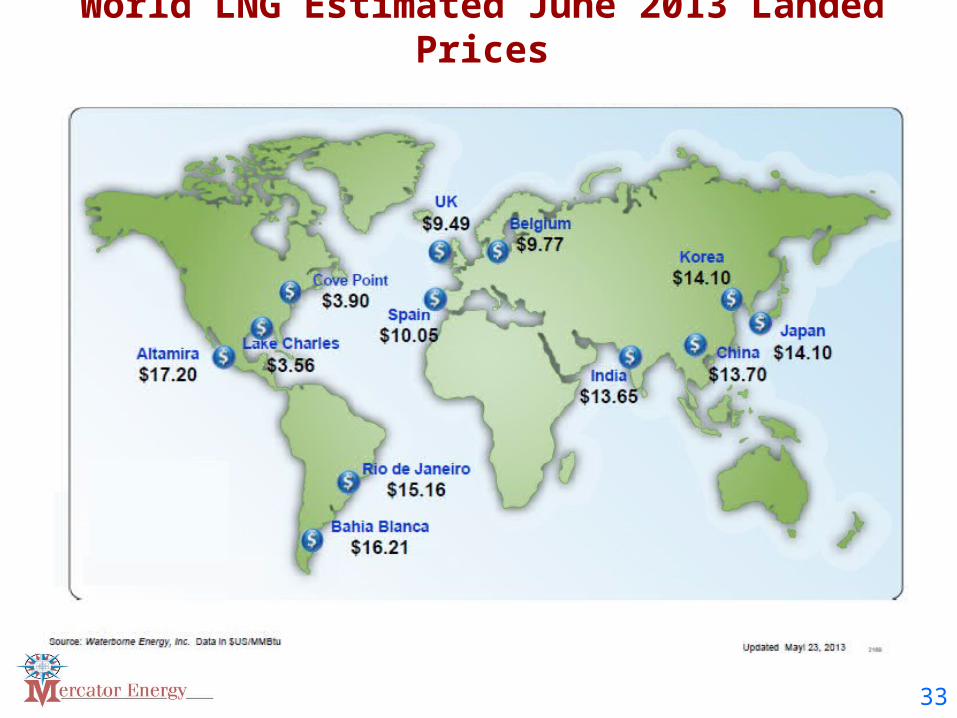
World LNG Estimated June 2013 Landed Prices
33
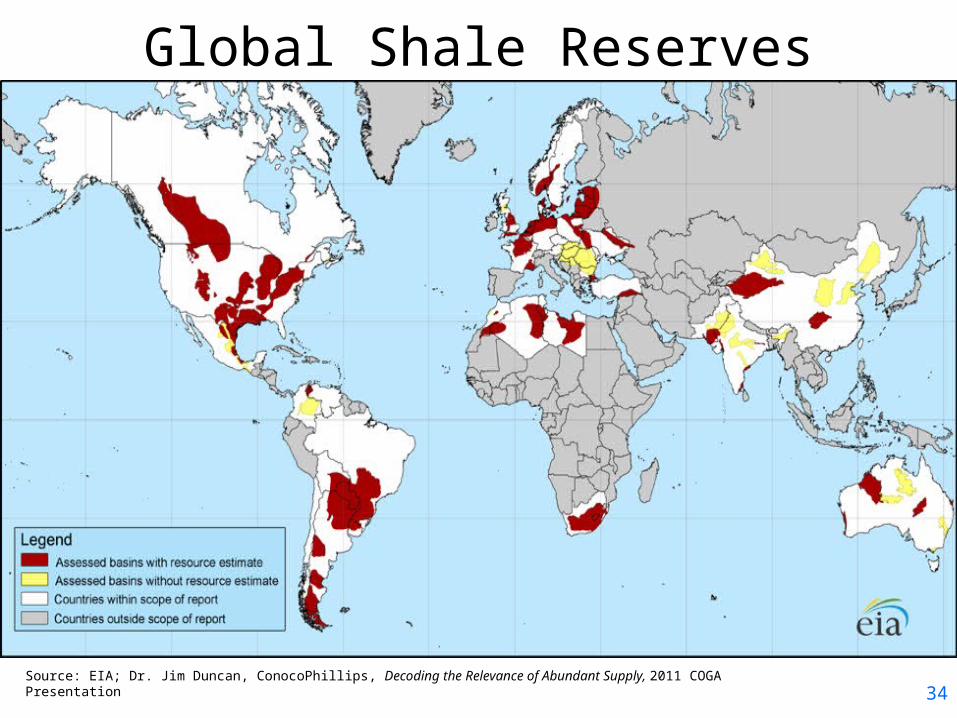
Global Shale Reserves
Source: EIA; Dr. Jim Duncan, ConocoPhillips, Decoding the Relevance of Abundant Supply, 2011 COGA Presentation
34
35
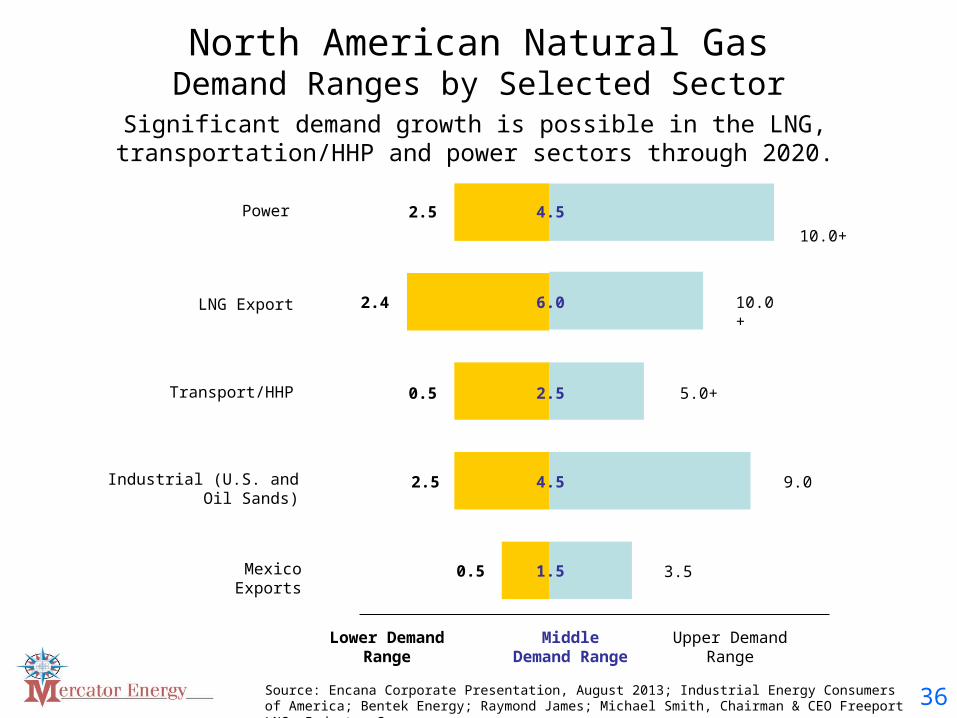
North American Natural GasDemand Ranges by Selected Sector
Significant demand growth is possible in the LNG, transportation/HHP and power sectors through 2020.
10.0+
Power
LNG Export
Transport/HHP
Industrial (U.S. and Oil Sands)
Mexico Exports
Lower Demand Range
Middle Demand Range
Upper Demand Range
2.4
2.5
0.5
2.5
0.5
4.5
6.0
2.5
4.5
1.5
10.0+
5.0+
9.0
3.5
Source: Encana Corporate Presentation, August 2013; Industrial Energy Consumers of America; Bentek Energy; Raymond James; Michael Smith, Chairman & CEO Freeport LNG, Industry Sources 36
Conclusions• U.S. continues to produce more gas, shale gas
revolution was too successful, end-users will benefit
• During the next 3 years, supply will likely exceed demand
• Prices will remain in the $3.50 to $4.50 range, with short period above and below that band during adjustments
• Long term prices depend on demand growth. Without demand growth, supply will continue to be long and prices relatively low.
• A significant demand response can’t occur for at least 3-5 years
37
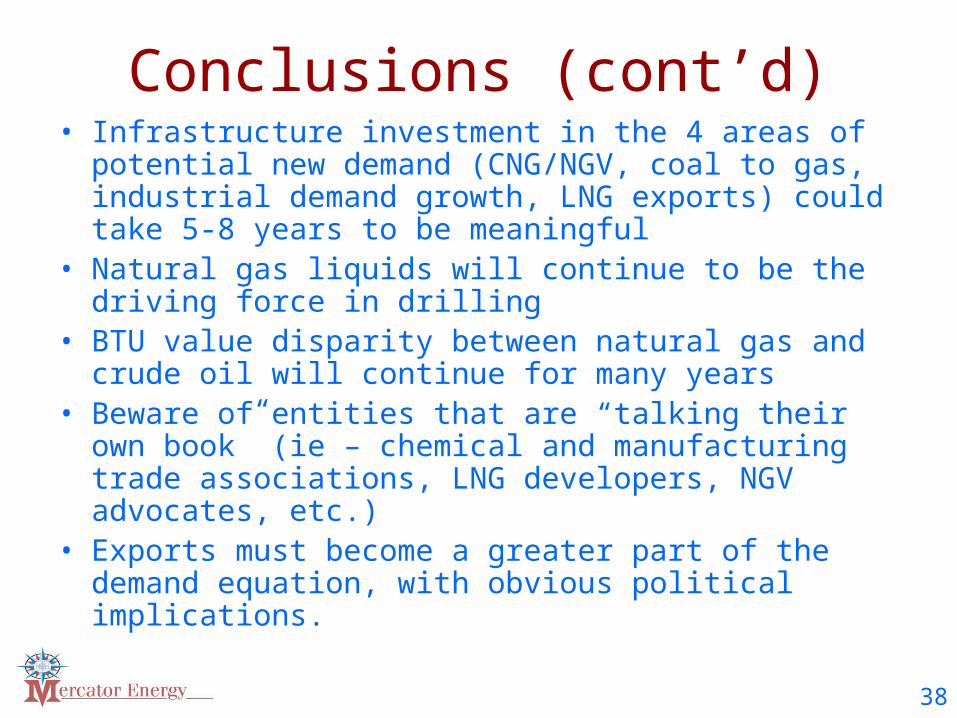
Conclusions (cont’d)• Infrastructure investment in the 4 areas of potential new
demand (CNG/NGV, coal to gas, industrial demand growth, LNG exports) could take 5-8 years to be meaningful
• Natural gas liquids will continue to be the driving force in drilling
• BTU value disparity between natural gas and crude oil will continue for many years
• Beware of entities that are “talking their own book” (ie – chemical and manufacturing trade associations, LNG developers, NGV advocates, etc.)
• Exports must become a greater part of the demand equation, with obvious political implications.
38
John A. HarpolePresident
Mercator Energy LLC26 W. Dry Creek Circle, Suite 410
Littleton, CO [email protected]
(303) 825-1100 (work)(303) 478-3233 (cell)
Contact Information
39
Citations for ReportAll of the information utilized for this report is a compilation of information pulled from the following data sources: Ponderosa Advisors LLCBlue, Johnson Associates, Inc.Chris Wright, Liberty ResourcesOffice of Fossil EnergyOffice of Oil Gas Global Security SupplyU.S. Department of EnergyRaymond James and Associates, Inc.Charif Souki, Cheniere Energy Inc.; Cheniere ResearchU.S. Federal Energy Regulatory CommissionInstitute for Energy Research (IER) Energy Information Administration (EIA)Bernstein ResearchWestern Energy AllianceSutherland LNG BlogPlatts Gas Daily Report, A McGraw Hill PublicationColorado Oil and Gas Association
40