Embed Size (px)
Citation preview

184
CHAPTER V
NATURAL ANTIOXIDANTS AS ADDITIVES FOR
BIODIESEL STABILIZATION
1. Introduction
Biodiesels offer many benefits over conventional petroleum diesel. It burns
cleaner, with low net emissions and reduced particulates, hydrocarbons, and carbon
monoxide. Biodiesels also possess a high cetane number and improves petroleum diesel
cetane performance when blended. Since it is naturally low in sulfur content, it also
lowers sulfur emissions when blended with petroleum diesel. Biodiesel blending also
imparts improved lubricity to petroleum diesel [1 -4]. Since it is domestically produced,
biodiesel shows great potential for reducing dependence on foreign energy supplies.
It provides a “closed economic loop” in that the feedstock can be grown locally, the
biodiesel can be produced locally, and the fuel can be used locally. Furthermore, it is
evident that very minimal to no infrastructure change is necessary to implement
widespread biodiesel use. Biodiesel blends can be used in any diesel engine and can be
transported and stored using existing infrastructure [4 - 6].
Pure biodiesel is environmentally non-toxic and biodegradable. With its high
energy balance of 3.2 to 1, biodiesel provides a beneficial 78% life cycle CO2 reduction.
While biodiesel shows such tremendous potential, there are still unresolved challenges to
its complete acceptance. In the list of Research Priorities from the Biodiesel Technical
Workshop in Denver, Colorado, in November 2005, the top two items identified by this
group of experts were: 1) fuel quality and quality standards, and 2) fuel stability.
A distant third priority was cold flow properties. The fuel quality and standards issues are
being addressed in the ASTM Fuel Standards subcommittee. Thus, the single most
critical acceptance issue requiring research and development is that of biodiesel stability;
in particular, oxidative stability [7, 8].
The degradation of biodiesel is generally due to oxidation, which is indicated by
increased acid number and viscosity, as well as the formation of gums and sediments.

185
The oxidation process starts with the formation of hydroperoxides by the addition of an
oxygen molecule to a carbon atom adjacent to a C=C double bond. As oxidation
proceeds, the peroxides break away to form aldehydes and short-chain acids.
Alternatively, peroxides may generate free radicals, which promote polymerization and
crosslinking among the olefinic (C=C containing) molecules. Therefore, oxidation
reactivity is related to the number of C=C bonds in the fuel. Increased content of the C=C
bonds correlates to decreased oxidative stability of the fuel. The increase in instability of
a given diesel fuel molecule is generally directly proportional to the number of C=C
bonds in the molecule (i.e., a molecule containing two C=C bonds has half the stability of
a molecule containing one C=C bond) [9].
Augmenting petroleum-derived fuels with renewable fuels has gained widespread
attention in the the recent past. One such renewable fuel is biodiesel, which according to
ASTM D 6751-07 is defined as the mono-alkyl ester of long-chain fatty acids derived
from vegetable oils or animal fats [4]. Biodiesel offers numerous environmental,
economic and energy security benefits, and production capacity has grown considerably
in the past two to three years, especially in Europe and the USA. Currently, methanol is
predominantly used in the transesterification process for biodiesel production [6].
The presence of high levels of unsaturated fatty acid methyl esters (FAME) makes
biodiesel very susceptible to oxidation as compared to petroleum diesel [7]. Oxidative
processes bring about increased viscosity as a result of condensation reactions involving
double bonds, also leading to the formation of insoluble, which can potentially plug fuel filters
and injection systems [8]. The increased acidity and increased peroxide value as a result of
oxidation reactions can also cause corrosion of fuel system components, hardening of rubber
components, and fusion of moving components [8-9]. ASTM D6751-07 includes an oxidation
stability standard of a three-hour minimum induction period (IP) as measured using the
Rancimat test (EN14112)[4]. The European Committee for standardization adopted a six-hour
minimum IP as the specification [10]. A survey of retail biodiesel samples performed in 2004
indicated that only four out of 27 B100 samples met the oxidative stability standard of three
hours and over 85% had an IP of less than two hours [11].

186
Factors which influence the oxidative stability of biodiesel include fatty acid
composition, natural antioxidant content, the level of total glycerin, and the conditions of
fuel storage such as temperature, exposure to light and air, and material used for storage
tank construction [11, 14- 15]. Previous studies have found that antioxidants can be
effective in increasing the stability of biodiesel [7, 14, 16-17]. However, these effects have
not been fully elucidated and results have been inconclusive or conflicting. Mittelbach et al.
[18] reported that pyrogallol (PY), propylgallate (PG), and t-butylhydroquinone (TBHQ)
could significantly improve the stability of biodiesel obtained from rapeseed oil, used frying
oil, and beef tallow, whereas BHT was not very effective. Moreover, Domingos et al. [18]
found that BHT had the highest effectiveness for refined soybean oil-based biodiesel,
while BHA displayed little effectiveness. Natural antioxidants are constituents of many
fruits and vegetables and they have attracted great deal of public and scientific attention
because of their anti-carcinogenic potential. Biodiesel is an environment friendly liquid
fuel similar to petrodiesel in combustion properties.
The high compatibility of biodiesel with petroleum diesel characterizes it as a
good alternative capable of supplying most of the existing diesel fleet without great
adaptations. It is also biodegradable and renewable, has a lubricating capacity in the pure
form and is competitive with diesel in terms of fuel properties [2]. However, unlike fossil
fuels that are relatively inert and maintain their essential characteristics with little
alteration during storage, biodiesel degrades with time and can be altered due to the
action of air, light, temperature and moisture. Contact with contaminants, both inorganic
and microbial nature, can also tend to introduce variations in product quality, and
oxidation resulting from its exposure to atmospheric air is one of the main degradation
problems to which biodiesel is subject [8]. In order to inhibit or delay oxidation in oils, fats
and fatty foods, phenolic chemical compounds are used, known as synthetic antioxidants
and/or stabilizers [9]. Antioxidants occur naturally in vegetable oils and the most common
are the tocopherols. However, some plant oil production processes include a distillation step
to purify the triglycerides. The biodiesel obtained from these oils normally has little or no
natural antioxidants so they become less stable and therefore antioxidants need to be applied
to increase the biofuel stability and extend its properties for a longer period [12].

187
A new alternative to delay the biodiesel oxidative degradation process may be the
use of natural antioxidants present in spices, bearing in mind that they do not damage the
environment and are easily obtained [19]. According to some studies, rosemary
(Rosmarinus officinalis L.) and sage (Salvia officinalis L.) are spices with greatest
antioxidant potentials [19, 20]. The antioxidant activity of carnosol and carnosic acid,
found in rosemary, was validated in an emulsion containing methyl linoleate [21].
According to Nakatani and Inatani (1984), the addition of natural antioxidants such as
carnosol and carnosic acid, at a 0.01% concentration, in a linoleic acid emulsion, have
activity levels similar to those of the synthetic antioxidants BHA (butyl hydroxy anisole) and
BHT (butyl hydroxy toluene) added in the same concentration [22]. Five different phenolic
compounds were isolated from oregano (Origanum vulgare L.); all presented antioxidant
activity and one of them was identified as rosmarinic acid [23]. Furthermore, the study
carried out by Bragagnolo and Mariuti (2007) [24] reported several other phenolic
compounds that were isolated from oregano, including luteolin, p-coumaric acid, carvacrol,
thymol, p-cimen, and campherol. These findings demonstrate a great possibility of using
these spices as good antioxidants and possible substitutes for the synthetic antioxidants,
especially in mixtures consisting of unsaturated carbon compounds as substrate. Numerous
strong antioxidant compounds have been identified in fruits, vegetables [25, 26].
In this chapter, twelve antioxidant compounds were isolated from six plants such
as Murraya koenigii (L.) Spreng, Mentha arvensis L, Coriandrum sativum L., Curcuma
lunga, Citrullus colocynthis, and Eichornia crasipus. The extraction, isolation and
characterization of the twelve compounds (carvone, phellendrene, cymene, caryophyllene,
menthol, curcumin, cucurbitcin, rutin, arbutin, coumarin, quercetin, and tannic acid) are
already described in Chapter II. Results reveal that all the 12 isolated compounds have
antioxidant activity which is evident from the chemical assay, storage studies and
oxidative stability of Jatropha and Pongamia biodiesel.
2. Experimental
2.1. Antioxidant chemical assay
In this chapter, four assays, namely, FRAP, TRAP, SOS and ABTS were employed for
determination of antioxidant activity of the isolated antioxidants. The chemical structures of the

188
12 isolated compounds, namely, carvone, phellendrene, cymene, caryophyllene, menthol,
curcumin, cucurbitcin, rutin, arbutin, coumarin, quercetin and tannic acid, are given in Figure.5.1.
CH3
CH3H3C
O
H
O
OH
OH
OH
OH
HO
O
H3C
CH3
H2C
CH3
HH
O
O
OH
OH
OH
O
HO
Carvone Phellendrene Cymene Menthol
Quercetin
Caryophyllene

189
OH
O
O
OH
HO
HO
OH
O O
O O
OHOH
OCH3
OH
H3CO
HO
O
H
O
O
O H
O H
O
O H
HO
O
O
O H
O
HO OH
OOH
O H
HO
HO
3,3’-methylene-bi(4- hydroxyl coumarine)
Cucurbitacin I
Curcumin
Arbutin
Rutin

190
Figure 5.1: Chemical structures of the 12 compounds isolated from various plants.
The characterization of the isolated compounds were carried out using UV-Visible
spectrophotometry, FTIR, GC, GC-MS, HPLC, MS and 1H NMR techniques characterization
details are given in chapter II.
3. Results and Discussion
3.1. Antioxidant chemical assay
The antioxidant scavenging ability of the isolated natural compounds was
evaluated using four different scavenging methods and was compared with the
antioxidant scavenging ability of those available commercially. From the study it is clear
hat the natural antioxidants have greater antioxidant scavenging ability compared to the
commercially available antioxidants (Figure 5.2).
O
OO
OO
O
OH
OH
HO
HO
O
O
HO
HO OH
O
O
HO OH
O
O
OH
OH
OH
O
O
H
HO
OH
O
O
OH
OHO
O
HO OH
HO
O
O
OHHO
O
O
OH
OH
OH
Tannic acid

191

192
Figure. 5.2: Antioxidant assays 1) ABTS, 2) SOS, 3) TRAP, and 4) FRAP.

193
The TRAP and ABTS method of scavenging activity involves a hydrogen transfer
reaction and the reaction scheme is given below,
ROO* + AH→ ROOH + A*
ROO* + LH →ROOH + L*
SOS and FRAP method of scavenging activity involves an electron transfer reaction and
the electron transfer scavenging reaction is given below,
M(n) + e (from AH) → AH*+ + M(n - 1)
The ABTS method described, gives a measure of the antioxidant activity of carotenoids
and phenolics, It is determined by measuring the reduction of the radical cation as the
percentage inhibition of absorbance at 734 nm which is visually characterized by the
decolorization of the ABTS•. Figure 1 illustrates the effects of the duration of interaction of
specific antioxidants on the suppression of the absorbance of the ABTS•* radical cation at
734 nm. Trolax was used as the standard reference compound for this assay. The antioxidant
activity of natural antioxidants as determined by ABTS assay were compared with activities of
commercially available antioxidants such as BHA, BHT, GA, TBHQ and PY.
The scavenging activities of natural antioxidants were concentration dependent. 20 µg/
ml of carvone from curry leaf gave better results when compared with commercially available
antioxidants. Increasing the concentration of carvone above 20 µg/ ml did not improve the
scavenging activity. The activity of other antioxidants increased with increase in concentration
upto 100 µg/ ml. Curcumin from Curcuma longa (turmeric) and tannic acid from Eichornia
cracipus exhibited good scavenging activity. The antioxidant activity of curcumin and tannic
acid were above 94%, both being nearly the same. The ABTS results clearly show that the
naturally available antioxidants were better than the commercially available antioxidants.
The SOS method shows that at a concentration of 20 µg/ ml all the naturally
occurring antioxidants give substantial activity. Increasing the load of antioxidants did
not result in much change in antioxidant activity for any of the natural antioxidants except
rutin and caryophyllene. Caryophyllene gave scavenging activity of 84% at 100 µg/ ml
whereas rutin gave 83% scavenging activity at 40 µg/ ml. Above these concentrations the
antioxidant activity decreased for both rutin and caryophyllene.

The TRAP method revealed highest activity at 20
antioxidants. Increasing the concentration of antioxidants did not alter the
natural antioxidants except cucurbitacin I, rutin and tannic acid. Highest scavenging activities
of 96.9% for tannic acid, 96% for cucurbitacin I and 95.2% for Rutin was observed, all at
100 .µg/ ml.
The FRAP assay gives fast, rep
in pure solution and with mixtures of antioxidants in aqueous solution added to plasma. FRAP
results show gradual increase in scavenging activity from 20 to 100
activity of 83% in FRAP assay was exhibited by tannic acid and 75% activity by
coumarin, both isolated form
natural antioxidants have greater scavenging ability as compared to commercially
available antioxidants. T
performed using naturally available and commercially availabl
concentration of 100 µ
best scavenging activity among both natural and commercially available antioxidants.
Figure. 5.3: Comprehensive results of all the assays perf
commercially available antioxidants at a concentration of 100
0
10
20
30
40
50
60
70
80
90
100
ABTS
Act
ivit
y (
%)
194
The TRAP method revealed highest activity at 20 µg/ ml
antioxidants. Increasing the concentration of antioxidants did not alter the
natural antioxidants except cucurbitacin I, rutin and tannic acid. Highest scavenging activities
for tannic acid, 96% for cucurbitacin I and 95.2% for Rutin was observed, all at
The FRAP assay gives fast, reproducible results with plasma, with single antioxidants
in pure solution and with mixtures of antioxidants in aqueous solution added to plasma. FRAP
results show gradual increase in scavenging activity from 20 to 100
FRAP assay was exhibited by tannic acid and 75% activity by
coumarin, both isolated form Eichhornia crasipus. From the above results it is clear that
natural antioxidants have greater scavenging ability as compared to commercially
available antioxidants. The Figure below is a comprehensive result of all the assays
performed using naturally available and commercially availabl
concentration of 100 µg/ ml. From this Figure it is observed that tannic acid exhibited the
best scavenging activity among both natural and commercially available antioxidants.
Comprehensive results of all the assays performed using naturally and
commercially available antioxidants at a concentration of 100
SOS TRAP FRAPConcentration (μg/ml)
ml for all the natural
antioxidants. Increasing the concentration of antioxidants did not alter the activity for any of the
natural antioxidants except cucurbitacin I, rutin and tannic acid. Highest scavenging activities
for tannic acid, 96% for cucurbitacin I and 95.2% for Rutin was observed, all at
roducible results with plasma, with single antioxidants
in pure solution and with mixtures of antioxidants in aqueous solution added to plasma. FRAP
results show gradual increase in scavenging activity from 20 to 100 µg/ ml. The highest
FRAP assay was exhibited by tannic acid and 75% activity by
. From the above results it is clear that
natural antioxidants have greater scavenging ability as compared to commercially
below is a comprehensive result of all the assays
performed using naturally available and commercially available antioxidants at a
it is observed that tannic acid exhibited the
best scavenging activity among both natural and commercially available antioxidants.
ormed using naturally and
commercially available antioxidants at a concentration of 100 µg/ ml.
Carvone
Phelland
Cymene
Caryoph
Menthol
Curcumin
Cucurbit I
Arbutin
Rutin
Coumarin
Quercetin
Tannic
TBHQ
PY
BHT
BHA
GA

195
3.2. Evaluation of Pongamia and Jatropha biodiesel storage stability using naturally
occurring antioxidants
The viscosity of JBD (expand) and PBD (expand) with naturally occurring
antioxidants isolated from six plants as a function of storage time is plotted (Figure 5.4).
The viscosity of untreated JBD and PBD biodiesel increased from 4.4 to 14.76 mm2/s and
4.48 to 14.7 mm2/s respectively measured over a period of 25 weeks. In the present
evaluation, different concentrations (100, 200, 500, 1000, 2000, 3000 and 5000 ppm) of
the 12 natural antioxidants was added to JBD and PBD and their viscosity was measured.
ASTM D 4625 specification (1.9 - 6.0 mm2/s) at 30 ºC was used as the standard.
In this study six different atmospheric conditions for storage of the biodiesel were
also employed. The storage conditions employed were: 1) OGOS, 2) OGCS, 3) OGCSN,
4) AGOS, 5) AGCS and 6) AGCSN.
Results of storage studies of biodiesel using the twelve isolated compounds from
the six plants are henceforth discussed. Storage in amber glass bottle with nitrogen
atmosphere was found to be the best storage condition exhibiting minimum oxidation.
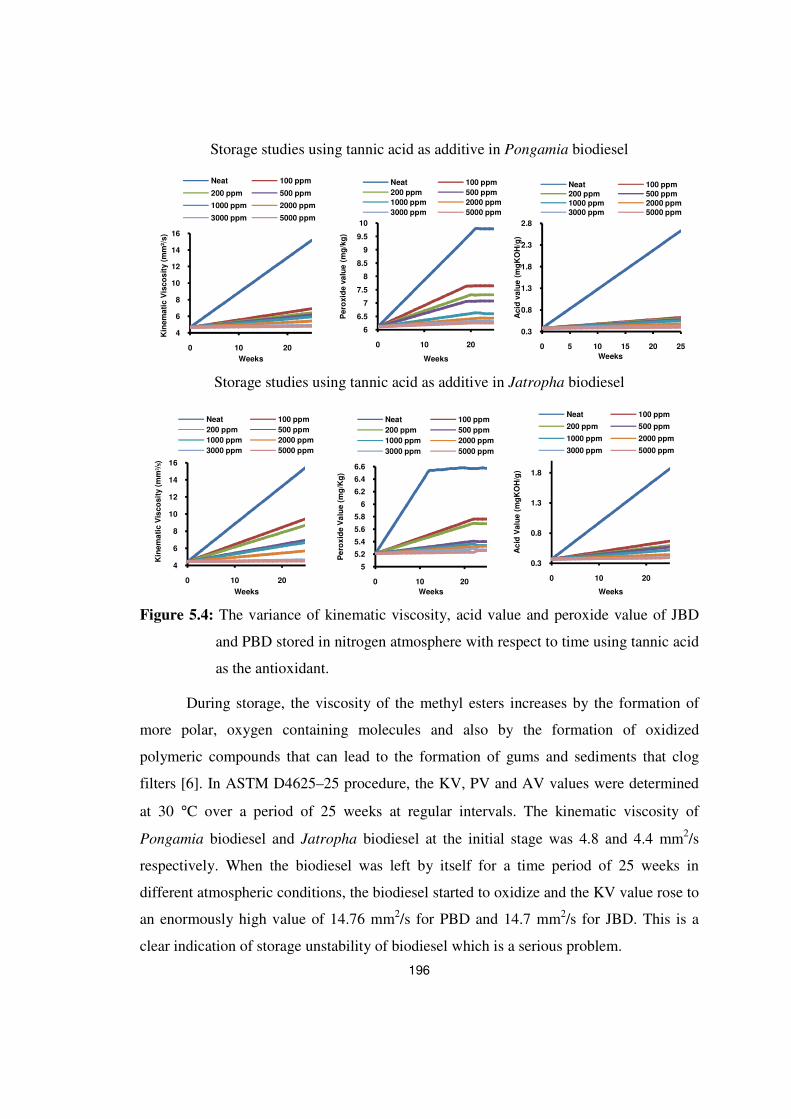
Figure 5.4 below shows the variance of kinematic viscosity, acid value and peroxide
value of JBD and PBD stored in nitrogen atmosphere with respect to time, using tannic
acid as the antioxidant at a concentration of 1000 ppm. The variance of kinematic
viscosity, acid value and peroxide value of JBD and PBD using all the twelve isolated
compounds is discussed further below
196
Storage studies using tannic acid as additive in Pongamia biodiesel
Storage studies using tannic acid as additive in Jatropha biodiesel
Figure 5.4: The variance of kinematic viscosity, acid value and peroxide value of JBD
and PBD stored in nitrogen atmosphere with respect to time using tannic acid
as the antioxidant.
During storage, the viscosity of the methyl esters increases by the formation of
more polar, oxygen containing molecules and also by the formation of oxidized
polymeric compounds that can lead to the formation of gums and sediments that clog
filters [6]. In ASTM D4625–25 procedure, the KV, PV and AV values were determined
at 30 °C over a period of 25 weeks at regular intervals. The kinematic viscosity of
Pongamia biodiesel and Jatropha biodiesel at the initial stage was 4.8 and 4.4 mm2/s
respectively. When the biodiesel was left by itself for a time period of 25 weeks in
different atmospheric conditions, the biodiesel started to oxidize and the KV value rose to
an enormously high value of 14.76 mm2/s for PBD and 14.7 mm2/s for JBD. This is a
clear indication of storage unstability of biodiesel which is a serious problem.
4
6
8
10
12
14
16
0 10 20
Kin
em
ati
c V
isco
sit
y (
mm
²/s)
Weeks
Neat 100 ppm
200 ppm 500 ppm
1000 ppm 2000 ppm
3000 ppm 5000 ppm
6
6.5
7
7.5
8
8.5
9
9.5
10
0 10 20P
ero
xid
e v
alu
e (
mg
/kg
)
Weeks
Neat 100 ppm
200 ppm 500 ppm
1000 ppm 2000 ppm
3000 ppm 5000 ppm
0.3
0.8
1.3
1.8
2.3
2.8
0 5 10 15 20 25
Acid
valu
e (
mg
KO
H/g
)
Weeks
Neat 100 ppm200 ppm 500 ppm1000 ppm 2000 ppm3000 ppm 5000 ppm
4
6
8
10
12
14
16
0 10 20
Kin
em
ati
c V
isco
sit
y (
mm
²/s)
Weeks
Neat 100 ppm
200 ppm 500 ppm
1000 ppm 2000 ppm
3000 ppm 5000 ppm
5
5.2
5.4
5.6
5.8
6
6.2
6.4
6.6
0 10 20
Pe
rox
ide
Va
lue (
mg
/Kg
)
Weeks
Neat 100 ppm
200 ppm 500 ppm
1000 ppm 2000 ppm
3000 ppm 5000 ppm
0.3
0.8
1.3
1.8
0 10 20
Ac
id V
alu
e (
mg
KO
H/g
)
Weeks
Neat 100 ppm
200 ppm 500 ppm
1000 ppm 2000 ppm
3000 ppm 5000 ppm

197
The acid value (AV) of biodiesel samples also increased with increasing storage
time as a result of hydrolysis of fatty acids methyl esters (FAME) to fatty acids (FA). The
specified limit of acid value of biodiesel is 0.5 mg KOH/g measured over a period of 25
weeks and stored under different atmospheric conditions. The acid value of JBD and
PBD initially was 0.38 mg KOH/g. When the biodiesel was left by itself for a time period
of 25 weeks stored in different atmospheric conditions, the acid value rose up to 6 mg
KOH/g, which is very high.
The peroxide value (PV) of the biodiesel samples also increased on storage as a
result of oxidation of fatty acids methyl esters to fatty acids. The specified limits of PV of
biodiesel is 3 to 6 mg/kg. When the biodiesel was left by itself for a time period of
25 weeks stored in different atmospheric conditions, the peroxide value increased up to
9.3 and 6.7 mg/kg for PBD and JBD respectively. The introduction of naturally occurring
antioxidants reduced the rate of peroxidation which is also clearly shown in Figure 5.4.
The employment of commercially available antioxidants to retard the oxidation
process during storage is already discussed in chapter IV. This chapter discusses the
effect of naturally occurring antioxidants isolated from six different plants, on JBD and
PBD. Results clearly indicate that natural antioxidants definitely improve the storage
stability. Antioxidant activity of each of the 12 isolated compounds are discussed below.
3.2.1. Natural Antioxidants from Murraya koenigii (L.) Spreng as additives
for Biodiesel stabilization
Murraya koenigii (L.) Spreng plant was identified and authenticated by Botanical
Survey of India and the herbarium is stored in Bharathiyar University. Extraction,
isolation and characterization details of the Murraya koenigii (L.) Spreng extract are
given in chapter II. Four compounds were isolated from Murraya koenigii (L.) Spreng
namely, carvone, phellendrene, cymene and caryophyllene.

198
3.2.1.1. ASTM (D-4625 at 30 °°°°C): (Kinematic Viscosity)
Figure. 5.5: Kinematic viscosity studies of PBD containing antioxidants isolated from
Murraya koenigii (L.) Spreng ; (a) storage condition, (b) antioxidants, and
(c) quantity of antioxidants (Caryophyllene).
Figure.5.6: Kinematic viscosity studies of JBD containing antioxidants isolated from
Murraya koenigii (L.) Spreng; (a) storage condition, (b) antioxidants, and
(c) quantity of antioxidants (Caryophyllene).
The kinematic viscosity of PBD and JBD is shown in Figure 5.5 and 5.6. The best
atmospheric condition was found to be AGCSN. The KV value of PBD after the addition of
1000 ppm antioxidant is 6.3 mm2/s and 4.76 mm
2/s after the addition of 5000 ppm in AGCSN.
This was measured over a period of 25 weeks. These values come well under the standard
value of FAME. Comparision between commercially available antioxidants and naturally
occuring antioxidants shows that Murraya koenigii (L.) Spreng antioxidants had better activity.
Caryophyllene isolated from Murraya koenigii (L.) Spreng showed the best activity as
compared to pyrogallol (commercially antioxidant). The KV value of PBD was found to be
4.9 mm2/s after 25 weeks when caryophyllene was used at a concentration of 5000 ppm.
a b
c
a b c

199
The KV value of JBD after the addition of 1000 ppm caryophyllene was 5.5 mm2/s
and 4.52 mm2/s after the addition of 5000 ppm in AGCSN. This was measured over period of
25 weeks. These values come well under the standard value of FAME. Comparision between
commercially available antioxidants and naturally occuring antioxidants shows that
antioxidants isolated from Murraya koenigii (L.) Spreng had better activity. Caryophyllene
showed the best activity as compared to pyrogallol. The KV value of JBD was found to be
4.5 mm2/s after 25 weeks when caryophyllene was used at a concentration of 5000 ppm.
3.2.1.2. ASTM (D-4625 at 30 °°°°C): (Peroxide Value)
Figure. 5.7: Peroxide values of PBD containing antioxidants isolated from Murraya koenigii (L.)
Spreng; (a) storage condition, (b) antioxidants, and (c) quantity of antioxidants
(Caryophyllene).
Figure. 5.8: Peroxide values of JBD containing antioxidants isolated from Murraya koenigii
(L.) Spreng; (a) storage condition, (b) antioxidants, and (c) quantity of
antioxidants (Cymene).
a b c
b c
a

200
The peroxide value determined by ASTM D-4625 method for PBD and JBD is
shown in Figure 5.7 and 5.8. The AGCSN method of storage was better than the other
five methods and henceforth used for this evaluation. The PV of PBD after the addition
of 1000 ppm antioxidant was 6.4 mg/kg and 6.1 mg/kg after addition of 5000 ppm
caryophyllene in AGCSN. This was measured over a period of 25 weeks. These values
come under the standard value of FAME. Comparision between commercially available
antioxidants and naturally occuring antioxidants shows that caryophyllene had better
activity even when compared with pyrogallol (commercially antioxidant). The PV of
PBD was found to be 6.1 mg/kg after 25 weeks when caryophyllene was used at a
concentration of 1000 ppm.
The PV of JBD after the addition of 1000 ppm cymene is 5.45 mg/kg and
5.23 mg/kg after addition of 5000 ppm in AGCSN. This was measured over period of
25 weeks. These values come well under the standard value of FAME. Comparision
between commercially available antioxidants and naturally occuring antioxidants shows
that cymene had better activity even when compared with pyrogallol (commercially
antioxidant). The PV of JBD was found to be 5.21 mg/kg after 25 weeks when
caryophyllene was used at a concentration of 1000 ppm.
3.2.1.3. ASTM (D-4625 at 30 °°°°C): (Acid Value)
Figure. 5.9: Acid value of PBD containing antioxidants isolated from Murraya koenigii (L.)
Spreng.; (a) storage condition, (b) antioxidants, and (c) quantity of
antioxidants (Caryophyllene).
a b c

201
Figure. 5.10: Acid value of JBD containing antioxidants isolated from Murraya koenigii
(L.) Spreng.; (a) storage condition, (b) antioxidants, and (c) quantity of
antioxidants (Cymene).
The acid value determined by ASTM D 4625 method for PBD and JBD is shown
in Figure 5.9 and 5.10. The AGCSN method of storage is better than the other five
methods and henceforth used for this evaluation. The AV of PBD after the addition of
1000 ppm caryophyllene is 0.58 mg KOH/g and 0.42 mg KOH/g after addition of 5000 ppm
antioxidants in AGCSN. This was measured over a period of 25 weeks. These values
come well under the standard value of FAME. Comparision with commercially available
antioxidants revealed that caryophyllene had good antioxidant activity, better than
pyrogallol. The AV of PBD was found to be 0.58 mg KOH/g after 25 weeks when
caryophyllene was used at a concentration of 1000 ppm.
The AV of JBD after the addition of 1000 ppm cymene is 0.58 mg KOH/g and
0.4 mg KOH/g after addition of 5000 ppm in AGCSN. This was measured over period of
25 weeks. These values come well under the standard value of FAME. Comparision with
commercially available antioxidants shows that cymene has better activity compared to
pyrogallol. The AV of JBD was found to be 0.4 mg KOH/g after 25 weeks when cymene
was used at a concentration of 5000 ppm.
3.2.2. Natural Antioxidants from Coriandrum sativum L. as additives for Biodiesel
stabilization
Coriandrum sativum L plant was identified and authenticated by Botanical Survey
of India and the herbarium was stored in Bharathiyar University. Extraction, isolation and
a b c

202
characterization details of the Coriandrum sativum L. extract are given in chapter II. Four
compounds were isolated from Coriandrum sativum L. namely arbutin, phellendrene,
rutin and cymene.
3.2.2.1. ASTM (D-4625 at 30 °°°°C): (Kinematic Viscosity)
Figure. 5.11: Kinematic viscosity of PBD containing antioxidants isolated from
Coriandrum sativum L.; (a) storage condition, (b) antioxidants, and
(c) quantity of antioxidants (Arbutin).
Figure. 5.12: Kinematic viscosity of JBD containing antioxidants isolated from
Coriandrum sativum L.; (a) storage condition, (b) antioxidants, and
(c) quantity of antioxidants (Arbutin).
The kinematic viscosities of PBD and JBD are shown in Figure 5.11 and 5.12.
The best atmospheric condition, AGCSN, was used. The KV value of PBD after the
addition of 1000 ppm antioxidant was 6.1 mm2/s and 5.8 mm
2/s after addition of 5000 ppm
arbutin. This was measured over a period of 25 weeks. These values come under the
standard value of FAME. Comparision with commercially available antioxidants shows
c b a
a b c

203
that arbutin had better activity as compared to pyrogallol. The KV value of PBD was found
to be 5.8 mm2/s after 25 weeks when arbutin was used at a concentration of 5000 ppm.
The KV value of JBD after the addition of 1000 ppm antioxidant is 5.1 mm2/s
and 4.7 mm2/s after addition of 5000 ppm rutin. This was measured over a period of
25 weeks. These values come well under the standard value of FAME. Comparision with
commercially available antioxidants shows that rutin has better activity as compared to
pyrogallol. The KV value of JBD was found to be 4.7 mm2/s after 25 weeks when rutin
was used at a concentration of 5000 ppm.
3.2.2.2. ASTM (D-4625 at 30 °°°°C): (Peroxide Value)
Figure. 5.13: Peroxide value of PBD containing antioxidants isolated from Coriandrum
sativum L.; (a) storage condition, (b) antioxidants, and (c) quantity of
antioxidants (Arbutin).
Figure. 5.14: Peroxide value of JBD containing antioxidants isolated from Coriandrum
sativum L.; (a) storage condition, (b) antioxidants, and (c) quantity of
antioxidants (Arbutin).
a b c
a b c

204
The peroxide value determined by ASTM D-4625 method for PBD and JBD is
shown in Figure 5.13 and 5.14. Since the AGCSN method of storage was better than the
other five methods, it was henceforth used for peroxide value evaluation. The PV of PBD
after the addition of 1000 ppm antioxidant is 6.18 mg/kg and 6.1 mg/kg after addition of
5000 ppm arbutin in AGCSN. This was measured over a period of 25 weeks. These
values come under the standard value of FAME. Comparision with commercially
available antioxidants shows that arbutin has better activity as compared to pyrogallol.
The PV of PBD was found to be 6.1 mg/kg after 25 weeks when arbutin was used at a
concentration of 5000 ppm.
The PV of JBD after the addition of 1000 ppm arbutin is 5.28 mg/kg and
5.21 mg/kg after addition of 5000 ppm antioxidants in AGCSN. This was measured over
a period of 25 weeks. These values come well under the standard value of FAME.
Comparision between commercially available antioxidants shows that arbutin has better
activity as compared to pyrogallol. The PV of JBD was found to be 5.21 mg/kg after
25 weeks when arbutin was used at a concentration of 5000 ppm.
3.2.2.3. ASTM (D-4625 at 30 °°°°C): (Acid Value)
Figure. 5.15: Acid value of PBD containing antioxidants isolated from Coriandrum
sativum L.; (a) storage condition, (b) antioxidants, and (c) quantity of
antioxidants (Arbutin).
b c
a

205
Figure. 5.16: Acid value of JBD containing antioxidants isolated from Coriandrum sativum L.;
(a) storage condition, (b) antioxidants, and (c) quantity of antioxidants (Arbutin).
The acid values determined by ASTM D-4625 method for PBD and JBD are
shown in Figure 5.15 and 5.16. Sicne the AGCSN method of storage was the best among those
tested it was used for this evaluation. The AV of PBD after the addition of 1000 ppm
antioxidant is 0.49 mg KOH/g and 0.39 mg KOH/g after addition of 5000 ppm arbutin.
This was measured over period of 25 weeks. These values come well under the standard
value of FAME. Comparision between commercially available antioxidants shows that
arbutin has better activity as compared to pyrogallol. The AV of PBD was found to be
0.39 mg KOH/g after 25 weeks when arbutin was used at a concentration of 5000 ppm.
The AV of JBD after the addition of 1000 ppm arbutin is 0.43 mg KOH/g and
0.39 mg KOH/g after addition of 5000 ppm arbutin. This was measured over period of
25 weeks. These values come well under the standard value of FAME. Comparision
between commercially available antioxidants shows that arbutin has better activity as
compared to pyrogallol. The AV of JBD was found to be 0.39 mg KOH/g after 25 weeks
when arbutin was used at a concentration of 5000 ppm.
3.2.3. Natural Antioxidants from Mentha arvensis L. as additives for Biodiesel stabilization
Mentha arvensis L. plant was identified and authenticated by Botanical Survey of India
and the herbarium was stored in Bharathiyar University. Extraction, isolation and
characterization details of the Mentha arvensis L. extract are given in chapter II. Four
compounds were isolated from Mentha arvensis L. namely Carvone, phellendrene, cymene,
menthol.
c a b

206
3.2.3.1. ASTM (D-4625 at 30 °°°°C): (Kinematic Viscosity)
Figure.5.17: Kinematic viscosity of JBD containing antioxidants isolated from Mentha
arvensis L.; (a) storage condition, (b) antioxidants, and (c) quantity of
antioxidants (Pyrogallol).
Figure.5.18: Kinematic viscosity of PBD containing antioxidants isolated from Mentha
arvensis L.; (a) storage condition, (b) antioxidants, and (c) quantity of
antioxidants (TBHQ).
The Kinematic viscosity of PBD and JBD are shown in Figure 5.17 and 5.18.
The best atmospheric condition, AGCSN, was used . The KV value of PBD after the
addition of 1000 ppm antioxidant is 6.23mm2/s and 5.1 mm2/s after addition of 5000
ppm menthol. This was measured over period of 25 weeks. These values come under the
standard value of FAME. Comparision with commercially available antioxidants shows
that menthol had better activity as compared to pyrogallol. The KV value of PBD was
found 5.1 mm2/s after 25 weeks when menthol was used at a concentration of 5000 ppm.
c a b
a b c

207
The KV value of JBD after the addition of 1000 ppm menthol was 5.5 mm2/s and
4.5 mm2/s after the addition of 5000 ppm in AGCSN. This was measured over period of
25 weeks. These values come well under the standard value of FAME. Comparision
between commercially available antioxidants and naturally occuring antioxidants shows
that antioxidants isolated from Mentha arvensis L. had better activity. Menthol showed
the best activity as compared to pyrogallol. The KV value of JBD was found to be 4.5
mm2/s after 25 weeks when menthol was used at a concentration of 5000 ppm.
3.2.3.2. ASTM (D-4625 at 30 °°°°C): (Peroxide Value)
Figure.5.19: Peroxide value of PBD containing antioxidants isolated from Mentha arvensis L.;
(a) storage condition, (b) antioxidants, and (c) quantity of antioxidants (pyrogallol).
Figure.5.20: Peroxide value of JBD containing antioxidants isolated from Mentha arvensis L.;
(a) storage condition, (b) antioxidants, and (c) quantity of antioxidants
(Menthol).
a b c
a b c

208
The peroxide value determined by ASTM D-4625 method for PBD and JBD is
shown in Figure 5.19 and 5.20. Since the AGCSN method of storage was better than the
other five methods, it was henceforth used for peroxide value evaluation. The PV of PBD
after the addition of 1000 ppm antioxidant is 6.5 mg/kg and 6.3 mg/kg after addition of
5000 ppm menthol in AGCSN. This was measured over a period of 25 weeks. These
values come under the standard value of FAME. Comparision with commercially
available antioxidants shows that menthol has better activity as compared to commercial
antioxidants. The PV of PBD was found to be 6.3 mg/kg after 25 weeks when menthol
was used at a concentration of 5000 ppm.
The PV of JBD after the addition of 1000 ppm menthol is 5.8 mg/kg and
5.28 mg/kg after addition of 5000 ppm antioxidants in AGCSN. This was measured over
a period of 25 weeks. These values come well under the standard value of FAME.
Comparision between commercially available antioxidants shows that menthol has better
activity as compared to pyrogallol. The PV of JBD was found to be 5.28 mg/kg after 25
weeks when menthol was used at a concentration of 5000 ppm.
3.2.3.2. ASTM (D-4625 at 30 °°°°C): (Acid Value)
Figure.5.21: Acid value of PBD containing antioxidants isolated from Mentha arvensis L.;
(a) storage condition, (b) antioxidants, and (c) quantity of antioxidants
(Menthol).
a b c

209
Figure.5.22: Acid value of JBD containing antioxidants isolated from Mentha arvensis L.;
(a) storage condition, (b) antioxidants, and (c) quantity of antioxidants
(Menthol).
The acid values determined by ASTM D-4625 method for PBD and JBD are shown in
Figure 5.21 and 5.22. Sicne the AGCSN method of storage was the best among those tested it
was used for this evaluation. The AV of PBD after the addition of 1000 ppm antioxidant is
0.51 mg KOH/g and 0.41 mg KOH/g after addition of 5000 ppm menthol. This was measured
over period of 25 weeks. These values come well under the standard value of FAME.
Comparision between commercially available antioxidants shows that menthol has better
activity as compared to commercial antioxidants. The AV of PBD was found to be 0.41 mg
KOH/g after 25 weeks when menthol was used at a concentration of 5000 ppm.
The AV of JBD after the addition of 1000 ppm menthol is 0.51 mg KOH/g and
0.41 mg KOH/g after addition of 5000 ppm menthol. This was measured over period of
25 weeks. These values come well under the standard value of FAME. Comparision
between commercially available antioxidants shows that menthol has better activity as
compared to pyrogallol. The AV of JBD was found to be 0.41 mg KOH/g after 25 weeks
when menthol was used at a concentration of 5000 ppm.
3.2.4. Natural Antioxidants from Curcuma lunga as additives for Biodiesel stabilization
Curcuma lunga plant was identified and authenticated by Botanical Survey of
India and the herbarium was stored in Bharathiyar University. Extraction, isolation and
characterization details of the Curcuma lunga extract are given in chapter II. One
compound was isolated from Curcuma lunga namely curcumin.
c b a
210
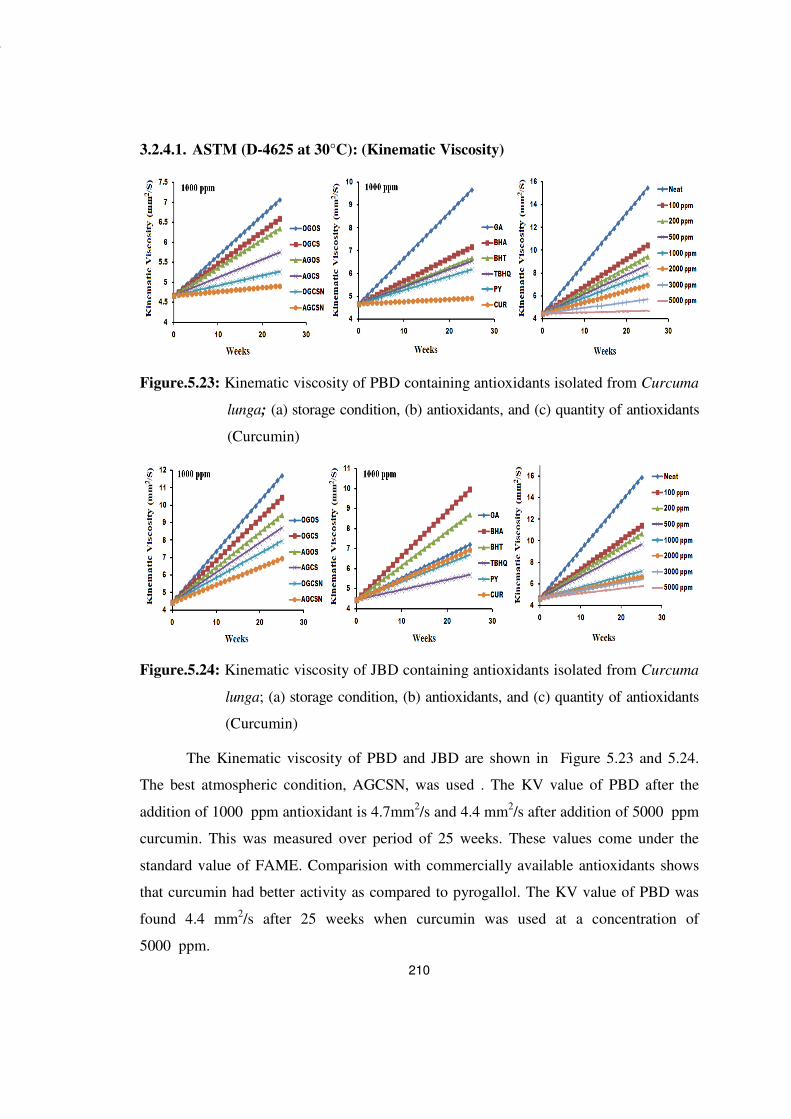
3.2.4.1. ASTM (D-4625 at 30°C): (Kinematic Viscosity)
Figure.5.23: Kinematic viscosity of PBD containing antioxidants isolated from Curcuma
lunga; (a) storage condition, (b) antioxidants, and (c) quantity of antioxidants
(Curcumin)
Figure.5.24: Kinematic viscosity of JBD containing antioxidants isolated from Curcuma
lunga; (a) storage condition, (b) antioxidants, and (c) quantity of antioxidants
(Curcumin)
The Kinematic viscosity of PBD and JBD are shown in Figure 5.23 and 5.24.
The best atmospheric condition, AGCSN, was used . The KV value of PBD after the
addition of 1000 ppm antioxidant is 4.7mm2/s and 4.4 mm
2/s after addition of 5000 ppm
curcumin. This was measured over period of 25 weeks. These values come under the
standard value of FAME. Comparision with commercially available antioxidants shows
that curcumin had better activity as compared to pyrogallol. The KV value of PBD was
found 4.4 mm2/s after 25 weeks when curcumin was used at a concentration of
5000 ppm.
c b a
a b c

211
The KV value of JBD after the addition of 1000 ppm curcumin was 6.1 mm2/s
and 5.7 mm2/s after the addition of 5000 ppm in AGCSN. This was measured over
period of 25 weeks. These values come well under the standard value of FAME.
Comparision between commercially available antioxidants and naturally occuring
antioxidants shows that antioxidants isolated from Curcuma lunga had better activity.
curcumin showed the best activity as compared to commercial antioxidants. The KV
value of JBD was found to be 5.7 mm2/s after 25 weeks when menthol was used at a
concentration of 5000 ppm.
ASTM (D-4625 at 30 °°°°C): (Peroxide Value)
Figure.5.25: Peroxide Value of PBD containing antioxidants isolated from Curcuma
lunga; (a) storage condition, (b) antioxidants, and (c) quantity of antioxidants
(Curcumin)
Figure.5.26: Peroxide value of JBD containing antioxidants isolated from Curcuma
lunga; (a) storage condition, (b) antioxidants, and (c) quantity of antioxidants
(Curcumin)
a b c
a b c

212
The peroxide value determined by ASTM D-4625 method for PBD and JBD is
shown in Figure 5.25 and 5.26. Since the AGCSN method of storage was better than the
other five methods, it was henceforth used for peroxide value evaluation. The PV of PBD
after the addition of 1000 ppm antioxidant is 6.19 mg/kg and 6.1 mg/kg after addition of
5000 ppm menthol in AGCSN. This was measured over a period of 25 weeks. These
values come under the standard value of FAME. Comparision with commercially
available antioxidants shows that curcumin has better activity as compared to pyrogallal.
The PV of PBD was found to be 6.1 mg/kg after 25 weeks when curcumin was used at a
concentration of 5000 ppm.
The PV of JBD after the addition of 1000 ppm curcumin is 5.3 mg/kg and
5.28 mg/kg after addition of 5000 ppm antioxidants in AGCSN. This was measured over
a period of 25 weeks. These values come well under the standard value of FAME.
Comparision between commercially available antioxidants shows that curcumin has better
activity as compared to pyrogallol. The PV of JBD was found to be 5.28 mg/kg after 25 weeks
when curcumin was used at a concentration of 5000 ppm.
3.2.4.2. ASTM (D-4625 at 30 °°°°C): (Acid Value)
Figure.5.27: Acid Value of PBD containing antioxidants isolated from Curcuma lunga;
(a) storage condition, (b) antioxidants, and (c) quantity of antioxidants
(Curcumin)
c a b

213
Figure. 5.28: Acid value of JBD containing antioxidants isolated from Curcuma lunga; (a)
storage condition, (b) antioxidants, and (c) quantity of antioxidants (Curcumin)
The acid values determined by ASTM D-4625 method for PBD and JBD are shown in
Figure 5.27 and 5.28. Sicne the AGCSN method of storage was the best among those tested it
was used for this evaluation. The AV of PBD after the addition of 1000 ppm antioxidant is
0.51 mg KOH/g and 0.39 mg KOH/g after addition of 5000 ppm curcumin. This was
measured over period of 25 weeks. These values come well under the standard value of FAME.
Comparision between commercially available antioxidants shows that curcumin has better
activity as compared to commercial antioxidants. The AV of PBD was found to be 0.39 mg
KOH/g after 25 weeks when curcumin was used at a concentration of 5000 ppm.
The AV of JBD after the addition of 1000 ppm curcumin is 0.44 mg KOH/g and
0.41 mg KOH/g after addition of 5000 ppm curcumin. This was measured over period of
25 weeks. These values come well under the standard value of FAME. Comparision
between commercially available antioxidants shows that curcumin has better activity as
compared to pyrogallol. The AV of JBD was found to be 0.41 mg KOH/g after 25 weeks
when curcumin was used at a concentration of 5000 ppm.
3.2.5. Natural Antioxidants from Citrullus colocynthis as additives for Biodiesel
stabilization
Citrullus colocynthis plant was identified and authenticated by Botanical Survey
of India and the herbarium was stored in Bharathiyar University. Extraction, isolation and
characterization details of the Citrullus colocynthis extract are given in chapter II. One
compound was isolated from Citrullus colocynthis namely cucurbitacin I.
a b c

214
3.2.5.1. ASTM (D-4625 at 30 °°°°C): (Kinematic Viscosity)
Figure. 5.29: Kinematic viscosity of PBD containing antioxidants isolated from Citrullus
colocynthis; (a) storage condition, (b) antioxidants, and (c) quantity of
antioxidants (Rutin)
Figure.5.30: Kinematic viscosity of JBD containing antioxidants isolated from Citrullus
colocynthis; (a) storage condition, (b) antioxidants, and (c) quantity of
antioxidants (Cucurbitacin I)
The Kinematic viscosity of PBD and JBD are shown in Figure 5.29 and 5.30.
The best atmospheric condition, AGCSN, was used . The KV value of PBD after the
addition of 1000 ppm antioxidant is 5.7mm2/s and 5.1 mm
2/s after addition of 5000 ppm
rutin. This was measured over period of 25 weeks. These values come under the standard
value of FAME. Comparision with commercially available antioxidants shows that rutin
had better activity as compared to pyrogallol. The KV value of PBD was found
5.1 mm2/s after 25 weeks when rutin was used at a concentration of 5000 ppm.
a b c
a b c

215
The KV value of JBD after the addition of 1000 ppm cucurbitacin I was
4.4 mm2/s and 4.1 mm
2/s after the addition of 5000 ppm in AGCSN. This was measured
over period of 25 weeks. These values come well under the standard value of FAME.
Comparision between commercially available antioxidants and naturally occuring
antioxidants shows that antioxidants isolated from Citrullus colocynthis had better
activity. Cucurbitacin I showed the best activity as compared to commercial antioxidants.
The KV value of JBD was found to be 4.1 mm2/s after 25 weeks when cucurbitacin I was
used at a concentration of 5000 ppm.
3.2.5.2. ASTM (D-4625 at 30 °°°°C): (Peroxide Value)
Figure. 5.31: Peroxide value of PBD containing antioxidants isolated from Citrullus
colocynthis; ; (a) storage condition, (b) antioxidants, and (c) quantity of
antioxidants (Cucurbitacin I)
Figure.5.32: Peroxide value of JBD containing antioxidants isolated from Citrullus
colocynthis; (a) storage condition, (b) antioxidants, and (c) quantity of
antioxidants (Rutin)
a b c
a b c

216
The peroxide value determined by ASTM D-4625 method for PBD and JBD is
shown in Figure 5.31 and 5.32. Since the AGCSN method of storage was better than the
other five methods, it was henceforth used for peroxide value evaluation. The PV of PBD
after the addition of 1000 ppm antioxidant is 6.28 mg/kg and 6.2 mg/kg after addition of
5000 ppm cucurbitacin I in AGCSN. This was measured over a period of 25 weeks.
These values come under the standard value of FAME. Comparision with commercially
available antioxidants shows that cucurbitacin I has better activity as compared to
pyrogallal. The PV of PBD was found to be 6.2 mg/kg after 25 weeks when cucurbitacin
I was used at a concentration of 5000 ppm.
The PV of JBD after the addition of 1000 ppm rutin is 5.4 mg/kg and 5.21 mg/kg
after addition of 5000 ppm antioxidants in AGCSN. This was measured over a period of
25 weeks. These values come well under the standard value of FAME. Comparision
between commercially available antioxidants shows that rutin has better activity as
compared to pyrogallol. The PV of JBD was found to be 5.21 mg/kg after 25 weeks when
rutin was used at a concentration of 5000 ppm.
3.2.5.3. ASTM (D-4625 at 30 °°°°C): (Acid Value)
The acid values determined by ASTM D-4625 method for PBD and JBD are
shown in Figure 5.33 and 5.34. Sicne the AGCSN method of storage was the best among
those tested it was used for this evaluation. The AV of PBD after the addition of
1000 ppm antioxidant is 0.45 mg KOH/g and 0.4 mg KOH/g after addition of 5000 ppm
rutin. This was measured over period of 25 weeks. These values come well under the standard
value of FAME. Comparision between commercially available antioxidants shows that rutin
has better activity as compared to commercial antioxidants. The AV of PBD was found to be
0.4 mg KOH/g after 25 weeks when rutin was used at a concentration of 5000 ppm.

217
Figure. 5.33: Acid value of PBD containing antioxidants isolated from Citrullus colocynthis;
(a) storage condition, (b) antioxidants, and (c) quantity of antioxidants (Rutin)
Figure. 5.34: Acid value of JBD containing antioxidants isolated from Citrullus
colocynthis; (a) storage condition, (b) antioxidants, and (c) quantity of
antioxidants (Rutin)
The AV of JBD after the addition of 1000 ppm rutin is 0.41 mg KOH/g and
0.39 mg KOH/g after addition of 5000 ppm rutin. This was measured over period of
25 weeks. These values come well under the standard value of FAME. Comparision
between commercially available antioxidants shows that rutin has better activity as
compared to pyrogallol. The AV of JBD was found to be 0.39 mg KOH/g after 25 weeks
when rutin was used at a concentration of 5000 ppm.
3.2.6. Natural Antioxidants from Eichhornia crasipus as additives for Biodiesel
stabilization
Eichhornia crasipus plant was identified and authenticated by Botanical Survey
of India and the herbarium was stored in Bharathiyar University. Extraction, isolation and
a b c
a b c

218
characterization details of the Eichhornia crasipus extract are given in chapter II. Three
compounds were isolated from Eichhornia crasipus namely coumarin, quercetin
dihydrate, tannic acid.
3.2.6.1. ASTM (D-4625 at 30 °°°°C): (Kinematic Viscosity)
Figure. 5.35: Kinematic viscosity of PBD containing antioxidants isolated from
Eichhornia crasipus; (a) storage condition, (b) antioxidants, and (c) quantity
of antioxidants (Tannic acid)
Figure.5.36: Kinematic viscosity of JBD containing antioxidants isolated from Eichhornia
crasipus; (a) storage condition, (b) antioxidants, and (c) quantity of antioxidants
(Tannic acid)
The Kinematic viscosity of PBD and JBD are shown in Figure 5.35 and 5.36.
The best atmospheric condition, AGCSN, was used . The KV value of PBD after the
addition of 1000 ppm antioxidant is 5.9 mm2/s and 4.9 mm2/s after addition of 5000 ppm
quercetin. This was measured over period of 25 weeks. These values come under the
standard value of FAME. Comparision with commercially available antioxidants shows
a b c
a b c

219
that quercetin had better activity as compared to pyrogallol. The KV value of PBD was
found 4.9 mm2/s 5000 ppm in AGCSN. This was measured over period of 25 weeks.
These values come well under the standard value of FAME. Comparision between
commercially available antioxidants and naturally occuring antioxidants shows that
antioxidants isolated from Eichhornia crasipus had better activity. Tannic acid showed the
best activity as compared to commercial antioxidants. The KV value of JBD was found to be
4.8 mm2/s after 25 weeks when Tannic acid was used at a concentration of 5000 ppm.
3.2.6.2. ASTM (D-4625 at 30 °°°°C): (Peroxide Value)
Figure.5.37: Peroxide value of PBD containing antioxidants isolated from Eichhornia
crasipus; (a) storage condition, (b) antioxidants, and (c) quantity of
antioxidants (Tannic acid)
Figure.5.38: Peroxide value of JBD containing antioxidants isolated from Eichhornia crasipus;
(a) storage condition, (b) antioxidants, and (c) quantity of antioxidants
(qurcetin).
a b c
a b c

220
The peroxide value determined by ASTM D-4625 method for PBD and JBD is
shown in Figure 5.37 and 5.38. Since the AGCSN method of storage was better than the
other five methods, it was henceforth used for peroxide value evaluation. The PV of PBD
after the addition of 1000 ppm antioxidant is 6.3 mg/kg and 6.1 mg/kg after addition of
5000 ppm quercetin in AGCSN. This was measured over a period of 25 weeks. These
values come under the standard value of FAME. Comparision with commercially
available antioxidants shows that quercetin has better activity as compared to pyrogallal.
The PV of PBD was found to be 5.38 mg/kg after 25 weeks when quercetin was used at a
concentration of 5000 ppm.
The PV of JBD after the addition of 1000 ppm quercetin is 5.3 mg/kg and 5.28 mg/kg
after addition of 5000 ppm antioxidants in AGCSN. This was measured over a period of
25 weeks. These values come well under the standard value of FAME. Comparision
between commercially available antioxidants shows that quercetin has better activity as
compared to pyrogallol. The PV of JBD was found to be 5.28 mg/kg after 25 weeks when
quercetin was used at a concentration of 5000 ppm.
3.2.6.3. ASTM (D-4625 at 30 °°°°C): (Acid Value)
The acid values determined by ASTM D-4625 method for PBD and JBD are
shown in Figure 5.39 and 5.40. Since the AGCSN method of storage was the best among
those tested it was used for this evaluation. The AV of PBD after the addition of
1000 ppm antioxidant is 0.51 mg KOH/g and 0.44 mg KOH/g after addition of 5000 ppm
quercetin. This was measured over period of 25 weeks. These values come well under the
standard value of FAME. Comparision between commercially available antioxidants
shows that quercetin has better activity as compared to commercial antioxidants. The AV
of PBD was found to be 0.44 mg KOH/g after 25 weeks when quercetin was used at a
concentration of 5000 ppm.

221
Figure. 5.39: Acid value of PBD containing antioxidants isolated from Eichhornia
crasipus; (a) storage condition, (b) antioxidants, and (c) quantity of
antioxidants (Tannic acid)
Figure.5.40: Acid value of JBD containing antioxidants isolated from Eichhornia
crasipus; (a) storage condition, (b) antioxidants, and (c) quantity of
antioxidants (Tannic acid)
The AV of JBD after the addition of 1000 ppm tannic acid is 0.56 mg KOH/g and
0.41 mg KOH/g after addition of 5000 ppm tannic acid. This was measured over period
of 25 weeks. These values come well under the standard value of FAME. Comparision
between commercially available antioxidants shows that tannic acid has better activity as
compared to pyrogallol. The AV of JBD was found to be 0.41 mg KOH/g after 25 weeks
when tannic acid was used at a concentration of 5000 ppm.
a b c
a b c
222
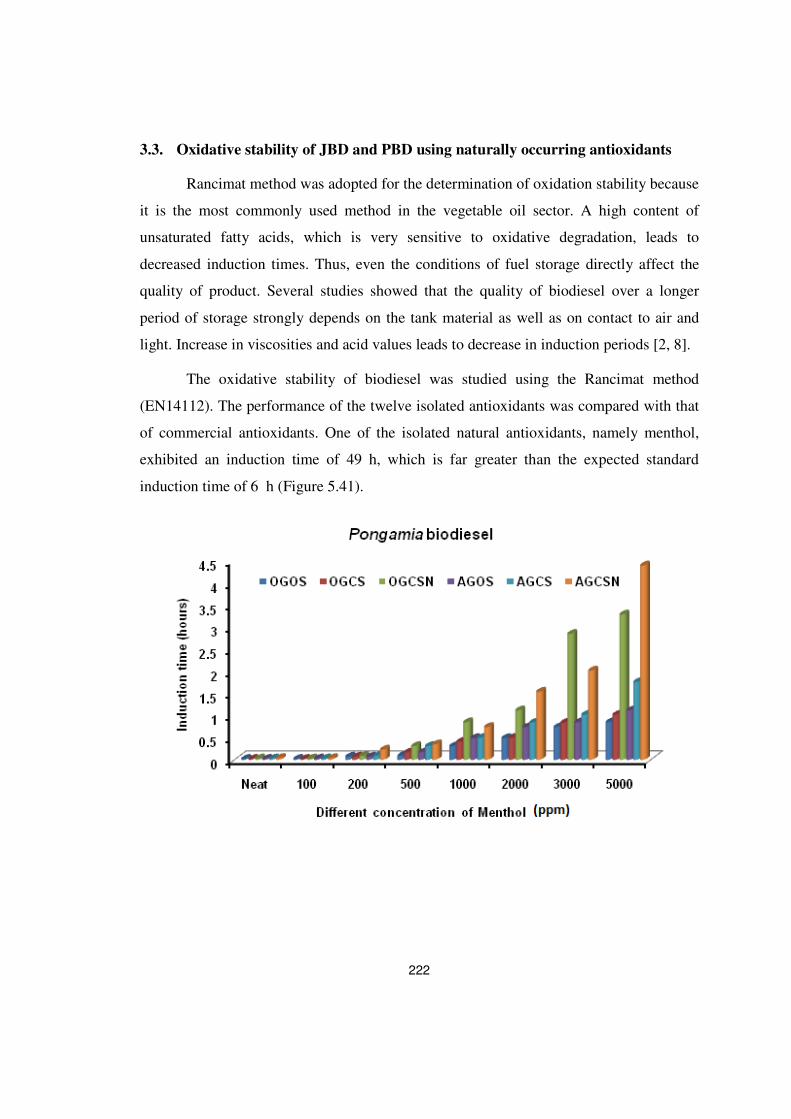
3.3. Oxidative stability of JBD and PBD using naturally occurring antioxidants
Rancimat method was adopted for the determination of oxidation stability because
it is the most commonly used method in the vegetable oil sector. A high content of
unsaturated fatty acids, which is very sensitive to oxidative degradation, leads to
decreased induction times. Thus, even the conditions of fuel storage directly affect the
quality of product. Several studies showed that the quality of biodiesel over a longer
period of storage strongly depends on the tank material as well as on contact to air and
light. Increase in viscosities and acid values leads to decrease in induction periods [2, 8].
The oxidative stability of biodiesel was studied using the Rancimat method
(EN14112). The performance of the twelve isolated antioxidants was compared with that
of commercial antioxidants. One of the isolated natural antioxidants, namely menthol,
exhibited an induction time of 49 h, which is far greater than the expected standard
induction time of 6 h (Figure 5.41).

223
Figure.5.41: Oxidative stability studies on Menthol at PBD and JBD.
The Rancimat test is the specified standard method for oxidative stability for
biodiesel in accordance with EN 14112 [24]. The absolute difference between two
independent single test results did not exceed the repeatability limit of the EN 14112
method. The IP for 100% biodiesel (B100) specified in ASTM D6751-05 was not less
than 3 h [25]. The induction period of Pongamia biodiesel without addition of antioxidant
was 0.33 h. Antioxidative capabilities of phenolic antioxidants is dependent on the
number of phenolic group occupying 1, 2 or 1, 4 positions in the aromatic ring, as well as
to the volume and electronic characteristics of the ring substituent present. Generally, the
active hydroxyl group can provide protons that inhibit the formation of free radicals or
interrupt the propagation of free radical and thus delay the rate of oxidation [18].

224

225

226

227
Figure.5.42: Oxidative stability studies on PBD and JBD using naturally occurring
antioxidants.

228
Results of oxidative studies of Pongamia and Jatropha biodiesel using naturally
occurring antioxidants are presented in the above Figure. Experiments were carried out at
different storage conditions. The storage conditions employed were: 1) ordinary glass
bottle with open space (OGOS), 2) ordinary glass bottle with closed space (OGCS),
3) ordinary glass bottle with closed space containing nitrogen (OGCSN), 4) amber glass
bottle with open space (AGOS), 5) amber glass bottle with closed space (AGCS) and
6) amber glass with closed space containing nitrogen (AGCSN). The oxidative stability
of biodiesel was studied by the Rancimat method as per EN14112 methodology using the
naturally occurring antioxidants. The commercially available antioxidant activity for JBD
and PBD is already discussed in chapter IV. The twelve isolated compounds were studied
in this chapter. Menthol from mint leaves exhibited excellent antioxidant activity with
induction time increasing from 0.05 h to 12 h, at 1000 ppm. Menthol exhibited an
induction time of 49 h at 5000 ppm in JBD, which is far greater than the expected
standard induction time of 6 h. A concentration of 1000 ppm for most of the natural
antioxidants had a beneficial effect on the storage stability of biodiesel. The induction
time of PBD when menthol was added at a concentration of 5000 ppm was 4.5 h after a
storage time 25 weeks. PBD exhibited an induction time of 5.86 h when Tannic acid
was added to it at a concentration of 1000 ppm. and 13.86 h at 5000 ppm. The induction
time of JBD was 7.26 h when tannic acid was added to it at a concentration of 1000 ppm in
and 22.36 h at 5000 ppm PBD displayed an induction time of above 7 h when Quercetin
was added to it at a concentration of 1000 ppm and 12.5 h at a concentration of
5000 ppm. The induction time of JBD when Quercetin was added to it was above 8 h at
1000 ppm and 25.35 h at 5000 ppm Cucurbitacin added JBD showed an induction time
of 3.8 h at 1000 ppm and 11 h at 5000 ppm. PBD exhibited an induction time of 8 h at
1000 ppm of curcurbitacin and 19 h at 5000 ppm of curcurbitacin. From Murraya
(curry leaf) we have extracted four compounds. Except Carvone all the other compounds
have good antioxidant activity. PBD gave an induction time of 2.8 h when caryophyllene
was added to it at a concentration of 1000 ppm and 15.21 h at a concentration of 5000
ppm,. Caryophyllene added JBD exhibited an induction time of 6.33 h at 1000 ppm and
32.21 h at 5000 ppm. PBD displayed an induction time of 2.8 h at 1000 ppm of cymene
and 6.38 h at 5000 ppm. Likewise JBD displayed an induction time of 6.1 h at 1000 ppm

229
and 10.12 h at 5000 ppm of cymene. Phellendrene mixed PBD gave an induction time
of 3.4 h at 1000 ppm and 6.2 h at 5000 ppm. When phellendrene was added to JBD 8.2 h at
a concentration of 1000 ppm, the induction time was 8.2 h and 19.8 h at 5000 ppm
concentration of phellendrene. All the other isolated compounds gave less induction time
when mixed with JBD and PBD.
Sl.No. Antioxidants Biodiesel
Without
Antioxidants
Induction time
(h)
Induction Time (h)
1000 ppm 5000 ppm
1 Menthol PBD 0.05 12 49
JBD 0.05 1 4.50
2 Tannic acid PBD 0.05 5.86 13.86
JBD 0.05 7.26 22.36
3 Quercetin PBD 0.05 7.00 12.50
JBD 0.05 8.00 25.35
4 Cucurbitacin I PBD 0.05 8.00 19.00
JBD 0.05 3.80 11.00
5 Caryophyllene PBD 0.05 2.80 15.21
JBD 0.05 6.33 32.21
6 Cymene PBD 0.05 2.80 6.38
JBD 0.05 6.10 10.12
7 Phellendrene PBD 0.05 3.40 6.20
JBD 0.05 8.20 19.80
Table 5.1: Oxidative stability studies on PBD and JBD using naturally occurring
antioxidants.

230
4. Conclusion
The antioxidant scavenging ability of the isolated natural compounds was
evaluated using four different scavenging methods and was compared with the
antioxidant scavenging ability of antioxidants available commercially. From the study it
is clear that the natural antioxidants have greater antioxidant scavenging ability when
compared to the commercially available antioxidants.
Results of storage studies of biodiesel using the twelve isolated antioxidants from
the six plants are given. These are compared with storage studies using commercially
available antioxidants. From the results, it is evident that at a concentration of 1000 ppm,
tannic acid exhibited the highest antioxidant ability.
The oxidative stability of biodiesel was studied using the Rancimat method
(EN14112). The performance of the twelve isolated antioxidants was compared with that
of commercial antioxidants. One of the isolated natural antioxidants, namely menthol,
exhibited an induction time of 49 h, which is far greater than the expected standard
induction time of 6 h.

231
REFERENCES
1. Hawash, S.; Kamal, N.; Zaher, F.; Kenawi, O.; El Diwani, G. Fuel 2009, 88, 579–582.
2. Zaher, F. A. Grasas Y Aceitas 1990, 41, 82–91.
3. McCann, H. G. Photochem. Photobiol. 1978, 29, 879-881.
4. Dunn, R. O. J. Am. Oil Chem. Soc. 2005; 82: 381- 87.
5. Lacoste, F.; Lagardere, L. Eur. J. Lipid Sci. Technol. 2003, 105, 49–15.
6. Schober, S.; Mittelbach, M. Eur. J. Lipid Sci. Technol. 2004, 106, 382–389.
7. Mittelbach, M.; Schober, S. J. Am. Oil Chem. Soc. 2003, 80, 817 –823.
8. Bouaid, A.; Martinez, M.; Aracil, J. Biores. Technol. 2009, 100, 2234–2239.
9. McCormick, R. L.; Westbrook, S. R. Energy Fuels 2010, 24, 690–698.
10. Bondioli, P.; Gasparoli, A.; Bella, L. D.; Tagliabue, S. Eur. J. Lipid Sci. Technol.
2002, 104, 777–784.
11. Mittelbach, M.; Gangl, S. J. Am. Oil Chem. Soc. 2001, 78, 573–577.
12. Bondioli, P.; Gasparoli, A.; Lanzani, A.; Fedeli, E.; Veronese, S.; Sala, M. J. Am.
Oil Chem. Soc. 1995, 72, 699–702.
13. Plessis, L. M. D.; Villiers, J. B. M. D.; Walt, W. H. V. D. J. Am. Oil Chem. Soc.
1985, 62, 748– 752.
14. Dunn, R. J. Am. Oil Chem. Soc. 2002, 79, 915–920.
15. Simkovsky, N. M.; Ecker, A. Erdol, Erdgas Kohle 1999, 115, 317–318.
16. Canakci, M.; Monyem, A.; Gerpen, J. V. Trans ASAE 1999, 42, 1565–1572.
17. Das, L. M.; Bora, D. K.; Pradhan, S.; Naik, M. K.; Naik, S. N. Fuel 2009, 88,
2315–2318.
18. Domingos, A. K.; Saad, E. B.; Vechiatto, W. W. D.; Wilhelm, H. M.; Ramos, L. P.
J. Braz. Chem. Soc. 2007, 18(2), 416–423.
19. Pokarny, J. Eur. J. Lipid sci. Tech. 2007, 109, 629 -642.
20. Amariwucz, R.; Pegg, R. B. Eur. J. Sci. Tech. 2008, 110, 865 – 878.
21. Madsen, H. L.; Bertelsen, G. Trends in Food Sci. Tech. 1995, 6, 271 -277.
22. Nakatani, N.; Inatani, R. Agri. Biol. Chem. 1984, 48, 2081-2085.
23. Kikusaki, H.; Nakatani, N. Agri. Biol. Chem. 1989, 53, 519 -524.
24. Bragagnolo, N.; Mariutti, L. R. B. Braz. J. Food Tech. 2007, 10, 96 -103.

232
25. Robards, K.; Prenzler, P. D.; Tucker, G.; Swatsitang, P. Glover, W. 1999. Food
Chemistry 1999, 66, 401-436.
26. Velioglu, Y. S.; Mazza, G.; Gao, L. Oomah, B. D. J. Agric. Food Chem. 1998,
46: 4113-4117.


![14] Antioxidants](https://img.pdfslide.us/doc/110x75/577ccfa61a28ab9e78904327/14-antioxidants.jpg)